Impact Factor
- Issue 14; 2026
- Issue 13; 2026
- Issue 12; 2026
- Issue 11; 2026
- Issue 10; 2026
- Volume 16; 2026
- Advance Articles
- Past Issues
- Cover Images
- Cover Suggestion
- Index & Coverage
- Special Issues
Introduction
Materials and Methods
Results
Discussion
Abbreviations
Acknowledgements
Supplementary Material
References
International Journal of Biological Sciences
International Journal of Medical Sciences
 Global reach, higher impact

Theranostics 2020; 10(2):910-924. doi:10.7150/thno.35045 This issue Cite
Research Paper
Loss of histone macroH2A1 in hepatocellular carcinoma cells promotes paracrine-mediated chemoresistance and CD4+CD25+FoxP3+ regulatory T cells activation
Oriana Lo Re1,2*, Tommaso Mazza3*, Sebastiano Giallongo1,2, Paola Sanna1, Francesca Rappa4, Tu Vinh Luong5, Giovanni Li Volti6, Adela Drovakova7,8, Tania Roskams9, Matthias Van Haele9, Emmanuel Tsochatzis10, Manlio Vinciguerra1,10 ![]()
1. International Clinical Research Center, St' Anne's University Hospital, Brno, Czech Republic;
2. Department of Biology, Faculty of Medicine, Masaryk University, Brno, Czech Republic;
3. IRCCS Casa Sollievo della Sofferenza, Laboratory of Bioinformatics, San Giovanni Rotondo (FG), Italy;
4. Department of Experimental Biomedicine and Clinical Neurosciences, University of Palermo, Palermo, Italy;
5. Department of Histopathology, Royal Free London NHS Foundation Trust, London, United Kingdom;
6. Department of Biomedical and Biotechnological Sciences, University of Catania, Catania, Italy;
7. Institute of Biophysics, Academy of Sciences of the Czech Republic, Brno, Czech Republic;
8. Department of Animal Physiology and Immunology, Institute of Experimental Biology, Masaryk University, Brno, Czech Republic;
9. Translational Cell & Tissue Research Unit, Department of Imaging & Pathology, Katholieke Universiteit Leuven, Leuven, Belgium;
10. UCL Institute for Liver and Digestive Health, Royal Free Hospital, London, United Kingdom.
*these authors contributed equally
Received 2019-3-19; Accepted 2019-10-6; Published 2020-1-1
Abstract

Rationale: Loss of histone macroH2A1 induces appearance of cancer stem cells (CSCs)-like cells in hepatocellular carcinoma (HCC). How CSCs interact with the tumor microenvironment and the adaptive immune system is unclear.
Methods: We screened aggressive human HCC for macroH2A1 and CD44 CSC marker expression. We also knocked down (KD) macroH2A1 in HCC cells, and performed integrated transcriptomic and secretomic analyses.
Results: Human HCC showed low macroH2A1 and high CD44 expression compared to control tissues. MacroH2A1 KD CSC-like cells transferred paracrinally their chemoresistant properties to parental HCC cells. MacroH2A1 KD conditioned media transcriptionally reprogrammed parental HCC cells activated regulatory CD4+/CD25+/FoxP3+ T cells (Tregs).
Conclusions: Loss of macroH2A1 in HCC cells drives cancer stem-cell propagation and evasion from immune surveillance.
Keywords: hepatocellular carcinoma, histone macroH2A1, adaptive immune system, chemoresistance.
Introduction
Hepatocellular carcinoma (HCC) is the second leading cause of cancer-related death worldwide [1]. In advanced HCC, the liver maintains only a poor level of function, which limits patient eligibility for surgery. HCC tumors contain a population of cancer stem cells (CSCs) that are associated with metastatic potential and relapse [2]. These CSCs can self-renew and differentiate to give rise to virtually all HCC cell types [2]. Interestingly, while CSCs themselves do not rapidly proliferate, their progeny have a high proliferative capacity, and markedly augment the tumor mass. Although conventional chemotherapeutics suppress the proliferating cells that comprise the bulk of the tumor [3], CSCs are resilient to chemotherapy. Consequently, the gold standard HCC chemotherapeutic Sorafenib increases the average patient survival time by only a few months [4]. It is thus imperative to develop therapies that specifically target CSCs to enhance patient survival and wellbeing.
HCC typically arises as a result of hepatic injury and inflammation. As such, the physiological defensive response towards HCC strongly relies on the adaptive immune system and its cellular constituents: macrophages, natural killer (NK) cells, plasma cells, NKT cells, regulatory T cells (Treg) and CD4+ and CD8+ T cells [5]. The immune system triggers a potent anti-tumor response during HCC development: hepatic tumor progression markedly increases in T and B-cell-deficient Rag1-/- mice upon diethylnitrosamine (DEN)-induced liver injury [6]. Moreover, impaired immune surveillance of senescent hepatocytes induces HCC development in mice, indicating that senescence surveillance is important for tumor suppression in the liver [7, 8]. CSC-specific avoidance of immune-cell detection and destruction might allow tumor relapse [9, 10]; whether this is the case in HCC is currently unclear. Autocrine/paracrine non-cell-autonomous mechanisms govern the interplay between CSCs and neighboring cancer, immune and stromal cells and regulate CSC expansion and self-renewal in various cancers [11-14]. As CSCs have an important role in mediating drug resistance following chemotherapy and in immune evasion, efforts should be made to identify the specific factors secreted by hepatic CSCs and determine their influence on neighboring cells and the signaling and epigenetic mechanisms that control their production.
We previously demonstrated a link between the epigenetic regulatory properties of the histone variant macroH2A1 and the emergence of CSCs in HCC [15, 16]. MacroH2A1 is the largest histone variant in nature: it is composed of a domain that is 66% homologous to histone H2A, and a C-terminal linker that connects the histone fold domain to a macro domain. MacroH2A1 can either repress or activate transcription in response to growth signals [17]. MacroH2A1 exists as two alternatively exon-spliced isoforms, macroH2A1.1 and macroH2A1.2 [17]. In several cancer types, evidence supports a tumor-suppressive role for macroH2A1.1, while the role of macroH2A1.2 is dependent on the specific cancer context [18]. Histone variants have crucial roles in all DNA-template based processes, including transcriptional regulation and DNA repair and differ from their canonical (H2A, H2B, H3 and H4) counterparts in stability, DNA wrapping, and possession of specialized domains that regulate access to DNA [19]. MacroH2A1 expression is typically low in poorly differentiated and aggressive HCC subtypes compared to well-differentiated HCC. MacroH2A1 knockdown in HCC cell lines transforms them into CSC-like cells, thus illustrating that absence of macroH2A1 mediates cellular stem-like features and tumorigenic potential [15, 16]. MacroH2A1 expression has also been associated with the pathogenesis of multiple cancers [19].
Here, we demonstrate that loss of macroH2A1 expression, as observed in many HCC models, can reprogram parental HCC cells to a CSC-like chemoresistant phenotype in a paracrine manner. Our functional and immunological analyses on the macroH2A1-dependent CSC-like secretome suggest that this epigenetic pathway might provide an under-appreciated link between cancer stemness propagation in the tumor microenvironment (TME), and tumor-cell evasion from adaptive immune surveillance.
Materials and Methods
Cell cultures and treatments
The HepG2 and Huh-7 parental lines (ATCC) were cultured in DMEM (1X) supplemented with 10% fetal bovine serum (FBS) and 1% penicillin/streptomycin. Stable knock-down (KD) of macroH2A1 was achieved by lentiviral transduction [16]. HepG2 or Huh-7 control cells were exposed or not to conditioned media (CM) from macroH2A1 KD cells for 24 h. Chemoresistance experiments were performed by incubating cells for 72 h with 1 μM Sorafenib (SIGMA, Germany), 2 μM Doxorubicin (Santa Cruz Biotechnology, USA) or DMSO. Pentose phosphate pathway (PPP) inhibition in Huh-7 cells was achieved by incubating cells for 24-48 h with 2.5-5 μM Physcion (Sigma, Germany). Cell proliferation was measured by MTT assay [20]. To assess population doubling time of HepG2 and Huh‑7 cells, suspension of cells containing 300,000 cells/well were applied to 6‑well plates. Number of the cells was counted every day up to 3 days after plating.
Metabolomics
The Huh-7 central carbon metabolism profile was studied using ultra-high performance liquid chromatography - mass spectrometry (UHPLC-MS) to evaluate potential differences in 64 metabolites between macroH2A1 KD and control cells (Supplemental Table 1). Metabolite extraction: Cell pellets were re-suspended in cold extraction solvents [methanol/ethanol (1/1, v/v)] spiked with metabolites not detected in un-spiked cell extracts (internal standards) and incubated at -20 °C for 1 h. The samples were then vortexed and centrifuged at 18,000 x g, at 4 °C for 5 min. Supernatants were collected and kept at 4 °C, while cell pellets were re-suspended again in cold extraction solvents and incubated at -20 °C for 1 h. Samples were vortexed and centrifuged at 18,000 x g, at 4°C for 5 min and the supernatants were collected and pooled with the previous supernatant samples. Supernatants were dried under vacuum, reconstituted in water and re-suspended with agitation for 15 min. The samples were then centrifuged at 18,000 x g for 5 min at 4 °C and transferred to vials for UHPLC-MS analysis. Two different quality control (QC) samples were used to assess the data quality: 1. a QC calibration sample to correct for the different response factors between and within batches; and 2. a QC validation sample to assess how well the data pre-processing procedure improved the data quality. Randomized sample injections were performed, with each of the QC calibration and validation extracts uniformly interspersed throughout the entire batch run.
Data Pre-Processing: All data were processed using the TargetLynx application manager for MassLynx 4.1 software (Waters Corp., Milford, USA). Data pre-processing generated a list of chromatographic peak areas for the metabolites detected in each sample injection. An approximated linear detection range was defined for each identified metabolite, assuming similar detector response levels for all metabolites belonging to a given chemical class represented by a single standard compound. Data normalization was performed as previously described [21]. The ion intensities detected for each peak were normalized within each sample, to the sum of the peak intensities in that sample. There were no significant differences (HuH-7: t-test=0.1611) between the total intensities used for normalization of the groups compared in the study.
Data Analysis: Once normalized, the dimensionality of the complex data set was reduced to enable easy visualization of any metabolic clusters in the different sample groups. Data reduction was achieved by multivariate data analysis, including non-supervised principal components analysis (PCA) and/or supervised orthogonal partial least-squares to latent structures (OPLS) approaches [22]. Univariate statistical analyses were also performed to calculate the group percentage changes and the unpaired Student's t-test p-value for the following comparison: HuH-7 KD vs. HuH-7 CTL.
Immunoblotting and ELISA
RayBio® Human Biotin Label Based Antibody Arrays - Human L-507 Array, Membrane (AAH-BLM-1A-2, RayBio®, US) was used to analyze the supernatant (conditioned media) of Huh-7 cells (control or macroH2A1 KD), according to manufacturer's instructions. A Human Cytokines antibody array membrane (Abcam, Germany) was used to analyze the supernatant (conditioned media) of HepG2 cells (control or macroH2A1 KD), according to manufacturer's instructions (ab133997, Abcam, US). Detection of IL-6 and IL-8 levels in the culture media of Huh-7 cells was performed using Quantikine® kits (Bio-Techne R&D Systems s.r.o., Prague, Czech Republic), according to manufacturer's instructions.
Nuclei protein fractions from HepG2 and Huh-7 CTL cells were isolated as previously described [23, 24]. Primary antibodies were obtained from Active Motif (macroH2A1.1 and macroH2A1.2) and Cell Signaling Technology (H2B).
T-cell activation assay
Peripheral blood mononuclear cells (PBMC) were isolated from buffy coats of healthy volunteers (University Hospital Brno) by density gradient centrifugation using Ficoll. Cell pellets were re-suspended in PBS and centrifuged at 200 x g for 15 min at 20oC. Total T lymphocytes were isolated using the Pan T-cell isolation kit (Miltenyi Biotech, Germany), according to manufacturer's instructions. T cells fluorescently stained using CD4+-FITC and C25+-PE antibodies (Biosciences, Germany) were processed for analysis in a BD FACSCantoTM II Flow Cytometer (Becton Dickinson, Germany).
Treg suppression assay
Treg suppression assay was performed using a Treg Suppression Inspector assay, according to manufacturer's instructions (Miltenyi Biotech, Germany). CD4+/CD25+/FoxP3+ Tregs purified from fresh T cells from healthy donor blood and incubated with either CTL media or macroH2A1 KD media for the whole length of the assay, were used as suppressor cells, and the CD4+/CD25- fraction was used as responder cells. To setup the assay, CD4+ /CD25+/FoxP3+ were cultured with CD4+/CD25- T cells at increasing ratios (1:0, 1:1, 1:2, 1:4, 1:8). As a control, CD4+/CD25- responder cells were cultured alone. A total of 5×10⁵ CD4+/CD25- responder cells labeled with CFSE (Sigma, Germany) were co-cultured with 5×10⁵ CD4+/CD25+/FoxP3+ Tregs in 48-well plates in a volume of 1 ml/well of TexMACS medium (Miltenyi Biotech, Germany) supplemented with 100 U/ml of penicillin/streptomycin (ThermoFisher Scientific, Waltham, USA), and Treg Suppression Inspector, composed of anti-biotin MACSiBead™ particles preloaded with biotinylated anti-CD2, anti-CD3, and anti-CD28 antibodies (Miltenyi Biotech, Germany) for four days. Cells were then analyzed in a BD FACSCantoTM II Flow Cytometer (Becton Dickinson, Germany).
RNA-Seq and bioinformatic analyses
Total RNA was extracted from control and macroH2A1 KD Huh-7 cells using TRIzol Reagent (ThermoFisher Scientific, Waltham, USA). Indexed libraries were prepared from 250 ng purified RNA using the NEBNext Ultra II Directional RNA Library preparation kit with polyA selection module (New England Biolabs, Ipswich, USA). Libraries and input RNA samples were quality checked using Fragment Analyzer (Advanced Analytical, Ankeny, US). The libraries were pooled so that each index-tagged sample was present in equimolar amounts. The pooled samples then underwent cluster generation and sequencing using an Illumina NextSeq 500 (Illumina, San Diego, US) in a 2 x 75 paired-end format. Short reads were aligned against the hg19 genome assembly using STAR (ver. 2.6.1a). Piled-up reads were counted with htseq-count [25]. Read-count normalization and comparisons were performed using the edgeR R package. Genes were considered differentially expressed between groups if their expression values significantly differed by ≥2 folds. Statistical differences in gene expression were assessed by the ANOVA test. Correction for multiple test was achieved by the Benjamini-Hochberg procedure. The significance threshold was set to 0.05. Functional and pathway enrichment analyses were performed using the Ingenuity Pathway Analysis (IPA, Milan, Italy) software tool. The RNASeq profiling data have been deposited to the GEO database, with accession number GSE131680.
Immunohistochemistry
The Institutional Ethical Review Committee of the University Hospitals of Leuven approved the use of human HCC samples in this study. A total of 18 formalin-fixed paraffin-embedded (FFPE) liver biopsies from patients with HCC, treated at the University Hospitals of Leuven between 2003 and 2008, were included in this study. Patient clinicopathological features and immunohistochemistry methods were previously described [20, 26]. A further 20 samples from explanted livers of patients undergoing liver transplantation for HCC at the Royal Free Hospital (London, UK) were included (Supplemental Table 2). All patients signed informed consent forms for the use of the explanted liver tissue for research as part of the standard consent process for liver transplantation. Immunohistochemical staining on samples from UK human cases of encapsulated or non-encapsulated HCC was conducted according to previously described protocols [24, 26-28], using Abcam antibodies (Cambridge, UK) against macroH2A1, macroH2A1.1, macroH2A1.2, p16, CD44 or CD4+. Immunohistochemical analysis of the cases from the University Hospitals of Leuven was performed as previously described [29]. Semi-quantitative scoring of staining was performed in blind by two expert anatomo-pathologists (MVH and FR), as it was previously described [24, 26-28].
Statistical analyses
The data represent the means ± s.e.m. Comparisons between groups were made using the Student's t-test or the Mann-Whitney U-test, as appropriate, using GraphPad Prism Software (version 5.00 for Windows, San Diego, CA, USA). A P-value ⩽0.05 was considered statistically significant.
Results
Human HCCs with stem-like characteristics express low levels of macroH2A1
High levels of macroH2A1 expression in human patients indicate differentiated HCC [23, 30].
Conversely, macroH2A1 is weakly expressed in HCCs with a high level of CSCs (such as advanced-stage and sporadic fibrocellular HCC) compared to highly differentiated tumors [16]. However, we did not previously consider a crucial prognostic factor, tumor encapsulation. Encapsulated HCCs exhibit a grossly distinct capsule-like fibrous tissue surrounding well-differentiated tumors, and are associated with a protracted clinical course and increased survival [31]. We assessed macroH2A1 and CD44 expression by immunohistochemical labeling of HCC biopsies from patients with encapsulated or non-encapsulated tumors (n=10 per group) (Figure 1A and B) (Supplemental Table 2). As macroH2A1 staining was heterogeneous in both tumor groups, we applied a semi-quantitative scoring method as follows: high (+++), intermediate (++) and low (+) nuclear staining intensity (Figure 1C, upper panel). We combined this score with a score ranging from 0 to 100 to define the percentage of cells with defined nuclear staining intensity, in any randomly chosen field (Figure 1C, lower panel). The same scoring procedures were used to define CD44 staining.
MacroH2A1 and CD44 expression levels negatively correlate in encapsulated/non-encapsulated HCC from explanted livers of patients undergoing liver transplantation. Representative immunohistochemical staining of macroH2A1 (A) or CD44 (B) in encapsulated versus non-encapsulated (metastatic) tumors. (C, D) Semi-quantitative scoring of cases as in A and B, based on high (+++), intermediate (++) and low (+) nuclear staining intensity, and the score of cells with the defined nuclear staining intensity from 0 (low) to 100 (high). N = 10 encapsulated tumors, N=10 non-encapsulated tumors. * p < 0.05; ** p < 0.01.
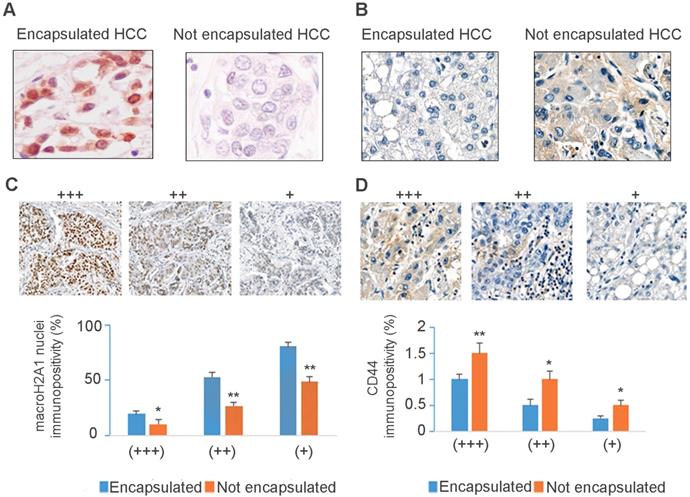
Our analysis confirmed a significant down-regulation of macroH2A1 immunopositive cells in non-encapsulated compared to encapsulated HCC (Figure 1C), regardless of variations in intratissutal staining intensity. We also confirmed a negative correlation between CD44 and macroH2A1 expression: encapsulated tumors displayed weak or no CD44 staining, and non-encapsulated tumors showed strong CD44 staining (Figure 1B-D). In summary, down-regulation/loss of macroH2A1 histone is associated with human non-encapsulated HCC.
MacroH2A1 knock-down (KD) HCC cells up-regulate glycolytic pathways
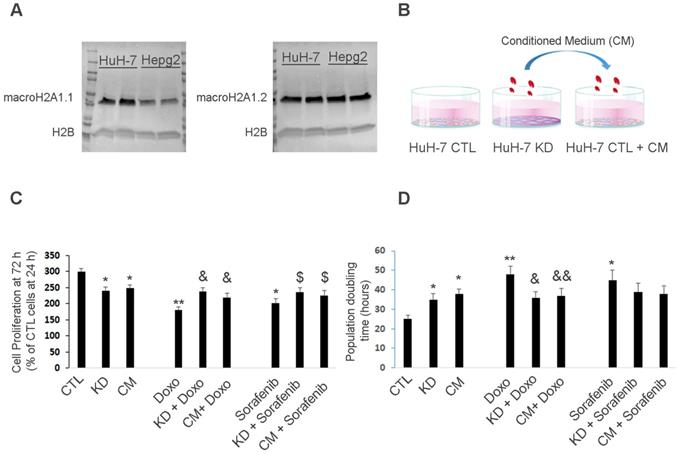
We previously showed that macroH2A1 KD induces CSC-like cellular architecture, morphology and behavior in HepG2 and Huh-7 HCC cell lines [16]. Central carbon cell metabolism (CCM) supports multiple physiological processes including biosynthesis, amino acid homeostasis, epigenetic maintenance, and redox defense [32]. CCM converts carbohydrates into metabolic precursors via three main pathways: glycolysis, the PPP and the citric acid cycle. CSCs are able to reprogram CCM to cater disease needs [33]. Huh-7 is more aggressive than HepG2 cells, in vitro and in vivo, and the two cell lines have a different genetic make-up [30, 34-36]. Moreover, control HepG2 and Huh-7 cells display similar levels of macroH2A1.2 isoform protein expression; however Huh-7 cells display higher macroH2A1.1 basal protein expression compared to HepG2 (Figure 2A). We have previously shown that macroH2A1 KD in HepG2 cells leads mainly to lipid metabolism reprogramming - with massive Acetyl-coA accumulation - and to a lesser extent to activation of glycolytic pathways [15]. Here we aimed to understand the central CCM profiles required to target CSCs using Huh-7 cells, which is instead one of the most aggressive HCC cell lines [30, 34-36]. We analyzed the endogenous metabolic profiles of control and macroH2A1 KD Huh-7 cells using an optimized UHPLC-MS platform that can profile 64 metabolites involved in CCM (Table S1). We initially performed an Orthogonal Partial Least Squares Classification for High Dimensional Data (OPLS-DA) analysis of control (n=7) and KD (n=7) cells to visualize any differences between the two groups (Figure S1A). This analysis identified a clear clustering of samples according to the experimental group (Figure S1A). We then generated a loading scatter plot based on the OPLS-DA analysis to identify the variables underlying this differential clustering. The metabolites lying away from the plot origin (having the strongest impact on the model) included nucleotides, redox/electron carriers and carbohydrates (Figure S1B).
Huh-7 macroH2A1 KD cells confer chemoresistance to parental cells in a paracrine manner. A. Nuclear fractions isolated from CTL HepG2 or Huh-7 cells, were processed for immunoblotting with anti-macroH2A1.1, anti-macroH2A1.2 and anti-H2B antibodies. B. Three experimental conditions: control (CTL), KD and CTL cells plus KD conditioned medium (CM). C. MTT assay in CTL, KD or CTL + CM cells incubated with or without vehicle (DMSO), 2 µM Doxorubicin (Doxo) or 1 µM Sorafenib for 72 h. Data represent the mean cell proliferation ± s.d. relative to CTL cells at 24 h. N=4. D. Population doubling time in CTL, KD or CTL + CM cells incubated with or without vehicle (DMSO), 2 µM Doxorubicin (Doxo) or 1 µM Sorafenib for 72 h. Data represent the mean cell proliferation ± s.d. N=3.*P < 0.05, ** P < 0.01 relative to CTL; & P < 0.05,& & P < 0.01 relative to Doxo; $ P < 0.05,$ $ P < 0.01 relative to Sorafenib.
We then conducted a univariate data analysis to calculate and compare (Student's t-test) the group percentage change and fold change for each individual metabolite between control and KD Huh-7 cells. Significant differences were found between 17 of the 64 tested metabolites in KD cells compared to control Huh-7 cells. Specifically, the levels of redox electron carriers (NADP, NADPH) and nucleotides (including ATP) were increased in Huh-7 KD cells compared to control cells (Figure S1C-D). These changes are consistent with increased activation of glycolytic branches that generate reduced forms of electron carriers and ATP in CSCs, and hyper-activation of the PPP [37] (Figure S2). Consistent with PPP activation, the fructose-6-phosphate (F6P)/glucose-6-phosphate (G6P) ratio was significantly decreased in HuH-7 KD compared to control cells (Figure S1C-D). In summary, these data suggest that macroH2A1 KD-induced CSC-like cells display activated glycolytic branches, particularly in the PPP.
MacroH2A1 KD HCC cells can confer chemoresistance to parental HCC cells in a paracrine manner
MacroH2A1 modulates the transcriptional activity of cytokine/chemokine genes such as IL-6, IL-8, CXCL1 and CXCL6 [38], which fine-tune CSC homeostasis [39]. As modulated glycolytic activity is linked to altered cytokine production in immune cells [40], we hypothesized that the pro-glycolytic metabolic profile of macroH2A1 KD Huh-7 cells would change the cancer-associated secretome and affect the phenotype of neighboring parental HCC cells. To test our paracrine hypothesis, we exposed control Huh-7 cells to the CM of macroH2A1 KD cells for 72 h (Figure 2B). Consistent with previous studies [16], cell proliferation was lower in macroH2A1 KD and macroH2A1 KD CM-exposed Huh-7 cells, compared to control, non-exposed cells (Figure 2C).
Doxorubicin (an anthracycline antibiotic) and Sorafenib (a multi-tyrosine kinase inhibitor) are commonly used chemotherapeutics for advanced HCC. We incubated control, macroH2A1-KD, and CM-exposed Huh-7 cells with 2 µM Doxorubicin or 1 µM Sorafenib for 72 h, and found that both macroH2A1 KD and CM from KD cells could confer resistance to drug-induced cell proliferation inhibition (Figure 2C). Population doubling analyses mirrored the cell proliferation analyses (Figure 2D). However, when we incubated control, macroH2A1-KD, and CM-exposed HepG2 cells with 2 µM Doxorubicin or 1 µM Sorafenib for 72 h, we found that the CM from macroH2A1 KD was not able to confer resistance to drug-induced cell proliferation inhibition in this cell line (Figure S3A, B). These data support that macroH2A1-dependent chemoresistance can be conferred in a paracrine fashion in Huh-7 cells but not in HepG2 cells.
MacroH2A1 KD HCC cells can transcriptionally reprogram parental HCC cells and produce a cytokine-depleted medium
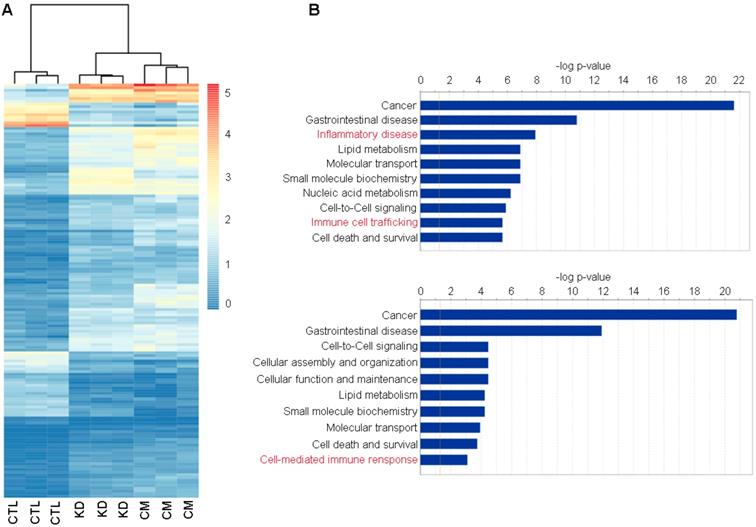
We next used RNA-Seq to gain deep mechanistic insight into the distinct functions of macroH2A1 KD and (CM-)exposed Huh-7 cells. A heatmap drawn for the 202 commonly differentially expressed genes between the three groups revealed a similar transcriptomic profile between KD and CM, compared to the control condition (Figure 3A).
Functional enrichment of commonly differentially expressed genes in control (CTL), macroH2A1 knockdown (KD) and conditioned media (CM) Huh-7 cells. A. Heatmap of counts per million (cpm) values of commonly differentially expressed genes in KD vs CTL and CM vs CTL. B. Plot showing the enrichment results of KD vs CTL (top) and CM vs CTL (bottom) comparisons. Bar lengths represent the -log(p-value) of the enriched functions. The orange line indicates the statistically significant threshold. Asterisks denote functions implicated in inflammatory and immune responses.
The transcriptomic profile similarity between CM and KD in comparison to CTL was also confirmed by measuring the Euclidean distance between centroids of clusters obtained by K-means algorithm (data not shown, [41]).
Assessment of differentially expressed genes for Huh-7 macroH2A1 KD or Huh-7 CM KD versus CTL showed no transcriptional overlap between the different Huh-7 cell lines. 783 and 987 genes were significantly and differentially expressed (|FC|≥2, adj. p-value ≤0.05) over a total number of 26,439 screened genes, in macroH2A1 KD or CM KD versus control cells, respectively (Figure S4A, B). Interestingly, the significantly enriched genes, over-represented in KD and CM-exposed cells compared to control cells, were implicated in a number of functions and diseases that were also shared between CM versus CTL comparisons (Figure 3B). Specifically, Ingenuity pathway analysis (IPA) identified categories of cancer, gastrointestinal diseases, lipid metabolism, cell-to-cell signaling, nucleic acid metabolism, cell death & survival and others, in common between KD versus CTL and CM versus CTL (Figure 3B). These data support a paracrine modulation of gene expression by macroH2A1 KD in HCC cells.
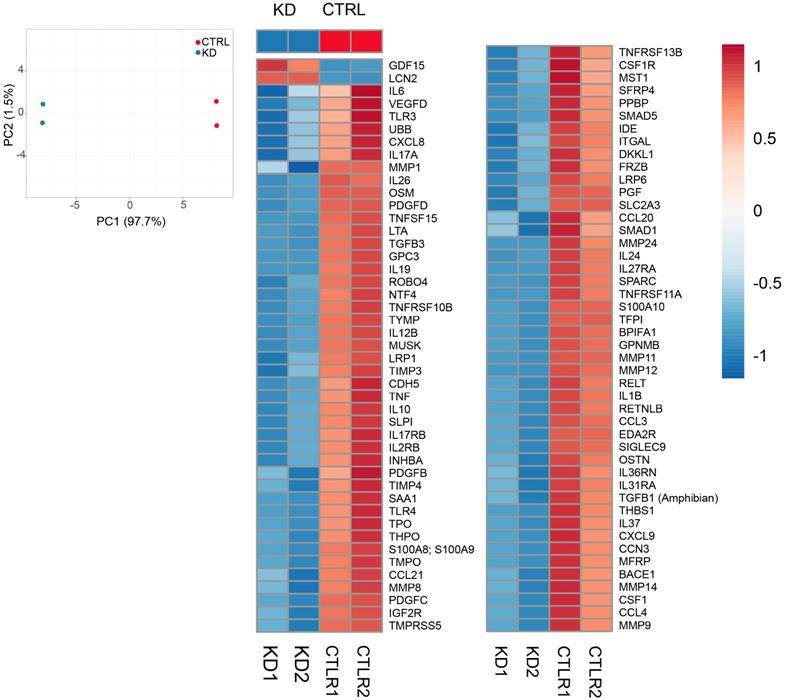
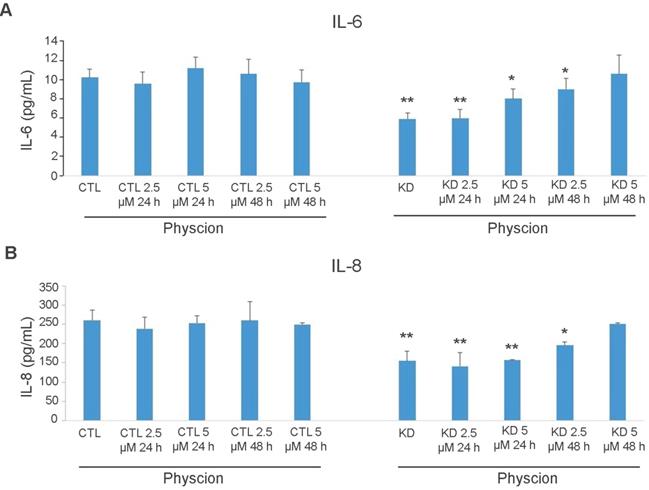
Although Huh-7 cells were not exposed to any treatment other than the CM from KD cells, IPA revealed an enrichment in the categories of inflammatory disease, immune-cell trafficking (KD versus CTL), and cell mediated-immune responses (CM versus CTL) (Figure S5). As inflammatory and immune responses are chiefly mediated via secreted factors, we performed a quantitative analysis of a commercial comprehensive panel of 507 human cytokines, chemokines, adipokine, growth factors, angiogenic factors, proteases, soluble receptors and soluble adhesion molecules, detectable in Huh-7 CTL and macroH2A1 KD cell supernatants. Figure 4A shows a principal component analysis (PCA) which identified a clear clustering of samples according to the experimental group. Setting a fold-change barrier to 1.2, and the significance level to ≤0.05 (Benjamini-Hochberg adjusted p-value), we detected 94 differentially expressed factors (Figure 4B). Stunningly, with the exception of GDF15 and Lipocalin 2 (LCN2) that were upregulated, the remaining secreted factors were underrepresented in the supernatant of macroH2A1 KD Huh-7 cells (Figure 4B). In contrast, no changes were observed in HepG2 cells, between CTL and macroH2A1 KD, upon quantitative analysis of a panel of most representative 48 human cytokine/chemokines (Figure S6). To ascertain whether the decreased levels of secreted factors in the macroH2A1 KD Huh-7 secretome were linked to their reprogrammed metabolism, namely PPP activation (Figure 2, Figure S2), we preincubated control and macroH2A1 KD cells for 24-48 h with 2.5-5 μM Physcion — an effective inhibitor of the third enzyme of the PPP [42]. We then assessed the levels of the two key pro-inflammatory cytokines, IL-6 and IL-8 (CXCL8) in the supernatants by ELISA (Figure 5). We confirmed downregulation of IL-6 and IL-8 protein levels in the macroH2A1 KD supernatant compared to control cells (Figure 5A, B). Physcion restored IL-6 and IL-8 levels in the KD cell supernatant upon 48 h incubation with a 5 μM dose, whereas no effect was seen in control cells (Figure 5A, B). These findings suggest that macroH2A1-dependent decreased IL-6/IL-8 secretion may be dependent on PPP activation.
Secretome analysis. A. Principal Component Analysis applied to expression profiles of 507 human cytokines, chemokines, adipokine, growth factors, angiogenic factors, proteases, soluble receptors and soluble adhesion molecules in KD and CTRL cells. B. Heatmap representation of 94 differentially expressed molecules between KD (blue group) and CTRL cells (red group). Expression values were scaled between -1 and 1, where positive numbers were represented in tones of red, blue otherwise.
ELISA analysis of cytokine levels in Huh-7 macroH2A1 knockdown (KD) compared to control (CTL) cells. A-B. CTL and KD cultured cells were treated with Physcion (2.5 and 5 µM) for 24 h or 48 h or untreated. IL-6 (A) or IL-8 (B) or levels (in pg/ml) were measured in the cell supernatants using commercial ELISAs. N = 3. *p < 0.05, **p < 0.01 compared to control untreated cells.
HCC harboring low macroH2A1 expression displays decreased CD4(+) lymphocyte infiltration
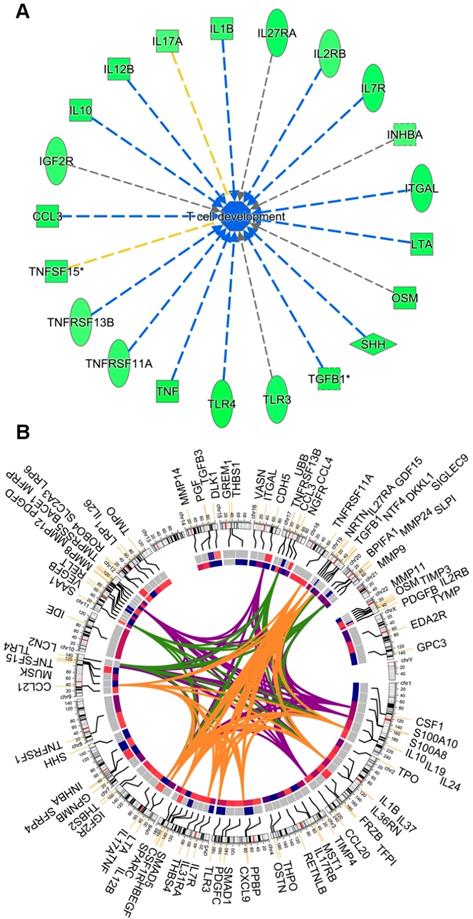
The overall cytokine/chemokine depleted medium of macroH2A1 KD CSC-like cells led us to hypothesize that loss of macroH2A1 might trigger pleiotropic effects that help CSCs evade the defensive immune response in a paracrine manner. Consistently, running IPA on the Huh-7 secretome (Figure 4), we inferred that this cytokine depletion would inhibit the process of T cell development/maturation (Figure 6A). Surprisingly, the changes in the secretome in Huh-7 macroH2A1 KD cells is largely independent on macroH2A1-dependent transcriptional regulation: through integrated transcriptomic and secretomic analyses we detected significant concordance between differentially expressed genes and differential expression of the corresponding secreted factors only in 10 over 94 factors (CCL3, CXCL9, HBEGF, IL7R, INHBA, MMP12, MMP24, PDGFB, PDGFD, TGFB3, TLR3) (Circos plot, Figure 6B).
(A) Activity inference of the T cell development/maturation biological process by 21 out of the 94 differentially expressed molecules between KD and CTRL cells. The process is colored in blue, since its activity is predicted by IPA to be globally reduced in KD cells. Edges are colored (i) in blue, when the fold-regulation of the participating molecules to the process is coherent with the activity inference, (ii) in yellow, when there is inconsistency and (iii) gray when it is not possible to infer the kind of participation (activation, arrow or inhibition, dead-end arrow) of a molecule to the overall process. (B) Circos plot representing (from outer to the innermost circle) the 94 molecules, their chromosomal location, their fold-regulation values in the RNA-Seq experiment, and their fold-regulation values in the 94 panel of 507 secreted molecules. Genes were linked by colored bands, if belonging to the same biological process: orange (T cell response), green (activation of neutrophils) and violet (recruitment of neutrophils).
Local immune responses in patients with HCC are restrained by tumor and circulating CD4+/CD25+/FoxP3+ Tregs, which suppress effector CD4+ T-cell activity and proliferation. Tregs are the predominant cell-type involved in HCC immune escape [43]. Consequently, compromised lymphocyte infiltrates (namely, tumor infiltrating lymphocytes; TILs) are observed in HCC [44]. Histological examination of encapsulated and non-encapsulated human HCC did not reveal any differences in total lymphocyte infiltration, regardless of tumoral or peri-tumoral localization (Figure S7A).
We then examined whether reduced macroH2A levels correlate with a decreased frequency of CD4+ T cells specifically, or an increased presence of CD25+ TILS. Here, we used a previously described cohort [26] that we classified into two groups: patients with poorly differentiated HCC and low macroH2A1 expression; and patients with well-differentiated HCC and high macroH2A1 expression (Figure 7).
Aggressive hepatocellular carcinoma (HCC) with reduced macroH2A1 expression displays increased CD25+infiltration. Immunohistochemical staining for macroH2A1, CD4 and CD25 in poorly differentiated (n = 18) and well-differentiated (n = 16) HCC, from a previously characterized cohort [26]. Magnification, 20 X. Black scale bars indicate 100 μM. The lower panels show the mean number of cells counted in 10 high-power fields (HPF) performed by a pathologist blinded to the HCC differentiation categories. *p < 0.01 compared to well differentiated.
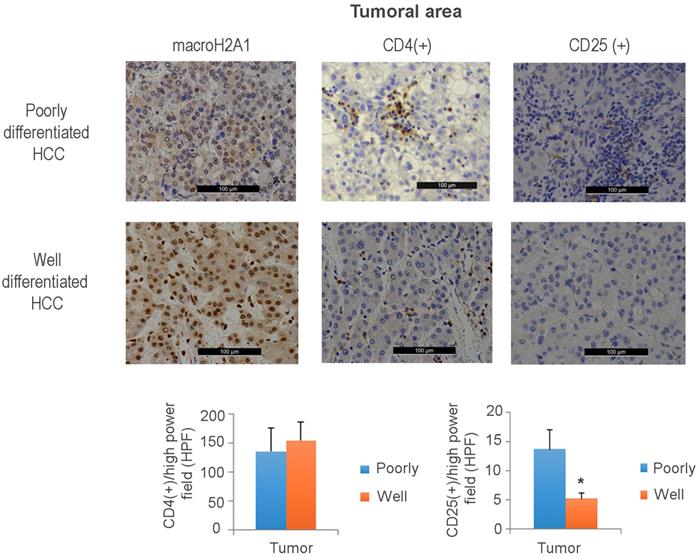
Immunohistochemical staining against CD25+ T cells revealed an increased tumoral presence in poorly differentiated versus well-differentiated tumors; the intra-tumoral CD4+ cell content was unchanged between the two HCC groups (Figure 7). Interestingly, a decreased presence of CD4+ cells was observed in the peritumoral area of poorly versus well-differentiated HCC (Figure S7B). These data demonstrate that aggressive HCC expressing low levels of macroH2A1 exhibits high levels of intra-tissue TILS expressing the CD25+ Treg marker and a decreased adaptive immune response.
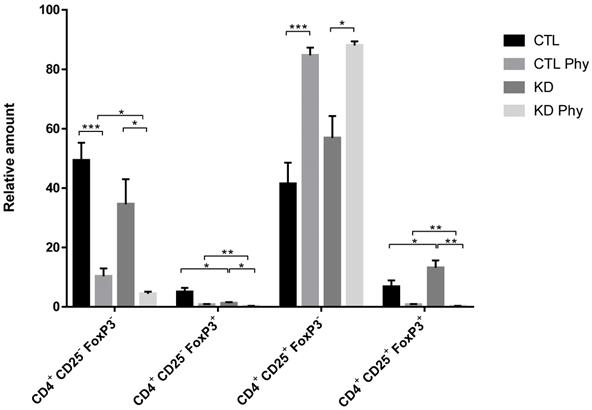
Tregs mediate their suppressive function not only through cell-to-cell contact, but also via soluble mediators that provide a positive feedback loop for immune suppressive mechanisms by generating inducible Tregs cells from CD4+/CD25-T effector cells [43]. Therefore, we investigated the potential of macroH2A1 KD CSCs to activate CD4+/CD25+/FoxP3+ Tregs. We isolated fresh T cells from healthy donor blood and incubated them for 72 h with either CTL media or KD media. Using the flow cytometry gating strategy depicted in Figure S10, we observed a significant increase in the frequency of activated CD4+/CD25+/FoxP3+ Tregs upon treatment with KD media compared to control media (Figure 8). This increase was paralleled by a decrease in CD4+/CD25-/FoxP3+ T cells, indicating that conditioned media form KD cells triggers Treg generation from these precursors in the T cell pool. Altogether these data suggest that Tregs are activated in a paracrine manner by macroH2A1 KD HCC cells. Interestingly, pre-treatment of Huh-7 CD and macroH2A1 KD cells with PPP inhibitor Physcion (5 μM, 48h) generated a conditioned medium that nearly completely suppressed the frequency of activated CD4+/CD25+/FoxP3+ Tregs, while massively increasing in parallel the number of CD4+/CD25+/FoxP3- T cells (Figure 8). Physcion also significantly inhibited the formation of the pools of CD4+/CD25-/FoxP3- and CD4+/CD25-/FoxP3+ T cells (Figure 8). The functionality of CD4+/CD25+/FoxP3+ Tregs was also analyzed in carboxyfluorescein succinimidyl ester (CFSE)-based suppression assays. Concurrent with co-incubation with CTL or KD media, CFSE-labeled CD4+/CD25- T responder cells were mixed with CD4+/CD25+/FoxP3+ Tregs in presence of Treg suppression inspector (anti-Biotin MACSiBead™ particles loaded with biotinylated CD2, CD3, and CD28 antibodies), and then proliferation rate of responder cells was measured. We did not detect differences in the suppressive activity of Tregs from the CTL or the KD group (Figure S11). In summary, media produced from HCC cells KD for macroH2A1 harboring lead to an expansion in the number of activated Tregs, without alterations in their suppressive function.
MacroH2A1 KD conditioned media trigger CD4+/CD25+/FoxP3+ Treg cells expansion. A. T cells isolated from peripheral blood mononuclear cells of healthy volunteers were exposed to the culture media taken from CTL cells, macroH2A1 KD cells or CTL cells exposed to the conditioned media (CM) of KD cells. All cell lines were pretreated, or not, with PPP inhibitor Physcion (Phy, 5 μM, 48h). The T cells were activated and stained with CD4+, CD25+ and FoxP3+ specific antibodies before flow cytometry. Results are expressed as the percentage (%) of the parental population. N = 8; p < 0.05, ** p < 0.01. *** p < 0.001, comparisons as indicated.
HCC harboring low macroH2A1 expression displays decreased cellular senescence
MacroH2A1 modulates the transcriptional activity of IL-6 and IL-8 [38], and these cytokines are important effectors of the senescence associated secretory phenotype (SASP) [7]. SASP renders cells vulnerable to immune-mediated clearance [7]. Therefore, we sought to determine if altered macroH2A1 isoform (macroH2A1.1 and macroH2A1.2) levels in HCC patient tissue samples correlate with altered frequency of tumor resident senescent cells. We found that a significantly higher number of cells immunopositive for β-galactosidase (β-gal), a key marker of cellular senescence, paralleled the progression of liver disease (control < cirrhosis < HCC) and the increased immunopositivity for macroH2A1 isoforms in a cohort of patients bearing differentiated/encapsulated tumors that we previously described [23, 24] (Figure S8). Moreover, p16 has been identified as main player in the cellular senescence response in the liver cellular senescence program, which in turn is involved in tumour immune surveillance [7, 8]. Here we found that p16 was expressed at lower levels in the previously examined liver biopsies of patients with poorly differentiated HCC and low macroH2A1 expression compared to those with well differentiated HCC and high macroH2A1 expression [26] (Figure 7, Figure S9). Altogether, these immunohistochemistry data suggest that macroH2A1 expression positively correlated with cellular senescence in human liver. Moreover, cellular senescence phenotype correlates positively with HCC differentiation.
Discussion
A high presence of CSCs in the liver of patients with HCC is associated with HCC relapse and metastasis [2]. Here, we show for the first time that liver CSC-like cells can reprogram neighboring HCC cells into other CSC-like cells that can evade the adaptive immune system via a combination of epigenetic (macroH2A1) and paracrine mechanisms. MacroH2A1 is a marker of well-differentiated HCC and of non-tumor/tumor liver tissue senescence [23, 24]; however, our previous and current data suggest that macroH2A1 expression is dramatically decreased or absent in a wide range of independent poorly-differentiated human HCCs [16], although the correlation between macroH2A1 immunostaining and HCC encapsulation that we found needs validation in a larger cohort. What triggers macroH2A1 down-regulation and subsequent macroH2A1-dependent transformation of HCC cells into CSC-like cells remains unknown. Previous evidence suggest that loss of macroH2A1 might promote a relaxed chromatin state that is poised for chromatin remodeling to enhance accessibility to pro-inflammatory transcription factors (NF-κB), and re-expression of reprogramming genes that together might lead to a CSC-like phenotype [17, 45, 46].
The tumor secretome consists of diffusible factors derived from CSCs, cancer cells and the surrounding stroma that determine cancer progression. Proteomic analysis of pancreatic CSCs previously revealed 72 differentially regulated proteins compared to the parental cells [47]. To the best of our knowledge, the liver CSC secretome has not been studied. Our analysis of a panel of 507 human cytokines, chemokines, adipokine, growth factors and other soluble molecules in Huh-7 HCC cells with macroH2A1 KD revealed a significant down-regulation of 92 out of 94 differentially expressed molecules (98%), including IL-6 and IL-8. The expression levels of these interleukins are under the specific control of macroH2A1.1 isoform - and not macroH2A1.2 - [38]; we found macroH2A1.1 expressed at higher levels in Huh-7 compared to HepG2 cells. HepG2 cells do not produce IL-6 (Figure S6, [34]). Interestingly, secretomic effects were not observed in HepG2 cells KD for macroH2A1. Also, macroH2A1 KD HepG2 cells, unlike Huh-7 cells, were unable to transfer chemoresistance paracrinally, which might be consistent with lower levels of macroH2A1.1 [38] in this cell line. HepG2 express a wild type tumor suppressor p53, while Huh-7 cells express a mutant dominant negative p53 (Y220C) [48]. p53 mutations are frequent in human HCC and are associated to a shorter survival rate compared to the one of wild type p53 carriers [49]; they are also major components in the establishment of CSC entity [50]. HepG2 and Huh-7 cells KD for macroH2A1 present also metabolic differences: while both cell lines display increased glycolytic pathways, a more significant upregulation of pentose phosphate pathway (PPP) with an increased abundance of redox electron carriers (NADP, NADPH) is specifically observed in Huh-7 ([15], this study), while an increased intracellular acetyl-CoA and lipid accumulation is specifically observed in HepG2 ([15], this study). p53 is a strong inhibitor of PPP: p53 protein binds to glucose-6-phosphate dehydrogenase (G6PD), the first and rate-limiting enzyme of the PPP, and prevents the formation of the active dimer [51]. Cancer-associated p53 mutants lack the G6PD-inhibitory activity [51]. Pre-malignant senescent hepatocytes produce SASP that renders these cells vulnerable to immune-mediated clearance [7]. Our working hypothesis, supported by the data on PPP-dependent chemokine-cytokine production, is that CSC-like macroH2A1 KD Huh-7 cells, which are p53 mutant and thus display an over-activated PPP, are able to produce an “anti-SASP” - depleted in IL-6, IL-8 and other effectors, triggering a potential mechanism of immune evasion. Consistent with our data, macroH2A1-depleted IMR90 cells do not senesce in response to SASP factor-containing conditioned media from senescent cells, and do not activate SASP genes [38]. It is also possible that over-activated PPP and deficient macroH2A1 expression trigger positive epistatic effects on the secretome of HCC cells.
How macroH2A1 KD induces general inhibition of secreted factors in HCC cells? Surprisingly, integrated transcriptomic and secretomic analysis uncovered a low degree of significant concordance between mRNA and protein expression levels, ~11% (10 out of 94 secreted factors). Cytokine expression and production is typically regulated by extensive post-transcriptional regulation [52, 53]. Moreover, cellular perturbations such as endoplasmic reticulum stress, oxidative stress and DNA damage coordinately regulate macroH2A1-dependent production of IL-6 and IL-8 upon K-Ras-dependent oncogenic transformation of fibroblasts [38]. The elucidation of the transcription/post-transcriptional mechanisms leading to the observed cytokine/chemokine depletion in macroH2A1 KD-induced CSC-like cells warrants further studies. Regardless, the cytokine-depleted secretome is related to immune evasion. While elevated levels of cytokines produced by tumor cells enhance CSC proliferation and the differentiation [39], our data suggest the possibility that decreased levels of cytokines produced by CSC-like cells might favor quiescence, pluripotency and chemoresistance - properties that are transcriptionally programmed into neighboring cancer cells. If this holds true, interventions for general neutralizations of chemokines/cytokines within the tumor parenchyma might be ineffective on the CSC extracellular niche.
Given the rarity of CSCs within the HCC mass [3], it will prove challenging to obtain spatially resolved data about the gradients of cytokine and chemokine levels in vivo. Technological advancements to profile low-molecular-mass proteins are required for an unbiased full characterization of the CSC secretome. Our findings provide evidence that the macroH2A1-dependent CSC-like secretome depleted in severable immune mediators leads to CD4+/CD25+/FoxP3+ Treg expansion, without changes in their suppressive activity, and simultaneous curtailment of CD4+CD25-/FoxP3+ T cells in human T lymphocyte pools. Treg development is classically dependent on IL-2 [54]. IL-2 levels were unchanged in macroH2A1 KD CSC-like cells (data not shown). Noteworthy, the only two secreted factors augmented in the conditioned medium from CSC-like cells were GDF15 and lipocalin-2. Both factors can promote CD4+/CD25+/FoxP3+ Treg activation, CSC-like properties and immune escape [55-59]. Our data thus suggest the existence of a complex scenario where the macroH2A1 KD-induced CSC-like cells inhibit T cell maturation through downregulation of secreted immune mediators (Figure 6A), in concert with CD4+/CD25+/FoxP3+ Treg expansion due to the increased secreted levels of GDF15 and/or lipocalin-2.
We provide also data that blocking the hyperactivation of PPP in macroH2A1 KD Huh-7 cells using PPP specific inhibitor Physcion led to restoration of downregulated cytokines (IL-6, IL-8) and nearly completely suppressed CD4+/CD25+/FoxP3+ Tregs, suggesting a previously unappreciated link between energy metabolism and chemokine/cytokine production in HCC cells.
During tissue injury, antigen‐specific CD4+/CD25- T cells participate in the control of tissue homeostasis in concert with CD8+ T cells, macrophages, and NK cells at the inflammatory site. Genetic experiments have revealed that functional senescence surveillance is dependent on an intact adaptive immune response. In CD4+ knockout mice, the immune clearance of premalignant senescent hepatocytes is abrogated, favoring HCC development [7]. We propose that the observed decreased recruitment of CD4+ T cells in macroH2A1-deficient HCC foci contributes, at least in part, to adaptive immune system evasion. A limitation of our study is that it does not address the complex mixture of non-transformed cell types and the extracellular matrix of the TME, as we focus only on major HCC-CSC and CSCs-T lymphocyte cell-cell crosstalk. Further work in 3D tissue models, which might allow microvasculature development and quantitative assessment of cell-cell and cell-drug interactions in a physiologically realistic TME, is required to confirm these findings. Approaches aiming at targeting cellular metabolism in conjunction with chemotherapeutic drugs [60], or ablating CD44 expression to inhibit glycolysis and the PPP [61], or modulating T cells activity through optogenetics [62], are innovative strategies that might be useful to treat macroH2A1-negative aggressive HCCs.
Abbreviations
HCC: hepatocellular carcinoma; CSC: cancer stem cells; Treg: regulatory T cells; KD: knockdown; CCM: central carbon metabolism; PPP: pentose phosphate pathway.
Acknowledgements
We thank One Way Liver (Spain), St'Agata and the HistoPathology facility of the VBCF (Vienna, Austria) for technical help; Insight Editing London for professional editing of the manuscript. This work was supported by grants from the European Social Fund and European Regional Development Fund - Project MAGNET (No. CZ.02.1.01/0.0/0.0/15_003/0000492) (to M.V.), and by the Ministry of Health of the Czech Republic (No. NV18-03-00058) (to M.V.). We acknowledge the Core Facility Genomics CEITEC MU supported by the NCMG research infrastructure (LM2015091 funded by MEYS CR).
Supplementary Material
Supplementary figures and tables.
Competing Interests
The authors have declared that no competing interest exists.
References
1. Gores GJ. Decade in review-hepatocellular carcinoma: HCC-subtypes, stratification and sorafenib. Nat Rev Gastroenterol Hepatol. 2014;11:645-7
2. Oikawa T. Cancer Stem cells and their cellular origins in primary liver and biliary tract cancers. Hepatology. 2016;64:645-51
3. Yamashita T, Wang XW. Cancer stem cells in the development of liver cancer. J Clin Invest. 2013;123:1911-8
4. Mazzoccoli G, Miele L, Oben J, Grieco A, Vinciguerra M. Biology, Epidemiology, Clinical Aspects of Hepatocellular Carcinoma and the Role of Sorafenib. Curr drug targets. 2016;17:783-99
5. Endig J, Buitrago-Molina LE, Marhenke S, Reisinger F, Saborowski A, Schutt J. et al. Dual Role of the Adaptive Immune System in Liver Injury and Hepatocellular Carcinoma Development. Cancer Cell. 2016;30:308-23
6. Schneider C, Teufel A, Yevsa T, Staib F, Hohmeyer A, Walenda G. et al. Adaptive immunity suppresses formation and progression of diethylnitrosamine-induced liver cancer. Gut. 2012;61:1733-43
7. Kang TW, Yevsa T, Woller N, Hoenicke L, Wuestefeld T, Dauch D. et al. Senescence surveillance of pre-malignant hepatocytes limits liver cancer development. Nature. 2011;479:547-51
8. Yevsa T, Kang TW, Zender L. Immune surveillance of pre-cancerous senescent hepatocytes limits hepatocellular carcinoma development. Oncoimmunology. 2012;1:398-9
9. Sultan M, Coyle KM, Vidovic D, Thomas ML, Gujar S, Marcato P. Hide-and-seek: the interplay between cancer stem cells and the immune system. Carcinogenesis. 2017;38:107-18
10. Bruttel VS, Wischhusen J. Cancer stem cell immunology: key to understanding tumorigenesis and tumor immune escape? Front Immunol. 2014;5:360
11. Yamamoto M, Taguchi Y, Ito-Kureha T, Semba K, Yamaguchi N, Inoue J. NF-kappaB non-cell-autonomously regulates cancer stem cell populations in the basal-like breast cancer subtype. Nat Commun. 2013;4:2299
12. Cadamuro M, Brivio S, Spirli C, Joplin RE, Strazzabosco M, Fabris L. Autocrine and Paracrine Mechanisms Promoting Chemoresistance in Cholangiocarcinoma. Int J Mol Sci. 2017:18
13. Lau EY, Lo J, Cheng BY, Ma MK, Lee JM, Ng JK. et al. Cancer-Associated Fibroblasts Regulate Tumor-Initiating Cell Plasticity in Hepatocellular Carcinoma through c-Met/FRA1/HEY1 Signaling. Cell Rep. 2016;15:1175-89
14. Zheng BN, Ding CH, Chen SJ, Zhu K, Shao J, Feng J. et al. Targeting PRMT5 Activity Inhibits the Malignancy of Hepatocellular Carcinoma by Promoting the Transcription of HNF4alpha. Theranostics. 2019;9:2606-17
15. Lo Re O, Douet J, Buschbeck M, Fusilli C, Pazienza V, Panebianco C. et al. Histone variant macroH2A1 rewires carbohydrate and lipid metabolism of hepatocellular carcinoma cells towards cancer stem cells. Epigenetics. 2018;13:829-45
16. Lo Re O, Fusilli C, Rappa F, Van Haele M, Douet J, Pindjakova J. et al. Induction of cancer cell stemness by depletion of macrohistone H2A1 in hepatocellular carcinoma. Hepatology. 2018;67(2):636-650
17. Lo Re O, Vinciguerra M. Histone MacroH2A1: A Chromatin Point of Intersection between Fasting, Senescence and Cellular Regeneration. Genes (Basel). 2017:8 (12)
18. Giallongo S, Lo Re O, Vinciguerra M. Macro Histone Variants: Emerging Rheostats of Gastrointestinal Cancers. Cancers. 2019:11 (5)
19. Buschbeck M, Hake SB. Variants of core histones and their roles in cell fate decisions, development and cancer. Nat Rev Mol Cell Biol. 2017;18:299-314
20. Lo Re O, Panebianco C, Porto S, Cervi C, Rappa F, Di Biase S. et al. Fasting inhibits hepatic stellate cells activation and potentiates anti-cancer activity of Sorafenib in hepatocellular cancer cells. J Cell Physiol. 2017;233:1202-12
21. Barr J, Vazquez-Chantada M, Alonso C, Perez-Cormenzana M, Mayo R, Galan A. et al. Liquid chromatography-mass spectrometry-based parallel metabolic profiling of human and mouse model serum reveals putative biomarkers associated with the progression of nonalcoholic fatty liver disease. J Proteome Res. 2010;9:4501-12
22. Wiklund S, Johansson E, Sjostrom L, Mellerowicz EJ, Edlund U, Shockcor JP. et al. Visualization of GC/TOF-MS-based metabolomics data for identification of biochemically interesting compounds using OPLS class models. Anal Chem. 2008;80:115-22
23. Borghesan M, Fusilli C, Rappa F, Panebianco C, Rizzo G, Oben JA. et al. DNA Hypomethylation and Histone Variant macroH2A1 Synergistically Attenuate Chemotherapy-Induced Senescence to Promote Hepatocellular Carcinoma Progression. Cancer Res. 2016;76:594-606
24. Rappa F, Greco A, Podrini C, Cappello F, Foti M, Bourgoin L. et al. Immunopositivity for histone macroH2A1 isoforms marks steatosis-associated hepatocellular carcinoma. PloS One. 2013;8:e54458
25. Anders S, Pyl PT, Huber W. HTSeq-a Python framework to work with high-throughput sequencing data. Bioinformatics. 2015;31:166-9
26. Govaere O, Komuta M, Berkers J, Spee B, Janssen C, de Luca F. et al. Keratin 19: a key role player in the invasion of human hepatocellular carcinomas. Gut. 2014;63:674-85
27. Pazienza V, Panebianco C, Rappa F, Memoli D, Borghesan M, Cannito S. et al. Histone macroH2A1.2 promotes metabolic health and leanness by inhibiting adipogenesis. Epigenetics Chromatin. 2016;9:45
28. Pindjakova J, Sartini C, Lo Re O, Rappa F, Coupe B, Lelouvier B. et al. Gut Dysbiosis and Adaptive Immune Response in Diet-induced Obesity vs. Systemic Inflammation. Front Microbiol. 2017;8:1157
29. Ceulemans A, Verhulst S, Van Haele M, Govaere O, Ventura JJ, van Grunsven LA. et al. RNA-sequencing-based comparative analysis of human hepatic progenitor cells and their niche from alcoholic steatohepatitis livers. Cell Death Dis. 2017;8:e3164
30. Jueliger S, Lyons J, Cannito S, Pata I, Pata P, Shkolnaya M. et al. Efficacy and epigenetic interactions of novel DNA hypomethylating agent guadecitabine (SGI-110) in preclinical models of hepatocellular carcinoma. Epigenetics. 2016:1-12
31. Lee F. Liver Cancer: New Research. New York: Nova Biomedical Books. 2006
32. Ducker GS, Rabinowitz JD. One-Carbon Metabolism in Health and Disease. Cell Metab. 2017;25:27-42
33. Peixoto J, Lima J. Metabolic traits of cancer stem cells. Dis Model Mech. 2018:11 (8)
34. Kovacovicova K, Skolnaja M, Heinmaa M, Mistrik M, Pata P, Pata I. et al. Senolytic Cocktail Dasatinib+Quercetin (D+Q) Does Not Enhance the Efficacy of Senescence-Inducing Chemotherapy in Liver Cancer. Front Oncol. 2018;8:459
35. Vinciguerra M, Carrozzino F, Peyrou M, Carlone S, Montesano R, Benelli R. et al. Unsaturated fatty acids promote hepatoma proliferation and progression through downregulation of the tumor suppressor PTEN. J Hepatol. 2009;50:1132-41
36. Jung HR, Kang HM, Ryu JW, Kim DS, Noh KH, Kim ES. et al. Cell Spheroids with Enhanced Aggressiveness to Mimic Human Liver Cancer In vitro and In vivo. Sci Rep. 2017;7:10499
37. Dando I, Dalla Pozza E, Biondani G, Cordani M, Palmieri M, Donadelli M. The metabolic landscape of cancer stem cells. IUBMB Life. 2015;67:687-93
38. Chen H, Ruiz PD, McKimpson WM, Novikov L, Kitsis RN, Gamble MJ. MacroH2A1 and ATM Play Opposing Roles in Paracrine Senescence and the Senescence-Associated Secretory Phenotype. Mol Cell. 2015;59:719-31
39. Liongue C, Ward, Alister C, Duan, Wei, Shigdar, Sarah. Cytokine networks and cancer stem cells. Cancer stem cells: emerging concepts and future perspectives in translational oncology. Berlin, Germany: Springer. 2015 p. 67-87
40. Menk AV, Scharping NE, Moreci RS, Zeng X, Guy C, Salvatore S. et al. Early TCR Signaling Induces Rapid Aerobic Glycolysis Enabling Distinct Acute T Cell Effector Functions. Cell Rep. 2018;22:1509-21
41. Si Y, Liu P, Li P, Brutnell TP. Model-based clustering for RNA-seq data. Bioinformatics. 2014;30:197-205
42. Lin R, Elf S, Shan C, Kang HB, Ji Q, Zhou L. et al. 6-Phosphogluconate dehydrogenase links oxidative PPP, lipogenesis and tumour growth by inhibiting LKB1-AMPK signalling. Nat Cell Biol. 2015;17:1484-96
43. Makarova-Rusher OV, Medina-Echeverz J, Duffy AG, Greten TF. The yin and yang of evasion and immune activation in HCC. J Hepatol. 2015;62:1420-9
44. Unitt E, Rushbrook SM, Marshall A, Davies S, Gibbs P, Morris LS. et al. Compromised lymphocytes infiltrate hepatocellular carcinoma: the role of T-regulatory cells. Hepatology. 2005;41:722-30
45. Angelov D, Molla A, Perche PY, Hans F, Cote J, Khochbin S. et al. The histone variant macroH2A interferes with transcription factor binding and SWI/SNF nucleosome remodeling. Mol Cell. 2003;11:1033-41
46. Tordella L, Khan S, Hohmeyer A, Banito A, Klotz S, Raguz S. et al. SWI/SNF regulates a transcriptional program that induces senescence to prevent liver cancer. Genes Dev. 2016;30:2187-98
47. Brandi J, Dalla Pozza E, Dando I, Biondani G, Robotti E, Jenkins R. et al. Secretome protein signature of human pancreatic cancer stem-like cells. J Proteomics. 2016;136:1-12
48. Bhardwaj B, Bhardwaj G, Lau JY. Expression of p21 and p27 in hepatoma cell lines with different p53 gene profile. J Hepatol. 1999;31:386
49. Shiraha H, Yamamoto K, Namba M. Human hepatocyte carcinogenesis (review). Int J Oncol. 2013;42:1133-8
50. Shetzer Y, Molchadsky A, Rotter V. Oncogenic Mutant p53 Gain of Function Nourishes the Vicious Cycle of Tumor Development and Cancer Stem-Cell Formation. Cold Spring Harb Persp Med. 2016:6 (10)
51. Jiang P, Du W, Wang X, Mancuso A, Gao X, Wu M. et al. p53 regulates biosynthesis through direct inactivation of glucose-6-phosphate dehydrogenase. Nat Cell Biol. 2011;13:310-6
52. Khabar KS. Post-transcriptional control of cytokine gene expression in health and disease. J Interf Cytok Res. 2014;34:215-9
53. Anderson P. Post-transcriptional control of cytokine production. Nature Immunol. 2008;9:353-9
54. Fontenot JD, Rasmussen JP, Gavin MA, Rudensky AY. A function for interleukin 2 in Foxp3-expressing regulatory T cells. Nat Immunol. 2005;6:1142-51
55. Soucek K, Slabakova E, Ovesna P, Malenovska A, Kozubik A, Hampl A. Growth/differentiation factor-15 is an abundant cytokine in human seminal plasma. Human Reprod. 2010;25:2962-71
56. Roth P, Junker M, Tritschler I, Mittelbronn M, Dombrowski Y, Breit SN. et al. GDF-15 contributes to proliferation and immune escape of malignant gliomas. Clin Cancer Res. 2010;16:3851-9
57. Sasahara A, Tominaga K, Nishimura T, Yano M, Kiyokawa E, Noguchi M. et al. An autocrine/paracrine circuit of growth differentiation factor (GDF) 15 has a role for maintenance of breast cancer stem-like cells. Oncotarget. 2017;8:24869-81
58. La Manna G, Ghinatti G, Tazzari PL, Alviano F, Ricci F, Capelli I. et al. Neutrophil gelatinase-associated lipocalin increases HLA-G(+)/FoxP3(+) T-regulatory cell population in an in vitro model of PBMC. PloS One. 2014;9:e89497
59. Kudo-Saito C, Shirako H, Ohike M, Tsukamoto N, Kawakami Y. CCL2 is critical for immunosuppression to promote cancer metastasis. Clin Exp Metastasis. 2013;30:393-405
60. Sancho P, Barneda D, Heeschen C. Hallmarks of cancer stem cell metabolism. Br J Cancer. 2016;114:1305-12
61. Tamada M, Nagano O, Tateyama S, Ohmura M, Yae T, Ishimoto T. et al. Modulation of glucose metabolism by CD44 contributes to antioxidant status and drug resistance in cancer cells. Cancer Res. 2012;72:1438-48
62. Zhao B, Wang Y, Tan X, Zheng X, Wang F, Ke K. et al. An Optogenetic Controllable T Cell System for Hepatocellular Carcinoma Immunotherapy. Theranostics. 2019;9:1837-50
Author contact
![]() Corresponding author: Dr. Manlio Vinciguerra, PhD - International Clinical Research Center, St. Anne's University Hospital, Brno, Czech Republic. Tel: +420 511158277. E-mail: manlio.vinciguerracz.
Corresponding author: Dr. Manlio Vinciguerra, PhD - International Clinical Research Center, St. Anne's University Hospital, Brno, Czech Republic. Tel: +420 511158277. E-mail: manlio.vinciguerracz.