Impact Factor
- Issue 14; 2026
- Issue 13; 2026
- Issue 12; 2026
- Issue 11; 2026
- Issue 10; 2026
- Volume 16; 2026
- Advance Articles
- Past Issues
- Cover Images
- Cover Suggestion
- Index & Coverage
- Special Issues
Introduction
Results
Discussion
Materials and Methods
Supplementary Material
Acknowledgements
References
International Journal of Biological Sciences
International Journal of Medical Sciences
 Global reach, higher impact

Theranostics 2019; 9(15):4542-4557. doi:10.7150/thno.35282 This issue Cite
Research Paper
Host-derived fecal microRNAs can indicate gut microbiota healthiness and ability to induce inflammation
Emilie Viennois1 ![]() , Benoit Chassaing1,2, Anika Tahsin1, Adani Pujada1, Lixin Wang1,3, Andrew T. Gewirtz1, Didier Merlin1,3
, Benoit Chassaing1,2, Anika Tahsin1, Adani Pujada1, Lixin Wang1,3, Andrew T. Gewirtz1, Didier Merlin1,3
1. Institute for Biomedical Sciences, Center for Inflammation, Immunity and Infection, Digestive Disease Research Group, Georgia State University, Atlanta, GA, USA.
2. Neuroscience Institute, Georgia State University, Atlanta, GA, USA
3. Veterans Affairs Medical Center, Decatur, GA, USA
Received 2019-3-28; Accepted 2019-4-24; Published 2019-6-9
Abstract

Disruption of intestine-microbiota symbiosis can result in chronic gut inflammation. We hypothesize that assessing the initial inflammatory potential of the microbiota in patients is essential and that host-derived miRNAs, which can be found in feces, could fulfill this function. We investigated whether the gut microbiota composition impacts the fecal miRNA profile and thereby indicates its ability to influence intestinal inflammation.
Methods: We used high-throughput qPCR to compare fecal miRNA profile between germ-free and conventional mice. Conventionalization of germfree mice by various colitogenic and non-colitogenic microbiotas (IL10-/- and TLR5-/- associated microbiota) was performed.
Results: We identified 12 fecal miRNAs impacted by the presence of a microbiota. Conventionalization of germfree mice by various colitogenic and non-colitogenic microbiotas associated with the development of intestinal inflammation (IL10-/- and TLR5-/- associated microbiota) yielded distinctively altered fecal miRNA profiles compared to that of mice receiving a “healthy” microbiota. Correlation analysis revealed the existence of interactions between the 12 abovementioned miRNAs and specific microbiota members.
Conclusion: These results showed that fecal miRNA profile can be differentially and specifically impacted by microbiota composition, and that miRNA could importantly serve as markers of the colitogenic potential of the microbiota. This is particularly relevant to assess individual state of the microbiota in patients with dysbiosis-related disorders, such as IBD and potentially determine their ability to respond to therapeutics.
Keywords: miRNA, microbiota, inflammation, feces, colitis
Introduction
The gastrointestinal tract harbors a large and diverse microbial community, collectively called the microbiota, that normally promotes host health [1]. Disruption of the symbiosis between the microbiota and the intestine (called dysbiosis) is associated with various inflammatory pathologies, including inflammatory bowel disease (IBD) and metabolic syndrome. Dysbiosis, which is defined as a detrimental change in the microbiota composition, is suggested to be a determining event in IBD pathogenesis [2, 3]. Studies in animal models of IBD have illustrated that bacteria contribute to this process. For example, interleukin (IL)10-knockout (IL10-/-) mice are highly prone to developing colitis, but the extent and severity of such colitis is highly dependent upon their microbiota composition, with colitis failing to develop in mice maintained under germ-free (GF) conditions. Moreover, the severity of colitis in mice housed under normal conditions is decreased by the administration of antibiotics [4, 5]. Alterations in gut microbiota have been observed in patients with Crohn's Disease (CD) [6], and some IBD patients have reportedly shown improvement following antibiotic treatment [7]. Principal component analysis (PCoA) of microbiota composition can be used to clearly separate IBD patients from healthy controls [1]. Given that dysbiosis is now recognized as playing a central role in IBD fecal microbiota transplantation (FMT) would seem an appealing strategy to treat this disorder. However, the clinical outcomes have remained very heterogenous so far [8], suggesting that an assessment of the initial inflammatory potential of the microbiota of the patient is needed. Our study suggests that fecal miRNAs, whose profile is dependent on microbiota alterations that are functionally relevant, could be used as a new tool to assess microbiota healthiness. A series of recent studies found that colitis-associated microbiotas, commonly exhibit increased levels of bioactive flagellin (FliC) and lipopolysaccharide (LPS), which can respectively activate TLR5, the FliC-responsive NLRC4 inflammasome, and TLR4 [9-11]. Per previously report [9-11], we therefore used FliC and LPS levels as markers of the pro-inflammatory potential of the microbiota also referred herein as microbiota healthiness.
miRNAs are secreted from intestinal epithelial cells in the lumen and accumulate in feces. Fecal miRNAs were first observed in 2008 [12], and several subsequent studies revealed that they are altered in colorectal cancer [13, 14]. An extensive body of work has sought to elucidate the reciprocal interactions between the microbiota and the host, but this work is far from complete [15]. Recent studies suggest that miRNAs could be a third contributor to that dialog. Although fecal miRNAs are known to play a functional role in the intestine [16], we know relatively little about their relationship with the host microbiota. The first observation of crosstalk between host miRNAs and the microbiota was made in 2011 [17], when GF mice were colonized with the microbiota of pathogen-free mice. Nine miRNAs were identified as being differentially expressed in the ilea and colons of colonized mice compared to GF mice. miRNA array analyses revealed that more miRNAs were differentially expressed in the colon than in the ileum, possibly because the bacterial load increases gradually from the stomach to the small intestine and reaches its maximum in the colon. Among the miRNAs that were differentially expressed in the ileum and colon, mmu-miR-665 was shown to regulate the expression of Abcc3 in response to colonization, providing the first example of microbiota-induced miRNA-mediated modulation of host gene expression. Subsequently, a similar study emphasized the emerging concept that there is an interplay between the endogenous microbiota and gut miRNAs [18]. The authors showed that the microbiota affects the cecal miRNA signature, and that the genes predicted to be targeted by the deregulated miRNAs tended to encode proteins that are involved in maintaining barrier function. Although the authors did not pursue any further functional analysis, their study provided another example of how the miRNA-microbiota tandem can regulate host gene expression. A more recent report found that host fecal miRNAs can regulate microbial fitness and gene expression [19]. Interestingly, the authors showed that mice deficient for the miRNA-generating protein, Dicer, had dysbiosis and were more susceptible to colitis than wild-type (WT) mice, demonstrating that the host can actively affect the microbial community through miRNAs.
Together, these recent studies have revealed the existence of a trialogue among the intestinal microbiota, fecal miRNAs, and the host. However, we did not previously identify how the microbiota and its composition can affect fecal miRNA levels. Here, we investigated whether the gut microbiota can affect the fecal miRNA profile. Our findings indicate that fecal miRNA levels are associated with the microbiota composition in a manner that permits the miRNA profile, but not necessarily the microbiota composition, to indicate the inflammatory potential of the microbiota and, consequently, its potential for contributing to an inflammatory disease, such as IBD.
Results
The fecal microbiota affects the fecal miRNA profile
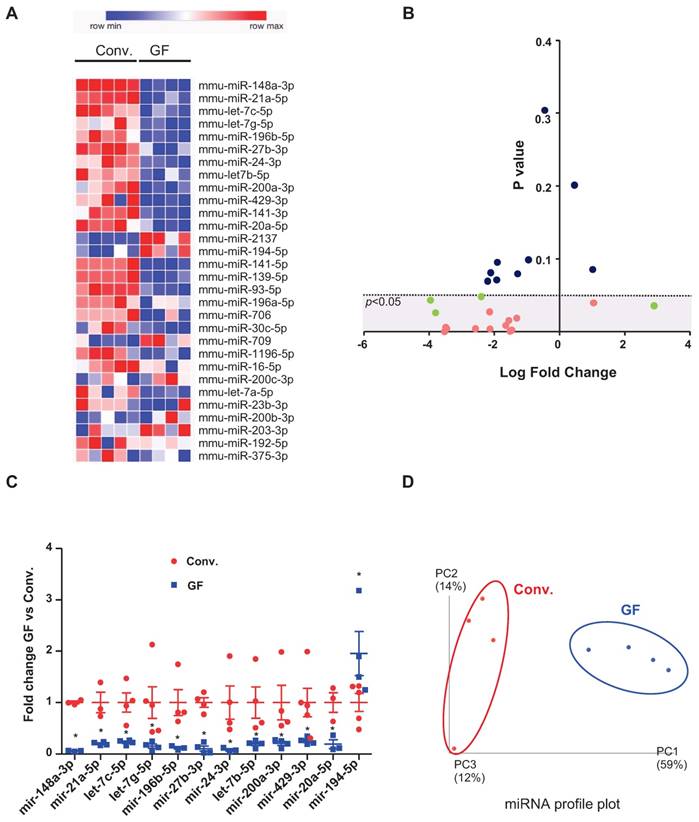
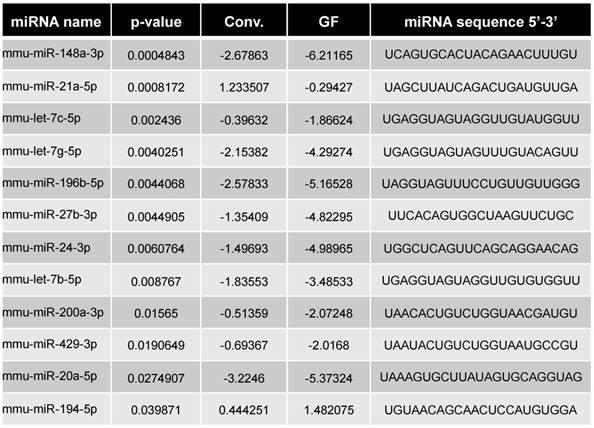
Our previous study suggested that colonic miRNAs can mediate microbiota-to-host communication [17]. Here, to more rigorously and thoroughly explore this concept, we first examined how the complete absence of a microbiota impacts fecal miRNA profiles. Fecal miRNAs were analyzed in feces of conventionally raised and GF C57/Bl6 mice, using a high-throughput qPCR-based technology that screened 752 miRNAs (Figure 1). The heat-map shows the 30 most deregulated miRNAs in GF mice compared to conventionally raised mice (Figure 1A). Using the Student's t-test, we identified 16 miRNAs with p-values lower than 0.05 (pink and green dots, Figure 1B). Only miRNAs with at least three values per group were selected (pink dots); those with fewer than three values per groups were excluded (green dots) from the subsequent analyses. The top 12 selected microbiota-dependent deregulated miRNAs are shown in Figure 1C and listed in Table 1. Most of the differentially expressed miRNAs exhibited reduced expression in GF mice compared to the conventionalized mice suggesting that, in general, the presence of a microbiota increases the expression of fecal miRNAs (Figure 1C). We plotted the results using PCoA, which showed that the fecal miRNA profiles differed significantly between GF and conventionalized mice (Figure 1D).
miRNA profiles in feces of germ-free versus conventionalized mice. Three-weeks old male and female germ-free (GF) mice were either kept sterile or conventionalized (conv.) with a WT microbiota from one donor. Fecal were collected 42 days post-transplantation and fecal miRNA were profiled by high-throughput qPCR-based technology. Heat-map of the 30 most deregulated miRNAs (A). Volcano Plot representing the miRNA fold change versus the p value in the feces of conv. and GF mice. miRNAs with non-significant fold changes (blue) and with significant fold changes but fewer than three values per group (green) were excluded from subsequent analyses, while those that passed the significance cutoff and had more than three values per group were selected for further analyses (pink). Dotted line = limit of significance (p < 0.05) (B). Expression profiles of 12 selected deregulated miRNA in GF mice compared to conv. mice. The average expression of each miRNA in conv. mice was set to 1. *p < 0.05 (C). Conv. or GF mice were clustered using normed principal coordinate analysis (PCoA) of the expression levels of the top 12 deregulated miRNAs (D) (n=4-5).
Differentially expressed miRNAs in GF vs. Conv mice
Transplant of colitis-associated microbiota to WT germ-free mice also transfers its colitogenic potential
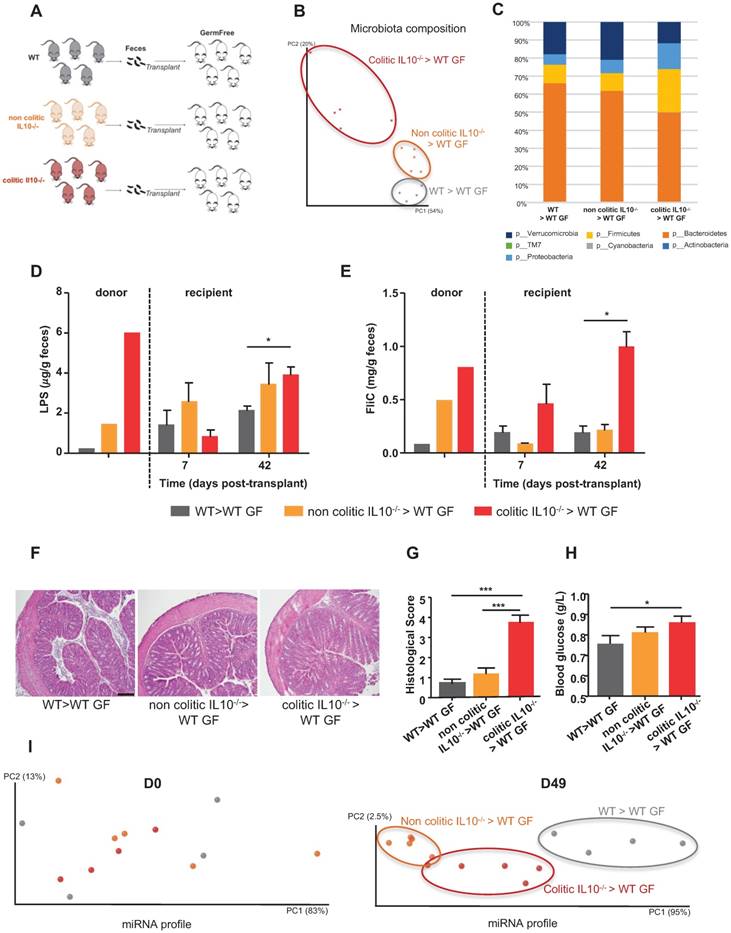
To investigate how the microbiota composition impacts miRNA levels, we conventionalized WT GF mice via transplantation of microbiotas from WT, non-colitic IL10-/- or colitic IL10-/- mice (Figure 2A). First, we analyzed the microbiota composition by 16S sequencing of the three groups of recipient mice at day 42 (D42) post-transplantation, in order to determine if the various microbiotas were transferred to their intended recipients (Figure 2B-C and Figure S1A). Visualization of the microbiota composition by PCoA of the UniFrac distance (as an unbiased method) confirmed that microbiotas of different compositions were transferred and stabilized in the recipient mice (Figure 2B). Mice that received a colitic IL10-/- microbiota were enriched for members of phylum Proteobacteria, which is consistent with a previous report investigating the microbiota of IL10-/- mice [20]; they were also enriched for members of phylum Firmicutes and depleted of members of phylum Bacteroidetes (Figure 2C and Figure S1A). In contrast, the microbiota of mice that received a non-colitic IL10-/- microbiota differed only slightly from those that received a WT microbiota (Figures 2C, S1A). Albeit a constant genotype (WT), mice recipient of various microbiota maintained those differences. This could be explained by the appearance of an inflammation triggered by the colonizing microbiota. The extent to which successful transplantation/stabilization of the different microbiotas was accompanied by transfer of their inflammatory potential was investigated by measuring bioactive fecal levels of LPS and FliC [9-11]. Mice that received the microbiota from colitic IL10-/- mice were found to harbor a proinflammatory microbiota at D42 post-conventionalization, as assayed by fecal LPS and FliC levels, while the proinflammatory potential of mice receiving microbiota from non-colitic IL10-/- mice was only moderately elevated compared to mice receiving microbiota from WT mice (Figure 2D-E). Phenotypically, the recipient mice did not display severe inflammation, as observed by histological examination (Figure 2F), monitoring of body weight over time (Figure S1B) and myeloperoxidase (MPO) assays (Figure S1C). However, we observed a modest but significant increase in the histological score (Figure 2G) in mice that received microbiota from colitic IL-10-/- mice. Levels of fecal LCN-2 (a broad and dynamic marker of inflammation) was analysed (Figure S1D). Significantly higher levels of fecal LCN-2 levels were measured at D7 post-transplant in IL-10-/- microbiota recipient mice compared to mice receiving WT microbiota. However, at D42 post-transplant, levels of LCN-2 equalized between IL-10-/- microbiota and WT microbiota recipient mice. At D42 post-transplant, LCN-2 levels were more elevated in mice recipient of a non-colitic IL10-/- microbiota than in mice receiving a WT microbiota. One characteristic feature of low-grade inflammation is the presence of a higher fasting blood glucose level. Indeed, we observed an increase in blood glucose among IL-10-/- microbiota recipient mice, and found that this change was not associated with a difference in body weight (Figure 2H and S1B).
Fecal microbiota transplant affects the fecal miRNA population. Three-weeks old male and female GF C57BL/6 mice were conventionalized via microbiota transplant from single WT, non-colitic IL10-/- or colitic IL10-/- female donor mice. A, Schematic representation of the experiment. B, Principal coordinate analysis (PCoA) of the weighted UniFrac distance matrix of fecal microbiota from WT (gray), non-colitic IL10-/- (orange) and colitic IL10-/- (red) microbiota-recipient mice at day 42 (D42) post-transplant. C, Taxonomic summary at the phylum level. D-E, Bioactive levels of fecal lipopolysaccharide (D) and flagellin (E) were assayed using TLR5 and TLR4 reporter cells. F, Colons of WT mice transferred with WT, non-colitic IL10-/- or colitic IL10-/- microbiota were paraffin-embedded, sectioned and stained with H&E. Bars = 100 mm. G, Histological scores. H, Fasting blood glucose. I, miRNA profiles analyzed from the feces of recipient mice at D0 and D49 post-transplant. PCoA of the expression levels of the top 12 deregulated miRNAs identified in WT (gray), non-colitic IL10-/- (orange) and colitic IL10-/- (red) microbiota-recipient mice. Data are presented as the means ± SEM (n=5 per group). Significance was determined by two-way ANOVA followed by Bonferroni post-hoc test. *, p<0.05; ***, p<0.001.
Alterations of the microbiota composition and function can affect fecal miRNAs
Administration of microbiota to GF mice (i.e., conventionalization) induced a marked change in their fecal miRNA profile (Figure 1). However, we did not know the extent to which this reflected a general consequence of conventionalization versus a differential impact related to the composition of the transplanted microbiota. To investigate the impact of the microbiota composition on the fecal miRNA profile, independent of host genotype, we performed fecal transplant to WT GF mice, as shown schematically in Figure 2A. Fecal miRNA profiles were analyzed at D0 and D49 post-transplant and PCoA was used to visualize the expression levels of the 12 miRNAs that we had identified (Figure 1, Table 1) as being regulated by microbiota. PCoA yielded clear clustering of the three groups at D49 (post-conventionalization) but not at D0 (before conventionalization) (Figure 2I). These results collectively indicate that the miRNA profile is influenced by the microbiota composition, and that a microbiota prone to favoring intestinal inflammation (i.e., that from colitic IL10-/- mice) has a distinct impact on the fecal miRNA profile compared to a microbiota that lacks this pro-inflammatory potential (WT and non-colitic IL10-/- microbiota). These results suggest that it may be possible to establish an inflammatory-type fecal miRNA signature.
Different colitic-type derived microbiota variously alters fecal miRNAs
To further explore the possibility that a colitogenic microbiota has a distinct impact on the fecal miRNA profile, we conventionalized GF mice via microbiota transplant from WT, colitic IL10-/- or colitic TLR5-/- mice (Figure 3A). 16S sequencing analysis of the microbiota composition in the three groups of recipient mice at D42 post-transplantation confirmed that the various microbiotas were successfully transferred (Figure 3B-C and Figure S2A). PCoA of the UniFrac distance confirmed that microbiotas of different compositions were transferred and stabilized in the recipient mice, as there was clear clustering according to the type of transplanted microbiota (Figure 3B). The PCoA plot also shows that a same donor lead to the presence of a similar microbiota in its recipient mice even if they are not hosted in the same cages.
Colitogenic microbiota differentially affect the fecal miRNA population. Three-weeks old male and female GF C57BL/6 mice were conventionalized via microbiota transplant from single WT, colitic IL10-/- or colitic TLR5-/- female donor mice. WT microbiota colonization was performed from the same WT donot to two different set of recipient mice housed in two different isocages (cage 1, n=5; cage 2 n=3). A, Schematic representation of the experiment. B, PCoA of the weighted UniFrac distance matrix of fecal microbiota from WT (gray, 1 and 2 indicate that recipient mice were respectively housed in cage 1 and 2 after microbiota transplantation), colitic IL10-/- (red) and colitic TLR5-/- (green) microbiota-recipient mice at D42 post-transplant. C, Taxonomic summary at the phylum level. D and E, Bioactive levels of fecal lipopolysaccharide (D) and flagellin (E) were assayed using TLR5 and TLR4 reporter cells. F, Colons of WT mice transferred with WT, colitic IL10-/- or TLR5-/- microbiota were paraffin-embedded, sectioned and stained with H&E. Bars = 100 mm. G, Histological score. H, Fasting blood glucose. I, miRNA profiles were analyzed in the feces of recipient mice at Day 0 and Day 49 post-transplant. PCoA of expression levels of the top 12 deregulated miRNAs identified in WT (gray, 1 and 2 for cages 1 and 2 respectively), colitic IL10-/- (red) and colitic TLR5-/- (green) recipient mice. Data are presented as the means ± SEM (n=5-8 per group, n=5 in IL10-/- and TLR5-/- microbiota recipient mice, n=8 in WT microbiota recipient mice). Significance was determined by two-way ANOVA followed by Bonferroni post-hoc test. ***, p<0.001; *, p<0.05.
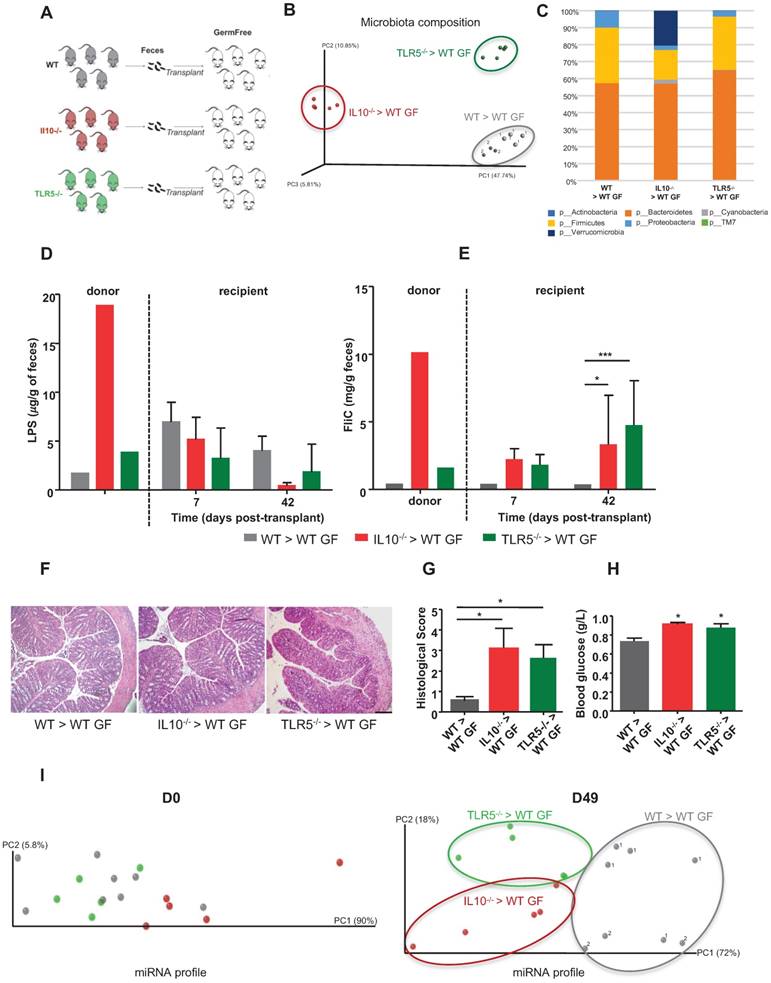
Mice recipient of the same WT donor, were housed in two separated cages (1 and 2) but that they cluster together based on their microbiota composition and relatively to the mice recipient of other types of microbiota. This observation rules out the effect of random environmental and/or post-transplant cage effects (Figure 3B). In this experiment, the differences in microbiota composition associated with transplantation of IL10-/- microbiota were driven by enrichment in Verrucomicrobia and depletion of Firmicutes (Figure 3C and Figure S2A), which is consistent with a previous report showing that inflammation in IL10-/- mice was associated with significantly increased levels of Verrucomicrobia [20]. The microbiota composition in recipients of TLR5-/- microbiota differed only slightly from that of mice that received the WT microbiota (Figure 3C and S2A) and was mainly characterized by a decreased abundance of Proteobacteria which is contradictory with some previous findings showing that increased abundance of Proteobacteria was associated to colitis and colorectal cancer [20]. However, we also noted a concomitant increase in Bacteroidetes that might counteract the potential anti-inflammatory effect of the proteobacteria explaining the presence of low-grade inflammation only in the recipient mice (Figure 3G). To investigate whether the successful transplantations of the different microbiotas were accompanied by transfer of their inflammatory potential, we measured fecal levels of LPS and FliC using a cell-reporter assay. Mice that received microbiotas from colitic IL10-/- and colitic TLR5-/- mice were found to harbor proinflammatory microbiotas at D42 post-conventionalization, based on their fecal FliC loads (Figure 3D-E). Phenotypically, the recipient mice did not display severe inflammation, as assessed by histological examination (Figure 3F), monitoring of body weight over time (Figure S2B) and myeloperoxidase (MPO) assay (Figure S2C). However, TLR5-/- and IL10-/- microbiota-recipient mice exhibited low-grade inflammation, as detected by histological scoring (Figure 3G) and increased blood glucose (Figure 3H), without any significant change in body weight (Figure S2B). We also analyzed the miRNA profiles in the feces of recipient mice at D0 and D49 post-transplant. PCoA of the expression levels of microbiota-regulated miRNAs in recipients of WT, colitic IL10-/- and colitic TLR5-/- microbiotas showed clear clustering of the three groups at D49 post-conventionalization but not at D0 (before conventionalization) (Figure 3I). These results indicate that although mice harboring distinct colitogenic microbiotas exhibit similar degrees of inflammation (Figure 3F-G), they have distinct miRNA profiles. That said, the miRNA profiles still exhibit general similarities that are sufficient to enable these mice to be identified as being prone to developing inflammation.
Fecal miRNA profiling identify microbiota healthiness more than the microbiota composition does
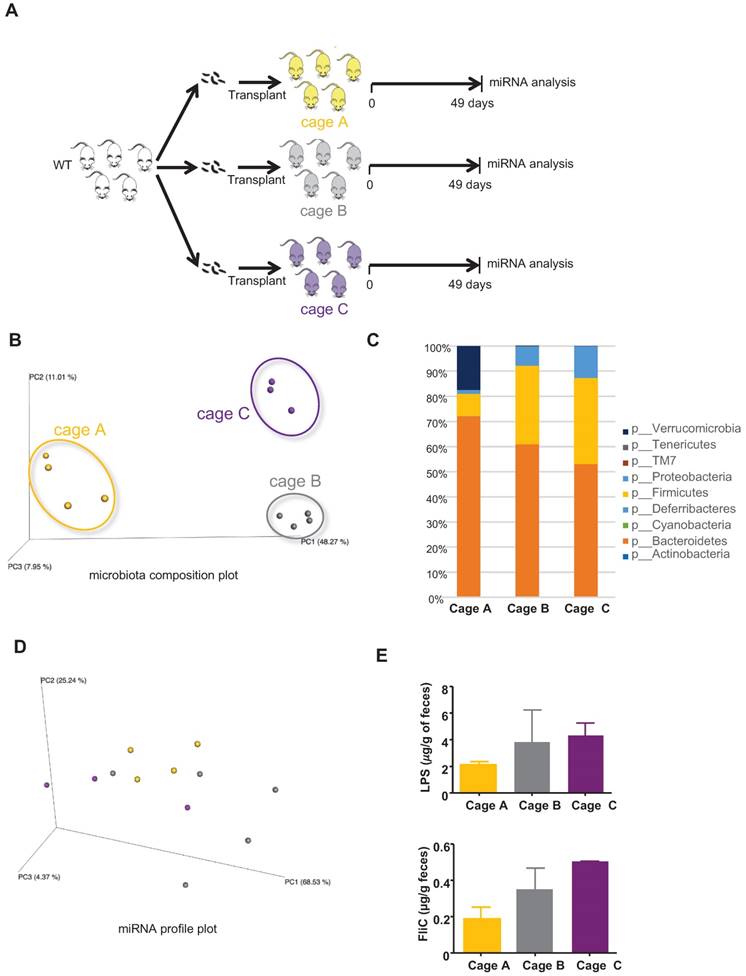
A wide variety of factors can yield differences in microbiota composition, such that even individual cages of closely related mice maintained under the same conditions will often display small but statistically significant differences in microbiota composition (often referred to as “cage clustering”). Hence, we sought to investigate the extent to which such seemingly unimportant differences (in functional terms) of microbiota composition might impact the miRNA profile. GF mice were conventionalized via transplantation of WT microbiotas and hosted in three different cages, and bacteria-regulated miRNAs were analyzed by PCR (schematized in Figure 4A). As expected, we observed marked cage clustering in the microbiota compositions of recipient mice from the three cages (Figure 4B) that is also observed in the taxa summary chart (Figure 4C). In contrast, we observed only modest differences in their miRNA profiles (Figure 4D). The changes in the microbiota composition are however not associated with a change in its pro-inflammatory potential as shown by the levels of LPS and FliC (Figure 4E). These results suggest that the fecal miRNA profile does not reflect minor changes in the microbiota composition, but rather reveals functionally significant alterations. When an analysis focuses on the microbiota composition, interexperimental variations are observed mostly due to differences in the utilized donors. An example of this is seen in comparing Figures 2C and 3C. However, when using our novel fecal miRNAs panels, similar clustering effects are observed between Figure 2I and Figure 3I despite the lower abundance of Verrucomicrobia in the WT microbiota recipient group observed in Figure 3C compared to the same group in the experiment described in Figure 2C. Thus, compared to an analysis of microbiota composition, our panel can better assess the function and pro-inflammatory potential of the microbiota.
miRNA profiles in the feces of mice transplanted with WT microbiota in two independent experiments. A, Single WT female donor microbiota was transplanted to three groups of 3 weeks-old WT female and male recipient mice hosted in three independent cages (cages A, B and C) in two independent experiments (experiment 1: cage A, n=4; experiment 2: cages B, n=5 and C, n=3). B, PCoA of the expression levels of the top 12 deregulated miRNAs in cages A, B and C in experiments 1 and 2. C, Taxonomic summary at the phylum level. D, PCoA of the weighted UniFrac distance matrix of fecal microbiota from WT recipient mice at D49 post-transplant. E, Bioactive levels of fecal lipopolysaccharide (top panel) and flagellin (lower panel) were assayed using TLR5 and TLR4 reporter cells. Significance was determined using a Kruskal-Wallis test followed by a Dunn's post-test.
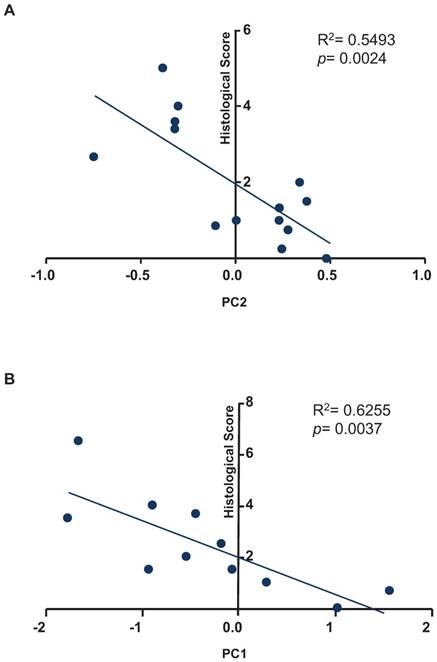
To test whether our fecal miRNA signature could be used to quantify inflammation in recipient mice, we sought to correlate the histological score with the results of our principal coordinate analysis for the fecal miRNA signature (Figure 5). As shown in Figure 5A, a regression analysis identified correlation between the variable, PC2, and the histological scores of samples used in the experiments presented in Figure 2 (R2= 0.5493; p= 0.0024). As shown in Figure 5B, a regression analysis identified correlation between the variable, PC1, and the histological scores of samples used in the experiments shown in Figure 3 (R2= 0.6255; p= 0.0037).
Correlation analysis between principal coordinates from the fecal miRNA signature and histological scores. A, Correlation analysis between the values of principal coordinate 2 from the fecal miRNA signature and histological score from experiment described in figure 2. B, Correlation analysis between the values of principal coordinate 1 from the fecal miRNA signature and histological score from experiment described in figure 3. A F-test was used to determine the significance of the correlation.
Our results together suggest that a fecal miRNA signature can be used to identify the inflammatory potential of the microbiota, discriminate among colitogenic microbiota from different origins, indicate the resultant inflammatory status and that a fecal miRNA signature could prove useful as a tool for assessing the composition and potential to induce inflammation of the gut microbiota.
Microbiota taxa correlate with fecal miRNAs
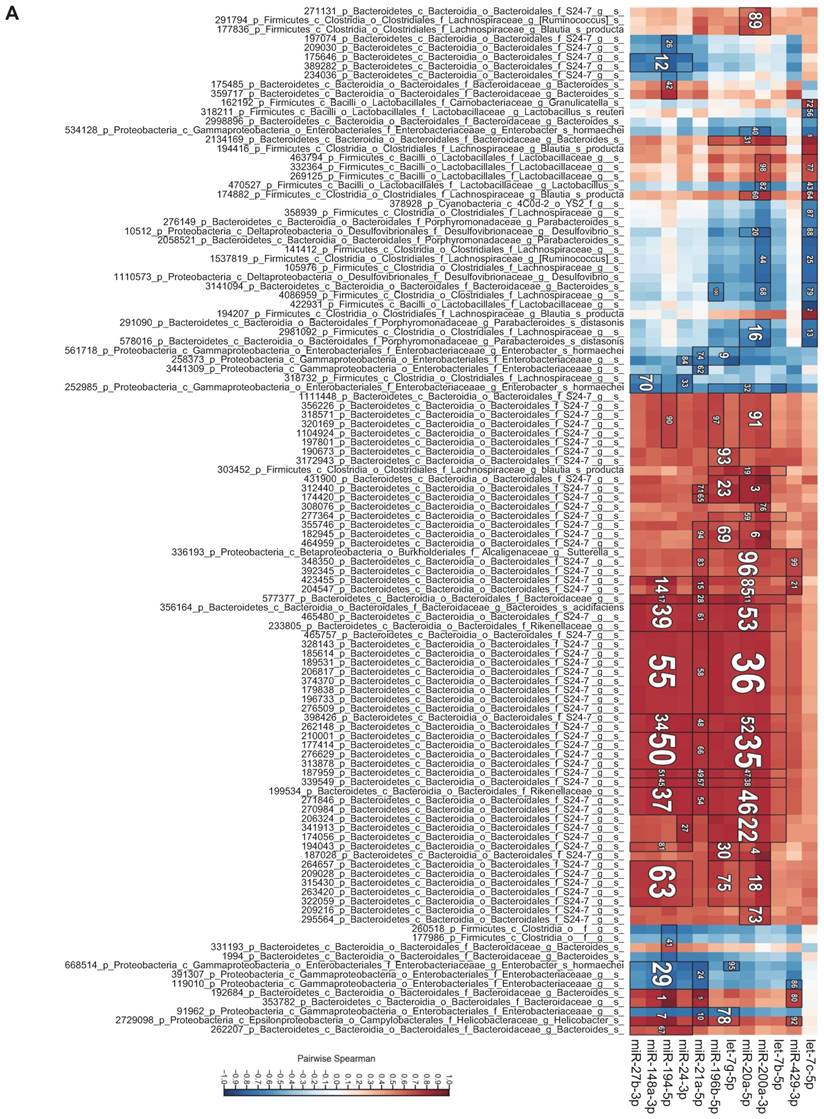
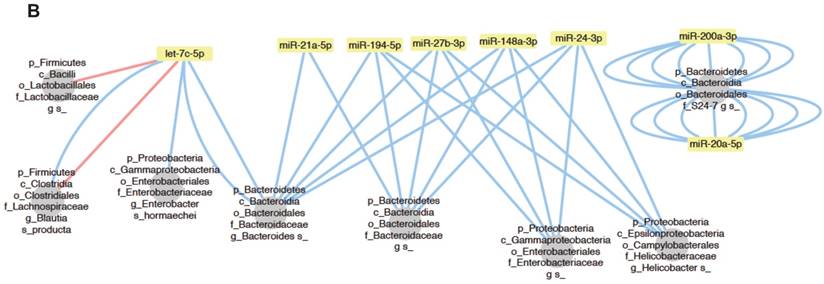
To investigate the relationship between individual miRNAs and the microbiota, we performed correlation analysis via Hierarchical All-against-All association testing (HAllA), which is a computational method that may be used to find multi-resolution associations in high-dimensional, heterogeneous datasets such as high-throughput sequencing data [21]. Hierarchical clustering revealed several clusters of significantly correlated miRNAs and bacterial taxa (Figure 6A). To further investigate the relationship between miRNAs and the microbiota, we selected bacteria/miRNA that were highly correlated (q≤0.020) and used Cytoscape to build a network visualizing the relationship between miRNAs and their correlated bacteria (Figure 6B). The correlation network revealed a highly interconnected relationship between these miRNAs and bacteria. Enterobacteriaceae, especially E. coli, are abundant in patients with IBD or colorectal cancer [22, 23], and the inflammation in IL10-/- mice maintains an increased abundance of E. coli, which exacerbates inflammation and colon carcinogenesis [24]. We observed strong positive associations between miR-194-5p, miR-148-3p, miR-27b-3p and Enterobacteriaceae, suggesting that these miRNAs could be intermediaries between Enterobacteriaceae and inflammation. More generally, we found a strong association between Proteobacteria, which were previously reported to be abundant in IL10-/- mice [20] and IBD patients [25], and miR-148-3p and miR-27-3p. Thus, these miRNAs could be mediators of the pathogenesis of Proteobacteria in IL10-/- mice and in human IBD. Overall, our results demonstrate that there are strong interactions between fecal miRNAs and specific species of the intestinal microbiota that likely contribute to maintaining intestinal homeostasis. Conversely, disruption of the normal interactions between miRNAs and bacteria might play important roles in dysbiosis-associated disorders, such as IBD.
Bacteria and fecal miRNA expression levels significantly correlate. A, Heat-map showing bacterial taxa (in rows) that were significantly correlated with various miRNAs (in columns). Red and blue indicate positive and negative correlations, respectively. B, Interaction network showing miRNAs and their correlated bacteria (correlation q-value of ≤ 0.02). Red and blue indicate negative and positive correlations, respectively.
Discussion
Numerous studies have identified associations between alterations in the gut microbiota composition and IBD. Data obtained in animal models of IBD suggest that such alterations in microbiota composition are likely to be both a cause and consequence of the gut inflammation that characterizes this disease state. However, the mediators of the microbiota-intestinal relationship remain poorly defined. Recent evidence indicates that miRNAs can mediate host-microbiota interactions and participate in regulating intestinal health [17, 19]. Fecal miRNAs were also recently suggested as potential biomarkers for IBD and colorectal cancer. This study is the first to investigate the crosstalk between fecal miRNAs and microbiota in the context of colitis. We observed that the intestinal microbiota impacts the profile of fecal miRNAs.
By comparing the miRNA expression profile in feces of GF and conventionalized mice, we observed that the presence of a microbiota induced variation in the miRNA expression profile of feces. The results obtained from our microbiota transplantation experiments indicated that the presence of a microbiota not only induced changes in the fecal miRNA profile, it also led to alterations in its composition and pro-colitogenic potential.
Our study suggests that fecal miRNAs can be used as biomarkers of intestinal and microbiota healthiness, and to identify specific functionally relevant alterations in the microbiota. Compared to 16S sequencing, analysis of the fecal miRNA expression profile could offer a better readout of microbiota-dependent inflammation (as suggested herein) while offering a technologically simpler alternative. Most of the studies (including our own) that have suggested that miRNAs and miRNA signatures may be useful as potential biomarkers for IBD have investigated circulating miRNAs [26-29]. More recently, fecal content has emerged as new and interesting source of miRNA biomarkers for IBD and colorectal cancer [12]. For example, fecal miRNAs were proposed as potential biomarkers for colorectal cancer [13, 30], and a recent study showed that miRNAs in feces correlate with disease activity in IBD patients, and thus warrant further study as potential biomarkers for this disease [31]. A limitation of our analysis is that, due to material limitations, microbiota and miRNA profiles were not analyzed at the same time point in our recipient mice. miRNA profile was hypothesized to be a consequence of a certain microbiota composition explaining our choice to analyze miRNAs at a later time point than the last microbiota composition.
Our correlation analyses identified interactions between the microbial community in the gut and fecal miRNAs. This finding suggests that fecal miRNAs could mediate and/or modulate dysbiosis-related inflammation in the host. Specifically, we identified strong correlations between miR-194-5p and let-7c-5p and certain bacterial families, such as Enterobacteriaceae, whose presence and abundance were previously shown to be associated with IBD [32]. We also found that members of Helicobacter, which were previously shown to drive the inflammatory process in IL10-/- mice [33], showed a highly significant association with miR-194-5p, suggesting that this miRNA may be involved in this inflammatory process. Moreover we recently showed that miR-194-5p was highly increased in the sera of IL10-/- mice after they developed colitis compared to the same mice before they developed colitis, whereas this miRNA was not altered in sera from other tested mouse model of colitis and inflammation [28]. Our observation that miR-194 was significantly downregulated in conventionally raised WT mice could be seen as an anti-inflammatory event that appears to oppose our previous results obtained using the sera of IL10-/- colitic mice [28]. However, we previously observed that miR-194-5p was altered in this model, but not the other studied inflammatory conditions. Based on this, we suggest that the alteration of miR-194-5p is specific to the model (IL10-/- mice) rather than the inflammation status. The miRNAs found to differ in conventionalized mice compared to GF mice included three (miR-148a-3p, miR-21a-5p, and miR-194-5p) that we had previously found to be significantly altered in serum in the presence of colitis [28], as well as others that were either unaltered in our previously studied system or non-detectable in serum. We generally agree with Liu et al. [19] that the miRNAs found in feces are secreted from the intestinal epithelium. Even if the same miRNA is found in circulating blood, it is currently unknown whether serum and fecal miRNAs arise from the same cellular source. The colitis-model-specificity of the circulating miRNA profile observed in our previous study [28] and our present observations suggesting that the identified fecal miRNA signature could be used to differentiate various microbiota together suggest that there is an interplay between miRNAs and the microbiota, which together participate in the unique pathogenic processes specific to each model.
Previous studies have demonstrated that differential host tissue miRNA expression, which is influenced by the microbiota, in turn regulates host gene expression, potentially impacting pathways relevant to host physiology and disease status [17, 34]. Our group previously showed that GF mice exhibit altered expression of miRNAs in the ileum and colon compared to conventionally raised mice, and that miR-665 could regulate the expression of the host gene, Abcc3 [17]. A comparable microbiota-miRNA-host pathway interaction was observed in a recent study demonstrating that commensal bacteria can induce miR-21a-5p expression in intestinal epithelial cells, and that this affects intestinal epithelial permeability via PTEN and PDCD4 (two known targets of miR-21a-5p)-dependent deregulation of ARF4 [34]. These studies highlighted the functional role played by host miRNAs in microbiota-to-host communication and suggest that, in the context of IBD or other dysbiosis-related conditions, miRNAs might mediate the impact of dysbiosis on the host via target genes.
Overall, our study, together with previous evidence, suggests that fecal miRNAs are likely to mediate communication between the microbiota and the host in IBD and in other conditions, including colorectal cancer [35]. The importance of fecal miRNAs further suggests that these entities could prove useful as potential new tools for diagnosing and monitoring microbiota-dependent inflammation such as IBD. Such a strategy could be more practically feasible than 16S microbiota sequencing if we develop effective methodologies to perform direct quantification of absolute miRNAs in a reliable and simple manner. Significant progress toward this end has been made with the development of a microelectrode miRNA sensor that allows for the one-step detection of miRNAs within 10 min [36]. Meanwhile, if follow-up studies demonstrate that fecal miRNAs also play active roles in the interactions between the host and the microbiota in the context of IBD, miRNAs would also be appropriate as new therapeutic tools that could act on the host and/or the microbiota to ultimately benefit IBD patients.
Materials and Methods
Germ-free mice
Female and male germ-free C57BL/6 mice were kept under germfree conditions in a Park Bioservices isolator in our germ-free facility.
Conventionalization by microbiota transplantation and sample collection
Fecal contents from individual IL10-/- before or after they developed colitis (non colitic, colitic), TLR5-/- and WT mice were suspended in 30% glycerol diluted in PBS (1.0 mL) and stocked at 80ºC until analysis. Both male and female germ-free were either kept sterile or conventionalized. For conventionalization, male and female germ-free C57BL/6 mice (3 weeks-old) were removed from the isolator at weaning and were orally administered 200μL of a fecal suspension obtained from a glycerol stocks of a single donor mouse for each transplanted group. Microbiota transplant experiment displayed Figure 2 and 3 are independent experiments with different donor mice. Mice were fed Purina 5001 Laboratory Rodent diet, a standard diet broadly used in many research facilities. Four to five pellets of feces from the recipient mice were collected in the morning at D0, D42 and D49 post-transplant for microbiota sequencing and miRNA expression analyses. Mice were euthanized at D49 and tissues collected for analysis. All the experiments involving mice were approved by institutional animal care and use committee (IACUC, Georgia State University Atlanta, GA, USA).
H&E Staining of Colonic Tissue and Histopathologic Analysis
Mouse colons were fixed in 10% buffered formalin for 24 hours at room temperature and then embedded in paraffin. Tissues were sectioned at 5-μm thickness and stained with hematoxylin & eosin (H&E) using standard protocols. Images were acquired using a Zeiss Axioskop 2 plus microscope (Carl Zeiss MicroImaging) equipped with an AxioCam MRc5 CCD camera (Carl Zeiss). Histological scoring was blindly determined on each colon as previously described and with a slight modification [37, 38]. Briefly, each colon was assigned four scores based on the degree of epithelial damage and inflammatory infiltrate in the mucosa, submucosa and muscularis/serosa [39]. Each of the four scores was multiplied by a coefficient 1 if the change was focal, 2 if it was patchy and 3 if it was diffuse [38] and the 4 individual scores per colon were added. The scores for each of five mice per treatment group were averaged.
Overnight fasting blood glucose measurement
Mice were placed in a clean cage and fasted for 15h. Blood glucose concentration was then determined using a Nova Max Plus Glucose Meter and expressed in g/L.
Fecal flagellin and LPS load quantification
Flagellin and LPS were quantified as previously described [9] using human embryonic kidney (HEK)-Blue-mTLR5 and HEK- BluemTLR4 cells, respectively (Invivogen). Briefly, fecal material was resuspended in PBS to a final concentration of 100 mg/mL and homogenized using a Mini-Beadbeater-24 without the addition of beads to avoid bacteria disruption. Supernatants were serially diluted and applied to mammalian cells. Purified flagellin from Salmonella typhimurium and LPS from Escherichia coli (Sigma) were used for standard curve determination. After 24 hours of stimulation, cell culture supernatants were applied to QUANTI-Blue medium (Invivogen) and alkaline phosphatase activity was measured at 620 nm after 30 minutes.
Colonic myeloperoxidase (MPO) assay
Neutrophil influx in tissue was analyzed by assaying the enzymatic activity of MPO, a marker for neutrophils as previously described [37]. Briefly, colons were homogenized at 50mg/ml in 0.5% hexadecyltrimethylammonium bromide (Sigma, St. Louis, MO) in 50 mM PBS, (pH 6.0), freeze-thawed 3 times, sonicated and centrifuged. MPO was assayed from the supernatant by adding 1 mg/mL of dianisidine dihydrochloride (Sigma, St. Louis, MO) and 5x10⁻⁴% H2O2. The change in optical density measured at 450 nm. Human neutrophil MPO (Sigma, St. Louis, MO) was used to determine the standard curve. One unit of MPO activity was defined as the quantity necessary to degrade 1.0 μmol of peroxide/min at 25°C [40].
Quantification of fecal Lcn-2 by ELISA
For quantification of fecal Lcn-2 by ELISA, frozen fecal samples were reconstituted in PBS-0.1% Tween 20 to a final concentration of 100 mg/mL and vortexed for 20 min [38]. Homogeneous fecal suspensions were then centrifuged and supernatants were collected. Lcn-2 levels were measured using Duoset murine Lcn-2 ELISA kit according to the manufacturer's instruction (R&D Systems, Minneapolis, Minnesota, USA).
Fecal microbiota analysis by 16S rRNA gene sequencing using Illumina technology
16S rRNA gene amplification and sequencing were done using the Illumina MiSeq technology using a previously published protocol [10]. DNA was extracted from frozen feces using DNeasy powersoil HTP 96 kit (QIAGEN) with mechanical disruption (bead beating 5 minutes). The 16S rRNA genes were amplified by PCR from each sample using a composite forward primer and a reverse primer containing a unique 12-base barcode, which was used to tag PCR products from respective samples [41]. Forward primer 515F 5'-AATGATACGGCGACCACCGAGATCTACACTATGGTAATTGTGTGCCAGCMGCCGCGGTAA-3' was used. The sequence in italic is the 5' Illumina adaptor B and the sequence in bold is the primer pad. The sequence in both italic and bold (GT) is the primer linker. The underlined sequence is the conserved bacterial primer 515F. The reverse primer 806R 5'-CAAGCAGAAGACGGCATACGAGAT XXXXXXXXXXXX AGTCAGTCAG CC GGACTACHVGGGTWTCTAAT-3' was used. The sequence in italic is the 3' reverse complement sequence of Illumina adaptor, the 12X sequence is the Golay barcode, the sequence in bold is the primer pad, and the italicized and bold sequence is the primer linker. The underlined sequence is the conserved bacterial primer 806R. PCR reactions were performed using Hot Master PCR mix (Five Prime), following manufacturer recommendations, PCR products were subsequently purified with AMPure XP magnetic beads (Beckman Coulter Life Sciences), and products were visualized by gel electrophoresis. Products were then quantified by spectrophotometry, and a master DNA pool in equimolar ratios was generated and sequenced using an Illumina MiSeq sequencer (paired-end reads, 2x250 base pairs) at Cornell University, Ithaca.
Sequences were demultiplexed, quality filtered using the Quantitative Insights Into Microbial Ecology (QIIME, version 1.8.0) software package [16, 42], and forward and reverse Illumina reads were joined using the fastq-join method [43]. We used QIIME default parameters for quality filtering, as previously described [10]. Sequences were assigned to OTUs using the UCLUST algorithm [44] with a 97% threshold of pairwise identity (with the creation of new clusters with sequences that do not match the reference sequences), and classified taxonomically using the Greengenes reference database [45]. Principal coordinates analysis (PCoA) plots were used to assess the variation between experimental group (beta diversity), using the unweighted Unifrac distance matrix. Rarefied OTU table were summarized at the phylum level using QIIME software. LEfSE (LDA Effect Size) was used to investigate bacterial members that drive differences between groups [46]. Unprocessed sequencing data are deposited in the European Nucleotide Archive under accession number PRJEB32441.
Fecal microRNA isolation
Total RNAs were extracted from germfree or conventionalized mice fecal supernatant using miRCUCY RNA Isolation- cell and plants kit (Exiqon) following the manufacturer's instructions with some modifications. Briefly, 100 mg of mouse feces was homogenized in 1ml of sterile PBS, spun down at 300 ×g for 10 min. The supernatant was further spun down at 2000 ×g for 15 min and supernatant was filtered through a 0.8 μm filter (Millipore). Lysis buffer containing RNA Spike-In (UniSp2, UniSp4, and UniSp5) was added to fecal supernatant and followed by RNA isolation according to manufacturer's instruction (Exiqon).
Real-time qPCR-based miRNA profiling and data analysis
miRNA profiling was performed by the company Exiqon (http://www.exiqon.com/microRNA-pcr-services) according to their protocol. “The 50 ng RNA was reverse transcribed in 50 μl reactions using the miRCURY LNATM Universal RT microRNA PCR, Polyadenylation and cDNA synthesis kit (Exiqon). cDNA was diluted 100 x and assayed in 10 ul PCR reactions according to the protocol for miRCURY LNATM Universal RT microRNA PCR; each microRNA was assayed once by qPCR on the microRNA Ready-to-Use PCR, Human panel I and panel II using ExiLENT SYBR® Green mastermix. Negative controls excluding template from the reverse transcription reaction was performed and profiled like the samples. The amplification was performed in a LightCycler® 480 Real-Time PCR System (Roche) in 384 well plates. The amplification curves were analyzed using the Roche LC software, both for determination of Cp (by the 2nd derivative method) and for melting curve analysis. The amplification efficiency was calculated using algorithms similar to the LinReg software. All assays were inspected for distinct melting curves and the Tm was checked to be within known specifications for the assay. Futhermore assays must be detected with 5 Cp's less than the negative control, and with Cp<37 to be included in the data analysis. Data that did not pass these criteria were omitted from any further analysis. Using NormFinder the best normalizer was found to be the average of assays detected in all samples. All data was normalized to the average of assays detected in all samples (average - assay Cp).” A student's t-test calculated between the two groups (GF vs. conv.) identified 16 miRNAs with p-values lower than 0.05 which are represented Figure 1B in green and pink dots. Out of the 16, only 12 miRNAs had more than 3 values per groups and were selected for subsequent analyses (pink) and are listed Table 1. While, only the top 10 fulfill the Bernjamini-Hochberg correction, the 12 significant by t-test were selected.
QIIME software was used to analyze the beta-diversity of the Euclidean distance, with principal coordinates subsequently calculated. Emperor software was used to make the 3D-plots. Principal coordinates analysis (PCoA) plots were drafted in order to assess variation between experimental groups.
miRNA expression by qPCR and data analysis
Total RNAs were extracted from fecal supernatant using miRCUCY RNA Isolation -cell and plants kit (Exiqon) according to the manufacturer's instructions with some modifications. Ten nanograms of total RNAs was reversed transcribed using miRCURY LNA Universal RT microRNA PCR protocol using the Universal cDNA synthesis kit II (Exiqon). cDNAs were diluted 1:50 and assayed in 10 μL PCR reactions using custom design Pick & Mix microRNA PCR panels and the ExiLENT SYBR Green master mix following the instruction for miRCURY LNA Universal RT microRNA PCR. Each of the miRNA listed in Table 1 was assayed once by qPCR. Pick-N-Mix qPCR plates were run on RealPlex mastercycler (Eppendorf). miR-200c-3p was chosen as normalizer using NormFinder and expressed as 2ΔCT. QIIME software was used to analyze the beta-diversity of the Euclidean distance, with principal coordinates subsequently calculated. Emperor software was used to make the 3D-plots. Principal coordinates analysis (PCoA) plots were drafted in order to assess variation between experimental groups. All reagents used for quantitative PCR were obtained from Exiqon.
Correlation analysis
We performed correlation analysis between miRNA expression level and microbiota members relative abundances using Hierarchical All-against-All significance testing (HAllA; http://huttenhower.sph.harvard.edu/halla). Relationships between abundance of individual bacteria at the specie level and miRNA expression level were tested using Spearman's rank correlation coefficient. miRNA-bacteria interactions with p<0.02 values were visualized using Cytoscape v3.6.1.
Statistical analysis
Prior to determining the significance with parametric tests, normality was tested using D'Agostino & Pearson omnibus test. For normally distributed samples, significance was determined using either unpaired two-tailed Student's t-test or one-way ANOVA followed by a Bonferroni post-test. Mann-Whitney test or Kruskal-Wallis test followed by a Dunn's post-test were used when samples failed the normality test (GraphPad Prism software). A F-test was used to determine the deviation from zero of the linear regression presented in Figure 5. Histograms are represented with standard error of the mean in order to report the precision of the mean. Differences were noted as significant *p < 0.05, **p < 0.01 and ***p < 0.001.
Supplementary Material
Supplementary figures.
Acknowledgements
This work was supported by the National Institutes of Health of Diabetes and Digestive and Kidney (R01DK116306, R01DK071594, R01DK107739 to D.M.; R01DK099071 to A.G.), the Department of Veterans Affairs (Merit Award BX002526 to D.M.), D.M. is a recipient of a Senior Research Career Scientist Award (BX004476) from the Department of Veterans Affairs. E.V is recipient of the Career Development Award from the Crohn's and Colitis Foundation. B.C. is a recipient of a Career Development Award from the Crohn's and Colitis Foundation and an Innovator Award from the Kenneth Rainin Foundation. The funders had no role in study design, data collection and interpretation, or the decision to submit the work for publication.
Competing Interests
The authors have declared that no competing interest exists.
References
1. Qin J, Li R, Raes J, Arumugam M, Burgdorf KS, Manichanh C. et al. A human gut microbial gene catalogue established by metagenomic sequencing. Nature. 2010;464:59-65
2. Gevers D, Kugathasan S, Denson LA, Vazquez-Baeza Y, Van Treuren W, Ren B. et al. The treatment-naive microbiome in new-onset Crohn's disease. Cell host & microbe. 2014;15:382-92
3. Xavier RJ, Podolsky DK. Unravelling the pathogenesis of inflammatory bowel disease. Nature. 2007;448:427-34
4. Chassaing B, Darfeuille-Michaud A. The commensal microbiota and enteropathogens in the pathogenesis of inflammatory bowel diseases. Gastroenterology. 2011;140:1720-28
5. Kang SS, Bloom SM, Norian LA, Geske MJ, Flavell RA, Stappenbeck TS. et al. An antibiotic-responsive mouse model of fulminant ulcerative colitis. PLoS medicine. 2008;5:e41
6. Manichanh C, Rigottier-Gois L, Bonnaud E, Gloux K, Pelletier E, Frangeul L. et al. Reduced diversity of faecal microbiota in Crohn's disease revealed by a metagenomic approach. Gut. 2006;55:205-11
7. Khan KJ, Ullman TA, Ford AC, Abreu MT, Abadir A, Marshall JK. et al. Antibiotic therapy in inflammatory bowel disease: a systematic review and meta-analysis. The American journal of gastroenterology. 2011;106:661-73
8. Sunkara T, Rawla P, Ofosu A, Gaduputi V. Fecal microbiota transplant - a new frontier in inflammatory bowel disease. J Inflamm Res. 2018;11:321-8
9. Chassaing B, Koren O, Carvalho FA, Ley RE, Gewirtz AT. AIEC pathobiont instigates chronic colitis in susceptible hosts by altering microbiota composition. Gut. 2014;63:1069-80
10. Chassaing B, Koren O, Goodrich JK, Poole AC, Srinivasan S, Ley RE. et al. Dietary emulsifiers impact the mouse gut microbiota promoting colitis and metabolic syndrome. Nature. 2015;519:92-6
11. Chassaing B, Ley RE, Gewirtz AT. Intestinal epithelial cell toll-like receptor 5 regulates the intestinal microbiota to prevent low-grade inflammation and metabolic syndrome in mice. Gastroenterology. 2014;147:1363-77 e17
12. Ahmed FE, Jeffries CD, Vos PW, Flake G, Nuovo GJ, Sinar DR. et al. Diagnostic microRNA markers for screening sporadic human colon cancer and active ulcerative colitis in stool and tissue. Cancer genomics & proteomics. 2009;6:281-95
13. Link A, Balaguer F, Shen Y, Nagasaka T, Lozano JJ, Boland CR. et al. Fecal MicroRNAs as novel biomarkers for colon cancer screening. Cancer epidemiology, biomarkers & prevention: a publication of the American Association for Cancer Research, cosponsored by the American Society of Preventive Oncology. 2010;19:1766-74
14. Yang X, Zhong J, Ji Y, Li J, Jian Y, Zhang J. et al. The expression and clinical significance of microRNAs in colorectal cancer detecting. Tumour biology: the journal of the International Society for Oncodevelopmental Biology and Medicine. 2015;36:2675-84
15. Backhed F, Ley RE, Sonnenburg JL, Peterson DA, Gordon JI. Host-bacterial mutualism in the human intestine. Science. 2005;307:1915-20
16. Ayyadurai S, Charania MA, Xiao B, Viennois E, Zhang Y, Merlin D. Colonic miRNA expression/secretion, regulated by intestinal epithelial PepT1, plays an important role in cell-to-cell communication during colitis. PloS one. 2014;9:e87614
17. Dalmasso G, Nguyen HT, Yan Y, Laroui H, Charania MA, Ayyadurai S. et al. Microbiota modulate host gene expression via microRNAs. PloS one. 2011;6:e19293
18. Singh N, Shirdel EA, Waldron L, Zhang RH, Jurisica I, Comelli EM. The murine caecal microRNA signature depends on the presence of the endogenous microbiota. International journal of biological sciences. 2012;8:171-86
19. Liu S, da Cunha AP, Rezende RM, Cialic R, Wei Z, Bry L. et al. The Host Shapes the Gut Microbiota via Fecal MicroRNA. Cell host & microbe. 2016;19:32-43
20. Arthur JC, Perez-Chanona E, Muhlbauer M, Tomkovich S, Uronis JM, Fan TJ. et al. Intestinal inflammation targets cancer-inducing activity of the microbiota. Science. 2012;338:120-3
21. Hartmann EM, Hickey R, Hsu T, Betancourt Roman CM, Chen J, Schwager R. et al. Antimicrobial Chemicals Are Associated with Elevated Antibiotic Resistance Genes in the Indoor Dust Microbiome. Environ Sci Technol. 2016;50:9807-15
22. Darfeuille-Michaud A, Neut C, Barnich N, Lederman E, Di Martino P, Desreumaux P. et al. Presence of adherent Escherichia coli strains in ileal mucosa of patients with Crohn's disease. Gastroenterology. 1998;115:1405-13
23. Martin HM, Campbell BJ, Hart CA, Mpofu C, Nayar M, Singh R. et al. Enhanced Escherichia coli adherence and invasion in Crohn's disease and colon cancer. Gastroenterology. 2004;127:80-93
24. Arthur JC, Gharaibeh RZ, Muhlbauer M, Perez-Chanona E, Uronis JM, McCafferty J. et al. Microbial genomic analysis reveals the essential role of inflammation in bacteria-induced colorectal cancer. Nat Commun. 2014;5:4724
25. Mukhopadhya I, Hansen R, El-Omar EM, Hold GL. IBD-what role do Proteobacteria play? Nat Rev Gastroenterol Hepatol. 2012;9:219-30
26. Duttagupta R, DiRienzo S, Jiang R, Bowers J, Gollub J, Kao J. et al. Genome-wide maps of circulating miRNA biomarkers for ulcerative colitis. PLoS One. 2012;7:e31241
27. Iborra M, Bernuzzi F, Correale C, Vetrano S, Fiorino G, Beltran B. et al. Identification of serum and tissue micro-RNA expression profiles in different stages of inflammatory bowel disease. Clin Exp Immunol. 2013;173:250-8
28. Viennois E, Zhao Y, Han MK, Xiao B, Zhang M, Prasad M. et al. Serum miRNA signature diagnoses and discriminates murine colitis subtypes and predicts ulcerative colitis in humans. Sci Rep. 2017;7:2520
29. Wu F, Guo NJ, Tian H, Marohn M, Gearhart S, Bayless TM. et al. Peripheral blood microRNAs distinguish active ulcerative colitis and Crohn's disease. Inflamm Bowel Dis. 2011;17:241-50
30. Wang C, Zhao K, Rong Q. Diagnostic Value of Fecal MicroRNAs for Colorectal Cancer: a Meta-Analysis. Clin Lab. 2015;61:1845-53
31. Schonauen K, Le N, von Arnim U, Schulz C, Malfertheiner P, Link A. Circulating and Fecal microRNAs as Biomarkers for Inflammatory Bowel Diseases. Inflamm Bowel Dis. 2018;24:1547-57
32. Morgan XC, Tickle TL, Sokol H, Gevers D, Devaney KL, Ward DV. et al. Dysfunction of the intestinal microbiome in inflammatory bowel disease and treatment. Genome Biol. 2012;13:R79
33. Chichlowski M, Sharp JM, Vanderford DA, Myles MH, Hale LP. Helicobacter typhlonius and Helicobacter rodentium differentially affect the severity of colon inflammation and inflammation-associated neoplasia in IL10-deficient mice. Comp Med. 2008;58:534-41
34. Nakata K, Sugi Y, Narabayashi H, Kobayakawa T, Nakanishi Y, Tsuda M. et al. Commensal microbiota-induced microRNA modulates intestinal epithelial permeability through the small GTPase ARF4. J Biol Chem. 2017;292:15426-33
35. Yuan C, Burns MB, Subramanian S, Blekhman R. Interaction between Host MicroRNAs and the Gut Microbiota in Colorectal Cancer. mSystems. 2018;3:e00205-17
36. Wang T, Wang G, Merlin D, Viennois E. MiRNA Quantitation with Microelectrode Sensors Enabled by Enzymeless Electrochemical Signal Amplification. Methods Mol Biol. 2017;1580:249-63
37. Viennois E, Xiao B, Ayyadurai S, Wang L, Wang PG, Zhang Q. et al. Micheliolide, a new sesquiterpene lactone that inhibits intestinal inflammation and colitis-associated cancer. Lab Invest. 2014;94:950-65
38. Chassaing B, Srinivasan G, Delgado MA, Young AN, Gewirtz AT, Vijay-Kumar M. Fecal lipocalin 2, a sensitive and broadly dynamic non-invasive biomarker for intestinal inflammation. PloS one. 2012;7:e44328
39. Katakura K, Lee J, Rachmilewitz D, Li G, Eckmann L, Raz E. Toll-like receptor 9-induced type I IFN protects mice from experimental colitis. J Clin Invest. 2005;115:695-702
40. Castaneda FE, Walia B, Vijay-Kumar M, Patel NR, Roser S, Kolachala VL. et al. Targeted deletion of metalloproteinase 9 attenuates experimental colitis in mice: central role of epithelial-derived MMP. Gastroenterology. 2005;129:1991-2008
41. Caporaso JG, Lauber CL, Walters WA, Berg-Lyons D, Huntley J, Fierer N. et al. Ultra-high-throughput microbial community analysis on the Illumina HiSeq and MiSeq platforms. ISME J. 2012;6:1621-4
42. Caporaso JG, Kuczynski J, Stombaugh J, Bittinger K, Bushman FD, Costello EK. et al. QIIME allows analysis of high-throughput community sequencing data. Nat Med. 2010;7:335-6
43. Aronesty E. Comparison of Sequencing Utility Programs. The Open Bioinformatics Journal. 2013;7:1-8
44. Edgar RC. Search and clustering orders of magnitude faster than BLAST. Bioinformatics. 2010;26:2460-1
45. McDonald D, Price MN, Goodrich J, Nawrocki EP, DeSantis TZ, Probst A. et al. An improved Greengenes taxonomy with explicit ranks for ecological and evolutionary analyses of bacteria and archaea. ISME J. 2012;6:610-8
46. Segata N, Izard J, Waldron L, Gevers D, Miropolsky L, Garrett WS. et al. Metagenomic biomarker discovery and explanation. Genome Biol. 2011;12:R60
Author contact
![]() Corresponding author: Institute for Biomedical Sciences, Georgia State University, 100 Piedmont Avenue, PSC 757, Atlanta, GA, 30303. Tel: 404 413 3598; Fax: 404 413 3580; E-mail: eviennoisedu
Corresponding author: Institute for Biomedical Sciences, Georgia State University, 100 Piedmont Avenue, PSC 757, Atlanta, GA, 30303. Tel: 404 413 3598; Fax: 404 413 3580; E-mail: eviennoisedu