Impact Factor
- Issue 13; 2026
- Issue 12; 2026
- Issue 11; 2026
- Issue 10; 2026
- Issue 9; 2026
- Volume 16; 2026
- Advance Articles
- Past Issues
- Cover Images
- Cover Suggestion
- Index & Coverage
- Special Issues
Introduction
Materials and Methods
Results and Discussion
Conclusion
Abbreviations
Acknowledgements
Supplementary Material
References
International Journal of Biological Sciences
International Journal of Medical Sciences
 Global reach, higher impact

Theranostics 2019; 9(15):4494-4507. doi:10.7150/thno.33683 This issue Cite
Research Paper
Total internal reflection-based single-vesicle in situ quantitative and stoichiometric analysis of tumor-derived exosomal microRNAs for diagnosis and treatment monitoring
Dinggeng He1,2, Huizhen Wang2, See-Lok Ho1, Hei-Nga Chan1, Luo Hai2, Xiaoxiao He2, Kemin Wang2, Hung-Wing Li1,2, ![]()
1. Department of Chemistry, Hong Kong Baptist University, Kowloon Tong, Hong Kong, China.
2. State Key Laboratory of Chemo/Biosensing and Chemometrics, College of Chemistry and Chemical Engineering, College of Biology, Hunan University, Changsha, China.
Received 2019-1-31; Accepted 2019-5-14; Published 2019-6-9
Abstract

Purpose: Exosomes (EXs) have been increasingly recognized as natural nanoscale vehicles for microRNA (miRNA)-based cell-cell communication and an ideal source of miRNA biomarkers in bodily fluids. Current methods allow bulk analysis of the miRNA contents of EXs, but these approaches are not suitable for the in situ stoichiometry of exosomal miRNAs and fail to reveal phenotypic heterogeneity at the single-vesicle level. This study aimed to develop a single vesicle-based, mild, precise, but versatile method for the in situ quantitative and stoichiometric analysis of exosomal miRNAs.
Methods: A total internal reflection fluorescence (TIRF)-based single-vesicle imaging assay was developed for direct visualization and quantification of the single-vesicles of EXs and their miRNA contents in serum microsamples. The assay uses co-delivery of inactive split DNAzymes and fluorescence-quenched substrates into nanosized EXs treated with streptolysin O to produce a target miRNA-activated catalytic cleavage reaction that amplifies the readout of fluorescence signal. We perform the in situ quantitative and stoichiometric analysis of serum exosomal hsa-miRNA-21 (miR-21), a common cancer biomarker, by using the developed TIRF imaging assay.
Results: The TIRF imaging assay for serum exosomal miR-21 can distinguish cancer patients from healthy subjects with better performance than conventional real-time polymerase chain reaction (PCR) assay. The exosomal miR-21 level in serum is also informative for monitoring tumor progression and responses to treatment. Moreover, the TIRF assays can readily determine the precise stoichiometry of target exosomal miRNA contents in situ by delivering molecular beacon (MB) probes into EXs.
Conclusions: The created TIRF imaging platform shows high applicability to serve as a universal and useful tool for the single-vesicle in situ quantitative and stoichiometric analysis of other disease-associated exosomal miRNAs markers and provide valuable insight into the physiological relevance of EX-mediated miRNA communication.
Keywords: exosomes, miRNAs, total internal reflection, single-vesicle imaging, in situ quantitative and stoichiometric analysis
Introduction
Exosomes (EXs) are small membranous extracellular vesicles (30-100 nm in diameter) that are naturally secreted by a variety of cell types [1,2]. They carry a variety of specific bioactive molecules (e.g., lipids, proteins, nucleic acids, etc.) from their parental cells and convey these vesicular contents to neighboring or even distant recipient cells through the circulatory system [3-5]. Emerging evidence has demonstrated that the EX-mediated intercellular transfer of these vesicular contents expedites both the growth and metastasis of tumours [6-9]. It has been reported that microRNAs (miRNAs) are widely present in various EXs and play important roles in oncogenesis and tumor heterogeneity. The specific miRNAs in circulating EXs have thus been attracting major interest as potential diagnostic biomarkers of tumours [10-14]. In addition, EXs have been increasingly recognized as vehicles for intercellular miRNA transfer and a mechanism of miRNA-based cell-cell communication [15-17]. This result is exciting because miRNAs can inhibit the activity of target mRNAs, and it has been determined that more than 60% of all mRNAs in mammals are regulated by miRNAs [18]. EX-mediated intercellular miRNA transfer would bypass the transcriptional controls of recipient cells, providing a direct means of regulation [19]. Recent studies on the delivery of purified EXs to recipient cells have proven the transfer of miRNAs [20,21], and the application of EXs as natural small RNA delivery vehicles is being studied as a potential therapeutic strategy [22-25].
Although EX-mediated intercellular miRNA transfer is attractive, in situ quantitative evaluations of miRNA abundance and stoichiometry (i.e., how many molecules of a given miRNA are carried by an EX) at the single-vesicle level are lacking; however, such evaluations are fundamental for a complete understanding of the mechanistic models and provide insight into the limits and requirements of miRNA-based cell-cell communication [26,27]. The conventional real-time polymerase chain reaction (PCR) technique can efficiently quantify the miRNA content of EXs in a bulk manner by a series of time-consuming and labor-intensive procedures, including EX lysis, miRNA isolation, cDNA synthesis and real-time PCR analysis, and yields only an average stoichiometry [28,29]. Thus, a mild, precise, but versatile method for the single-vesicle in situ quantitative and stoichiometric analysis of exosomal miRNAs is highly desired.
Recently, Rhee et al. reported the in situ detection of miRNAs in EXs by using the fluorescent oligonucleotide probes [30,31]. Nevertheless, current methods fail to reveal the stoichiometry of miRNAs and EXs, and are not suited for the quantitative analysis of the miRNA contents of EXs at single-vesicle level because nanosized EXs cannot be enumerated by ordinary light microscopy [32]. Although the EXs are typically visualized by electron microscopy or atomic force microscopy [33,34], these approaches are nonquantitative because of the variation caused by the complex sample preparation procedures. Nanoparticle tracking analysis (NTA) can directly quantify EXs in solution by detecting the light scattering generated by EXs but is unable to discriminate target EXs from nontarget EXs and protein aggregates [35]. In addition, and more importantly, all these methods cannot be used to perform in situ analysis of the vesicular contents of nanosized EXs in complex clinical serum samples. One ideal tool that can overcome these limitations is total internal reflection fluorescence (TIRF) microscopy. The TIRF assay images single molecules or nanoparticles by monitoring the fluorescence of molecules or particles excited by total internal reflection and quantifies them by counting the fluorescent spots and measuring the fluorescent intensity [36-38].
Here, we performed the single-vesicle in situ quantitative and stoichiometric analysis of the miRNA contents of nanosized EXs by establishing a TIRF-based single-vesicle imaging platform. In this assay, DNAzymes are introduced to construct fluorescent probes because of their availability for amplifying sensing and flexibility in structural and functional design. After penetration into whole EXs, the rationally designed DNAzyme probes can specifically bind with target miRNAs to produce amplified fluorescence signals, which are then detected by TIRF microscopy. The total internal reflection generates an evanescent field with a penetration depth of about 100-300 nm that is slightly larger than the size of EXs, suggesting that the diffusing EXs are excited only when they enter the confined evanescent field layer, and the remaining EXs in bulk solution remain in the ground state. Thus, the TIRF imaging assay can achieve the direct quantification of exosomal miRNAs in serum samples. Our results show that the TIRF imaging assay not only is capable of quantifying the target miRNA content of whole EXs at single-vesicle level with a high signal-to-noise ratio but also yield the precise stoichiometry of miRNAs and EXs. This innovative study indicates that TIRF-based single-vesicle imaging is a desirable strategy for in situ quantitative and stoichiometric analysis of miRNA biomarkers associated with EXs and is valuable for the study of the mechanism models of EX-mediated miRNA communication.
Materials and Methods
Cell cultures. Human cervical carcinoma cell line (HeLa) was obtained by the Cell Center of Xiangya Medical School. Human breast adenocarcinoma cell line (MCF-7), normal cervical cell line (Ect1/E6E7), human malignant melanoma cell line (A375), chinese hamster ovary cell line (CHO-K1) and normal human epidermal melanocytes (NHEM-c) were purchased from the Shanghai Cell Bank, Chinese Academy of Medical Sciences. HeLa and NHEM-c cells were cultured in RPMI 1640 medium (Hyclone), MCF-7, A375 and Ect1/E6E7 cells were cultured in DMEM (Hyclone), and CHO-K1 cells were cultured in IMDM (Life technology). All cultures were supplemented with 10% fetal bovine serum (FBS, Life technology), penicillin (1 U) and streptomycin (1 μg mL-1) and incubated at 37 °С in a humidified incubator containing 5% CO2. Cell density was determined using a hemocytometer, and this was performed prior to any experiments.
EXs isolation and characterization. For the production of EXs from the cells, initially, the cells were grown in media that contained 10% FBS to 70% confluence, washed twice with PBS, and then maintained for an additional two days in media that contained 10% EX-depleted FBS (System Biosciences Inc.). After that, the media was collected and filtered by a 0.2-μm pore filter to remove cellular debris. The produced EXs in the supernatant solution were isolated by using ExoQuick-TC (System Biosciences Inc.) according to the vendor's instructions. Briefly, the conditioned media were centrifuged at 3,000 rpm for 15 min to remove cell debris, and the supernatant was incubated with ExoQuick-TC solution at 4 °С overnight. The next day, the mixture was centrifuged at 3,000 rpm for 30 min, and the pellets were resuspended in EX-free serum. The EXs concentration and size distribution were determined by the nanoparticle tracking analysis with a Nanosight system (Malvern). The isolated EXs was also visualized using a JEM-3010 electron microscope (JEOL, Japan) operated at 60 kV. Furthermore, to characterize the permeability of A375 EXs to DNA probes, A375 EXs treated with different concentrations of streptolysin O (SLO) (Sigma-Aldrich) were incubated with fluorescently-labeled DNA probes for 1 h at 37 °С. After the ultracentrifugation, the fluorescence signals of supernatants were respectively measured for determining the loading efficiencies and encapsulation efficiencies of various DNA probes.
Preparation of EXs concentration standards. Serum samples were centrifuged at 110,000g for 10 h, and supernatants were collected as EX-free serum. Standard EXs samples of known concentration isolated from various cell cultures were dissolved in EX-free serum to a final concentration of 1010 particles μL-1, and further diluted to required concentrations (109, 108, 107, 3×10⁶, 106, 3×10⁵, 105 and 3×10⁴ particles μL-1) with PBS at time of use.
Coverslips pretreatment. All coverslips are washed prior to use. Briefly, glass slides (22 mm × 22 mm) were sequentially sonicated in household detergent for 15 min, acetone for 15 min and ethanol for 15 min. Then the coverslips were successively soaked in Piranha solution (H2SO4/30%H2O2) (v/v 3:1) for 30 min and sonicated for another 30 min, sonicated in HCl/30%H2O2/H2O (v/v/v 1:1:1) solution for 30 min, further sonicated in Piranha solution for 30 min, and finally sonicated for 15 min in distilled water twice. All the coverslips were rinsed with distilled water extensively between each solvent replacement. The slides were finally stored in distilled water and blow-dried with nitrogen gas before use.
In situ exosomal miRNAs imaging. The DNA probes were delivered into EXs with the reversible permeabilization method using 0.2 U mL-1 of SLO, which was activated by adding 5 mM of tris(2-carboxyethyl)phosphine (Thermo) to 2 U mL-1 of SLO for 1 h at 37 °С before use. The SLO-treated EXs derived by different cell types (A375, NHEM-c, MCF-7, CHO-K1, HeLa and Ect1/E6E7 cells) were respectively incubated in PBS containing Mg2+ (15 mM) with the split DNAzyme probe (SDP) for miR-21 (SDP21), which consists of two divided DNAzyme fragments (D1 and D2) and a ribonucleobase (rA)-containing substrate (S) with self-quenched fluorescence, for 1 h at 37 °С. The concentrations of D1, D2 and S were 25, 25 and 100 nM, respectively, for each experiment. 10 μL of resulting solution was pipetted to coverslips for in situ TIRF imaging of exosomal miR-21. The contents of miR-21 were estimated by analyzing the fluorescence signal intensity and the value of miR-21 quantified by the TIRF imaging platform was compared with the outcome of the qRT-PCR method. The MB for sensing miR-21 (MB21) and control probes were also delivered into A375 EXs for imaging the miR-21. In addition, to show the universality of TIRF imaging method, miR-221 level in A375 EXs and control NHEM-c EXs was investigated by using SDP221 consisting of D3, D4 and S.
Imaging system and data analysis. The prism-type TIRF microscopy was setup as mentioned elsewhere [36]. Briefly, the sample coverslip was located under the fused-silica isosceles prism (CVI, laser USA) and a 60 × oil-type objective that equipped on an Olympus IX71 inverted microscope with a BLP-488R long pass filter (Semrock, USA). A 488 nm diode laser (Newport, USA) was used as the excitation source to excite the FAM. The laser beam with an incident angle of approximately 62° was total-internal-reflected at the glass/solution interface. The thickness of evanescent field layer (EFL) generated by total internal reflection is calculated to be about 190 nm by d = λ / (4π (n22 sin2θ - n12)1/2), where d is the thickness of EFL, λ is the wavelength of the excitation light in vacuum, n1 and n2 are the refraction indices (n1 = 1.33 and n2 = 1.523) of the solution and glass slides and θ is the angle of incidence respectively. The fluorescent images were captured by an Electron Multiplying Charge Coupled Device (EMCCD) (PhotonMax 512, Princeton Instrument, USA) incorporated with a Uniphase mechanical shutter (Model LS2Z2, Vincent Associates, USA) and a driver (Model VMM-T1, Vincent Associates, USA) in external synchronization and frame-transfer mode. The exposure time of both camera and shutter were set at 100 ms. The multiplication gain and the delay time of the shutter drive were set at 3,000 and 10 ms respectively. In general, fluorescent images of 10 sequential frames each were acquired on different coordinates from a single channel using the WinSpec/32 software (version 2.5.22.0, USA) provided by Princeton Instruments. All images were analyzed by a public domain image processing software ImageJ. Each bright spot on the fluorescent image represents a single EX. The fluorescence signals of single EX were obtained by measuring the net fluorescence intensity of 50 individual bright spots randomly (Net average signal intensity = [(1×1 square pixel of 50 individual EX) - (1×1 square pixel of 50 independent background area on the image)]/50).
Furthermore, the image was processed with the Analyze Particles function in ImageJ to determine the number of single fluorescence particles computationally. The threshold was set as 3 times the standard deviation of the intensity of the image and size of the particles was set as 2-10 pixels to reduce the false positive signals generated from noises. Number of bright spots (target EXs) was counted separately and summed up. Then the sum of spots from 5 different image series of a single slide was averaged. The total fluorescence signal intensity from 5 different images series of single slide was also calculated. All experiments were done in triplicate and the error bars refer to the standard error of mean of the triplicate experiments unless specified.
Mouse tumor model. Male athymic BALB/c (Balb/C-nu) mice were obtained from the Shanghai SLAC Laboratory Animal Co., Ltd. They were 4-6 weeks old at the start of each experiment and weighed 20-25 g. All animal procedures were in accord with institutional animal use and care regulations approved by the Laboratory Animal Center of Hunan. The mice were subcutaneously injected at their backside with 2 × 10⁶ A375 cells suspended in 100 μL of PBS to establish subcutaneous malignant melanoma tumor model and compared with healthy control mice that did not receive tumor cell injections. Mouse retro-orbital blood samples (50 μL) for analysis of miR-21-EXs serum levels and tumor size data were collected at 0, 10, 20, 30 and 40 days post-injection. A caliper was used to measure tumor length and width. The volume of tumor (V) was estimated by the following equation: V = L × W2 × 0.5, where L and W are the greatest longitudinal diameter and the greatest transverse diameter of tumor, respectively.
Treatment monitoring in mice. Doxorubicin hydrochloride (DOX) was selected as a model chemotherapeutic drug due to its significant therapeutic effect on many tumors clinically. DOX for injection was dissolved in physiological saline to yield the DOX injection solution with a final concentration of 2 mg mL-1. In most animal experiments of chemotherapy, the dosage was commonly described as the mass of drug used per square meter of body surface area (mg m-2). Here, the body surface area of nude mice was calculated according to the previously reported literature [39].
Subsequently, the melanoma tumor-bearing mice were treated with DOX. Tumor treatment effect was investigated by monitoring the miR-21-EXs serum levels of mice. Generally, different dosages (10, 20 and 40 mg m-2) of DOX were respectively injected into the abdominal cavity of mice (n = 3) once at ten days post-injection with A375 cells. Control mice (n = 3) received the equal volumes of physiological saline without DOX. The miR-21-EXs serum levels and tumor sizes were respectively measured every five days. To further investigate the treatment efficiency for the different stages or tumor sizes, the treatment for tumor-bearing mice started at 25 days post-injection with A375 cells. At this moment, the tumor volume approached 50-70 mm3. After treatment with different dosages of DOX (20 and 40 mg m-2 per 10 days), miR-21-EXs serum levels of mice (n = 3) were measured once every five days. The changes of relative tumor volume were also investigated. Finally, the therapeutic effects for tumor-bearing mice (n = 11) were evaluated by comparing the miR-21-EXs serum levels before and after serial treatment with 40 mg m-2 DOX for 40 days.
Clinical samples. Serum samples from melanoma cancer, breast cancer, cervical cancer and healthy donor were collected at the time of diagnosis by the Affiliated Hospital of Changsha Medical University after approval by the Institutional Review Board. Melanoma, breast and cervical cancer samples used for treatment evaluation were respectively obtained from cancer patients (n = 3) undergoing treatment. Serum samples were collected from these cancer patients 1-2 months before and after chemotherapy. Informed consent was obtained from all patients. The TIRF imaging assay of nanoscale EXs was performed to calculate the serum miR-21-EXs content of each group. Treatment responses were also investigated by monitoring the miR-21-EXs serum levels of cancer patients.
Results and Discussion
Design of the TIRF imaging assay with DNAzyme probes for exosomal miRNAs
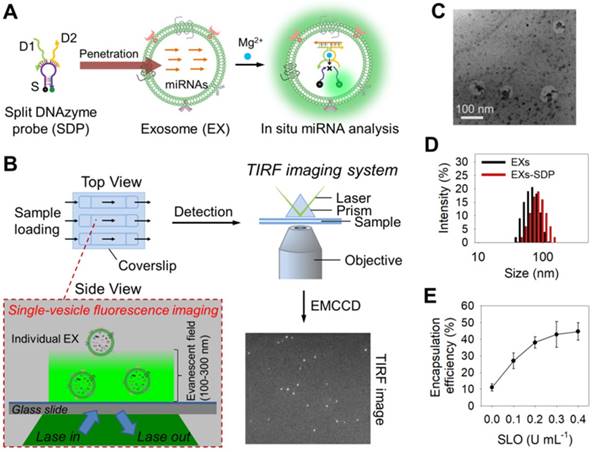
The design of our single-vesicle fluorescence imaging platform with TIRF microscopy for the in situ visualization and quantification of exosomal miRNAs is illustrated in Figure 1. In this design, Mg2+-dependent DNAzyme is employed as a model amplifying label to construct a split DNAzyme probe (SDP) [40,41], which consists of two divided DNAzyme fragments (D1 and D2) with an inactive structure and a ribonucleobase (rA)-containing substrate (S) with self-quenched fluorescence (Figure 1A and Figure S1). The DNA sequences used here are listed in Table S1. After penetration into EXs, the SDP is activated by the hybridization reaction with target miRNA and catalyzes the cleavage of S with the aid of Mg2+ ions, producing the fluorescence signal readout. The fluorescent EXs are monitored by an EMCCD under a TIRF imaging system (Figure 1B). Because each individual bright spot in the TIRF image represents a single fluorescent EX, quantification of target EXs can be achieved by simply counting the number of spots in the sample region. The fluorescence signal intensity is proportional to the quantity of target miRNAs. By calculating the signal intensity, quantification of the miRNA content of a single nanosized EX can be achieved. Using the developed TIRF imaging assay, we show the quantitative and stoichiometric analysis of exosomal miRNAs in situ at the single-vesicle level.
Schematic overview depicting the TIRF imaging assay of the miRNA contents of EXs and the characterization of isolated A375 EXs. (A) Illustration of the in situ analysis of exosomal miRNAs by using the SDP. (B) Schematic illustration of the single-vesicle fluorescence imaging with TIRF microscopy. In the TIRF image, the fluorescence signal from a single EX was visualized as an individual bright spot. (C) TEM image of isolated A375 EXs. (D) Hydrodynamic diameters of A375 EXs before and after SDP penetration detected by DLS. (E) SLO-mediated penetration of fluorescent DNA probes into A375 EXs.
Characterization of DNAzyme probes and their penetration into EXs
We first characterized the detection performance of the SDP for the target miRNAs in buffer solution. In this experiment, we chose hsa-miR-21 (miR-21) as a model target miRNA [42-45], which is one of the most significant miRNAs in EXs derived from multiple types of cancer and is presumed to mediate tumor growth by serving as an oncogene and targeting the tumor suppressor genes in invasion and metastasis. The catalytic activity of the SDP for miR-21 (SDP21) was monitored by the activated fluorescence after mixing the target miR-21 with the SDP in the presence of Mg2+ ions. An intense fluorescence peak was observed at a wavelength of 526 nm in the presence of a 50 nM target (Figure S2A). In contrast, no visible fluorescence peak appeared in the presence of a nontarget sequence. The SDP emitted fluorescence signals that correlated to the miR-21 concentration (Figure S2B).
To investigate the specificity of SDP21, we performed a series of contrast experiments using miR-210, miR-221, single-base-mismatched miR-21 (SM miR-21), and three-base-mismatched miR-21 (TM miR-21) as negative controls (Figure S3A). The results showed that the fluorescence signals from miR-210 and miR-221 scarcely changed, while the signals of SM miR-21 and TM miR-21 showed slight increases. However, 10 nM target miR-21 exhibited a significant response, which could be easily discriminated from the SM and TM signals. We also used miR-221 as a target to investigate the specificity of SDP221 (Figure S3B). The fluorescence intensities from miR-210, miR-21, SM miR-221, and TM miR-221 were similar to that from the blank control and far lower than that from miR-221. These results prove that the design of the SDP is simple and that theoretically, our strategy is suitable for other miRNAs.
Furthermore, we investigated the specificity of TIRF assay with a molecular beacon (MB), a dual-labeled hairpin DNA probe with a fluorophore (FAM) and a quencher (BHQ1) at each end. The MB has no fluorescence in the absence of target miRNAs, and show a strong fluorescence signal after the hybridization with target miRNAs. The target-activated fluorescence was measured by TIRF microscopy. In the TIRF images, an individual bright spot was seen as a single fluorescent hybrid of probe and miRNA [36,37,46]. The obtained TIRF images were used for single-vesicle counting. Figure S3C demonstrated that the MB21 can specifically bind with the target miR-21, and the TIRF assay with the MB21 could easily discriminate target miR-21 from SM miR-21. Both miR-221 and TM miR-21 were almost undetectable by the TIRF assay with the MB21. Moreover, we can also distinguish let-7a from let-7b by the TIRF assay with the MB for sensing let-7a (MB7a) (Figure S3D). These results confirmed adequately the high specificity of the developed TIRF assay for sensing target miRNAs.
Next, we investigated the ability of SDP21 to detect target miR-21 in nanosized EXs. EXs derived from a malignant melanoma cell line (A375 EXs) with high expression of miR-21 were isolated for the preparation of the EX standards. Both the morphology and size distribution of the isolated vesicles were studied by TEM and DLS (Figure 1C-D), showing round structures with sizes varying from 30 to 100 nm, consistent with the previously reported characteristics of EXs [1,2]. To achieve the in situ analysis of exosomal miRNAs, DNA probes were delivered into A375 EXs by using a reversible membrane permeabilization tool, streptolysin O (SLO) [30,47]. SLO can bind with cholesterol on the membrane of EXs to form pores, allowing the influx of DNA probes. After incubating fluorescent DNA probes (25 nM at room temperature for 1 h) with A375 EXs (109 particles µL-1) treated with different concentrations of SLO, ranging from 0 to 0.4 U mL-1, the encapsulation efficiency (ratio of the encapsulated probes to the initially added probes) of the DNA probes was determined by fluorescence analysis. As illustrated in Figure 1E, the encapsulation efficiency increased with increasing SLO concentration and reached saturation at a concentration of 0.3 U mL-1, which was used in the following experiments. Subsequently, the SLO-mediated penetration of SDP21, consisting of D1 (25 nM), D2 (25 nM) and S (100 nM), into EXs (109 particles µL-1) was performed, and the fluorescence signals from SDP21 and miR-21 hybridization in EXs were detected under different conditions (Figure S4A). The SLO-treated A375 EXs showed stronger fluorescence than the untreated A375 EXs, meaning that SLO enhances the delivery of DNA probes and results in increased hybridization. To rule out the possibility that SDP21 and miR-21 hybridization occurs outside of EXs since SLO may induce the release of miR-21 from EXs, the treated EXs were isolated by ultracentrifugation (110,000 g, 4 h). The fluorescence of isolated EXs and supernatant solutions were measured respectively. As a result, the supernatants after ultracentrifugation showed a weak fluorescence, while the precipitates (EXs) had a strong fluorescence comparable to the original solution (Figure S4B). These results thus indicated that miR-21 did not escape EXs during SLO treatment and the SDP21 and miR-21 hybridization reaction occurred inside the EXs, not outside the EXs, which matched very well with results of previous literature [30]. As a control, the EXs derived from normal human epidermal melanocytes (NHEM-c EXs) were isolated by the aforementioned method and treated with SDP21 in the presence of SLO. In contrast, NHEM-c EXs displayed no obvious fluorescence due to the low expression of the target miR-21. Remarkably, Mg2+ ions as cofactors of DNAzyme have a great effect on the fluorescence intensity. Therefore, we optimized the Mg2+ ion concentration and found that 15 mM was the optimal concentration (Figure S4C).
Evaluation of the TIRF imaging assay for the in situ quantification of miRNAs in EXs
The detection performance of the TIRF assay for miR-21 in EXs was characterized first. A negative control assay performed with EX-free serum displayed a negligible signal intensity, and similar results were obtained when the A375 EX standard (106 particles μL-1) was analyzed on the coverslip without SDP21 (Figure 2A and Figure S5). The assay performed with SDP21 and A375 EXs showed only a low fluorescence signal. A markedly different result was noted, however, when SDP21 was incubated with the A375 EX standard (106 particles μL-1) in the presence of Mg2+ ions. Owing to the signal enhancement effect of Mg2+-dependent DNAzyme, the TIRF assay with SDP21 exhibited a high normalized fluorescence intensity of 9.1. To further prove the DNAzyme-based amplification, the MB for sensing miR-21 (MB21) was used. After incubation with A375 EXs, the MB21 displayed the lower normalized signal intensity than SDP21 under the same conditions, and the control MB probe underwent no fluorescence change (Figure 2B and Figure S6A). Additionally, after incubation with SDP21, control NHEM-c EXs emitted insignificant fluorescence. These results adequately indicated that DNAzyme obviously enhanced the detection signal of the target miR-21 in EXs. Furthermore, a masking DNA, which has the same sequence with the loop (the recognition sequence for miR-21) of MB21, but without the stem, fluorescent dye and quencher, was employed to treat the EXs before addition of MB21, thereby decreasing the target miR-21 expression level in EXs. As a result, average number of fluorescent EXs counted by the TIRF assay gradually decreased with increasing concentrations of masking DNA and reached a minimum at the concentration of 500 nM (Figure S7). This result indicated that average number of fluorescent EXs and their fluorescence intensity are directly correlated with the expression level of target exosomal miRNAs and our TIRF imaging method can detect the change of exosomal miRNA accordingly. To illustrate the generality of our assays, SDP221 was used to detect miR-221 in EXs by the same process. Similar to SDP21, SDP221 could enter A375 EXs with the aid of SLO and produce a readable fluorescence signal in the presence of the target miR-221 (Figure S8).
Characterization of the performance of the TIRF assay for exosomal miR-21. (A) TIRF images of the negative controls (SDP21 + A375 EXs, A375 EXs + Mg2+, and SDP21 + Mg2+) and positive samples (SDP21 + A375 EXs + Mg2+). In the TIRF images, an individual bright spot was regarded as a fluorescent EX. Scale bar = 3µm. (B) Average signal intensities of A375 EXs after treatment with no other agents, control probes, the molecular beacon for miR-21 (MB21) and SDP21, respectively, and control EXs (NHEM-c EXs) with SDP21. (C) TIRF images of exosomal miR-21 detected in serum samples spiked with the indicated EX concentrations. Scale bar = 3 µm. (D) Correlation between log(total TIRF signal intensities) and log(concentrations of exosomal miR-21 determined by qRT-PCR analysis). The total TIRF signal intensities were obtained by the sum of the signal intensity of all fluorescent EXs from five TIRF images. All TIRF images were analyzed by ImageJ software.
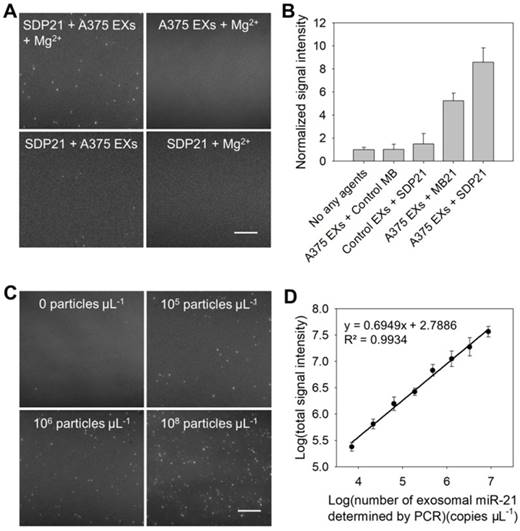
In the TIRF images, an individual bright spot was visualized as a single fluorescent EX. The obtained TIRF images were used for single-vesicle counting. We found that the counts of fluorescent EXs increased with the concentration of EXs (Figure 2C) and that there was a broad linear range (3 × 10⁴ - 107 particles μL-1) with a strong correlation (R2 = 0.9904) between the counted EX numbers and log(known EX concentrations) (Figure S9A). Thus, quantification of cancer-associated EXs can be simply achieved by counting the bright spots in the sample region of the TIRF images. In addition, the signal intensity of the bright spots is proportional to the miRNA content in the EXs, which reveals the quantification of miR-21 in each EX. By measuring the total fluorescence intensity of individual bright spots in five TIRF images as a function of the miR-21 concentration determined by quantitative real time polymerase chain reaction (qRT-PCR), which is a technique commonly adopted as a standard method for miRNA profiling [28,30], a calibration curve was achieved with a good linear correlation coefficient, R2 = 0.9934 (Figure 2D). The LOD of the assay was estimated to be 378 copies µL-1. Figure S9B shows the concentrations of exosomal miR-21 detected by the TIRF assay in situ and determined by qRT-PCR analysis after the total miRNA extraction from EXs (Table S2). The results obtained with the TIRF assay correlated well with those determined by qRT-PCR. Thus, it is obvious that SDP21 enters into EXs and hybridizes with the target miR-21, thereby producing a readable fluorescence signal for the in situ quantification of miR-21 in EXs with high specificity and sensitivity.
TIRF imaging assay for the stoichiometric analysis of exosomal miRNAs
To achieve the stoichiometric analysis of exosomal miRNAs, aptamer-based DNA nanoprobes consisting of gold nanoparticles (AuNPs) assembled with fluorescently labeled aptamers against CD63 (CD63apt), an abundant membrane marker on most EX surfaces, were designed for the direct and accurate quantification of total EXs (Figure 3A). The nonspecific binding between CD63apt and AuNPs caused the formation of AuNPs-CD63apt nanocomposites with self-quenched fluorescence. In the presence of EXs, the specific and stronger binding between CD63 and its aptamer resulted in a rapid displacement of aptamers from the particle surface and consequent fluorescence labeling of the total EXs. The redundant nanocomposites were removed by centrifugation, and fluorescent EXs were then monitored under the TIRF imaging system. The identification of total EXs in A375 cells or control NHEM-c cells was determined at progressive culture time points. The total EX numbers in A375 and NHEM-c cell culture supernatants increased with the culture duration, and the increasing trends of A375 EXs and NHEM-c EXs were accordant (Figure 3B). The TIRF assay of the total EX-CD63apt nanocomposites displayed a broad linear range (103-108 particles μL-1) with a strong correlation (R2 = 0.9882) between log(counted EX number) and log(known EX concentration) and a detection limit of 103 particles μL-1 (Figure S10A). To avoid the interference of protein aggregates, a green fluorescent lipid dye (DiO) is used as a lipophilic tracer to quantify the total EXs. Once applied to EXs, the dye diffuses laterally within the plasma membrane. The DiO is weakly fluorescent in water but highly fluorescent and quite photostable when incorporated into EX membranes. It has an extremely high extinction coefficient and short excited-state lifetimes in lipid environments. The total EXs were then determined by counting the numbers of DiO-labeled EXs in TIRF images. This result was consistent with that of CD63 (Figure S10B and Table S3), strongly proving that the detected EXs using CD63 as marker were real and credible. In contrast to the results for the total EXs, both the miR-21-EX and miR-221-EX numbers in A375 cells increased, while the miR-21-EX and miR-221-EX levels in NHEM-c cell culture supernatants showed no significant differences during the cell culture process (Figure 3C-D). Moreover, the numbers of miR-21-EXs and miR-221-EXs were lower than those of total EXs in A375 cell culture supernatants at all time points, suggesting that not all EXs from A375 cells contained miR-21 and miR221. Calculations based on the TIRF assay data demonstrated that miR-21-EXs and miR-221-EXs represented approximately 1.79% and 0.63% of the total EXs in A375 cells (Table S3).
Stoichiometric analysis of exosomal miRNAs by TIRF imaging assay. (A) Illustration of the fluorescence labeling of total EXs by using CD63 aptamer-based DNA nanoprobes. (B) Total EX signal in A375 and NHEM-c cultures over time. The miR-21-EX (C) and miR-221-EX (D) signals in A375 and NHEM-c cultures over time; n = 3 triplicate samples per time point. (E) Target miRNAs in EXs are present at much less than one copy per EX. (F) Fluorescence intensity analysis of every individual bright spot under different conditions. (G) Analysis of miRNA numbers in a single A375 EX: TIRF image of A375 EXs incubated with MB21 (top), and the calculated miR-21 numbers of each observed A375 EXs (bottom).
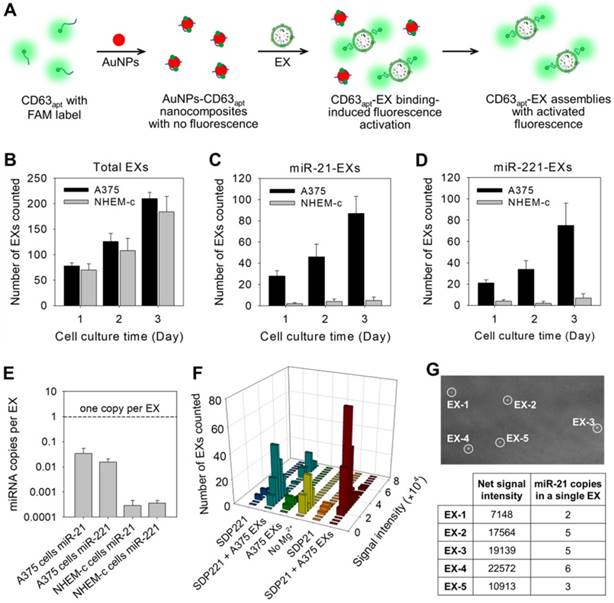
Furthermore, the stoichiometry of a given miRNA molecule in A375 EXs and NHEM-c EXs was evaluated by the TIRF assay. Using these data, we determined the ratio of miR-21 and miR-221 molecules to A375 EXs and control NHEM-c EXs, respectively. As shown in Figure 3E, there was far less than one copy of miR-21 or miR-221 per EX. Thus, if miR-21 was distributed homogenously across the EX population, on average, over 60 EXs would need to be examined to observe one copy of miR-21. This average stoichiometry of miR-21 and EXs suggests that most individual EXs in standard preparations do not carry significant numbers of miR-21 molecules. This result was also confirmed by combining qRT-PCR and NTA (Table S2). Nevertheless, the traditional PCR method is unable to determine the precise stoichiometry or a stoichiometric model of the exosomal miRNA content. To address this issue, we carefully analyzed the signal intensities from all individual fluorescent EXs in the TIRF images by ImageJ software and yielded statistical profiles of the signal intensities and EX numbers for different samples (Figure 3F), which reflected the target miRNA contents in each observed nanosized EX. By comparing the TIRF images of EX samples after incubating with SDP21 and the AuNPs-CD63apt nanocomposite probe, the numbers of target miR-21-noncontaining EXs could also be estimated.
To further determine the miR-21 copy numbers in a single EX, MB21 was incubated with the synthetic miR-21 in EX-free serum (Figure S6B). The formed MB21-miR-21 hybrids were then deposited on the positively charged coverslip surface by the electrostatic interaction and detected by the TIRF imaging system. The average net fluorescence intensity of the observed bright spots was calculated to be 3768 ± 452, which represented the signal intensity of MB21 in response to a single copy of miR-21. The miR-21 copy numbers were calculated by N = T / S, where N corresponds to the miR-21 copy numbers in a single fluorescent EX, T corresponds to the net signal intensity of a single fluorescent EX treated with MB21 and S is the signal intensity generated by hybridization between MB21 and miR-21. The results (N) were rounded up or down to integral numbers that were regarded as the miR-21 number in a single EX (Figure 3G). Consequently, the developed TIRF imaging assay with DNA probes is a desirable method for the in situ and accurate stoichiometric analysis of miRNAs associated with EXs at the single-vesicle level.
TIRF imaging assay of exosomal miR-21 from different tumor cells
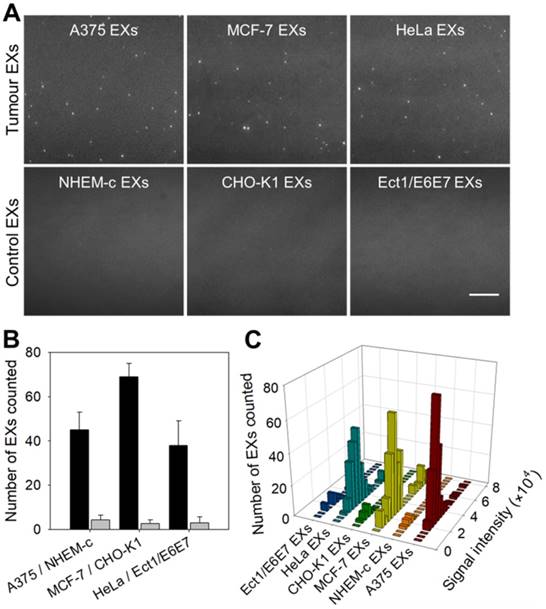
Same miRNAs can be expressed by both cancerous cells and normal cells. Our strategy cannot distinguish whether the detected miRNAs are produced by tumor cells or normal cells, but the expression level can tell the difference. We compared the contents of miR-21 in EXs derived from tumor cells (A375, MCF-7 and HeLa cells) and their control normal cells (NEHM-c, CHO-K1 and Ect1/E6E7 cells) using the TIRF imaging platform (Figure 4A-B). After incubation with SDP21, tumor-derived EXs displayed a significant number of bright fluorescent spots in their TIRF images. There were only weak background signals observed for the control EXs. These results indicated that the TIRF assay with SDP21 is capable of discriminating target EXs from negative control EXs. For the purpose of result validation, the miR-21 contents of these EXs were also determined by a qRT-PCR assay. The results of the qRT-PCR assays are shown in Figure S11. The TIRF results agreed very well with the outcome of qRT-PCR. The high correlation with the accredited qRT-PCR methods demonstrated that the TIRF platform developed here is very promising for profiling the expression of miRNAs in different cell lines and is thus applicable in early cancer diagnosis. In addition, stoichiometric analyses of the miR-21 contents of these EXs were performed. Figure 4C shows the statistical profiles of the signal intensities of different cell-derived EX samples. These data will be valuable for a complete understanding of the roles of EX-mediated miRNA communication in tumor pathogenesis, invasion and metastasis.
TIRF assay for the in situ analysis of miR-21 in EXs derived from different cell types. (A) TIRF images of various tumor EXs and their control EXs after introducing SDP21. Scale bar = 3 µm. (B) Number of bright spots counted in the sample region of 200 square pixels (equivalent to 53 × 53 μm). In the TIRF image, an individual bright spot was regarded as a single miR-21-EX. (C) Fluorescence intensity analysis of miR-21-EXs at the single-vesicle level in various cell-derived EX samples.
TIRF assay for serum exosomal miR-21 in a mouse tumor model
To verify the ability of the TIRF assay to determine the miR-21-EX level in serum during tumor development, athymic nude mice were subcutaneously injected with A375 and control NHEM-c cells to establish mouse tumor models. Then, the miR-21-EX levels in serum samples from mice were analyzed by the TIRF assay every 10 days (Figure 5A). Serum miR-21-EX levels increased with time in the samples from A375 tumor-bearing mice but remained steady in negative control mice (Figure 5B). The TIRF assay significantly distinguished A375 tumor-bearing mice from control mice by 10 days post-injection when the tumor was almost invisible to the naked eye (Figure S12A), thus suggesting that this TIRF assay can be used for the liquid biopsy of exosomal miR-21.
Identification of tumor-associated exosomal miRNAs as potential biomarkers by the TIRF imaging system. The TIRF images (A) and miR-21-EX numbers (B) at indicated time points in serum samples from nude mice following subcutaneous injection without or with A375 cells (2 × 10⁶ cells per mouse); n = 3 replicates per sample. Scale bar = 3 µm. (C) TIRF imaging analysis of exosomal miR-21 in serum samples from nude mice for tumor treatment monitoring. Tumor-bearing mice were treated with different dosages of DOX at 10 days post-implantation. Serum miR-21-EX levels were also determined by the TIRF assay. (D) Changes in the miR-21-EX serum levels in tumor-bearing mice after treatment without and with DOX. The treatment of tumor-bearing mice started at 25 days post-implantation. The different dosages (20 and 40 mg m-2) of DOX were injected into the abdominal cavity of mice once every 10 days. n = 3 mice per group.
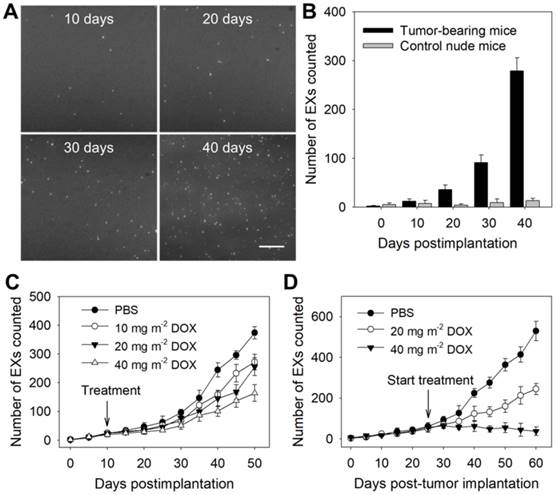
Subsequently, we investigated whether the miR-21-EX serum levels reflected the responses of A375 tumors to treatment in mice. The treatment of mice started at 10 days after tumor implantation. Serum samples were collected from tumor-bearing mice before and after treatment with different dosages of the chemotherapeutic drug DOX and were analyzed by the TIRF assay every 5 days. The results showed that the expression level of miR-21-EXs in serum samples from post-treatment mice decreased and tumor growth was inhibited to a certain degree (Figure 5C and Figure S12B). To further show the treatment responses of A375 tumors, the treatment of mice started at 25 days after tumor implantation, and the frequency of drug administration to each group was once every 10 days. Serum miR-21-EX levels were found to significantly decrease as the dosage of DOX increased (Figure 5D). Relative tumor volume was also estimated every 5 days (Figure S12C) and matched very well with the miR-21-EX profile revealed by the TIRF assay. Therefore, the serum miR-21-EX level is a useful independent index for detecting treatment responses (Figure S13A) and is highly applicable to treatment evaluation.
TIRF assay for serum exosomal miR-21 in clinical samples
To investigate the applications of the TIRF assay in cancer diagnosis and monitoring, we first analyzed exosomal miR-21 in clinical serum samples from cancer patients (melanoma, breast cancer and cervical cancer) and healthy donors. Figure 6A shows that the TIRF imaging assay for serum exosomal miR-21 levels distinguished cancer patients from healthy subjects. Moreover, accurate stoichiometric models of the exosomal miRNA content in different clinical serum samples were obtained (Figure 6B), which are crucial for assessing tumor development and studying the individual differences of tumors.
miR-21-EX imaging analysis and clinical performance. (A) TIRF images of miR-21-EXs in clinical serum samples from cancer patients and healthy donors. Scale bar = 3 µm. (B) Fluorescence intensity analysis of miR-21-EXs at the single-vesicle level in various clinical serum samples. (C) Average number of miR-21-EXs counted in TIRF images of serum samples from cancer patients. (D) Changes in the miR-21-EX levels in serum samples from different cancer patients (n = 3) before and after clinical treatment.
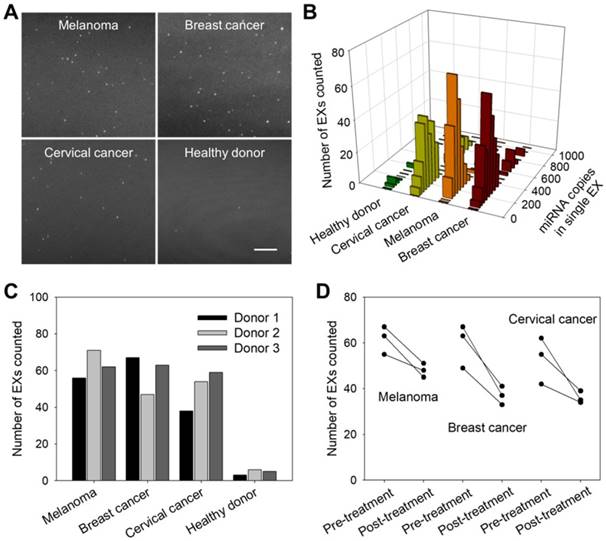
Clinical cancer cases are frequently characterized by high rates of treatment resistance, and improved means of monitoring treatment responses are urgently needed to enable rapid modification of personalized treatment regimens to improve patient outcomes. We thus investigated whether serum miR-21-EX levels reflected tumor responses to treatment. Serum samples were collected from three types of cancer patients (melanoma, breast cancer and cervical cancer) and healthy donors before and after clinical chemotherapy. Post-treatment miR-21-EX levels were significantly decreased in patients with good treatment responses (Figure 6C-D). Therefore, changes in miR-21-EX levels are strongly associated with treatment responses (Figure S13B). The serum miR-21-EX level may be a potential indicator for the monitoring of cancer patient responses to treatment.
Conclusion
In summary, we develop a TIRF imaging platform that successfully achieves in situ quantification and accurate stoichiometry determination of the miRNA contents of nanosized EXs at the single-vesicle level by applying recent advancements in DNA nanotechnology. The rationally designed DNA probes can easily enter nanosized EXs mediated by SLO and selectively bind with exosomal target miRNAs to produce a readable fluorescence signal for the TIRF imaging analysis of individual EXs. Moreover, AuNPs-CD63apt nanocomposite probes were constructed to quantify the total EXs for the stoichiometric analysis of miRNAs associated with EXs. Compared with other methods such as qRT-PCR and flow cytometry, the TIRF assay is a single-vesicle in situ exosomal miRNA detection strategy with low serum consumption, simple procedure, short analysis time and low reagent cost. Moreover, the developed TIRF assay can directly determine the stoichiometry and composition of EXs in complex clinical serum samples to obtain insightful information about EX-mediated cell-cell communication. Based on these advantages, the TIRF assay is superior to conventional qRT-PCR for the detection of circulating exosomal miRNAs. The TIRF imaging assay can be easily refined for clinical use and readily adapted for the diagnosis and monitoring of other disease-specific miRNAs associated with EXs.
Further studies demonstrated that the TIRF imaging assay for miR-21-EXs can discriminate cancer patients (melanoma, breast cancer and cervical cancer) from healthy subjects. The miR-21-EX level was also informative for detecting tumor progression and treatment responses. We thus propose that a TIRF miR-21-EX serum assay may have significant value as a cancer screening test because a rapid, accurate, noninvasive and inexpensive serum test for early cancer diagnosis could improve early detection rates and thereby patient outcomes. Therefore, our results indicate that the TIRF imaging assay, in addition to being a novel liquid biopsy platform for the detection of tumor-specific miRNA biomarkers in circulating EXs, may aid the diagnosis of a variety of diseases and the monitoring of early responses to treatment, which are important for new drug development and personalized treatment.
Abbreviations
A375: malignant melanoma cell line; AuNPs: gold nanoparticles; CD63apt: aptamers against CD63; CHO-K1: chinese hamster ovary cell line; DMEM: dulbecco's modified eagle medium; DOX: doxorubicin; Ect1/E6E7: normal cervical cell line; EMCCD: electron-multiplying charge-coupled device; EXs: exosomes; FBS: fetal bovine serum; HeLa: human cervical carcinoma cell line; IMDM: iscove's modified dulbecco's medium; LOD: limit of detection; MB: molecular beacon; MCF-7: human breast adenocarcinoma cell line; miRNA: microRNA; NHEM-c: normal human epidermal melanocytes; NTA: nanoparticle tracking analysis; PCR: polymerase chain reaction; qRT-PCR: quantitative real time polymerase chain reaction; S: substrate; SDP: split DNAzyme probe; SLO: streptolysin O; SM: single-base-mismatched; TIRF: total internal reflection fluorescence; TM: three-base-mismatched.
Acknowledgements
This work was financially supported by the National Natural Science Foundation of China (21775036, 21675046, 21735002), the Hong Kong Scholars Program, the Research Grant Council of Hong Kong (HKBU12308416 and C2012-15G), the Research Foundation of Education Bureau of Hunan Province (18B027) and the research committee of Hong Kong Baptist University (FRG2/17-18/059).
Author contributions
D.H. and H.W.L. conceived the project, designed the experiments and wrote the manuscript. D.H. and H.W. conducted all the experiments. S.L.H. and H.N.C. contributed to TIRF imaging and data analysis. L.H., X.H. and K.W. performed data analysis. All authors discussed the results and commented on the manuscript.
Supplementary Material
Supplementary figures and tables.
Competing Interests
The authors have declared that no competing interest exists.
References
1. György B, Szabó TG, Pásztói M, Pál Z, Misják P, Aradi B. et al. Membrane vesicles, current state-of-the-art: emerging role of extracellular vesicles. Cell Mol Life Sci. 2011;68:2667-88
2. Zijlstra A, Di Vizio D. Size matters in nanoscale communication. Nat Cell Biol. 2018;20:228-30
3. Tian Y, Ma L, Gong M, Su G, Zhu S, Zhang W. et al. Protein profiling and sizing of extracellular vesicles from colorectal cancer patients via flow cytometry. ACS Nano. 2018;12:671-80
4. Clancy JW, Sedgwick A, Rosse C, Muralidharan-Chari V, Raposo G, Method M. et al. Regulated delivery of molecular cargo to invasive tumour-derived microvesicles. Nat Commun. 2015;6:6919
5. Yoshioka Y, Konishi Y, Kosaka N, Katsuda T, Kato T, Ochiya T. Comparative marker analysis of extracellular vesicles in different human cancer types. J Extracell Vesicles. 2013;2:20424
6. Fang T, Lv H, Lv G, Li T, Wang C, Han Q. et al. Tumor-derived exosomal miR-1247-3p induces cancer-associated fibroblast activation to foster lung metastasis of liver cancer. Nat Commun. 2018;9:191
7. Santos JC, Lima NDS, Sarian LO, Matheu A, Ribeiro ML, Derchain SFM. Exosome-mediated breast cancer chemoresistance via miR-155 transfer. Sci Rep. 2018;8:829
8. Fan Q, Yang L, Zhang X, Peng X, Wei S, Su D. et al. The emerging role of exosome-derived non-coding RNAs in cancer biology. Cancer Lett. 2018;414:107-15
9. Morishita M, Takahashi Y, Nishikawa M, Ariizumi R, Takakura Y. Enhanced class I tumor antigen presentation via cytosolic delivery of exosomal cargos by tumor-cell-derived exosomes displaying a pH-sensitive fusogenic peptide. Mol Pharm. 2017;14:4079-86
10. Melo SA, Luecke LB, Kahlert C, Fernandez AF, Gammon ST, Kaye J. et al. Glypican-1 identifies cancer exosomes and detects early pancreatic cancer. Nature. 2015;523:177-82
11. Yoshioka Y, Kosaka N, Konishi Y, Ohta H, Okamoto H, Sonoda H. et al. Ultra-sensitive liquid biopsy of circulating extracellular vesicles using ExoScreen. Nat Commun. 2014;5:3591
12. Liang K, Liu F, Fan J, Sun D, Liu C, Lyon CJ. et al. Nanoplasmonic quantification of tumour-derived extracellular vesicles in serum microsamples for diagnosis and treatment monitoring. Nat Biomed Engineer. 2017;1:0021
13. Matsumura T, Sugimachi K, Iinuma H, Takahashi Y, Kurashige J, Sawada G. et al. Exosomal microRNA in serum is a novel biomarker of recurrence in human colorectal cancer. Br J Cancer. 2015;113:275-81
14. Madhavan B, Yue S, Galli U, Rana S, Gross W, Müller M. et al. Combined evaluation of a panel of protein and miRNA serum-exosome biomarkers for pancreatic cancer diagnosis increases sensitivity and specificity. Int J Cancer. 2015;136:2616-27
15. Jung KO, Youn H, Lee CH, Kang KW, Chung JK. Visualization of exosome-mediated miR-210 transfer from hypoxic tumor cells. Oncotarget. 2017;8:9899-910
16. Valadi H, Ekström K, Bossios A, Sjöstrand M, Lee JJ, Lötvall JO. Exosome-mediated transfer of mRNAs and microRNAs is a novel mechanism of genetic exchange between cells. Nat Cell Biol. 2007;9:654-9
17. Kogure T, Lin WL, Yan IK, Braconi C, Patel T. Intercellular nanovesicle-mediated microRNA transfer: a mechanism of environmental modulation of hepatocellular cancer cell growth. Hepatology. 2011;54:1237-48
18. Friedman RC, Farh KK, Burge CB, Bartel DP. Most mammalian mRNAs are conserved targets of microRNAs. Genome Res. 2009;19:92-105
19. Huan J, Hornick NI, Shurtleff MJ, Skinner AM, Goloviznina NA, Roberts CT. et al. RNA trafficking by acute myelogenous leukemia exosomes. Cancer Res. 2013;73:918-29
20. Montecalvo A, Larregina AT, Shufesky WJ, Stolz DB, Sullivan ML, Karlsson JM. et al. Mechanism of transfer of functional microRNAs between mouse dendritic cells via exosomes. Blood. 2012;119:756-66
21. Umezu T, Ohyashiki K, Kuroda M, Ohyashiki JH. Leukemia cell to endothelial cell communication via exosomal miRNAs. Oncogene. 2013;32:2747-55
22. Zhou Y, Zhou G, Tian C, Jiang W, Jin L, Zhang C. et al. Exosome-mediated small RNA delivery for gene therapy. WIRES RNA. 2016;7:758-71
23. Hong Y, Nam GH, Koh E, Jeon S, Kim GB, Jeong C. et al. Exosome as a vehicle for delivery of membrane protein therapeutics, PH20, for enhanced tumor penetration and antitumor efficacy. Adv Funct Mater. 2018;28:1703074
24. Kamerkar S, LeBleu VS, Sugimoto H, Yang S, Ruivo CF, Melo SA. et al. Exosomes facilitate therapeutic targeting of oncogenic KRAS in pancreatic cancer. Nature. 2017;546:498-503
25. Alvarez-Erviti L, Seow Y, Yin H, Betts C, Lakhal S, Wood MJ. Delivery of siRNA to the mouse brain by systemic injection of targeted exosomes. Nat Biotechnol. 2011;29:341-5
26. Tkach M, Théry C. Communication by extracellular vesicles: where we are and where we need to go. Cell. 2016;164:1226-32
27. Leslie M. Cell biology. NIH effort gambles on mysterious extracellular RNAs. Science. 2013;341:947
28. Chevillet JR, Kang Q, Ruf IK, Briggs HA, Vojtech LN, Hughes SM. et al. Quantitative and stoichiometric analysis of the microRNA content of exosomes. Proc Natl Acad Sci U S A. 2014;111:14888-93
29. Stevanato L, Thanabalasundaram L, Vysokov N, Sinden JD. Investigation of content, stoichiometry and transfer of miRNA from human neural stem cell line derived exosomes. PLoS One. 2016;11:e0146353
30. Lee JH, Kim JA, Kwon MH, Kang JY, Rhee WJ. In situ single step detection of exosome microRNA using molecular beacon. Biomaterials. 2015;54:116-25
31. Lee JH, Kim J, Jeong S, Rhee WJ. Simultaneous and multiplexed detection of exosome microRNAs using molecular beacons. Biosens Bioelectron. 2016;86:202-10
32. Nolte-'t Hoen ENM, van der Vlist EJ, Aalberts M, Mertens HCH, Bosch BJ, Bartelink W. et al. Quantitative and qualitative flow cytometric analysis of nanosized cell-derived membrane vesicles. Nanomedicine. 2012;8:712-20
33. Palanisamy V, Sharma S, Deshpande A, Zhou H, Gimzewski J, Wong DT. Nanostructural and transcriptomic analyses of human saliva derived exosome. PLoS One. 2010;5:e8577
34. Thery C, Amigorena S, Raposo G, Clayton A. Isolation and characterization of exosomes from cell culture supernatants and biological fluids. Curr Protoc Cell Biol. 2006 Chapter 3: Unit 3.22
35. Dragovic RA, Gardiner C, Brooks AS, Tannetta DS, Ferguson DJP, Hole P. et al. Sizing and phenotyping of cellular vesicles using Nanoparticle Tracking Analysis. Nanomedicine. 2011;7:780-8
36. Chan HM, Chan LS, Wong MS, Li HW. Direct quantification of single-molecules of microRNA by total internal reflection fluorescence microscopy. Anal Chem. 2010;82:6911-8
37. Ho SL, Chan HM, Ha AW, Wong MS, Li HW. Direct quantification of circulating miRNAs in different stages of nasopharyngeal cancerous serum samples in single molecule level with total internal reflection fluorescence microscopy. Anal Chem. 2014;86:9880-6
38. Ter-Ovanesyan D, Kowal EJK, Regev A, Church GM, Cocucci E. Imaging of isolated extracellular vesicles using fluorescence microscopy. Extracellular Vesicles: Methods and Protocols. 2017;1660:233-41
39. Cheung MC, Spalding PB, Futierrez JC, Balkan W, Namias N, Koniaris LG. et al. Body surface area prediction in normal, hypermuscular, and obese mice. J Surg Res. 2009;153:326-31
40. He D, Hai L, He X, Yang X, Li HW. Glutathione-activatable and O2/Mn2+-evolving nanocomposite for highly efficient and selective photodynamic and gene-silencing dual therapy. Adv Funct Mater. 2017;27:1704089
41. He D, He X, Yang X, Li HW. A smart ZnO@polydopamine-nucleic acid nanosystem for ultrasensitive live cell mRNA imaging by the target-triggered intracellular self-assembly of active DNAzyme nanostructures. Chem Sci. 2017;8:2832-40
42. Hannafon BN, Carpenter KJ, Berry WL, Janknecht R, Dooley WC, Ding WQ. Exosome-mediated microRNA signaling from breast cancer cells is altered by the anti-angiogenesis agent docosahexaenoic acid (DHA). Mol Cancer. 2015;14:133
43. Li L, Li C, Wang SX, Wang ZH, Jiang J, Wang W. et al. Exosomes derived from hypoxic oral squamous cell carcinoma cells deliver miR-21 to normoxic cells to elicit a prometastatic phenotype. Cancer Res. 2016;76:1770-80
44. Simeoli R, Montague K, Jones HR, Castaldi L, Chambers D, Kelleher JH. et al. Exosomal cargo including microRNA regulates sensory neuron to macrophage communication after nerve trauma. Nat Commun. 2017;8:1778
45. Liao J, Liu R, Shi YJ, Yin LH, Pu YP. Exosome-shuttling microRNA-21 promotes cell migration and invasion-targeting PDCD4 in esophageal cancer. Int J Oncology. 2016;48:2567-79
46. He Y, Li HW, Yeung ES. Motion of single DNA molecules at a liquid-solid interface as revealed by variable-angle evanescent-field microscopy. J Phys Chem B. 2005;109:8820-32
47. Baker MB, Bao G, Searles CD. In vitro quantification of specific microRNA using molecular beacons. Nucleic Acids Res. 2012;40:e13
Author contact
![]() Corresponding author: Hung-Wing Li, email: hwliedu.hk
Corresponding author: Hung-Wing Li, email: hwliedu.hk