Impact Factor
- Issue 14; 2026
- Issue 13; 2026
- Issue 12; 2026
- Issue 11; 2026
- Issue 10; 2026
- Volume 16; 2026
- Advance Articles
- Past Issues
- Cover Images
- Cover Suggestion
- Index & Coverage
- Special Issues
Introduction
Materials and Methods
Results
Discussion
Abbreviations
Supplementary Material
Acknowledgements
References
International Journal of Biological Sciences
International Journal of Medical Sciences
 Global reach, higher impact

Theranostics 2019; 9(15):4421-4436. doi:10.7150/thno.32854 This issue Cite
Research Paper
LncRNA AY promotes hepatocellular carcinoma metastasis by stimulating ITGAV transcription
Chun Lan Kang1*, Bing Qi1*, Qian Qian Cai1, Li Sheng Fu1, Ying Yang1, Chang Tang1, Ping Zhu2, Qi Wen Chen3, Jing Pan4, Mei Hua Chen1, Xing Zhong Wu1 ![]()
1. Department of Biochemistry and Molecular Biology, School of Basic Medical Sciences, Fudan University, NHC Key Laboratory of Glycoconjugates Research (Fudan University), Shanghai, P.R. China.
2. Zhejiang Provincial People's Hospital, Hangzhou, P,R. China.
3. Tumor Hospital, Fudan University, P,R. China.
4. The Second Affiliated Hospital & Yuying Children's Hospital, Wenzhou Medical University, P. R. China.
* These authors contributed equally to this study.
Received 2019-1-6; Accepted 2019-5-21; Published 2019-6-9
Abstract

Rationale: Tumor metastasis is the main cause for cancer-related death. However, the driving molecules of metastasis remain largely unknown. Here, we aim to identify long non-coding RNAs (lncRNAs) critical for human hepatocellular carcinoma (HCC) metastasis.
Methods: Microarrays were used to screen a comprehensive set of lncRNAs with differential expression profiles in sulfatide-treated cells. Mass spectrometry, protein arrays, and RNA pull-down experiments were used to identify proteins that interacted with lncRNA. Epigenetic analysis was used to study lncRNA-mediated regulation mechanisms.
Results: We identified lncRNA AY927503 (AY) as a metastasis-associated molecule that was highly expressed in human hepatocellular carcinoma (HCC) and correlated with metastatic events and poor prognosis in patients with HCC. AY promoted HCC cell migration, stemness, 5-fluorouracil resistance, and metastasis in mice. However, knockdown of integrin αV (ITGAV) abolished AY-stimulated migration, cell viability in HCC cells or tube formation. AY strongly promoted ITGAV transcription and αVβ3 expression by interacting with the ITGAV promoter specifically and stimulating its activity. AY was identified to interact with histone 1FX (H1FX), but deletion of the central domain of AY (AY∆371-522) abolished H1FX binding and ITGAV promoter stimulation. AY significantly enriched H3K4Me3 and acH3K9/14 but reduced H3K27Me3 and H1FX occupancy on the ITGAV promoter, which remodeled chromatin structures for RNA polymerase II recruitment. Knockdown of H1FX abrogated ITGAV transcription stimulated by AY.
Conclusions: Our findings suggested that lncRNA AY promoted HCC metastasis via induction of chromatin modification for ITGAV transcription as a pioneer factor and was a potential molecular signature for metastasis or poor prognosis in patients with HCC.
Keywords: metastasis, integrin, migration, linker histone, epigenetics
Introduction
Hepatocellular carcinoma (HCC) is one of the malignancies with the poorest prognosis due to high incidence of metastasis that causes cancer-related deaths, worldwide. However, a lack of complete understanding of metastasis has significantly slowed advances in HCC treatment. The dissemination of cancer cells and subsequent colonization occur through a complex metastasis cascade. Tissue-specific homing of cancer cells largely depends on their adhesion to specific luminally expressed molecules on the vasculature [1]. In this multi-step metastasis cascade, integrin is important for acquiring epithelial-mesenchymal transition (EMT)-associated traits for cancer cell colonization [2]. The interactions between integrin αVβ3 on the cell surface and matrix proteins contribute to disseminated cell adhesion, cell survival, and colony formation, which characterize the metastatic phenotype [3]. The expression of integrin αV (ITGAV) has not only been associated with high rates of metastasis and poor prognosis [4] in epithelial cancers, but been linked to self-renewal in cancer stem cells [5]. Changes in the expression and activation of ITGAV, which impact adhesion-independent cell growth and survival in many primary and metastatic tumor cells, are pathologic hallmarks of cancer [5-7]. However, the mechanisms that control ITGAV expression remain largely unknown. Long non-coding RNA (lncRNA) has been shown to influence transcription of cis-linked genes or their neighboring genes [8]. Currently, the mechanisms by which non-coding gene activation impacts neighboring gene transcription still remain unclear [9].
The eukaryotic genome is folded into a hierarchy of topological chromatin domains and insulated structures [10]. Together with core histones, the linker histones (H1) help chromatin fold into higher-order structures [11]. Histone H1 is a class of structural proteins consisting of seven variants (H1.0, H1.1 to H1.5, and H1FX) in human somatic cells. The typical H1 structure consists of a central globular domain flanked by unstructured N- and C-terminal tails. The globular domain of H1 has a winged-helix fold structure with a preference for nucleosome recognition and associates with linker DNA [11, 12]. H1 binding to nucleosome mainly depends on hypoacetylation of core histones [12], which enables its binding of inactive genes. With distinct and preferential binding of chromatin or regulatory factors, linker histone may regulate gene profile differently. Here, we explored the role of lncRNA in promoting the migration and metastasis of HCC via ITGAV expression. AY interacted with histone H1FX and triggered chromatin remodeling on ITGAV promoter in HCC, leading to transcription initial complex for the ITGAV transcription.
Materials and Methods
Cell culture and transfection
Hep3B, HepG2, SK-Hep1, LM3, BEL-7404, SMMC-7721, and human hepatocyte LO2 cells were from Cell Bank of Type Culture Collection of Shanghai Institute of Biochemistry & Cell Biology, Chinese Academy of Science, and cultured in Dulbecco's Modified Eagle's Medium (Gibco-Life Technologies) supplemented with 10% fetal bovine serum (FBS). Human umbilical vein endothelial cells (HUVECs) and human embryonic kidney cells (HEK-293T) were cultured in DMEM supplemented with 10% FBS. Hep3B, HepG2, SK-Hep1, LO2, and HEK-293T cells were authenticated by STR (short tandem repeats). BEL-7404, SMMC-7721 cells were identified by their morphological characteristics which were consistent with the report of establishment [13]. Cells were not contaminated by mycoplasma, and also not infected by bacteria or fungi. All cells were cultured in a humidified incubator with 5% CO2 at 37 °C. Plasmid DNA transfection assays were conducted when the confluence of incubated cells reached 60%-70%. For sulfatide treatment, cells were incubated at initial density 0.5x10⁵ cells/mL and treated with 2 μM galactocerebroside (Gal-Cer) or sulfatide (Sigma, St. Louis, Missouri, USA).
Plasmid construction
The primers for plasmid construction are listed in the Supplemental Table 1. The ITGAV promoter fragments were amplified by PCR as reported previously [14], and were cloned into a pGL3-basic vector at Xho I and Kpn I sites. Plasmids pSilencer4.1-shITGAV and pSilencer4.1-shAY were constructed based on two target sequences each and one was selected.
Human samples
Tumor tissues and adjacent non-tumor tissue samples were collected from patients (n = 57) at Fudan University Liver Cancer Institute, Shanghai Eastern Hepatobiliary Surgery Hospital, Third Affiliated Hospital of Zhongshan University, Shanghai Tenth People's Hospital, and First Affiliated Hospital of Wenzhou Medical University. Histological examination was used to confirm HCC diagnosis. Paraffin-embedded tissue blocks from 80 patients and corresponding hematoxylin and eosin-stained sections were overlaid for tissue microarray preparation by Super-Biotek (Shanghai, China). All studies involving human samples were approved by the Fudan Biomedical ethics committee (approval number 14000000020000024) and data privacy was maintained.
Quantitative reverse transcription PCR (qRT-PCR)
Total RNA was isolated from various HCC cells, subcutaneous tumor tissues of nude mice using TRIzol reagent (Invitrogen, Life Technologies). The RNA extracted was subjected to reverse transcriptase reaction using M-MLV reverse transcriptase (Takara, Dalian, China) according to the manufacturer's instruction. The levels of lncRNA AY and ITGAV mRNA were measured by qPCR using the primers listed in the Supplemental Table 1.
In vitro tube formation assay
The μ-Slide Angiogenesis plate (Ibidi, Martinsried, Germany) was added with 10 μL/well Matrigel (BD Biosciences, CA, USA) and allowed to polymerize for 2 hours at 37 °C. At 48 hours after transfection, 1x10⁴ HUVEC cells were seeded in the slides and incubated for 4 - 6 hours at 37 °C prior to slide viewing.
MTT assay and colony forming assays
HCC cells (5×10³ cells/well) were seeded in triplicates in 96-well plates and treated with 2 μM 5-fluorouracil (5-FU; Shanghai Haipu Pharm, China), cisplatin (TargetMol, USA), sorafenib (Bayer, Germany), or sunitinib (Pfizer, USA). After incubation at 37 °C for indicated time, 20 μL of MTT (3-(4,5-dimethylthiazol-2-yl)-2,5-diphenyltetrazolium bromide) solution (5 mg/mL) was added in each well, and cells were incubated at 37 °C for an additional 4 hours. The formazan crystals were dissolved in dimethyl sulphoxide (DMSO), and measured using a spectrometer at a wavelength of 570 nm. For colony forming assay, 1000 cells were seeded on a 6-cm dish in triplicates and cultured for 2 weeks at 37 °C. The growth medium was refreshed every 2 days. After incubation, colonies were fixed using methanol, stained using crystal violet, and counted under an inverted microscope.
Immunostaining and histology
Frozen tissue sections were used for immunohistochemical analysis. Blood vessels in the tissue sections were stained with CD31 antibody. A rabbit anti-mouse ITGAV or αVβ3 antibody was used to identify the integrin αV subunit or αVβ3 in mouse subcutaneous tumors and liver metastasis foci, respectively. The details of antibodies used in immunohistochemistry are shown in Supplemental Table 2.
Immunofluorescence
Cells fixed on the cover glass were blocked with goat serum and incubated with rabbit primary antibodies followed by goat anti-rabbit FITC-conjugated secondary antibodies. Details of antibodies in immunofluorescence assay are listed in the Supplemental Table 2. Nuclei were stained using 4'-6-diamidino-2-phenylindole (DAPI) (Sigma, St. Louis, Missouri, USA). Confocal laser scanning microscopy images were acquired by using LEICA TCS SP8 confocal microscope (Leica Microsystem, USA).
Flow cytometry analysis
Cell surface integrin αV and αVβ3 were assessed by flow cytometry analysis as reported previously [14]. The antibody information in flow cytometry analysis is shown in Supplemental Table 2.
In situ hybridization
In situ hybridization (ISH) was performed to detect AY in HCC cells using Enhanced Sensitive ISH Detection Kit II (Boster, Wuhan, China) according to the manufacturer's instructions.
Western blotting
Cells were lysed using SDS lysis buffer (0.1% SDS, 1 x Protease Inhibitor Cocktail, Millipore, MA, USA). Proteins were separated using 10% SDS-polyacrylamide gels and transferred to polyvinylidene fluoride membranes. The blots were incubated with primary antibodies followed by incubation with horseradish peroxidase-conjugated secondary antibodies and visualized using the chemiluminescence detection kit (Millipore, MA, USA). Protein bands were quantitatively analyzed by measuring the grey value using Image J software. The information of antibodies used in Western blotting is summarized in Supplemental Table 2.
Luciferase reporter assay
For luciferase assays, cells were co-transfected with pSilencer4.1-shAY or pcDNA3.1b-AY and firefly luciferase reporter constructs containing the integrin αV promoter in pGL3-basic vectors. The cell lysates were analyzed using a luciferase reporter assay system (Promega, Madison, USA).
Protein microarrays
The T7 promoter was constructed into the upstream sequence of AY by PCR. RNAs were transcribed in vitro using MEGAscript T7 Kit (Ambion, USA) and labeled with fluorescent dye Cy5 using manufacturer's instructions. HuProtTM 20K Human Protein Microarray (CDI Lab, Mayaguez, USA) was used for AY analysis.
RNA pull-down assays and RNA immunoprecipitation
RNA pull-down analysis was performed as previous report [15]. In brief, Full-length AY or mutated AY RNA was in vitro transcribed using T7 RNA polymerase and labeled with biotin (Roche, Mannhein, Germany). Then cytoplasmic extracts prepared from Hep3B cells using RIPA buffer (150 mM NaCl, 0.5% sodium deoxycholate, 0.2% SDS, 1% NP40, 1% Triton X-100, 1mM EDTA, and 50 mM Tris pH 8.0) were incubated with in vitro transcribed and biotinylated RNA, which were then targeted with streptavidin beads (Vector Laboratories, CA, USA) and washed. The associated proteins were resolved by gel electrophoresis. RNA immunoprecipitation assays were performed as reported previously [9]. Hep3B cells were treated with 1% formaldehyde, dissolved in RIPA buffer, and supplemented with Recombinant RNase Inhibitor (Takara, Dalian, China) and Protease Inhibitor Cocktail (Millipore, MA, USA). The lysates were sonicated and then centrifuged at 13,800 g for 10 min. After preclearing, supernatants were incubated with indicated antibodies for 4 hours and subsequently incubated with protein G agarose (Millipore, MA, USA) for 2 hours. AY enrichment was analyzed using qRT-PCR. Antibody information used in these 2 assays is summarized in Supplemental Table 2.
Chromatin immunoprecipitation (ChIP)
ChIP was performed using EZ-ChIPTM kit (Millipore, MA, USA) as described previously [4]. Chromatin Isolation by RNA Purification (ChIRP) was according to previous reports [16]. Primers used in ChIP-qPCR are listed in the Supplemental Table 1.
Animal studies
All animal experiments were performed according to the Animals Ordinance and the institutional guidelines concerning animal use and care. They were approved by the Animal Ethics Committee, School of Basic Medical Sciences, Fudan University (permit number 20140226-001). SMMC-7721 cells (5x10⁶) stably overexpressing AY and mock cells were injected subcutaneously into 4-week old female BALB/c nude mice. Tumor size was determined by measuring the length and width, and tumor volume (mm3) was calculated thereafter. All mice were sacrificed 31 days after injection, and tumors from each animal were weighed and examined for metastasis and histopathological studies. For Matrigel plug assay, BALB/c nude mice (4 weeks of age) were given subcutaneous injections of 200 μL of Matrigel (BD Biosciences) containing 5×10⁶ SMMC-7721-AY4 stably overexpressing AY or SMMC-7721-Mock6 cells. Two weeks later, the plug was isolated, fixed and stained with CD31 antibody. For metastasis assay, 2x10⁴ SMMC-7721-AY4 cells and mock cells were injected into nude mice through tail vein. Four weeks later, all of nude mice were sacrificed and their livers and lungs were isolated for examination of metastatic foci and histology.
Statistical analysis
The difference between individual groups was assessed by Mann-Whitney U test or Student's t-test. Overall survival was analyzed by the Kaplan-Meier plot. For Kaplan-Meier analysis, AY cutoff point was calculated based on the time-dependent ROC curve analysis using SPSS 22.0 (IBM Corporation, Armonk, NY, USA) rather than simply using the median. All data were presented as mean ± standard deviation (SD). P value less than 0.05 was defined as significant. Data were collected from at least three independent experiments (triplicates).
Results
LncRNA AY927503 is highly expressed in HCC cells
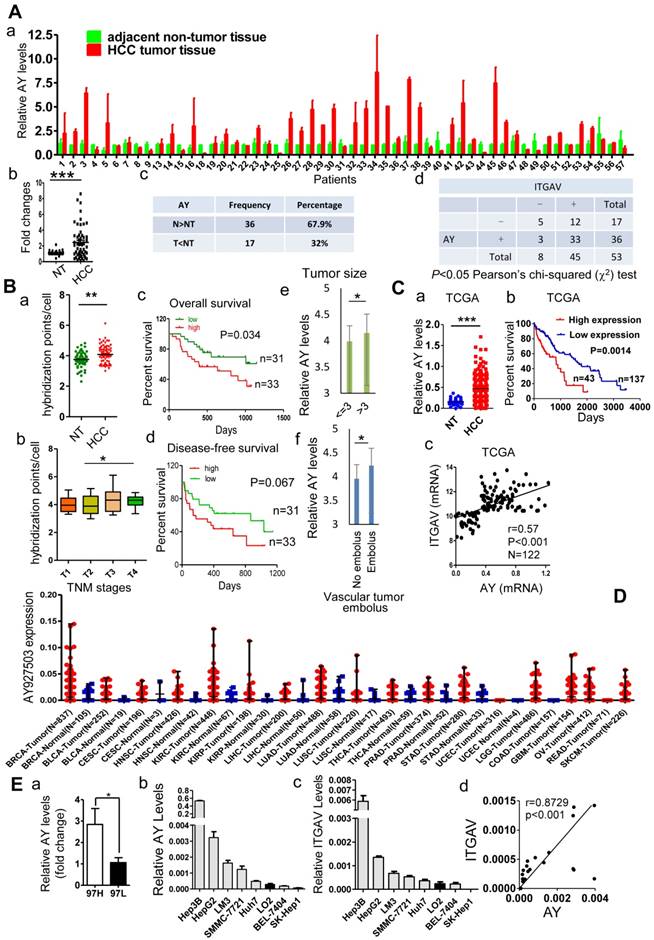
We compared the lncRNA profile in sulfatide-treated HCC cells with that of control cells using the ArrayStar lncRNA microarray V2.0 and observed a comprehensive set of differentially expressed lncRNAs (data not shown). Levels of lncRNA AY927503 (AY) were increased by more than 2-fold compared with control, which was further confirmed by polymerase chain reaction (PCR). Coding potential assessment tool (CPAT) and coding potential calculator (CPC) analyses indicated that the AY transcript had very low coding probability (Supplemental Figure 1A). In a cohort of 53 pairs of HCC and adjacent non-tumor (NT) specimens, we found that HCC tissues showed significantly higher AY expression than the paracancerous NT tissues (P < 0.001, Figure 1A, a & b). In another cohort of 80 patients with HCC, in situ hybridization assays in a tissue array showed that AY signals per cell were significantly higher in HCC tissues than in adjacent NT tissues (P < 0.01, Figure 1B, a). Patients at T3 and T4 stages of HCC showed increased AY signals compared with patients at T1 and T2 stages (P < 0.05, Figure 1B, b). Survival analysis of patients (n = 64) that were followed up showed that patients with low AY expression survived longer than those with high AY expression (P = 0.034, Figure 1B, c & d). Patients with large tumor sizes (>3cm) showed higher AY levels than patients with small tumor sizes (P < 0.05, Figure 1B, e). Patients with vascular tumor emboli showed higher AY levels than patients without tumor emboli (P < 0.05, Figure 1B, f). Analysis of data from the cancer genome atlas (TCGA) HCC database also showed that HCC tissues had elevated AY expression compared with their paired NT tissues (P < 0.001, N = 248, Figure 1C, a). Kaplan-Meier survival analysis showed that high AY levels were closely associated with poor overall survival in patients with HCC (N = 180, P = 0.0014, Figure 1C, b). AY broadly expressed in breast (N = 837), kidney (N = 448), lung (N = 488) and liver tissues. Like in HCC, AY showed higher expression in tumors than in normal tissues (Figure 1D). We also found that AY expression was significantly higher in MHCC97H (high metastatic potential) HCC cells than MHCC97L (low metastatic potential) HCC cells (P < 0.05, Figure 1E, a). These suggested that increased AY expression was associated with metastasis of HCC.
AY was highly expressed in HCC tissues and cells. A. Quantitative RT-PCR analysis of lncRNA AY expression in HCC tissues (T) and matching adjacent non-tumor (NT) liver tissues (a,c). Significant differences in median AY expression levels between HCC and NT (P < 0.001) by Mann-Whitney test (b). Correlation analysis between integrin αV (ITGAV) and AY expression levels (d). -, ITGAV RNA expression level was lower in HCC tissue than adjacent NT tissue; +, ITGAV RNA expression level was higher in HCC tissue than adjacent NT tissue. The differences reached significance (P < 0.05) by Pearson χ2 test. B. In situ hybridization analysis of AY expression in 80 paired HCC tissues and adjacent non-tumor (NT) tissues. The positive hybridization signals per cell were compared between HCC and NT tissues (a). Kaplan-Meier survival analysis of patients with low AY expression (low) and high AY expression (high) based on threshold 4.083 calculated by time-dependent ROC curve analysis (c & d). Comparison of AY expression between early (T1, 2) and late (T3, 4) TNM stage tumors (b); between patients with large (> 3 cm) and small (< 3 cm) tumor sizes (e); and between patients with vessel carcinoma embolus and without embolus (f). C. AY expression analysis of 180 HCC cases from the TCGA database (a). Kaplan-Meier analysis of overall survival of 180 patients with HCC based on AY expression (0.635 as AY cutoff calculated by time-dependent ROC curve analysis) (b). Pearson correlation analysis between AY expression and ITGAV expression (c). D. AY expression in various tissues and tumors from TCGA database. BRCA Breast invasive carcinoma, BLCA Bladder urothelial carcinoma, CESC Cervicalsquamous cell carcinoma and endocervical adenocarcinoma, HNSC Head and neck squamous cell carcinoma, KIRC Kidney renal clear cell carcinoma, KIRP Kidney renal papillary cell carcinoma, LIHC Liver hepatocellular carcinoma, LUAD Lung adenocarcinoma, LUSC Lung squamous cell carcinoma, THCA Thyroid carcinoma, PRAD Prostate adenocarcinoma, STAD Stomach adenocarcinoma, UCEC Uterine corpus endometrioid carcinoma, LGG Brain lower grade glioma, COAD Colon adenocarcinoma, GBM Glioblastoma multiforme, OV Ovarian serous cystadenocarcinoma, READ Rectum adenocarcinoma, SKCM Skin cutaneous melanoma. E. QRT-PCR analysis of AY expression in HCC cells with high (MHCC97H) and low (MHCC97L) metastatic potential (a). AY and ITGAV expression was analyzed by qRT-PCR in various liver cancer cell lines and human hepatocytes, LO2 (b & c). Pearson correlation analysis between AY and ITGAV RNA expressions (d). Data are representative of three independent experiments. *, P < 0.05; **, P < 0.01; ***, P < 0.001.
AY promotes ITGAV expression
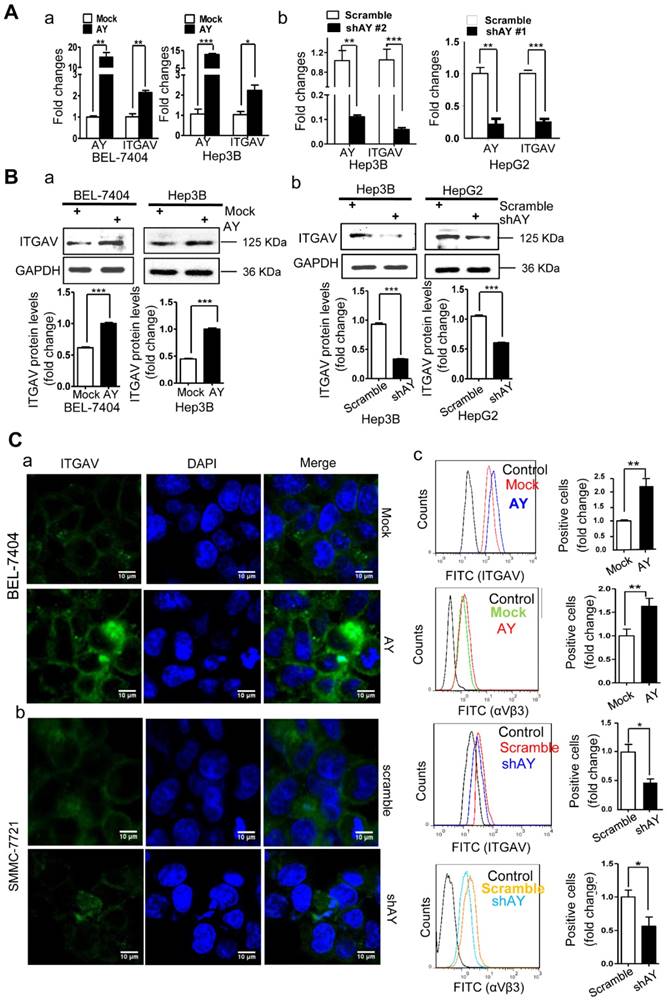
We have previously shown that sulfatide promoted metastasis of HCC by integrin αVβ3 via upregulation of ITGAV [14, 17]. We analyzed AY and ITGAV expression levels in seven liver cancer cell lines and human hepatocyte LO2 cell line. The expression profile of AY in Hep3B, HepG2, LM3, SMMC-7721, Huh7, LO2, BEL-7404, and SK-Hep1 cells was similar to that of ITGAV. We observed a close positive correlation between AY and ITGAV expression levels (Pearson correlation coefficient r = 0.8729, Figure 1E, b-d). We analyzed the expression levels of AY and ITGAV mRNA in tissue samples from 53 patients with HCC. Thirty six out of 53 HCC tissue samples showed significantly higher AY levels than adjacent NT tissues (P < 0.01, Figure 1A, c). Of the 36 samples, 33 also expressed high levels of ITGAV. Five out of 17 HCC samples that showed lower AY levels than adjacent NT tissues also showed lower ITGAV levels (Figure 1A, d). Pearson Chi-square (χ2) test results showed a significant correlation between AY and ITGAV expression levels (P < 0.05). TCGA data analysis also showed a close correlation between AY and ITGAV expression levels (N = 122, P < 0.0001, Figure 1C, c). We ectopically expressed AY or specifically silenced/knocked out AY in HCC cells to study its influence on ITGAV expression. In HCC cells that overexpressed AY, ITGAV mRNA levels were increased by almost two-folds, but knockdown of AY sharply reduced ITGAV mRNA levels (Figure 2A). ITGAV protein levels were also enhanced in HCC cells that overexpressed AY and were significantly reduced in AY knockdown cells compared with that of control cells (Figure 2B). Immunofluorescence analysis showed that ITGAV and integrin αVβ3 expression on the cell surface was significantly increased in HCC cells that overexpressed AY and was decreased in AY knockdown cells (Figure 2C).
AY enhanced the expression of ITGAV in HCC cells. A. QRT-PCR analysis of RNA levels of AY and ITGAV in the indicated cells that were transfected with pcDNA3.1b-AY (AY) and pcDNA3.1b (Mock), respectively (a). Relative RNA levels of AY and ITGAV were analyzed by qRT-PCR at 24 hours after AY-targeted short hairpin #1 & #2 transfection (b). B. In the indicated cells transfected with AY, shAY or corresponding control, the protein levels of ITGAV were examined by Western blotting (upper) and quantitated (lower). C. Representative fluorescence microscope images (100×) of ITGAV immunostaining at 48 hours after transfection with pcDNA3.1b-AY and pcDNA3.1b, respectively (a & b). Flow cytometry measurements of ITGAV or αVβ3 on cells after ectopic expression and silencing of AY, respectively (c). Data are representative of three independent experiments. *, P < 0.05; **, P < 0.01; ***, P < 0.001.
AY promotes metastasis-related behaviors in HCC cells
Because angiogenesis is important for tumor metastasis, which is associated with integrin αVβ3, we performed the tube formation assay to investigate the role of AY in angiogenesis. We found that human umbilical vein endothelial cells (HUVECs) that overexpressed AY showed significantly more branching points (an indicator of angiogenesis) than mock cells (P < 0.01, Figure 3A). Knockdown of ITGAV not only abolished the angiogenic effect of AY in HUVECs, but also reduced the branching points to a number lower than that of the mock group. However, overexpression of ITGAV restored the branching ability of HUVECs. The number of colonies formed in AY-transfected cells was significantly greater than that of the mock cells. However, the colony number was significantly reduced in cells that were silenced for AY compared with that of scramble control (Figure 3B, a). Overexpression of AY significantly increased cell viability (Figure 3B, b), but knockdown of ITGAV abolished this AY effect. In Hep3B cells, knockdown of AY significantly reduced cell vitality rate, but transfection of ITGAV or the AY construct rescued cell vitality rates (Figure 3B, b).
AY promoted HCC cell angiogenesis and proliferation. A. Representative micrographs of HUVEC tube formation after AY overexpression or AY silencing (left). Quantification of the branching points (right). Original magnification: 10×. B. Colony formation assay in the cells overexpressing AY, AY knockdown and AY rescue cells and quantitative analysis (a). Cell vitality measurements in cells with AY overexpression, knockdown, or rescue (b). C.&D. EMT-related proteins and stem cell marker proteins were analyzed by Western blotting in indicated cells with AY overexpression or silencing (a). Quantification using Image J software was statistically summarized in the lower panel (b). E. Quantitative RT-PCR analysis of AY expression in the cells treated with various chemotherapy agents at a concentration of 2 μM (a & b). Cell vitality measurements of AY-overexpressing or AY-silenced HCC cells treated with 2 μM of 5-FU by MTT assays (c & d). IC50 value was determined in transfected cells and treated with various concentrations of 5-FU for 72 hours (e & f). Data are representative of three independent repeats. *, P < 0.05; **, P < 0.01; ***, P < 0.001.
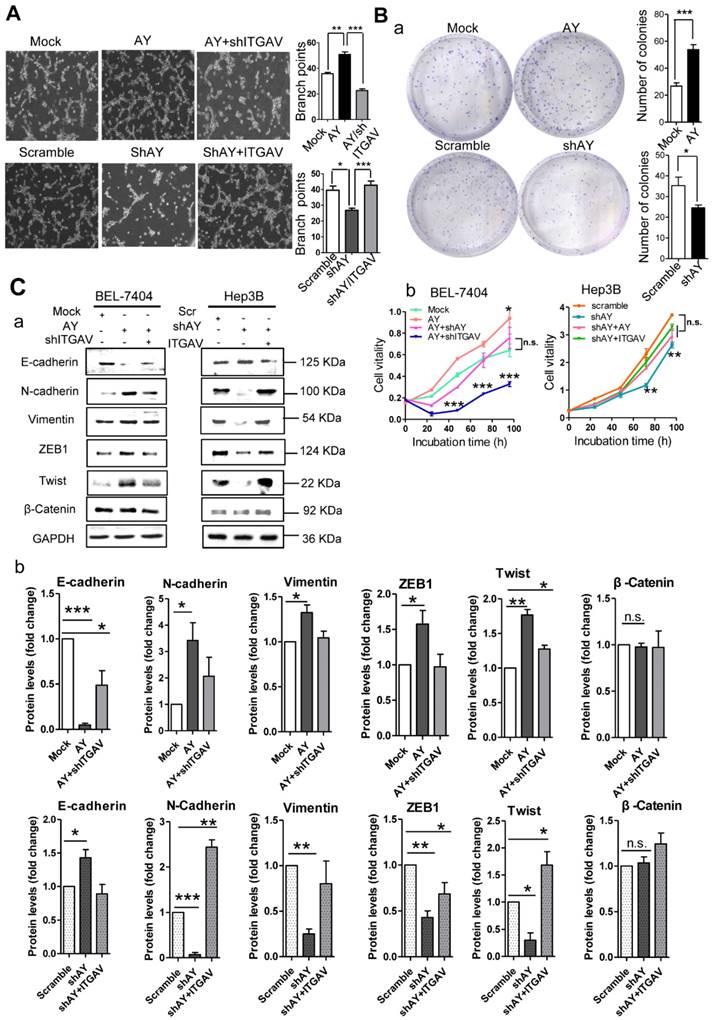
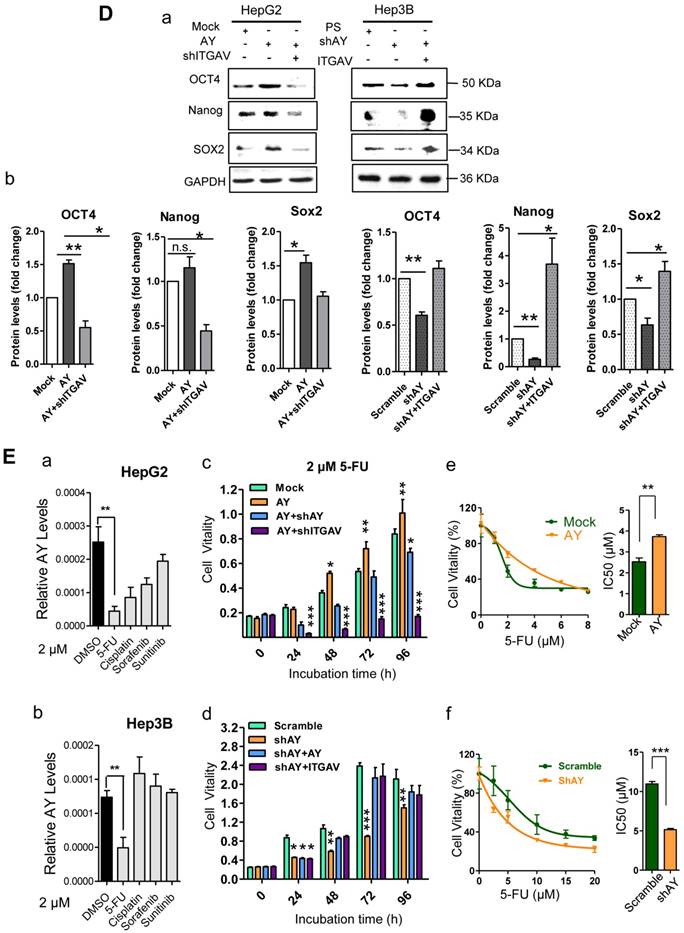
EMT is an important process that enables tumor cell migration and metastasis in HCC. We found that AY significantly reduced the expression levels of E-cadherin and enhanced the levels of N-cadherin, ZEB1, or Twist (Figure 3C, a & b). However, these AY effects were abolished by ITGAV knockdown. Conversely, knockdown of AY promoted E-cadherin but inhibited N-cadherin, vimentin, ZEB1 and Twist expression and ITGAV overexpression reversed this effect (Figure 3C, a & b). We also examined the role of AY in promoting cancer stem cell (CSC) traits and chemoresistance. We found that overexpression of AY enhanced the expression of stem cell markers OCT4 and SOX2. However, this effect was also abolished by ITGAV knockdown (Figure 3D, a & b). Conversely, AY silencing significantly reduced the expression levels of OCT4 and SOX2, but this effect was reversed by ITGAV overexpression. AY expression was significantly reduced in cells treated with 2 μM 5-fluorouracil (5-FU) compared with that in control cells (P < 0.01, Figure 3E, a & b). However, the cell vitality of the cells treated with 2 μM 5-FU was significantly enhanced by the overexpression of AY and reduced by the silencing of ITGAV compared with that of the mock group (Figure 3E, c). Conversely, AY knockdown sharply inhibited cell vitality of Hep3B cells treated with 5-FU, but AY or ITGAV overexpression completely restored cell vitality after 48 hours (Figure 3E, d). The half maximal inhibitory concentration (IC50) for 5-FU was significantly elevated in HepG2 cells overexpressing AY compared with that in control cells. Knockdown of AY sharply decreased the IC50 of 5-FU in Hep3B cells (Figure 3E, e & f). Our results suggested that AY promoted HCC metastasis-related behaviors via regulating ITGAV expression.
AY promotes HCC metastasis
Using tumor xenografts, we studied the effects of lncRNA AY on tumor growth and metastasis in vivo. Based on AY and ITGAV levels, stable AY-overexpressing (AY4) and control (M6) cells were selected for tumor xenograft experiments (Figure 4A). We subcutaneously injected AY4 or M6 cells (5×10⁶ cells) into 4-week old female BALB/c nude mice (n = 10/group), and examined tumor sizes. We found that the tumors in the AY group were significantly larger and heavier than those in the control group (Figure 4B). The AY group showed higher AY and ITGAV mRNA levels and stronger staining of ITGAV and integrin αVβ3 (Figure 4C, a & b) than the control group.
AY promoted HCC cell growth and metastasis. A. Validation of AY and ITGAV expression in stably transfected cell lines by qRT-PCR (upper) and Western blotting (lower), respectively. B. Representative images of nude mice and subcutaneous tumors (a & c). Volume and weight measurements of subcutaneous tumors derived from SMMC-7721 cells stably transfected with pcDNA3.1b (Mock6) and pcDNA3.1b-AY (AY4) (b). C. The AY and ITGAV expression in the implanted tumors were analyzed by qPCR (a). Representative micrographs of immunohistochemical staining with ITGAV and integrin αVβ3 antibodies in the implanted subcutaneous tumors (b & c, bar = 100 μm). The boxed field was amplified in the lower panel (bar = 20 μm). D. Representative images of immunohistochemical staining of CD31 in the subcutaneous tumor (a, bar=100 μm) and the Matrigel-plug (b, bar = 20 μm). Quantitative analysis of the microvascular density in AY-overexpressing cells (right). E. Representative images of lungs and livers (left) from nude mice at 4 weeks after tail vein injections with stably transfected Mock6 and AY4 cells. Images of H&E-staining (middle) and quantitative analysis of metastasis foci (right). Bar = 100 μm. F. Representative images of immunohistochemical ITGAV staining in liver metastatic foci (original magnification: 10×, bar = 100 μm). Boxed fields are shown at 40× magnification (bottom, bar = 20 μm). Data are representative of three independent experiments. *, P < 0.05; **, P < 0.01.
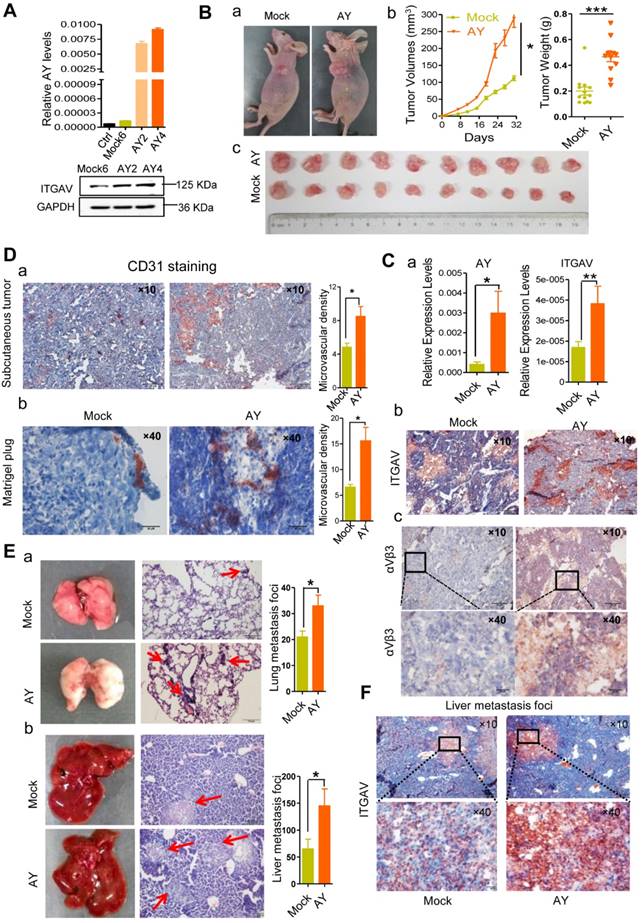
Tumor tissues in the AY group showed more positive CD31 (blood vessel endothelial cell marker) staining than the control (Figure 4D, a). More CD31 positive cells were also observed in the Matrigel-plug of the AY group than the control group (Figure 4D, b). The AY group also showed significantly more metastasis foci in the liver and lung than the mock group (Figure 4E). Also, ITGAV staining was more intense in liver metastasis tissues in the AY group than that in the control group (Figure 4F). Our results suggested that AY promoted ITGAV expression and HCC metastasis in vivo.
AY enhances ITGAV gene transcription
We next performed in situ hybridization assay in HCC cells and observed that AY was localized either in the nucleus or in the cytoplasm (Figure 5A, a). To know whether AY interacted with ITGAV gene we further conducted chromatin isolation by RNA purification (ChIRP) experiments to pull down sonication-sheared genome DNA using biotinylated AY and noted that the ITGAV promoter was as part of the AY complex (Figure 5B), which suggested that AY interacted with the ITGAV promoter. We then performed luciferase reporter assays using the full-length ITGAV promoter (-1295 to +207) [14] to investigate the effect of AY on ITGAV promoter activity (Figure 5A, b). We found that AY overexpression significantly stimulated ITGAV promoter activity (Figure 5A, c) in SMMC-7721 (P < 0.001), HEK-293T (P < 0.01), and HeLa (P < 0.001) cells. However, AY knockdown in these cells significantly reduced ITGAV promoter activity (Figure 5A, d). Full-length AY did not enhance tyrosine hydroxylase (TH) or pGL3 promoter activities (Figure 5C, d), which suggested that AY specifically regulated ITGAV promoter activity.
AY up-regulated ITGAV transcription. A. Representative micrographs of AY in situ hybridization and fluorescent in situ hybridization (a). Arrows indicate hybridization spots. Transcription activity analysis of the ITGAV core promoter region (-1295 ~ +207) in 3 cell lines by luciferase reporter assay (b). Effect of AY expression on transcriptional activity of the ITGAV promoter using luciferase reporter assay (c & d). B. A schematic diagram of the Biotin-AY pull-down experiment (upper). PCR identification of IGTAV promoter sequence in the DNA complex pulled down by biotinylated AY. Western analysis of H1FX in the complex pulled down by biotinylated AY probes (lower). Odd, odd pool, Even, even pool of AY probes. LacZ probe as negative control. C. Effect of AY truncation on ITGAV promoter activity in HEK-293T and SMMC-7721 cells by luciferase reporter assay (a & b). Analysis of AY371-522 regulation on ITGAV promoter activity (c). The effect of AY overexpression on the unrelated pGL3 promoter and human tyrosine hydroxylase promoter (TH PMT) (d). PMT, promoter; ∆, deletion mutation. D. A schematic diagram of AY truncations that were constructed into pcDNA3.1b for overexpression (a). Predicted secondary structure for AY by RNAfold (http://rna.tbi.univie.ac.at/cgi-bin/RNAWebSuite/RNAfold.cgi) (b). The AY371-522 domain is marked by a red dotted circle. E. Quantitative comparative analysis of ITGAV expression between cells overexpressing full-length AY, AY371-522, AY△371-522, and mock control by qRT-PCR and Western blotting (a, b & c). Wound closure was analyzed in cells overexpressing full-length AY, AY371-522, and AY△371-522 (d). Data are representative of three independent repeats. *, P < 0.05; **, P < 0.01; ***, P < 0.001.
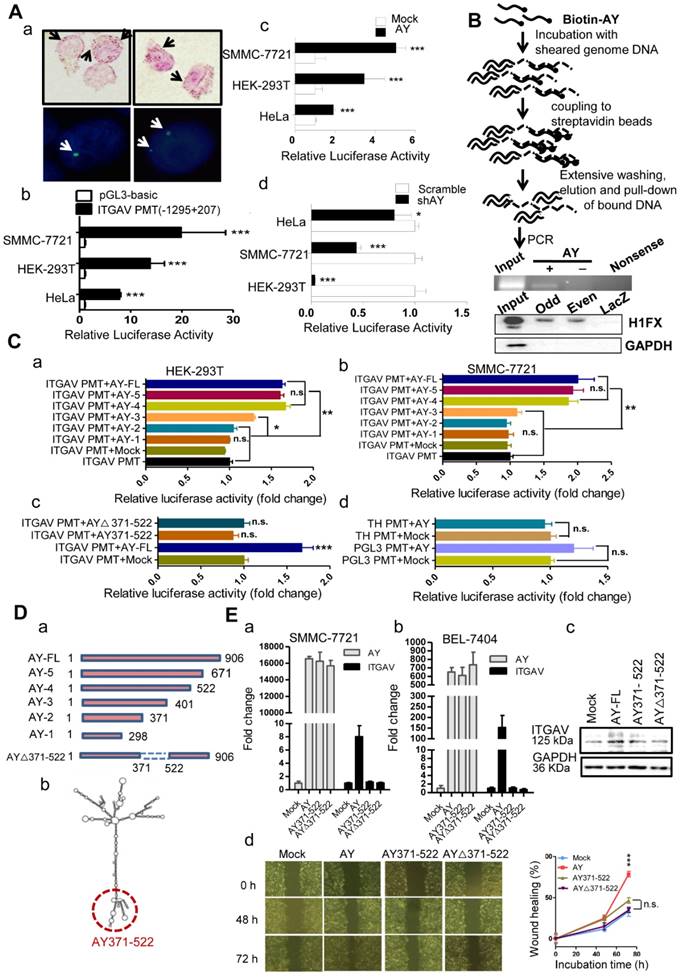
AY domain-deletion experiments (Figure 5D) found that mutants 5 (1-671) and 4 (1-522) showed enhanced ITGAV promoter activity, similar to that of full-length AY (Figure 5C, a & b), but mutants 2 (1-371) and 1 (1-298) failed to show enhanced ITGAV promoter activity in both HEK-293T and SMMC-7721 cells. Mutant 3 (1-401) showed a partial stimulatory effect. These results indicated that the 371-522 domain of AY was important for the regulation of ITGAV promoter activity by AY. Consistently, mutant AY∆371-522, which lacked the 371-522 domain, showed no AY-induced ITGAV promoter activity (Figure 5C, c). Individual overexpression of the 371-522 segment of AY or the AY∆371-522 sequence failed to stimulate ITGAV promoter activity and transcription. We detected ITGAV expression in both BEL-7404 and SMMC-7721 cells only when full-length AY was overexpressed (Figure 5E, a & b). Similar results were observed with ITGAV protein expression (Figure 5E, c). Also, neither AY∆371-522 nor AY371-522 could individually promote wound closure rate (Figure 5E, d). Together, these results suggested that the 371-522 domain of AY was important, but not solely required, for AY-induced ITGAV promoter activity.
AY interacts with linker histone H1FX
RNA immunoprecipitation (RIP) and RNA pull-down analyses showed no significant interactions between AY and factors known to be important for ITGAV expression (8, 9, 21), such as STAT3, Sp1, BRD1, HBO1, MOZ, and HDAC8 (data not shown). Also, we didn't find AY interaction with ZNF282 in these two assays (data not shown). Therefore, we conducted mass spectrometry and high-throughput protein chip experiments to screen for proteins associated with AY. Histone 1FX (H1FX) and Ig kappa chain C region (IGKC) were identified by both mass spectrometry and protein chip assay. We excluded IGKC from further analysis due to statistical insignificance. RNA pull-down assays showed a direct interaction between AY and H1FX (Figure 6A, a). H1FX was also observed in the complex pulled down by odd or even pool of AY probes (Figure 5B). Of the six other histone H1 variants, H1.2, H1.3, and H1.4 precipitated in a complex with AY, but H1.0, H1.1, and H1.5 did not (Figure 6A, a). H1FX, H1.2, H1.3, and H1.4 also interacted with the AY371-522 domain (Figure 6A, b). In the AY deletion mutant, AYΔ371-522, H1FX levels were markedly reduced in the co-precipitation complex, but H1.2, H1.3, or H1.4 levels remained unaffected compared with the precipitate containing full-length AY. Our results suggested that the central domain of AY (371-522) interacted with H1FX.
AY interacted with H1FX. A. Analysis of histone 1 proteins, NCL, or U1SnRNP in AY RNA pull-down assays. B. A schematic diagram of primer design for ChIP analysis of the ITGAV promoter (a). ChIP analysis of H1FX and RNA polymerase II (RNA pol II) binding on the ITGAV promoter regions in BEL-7404 cells overexpressing AY (b-e). GAPDH promoter (GAPDH pro) and IgG served as a negative control. C. ChIP-qPCR/PCR analysis of acH3K9/14, H3K4Me3, and H3K27Me3 occupancy on the ITGAV promoter (-894 ~ -677) in BEL-7404 cells overexpressing AY. D. QPCR analysis of AY and ITGAV expression levels in cells silenced for H1 variants and overexpressing AY (a). H1.2, H1.3, H1.4, or NCL interaction with the ITGAV promoter (-894 ~ -677) was analyzed by ChIP in cells with AY overexpression (b). E. ChIP-qPCR analysis of the enrichment of PCAF and SIRT1 in BEL-7404 cells overexpressing AY. F. ChIP-Seq reads from NCBI GEO database (GSE94403, GSE15735) and alignment to human genome and transcriptome (GRCh37/hg19, Ensemblv71). Data are representative of three independent repeats. *, P < 0.05; **, P < 0.01; ***, P < 0.001.
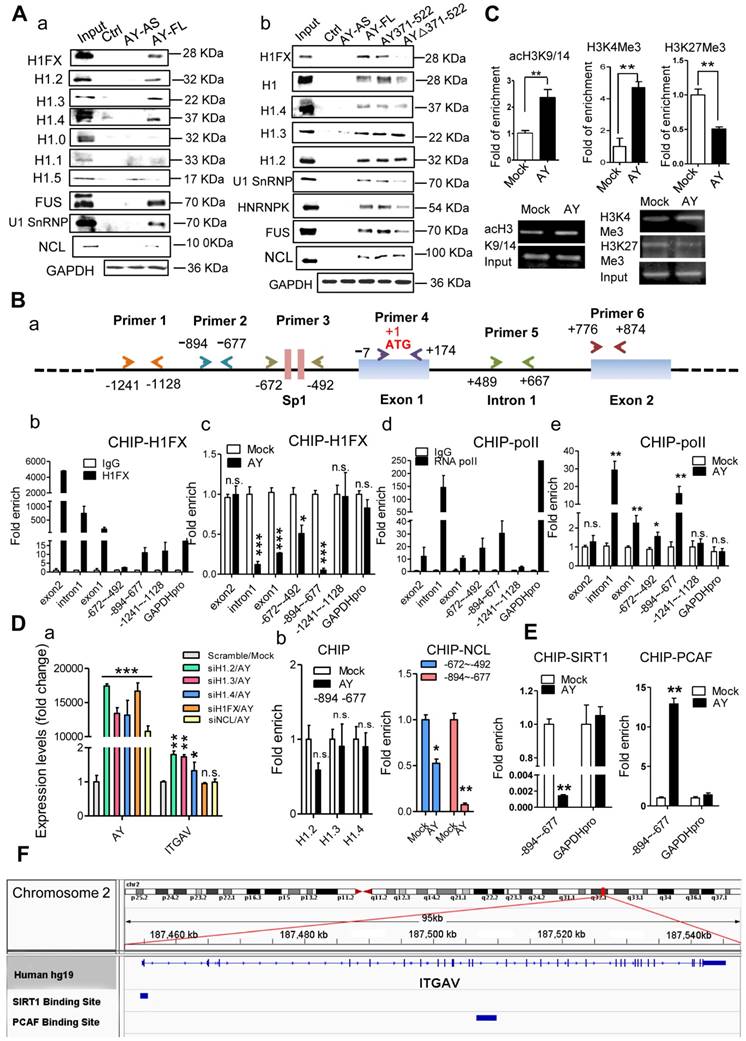
AY binding to H1FX induces chromatin remodeling
We then tested H1FX occupancy of the ITGAV promoter by chromatin immunoprecipitation assays using five pairs of primers (Figure 6B, a). Interestingly, H1FX not only occupied the ITGAV promoter region from -1241 to -677 (Figure 6B, b), but was also observed on intron 1 and exons 1 & 2. RNA polymerase II (pol ll), however, occupied intron 1 and the upstream region from -894 to -492 (Figure 6B, d). AY overexpression significantly enhanced pol II occupancy in the upstream region, but H1FX occupancy on intron 1 and the upstream region from -894 to -492 was significantly reduced (Figure 6B, c & e). We also observed reduced occupancy of H3K27Me3, a histone H3 containing a tri-methylated lysine 27 residue, on the promoter (Figure 6C). AY significantly enhanced the occupancy of H3K4Me3 and acH3K9/14 on the ITGAV promoter (Figure 6C). H1FX silencing abolished stimulation of the ITGAV promoter by AY overexpression (Figure 6D, a). Silencing of H1.2, H1.3, or H1.4 did not have any effect on ITGAV expression and their occupancy on the ITGAV promoter was unchanged by AY overexpression (Figure 6D, a & b). These results suggested that AY interaction with H1FX induced core histone modification on ITGAV promoter.
Core histone modification induced by AY repels H1FX binding
Binding of linker histones to the DNA/nucleosome is enabled by histone chaperone proteins [18]. By mass spectrometry, we noted histone 1 chaperone, nucleolin (NCL), as part of the AY complex. We then tested whether AY regulation of H1FX occupancy on the ITGAV promoter was mediated by NCL. RNA pull-down assays showed that NCL interacted with both full-length AY and mutant versions of AY (AY371-522, AY∆371-522) (Figure 6A). NCL was also observed in an immunoprecipitation complex with H1FX, but was not enhanced by AY overexpression (Supplemental Figure 2B). RNase treatment did not reduce the interaction of NCL with H1FX (Supplemental Figure 2C). However, overexpression of AY significantly reduced the enrichment of NCL on the ITGAV promoter (from -894 to -492) (Figure 6D, b). Silencing of NCL also diminished the stimulatory effect of AY on ITGAV transcription (Figure 6D, a). We further found that ectopic expression of AY significantly strengthened the occupancy of PCAF, a histone acetyltransferase for acH3K9/14, but reduced the enrichment of SIRT1, a histone deacetylase, on the ITGAV promoter region of -894 to -677 (Figure 6E). Data from ChIP sequence indeed showed that SIRT1 and PCAF were bound on ITGAV locus (Figure 6F). Our results suggested that AY recruited histone modification enzymes and induced regional histone modification that repelled the NCL/H1FX binding and activated ITGAV promoter.
Discussion
Long non-coding RNAs are transcripts that do not code for protein sequences, but their functions are well characterized. In this study, we identified a novel lncRNA, AY927503 (AY), which was highly expressed in HCC cells. High expression levels of AY were closely associated with poor prognosis and metastasis in patients with HCC. Levels of AY correlated with the expression of ITGAV. Also, overexpression of AY promoted cell migration, tube formation, EMT process, and 5-fluorouracil resistance in vitro and tumorigenesis, metastasis, or angiogenesis in vivo. These AY effects were abolished by knockdown of ITGAV. ITGAV is one of the members of the integrin family and is encoded by the ITGAV gene on chromosome 2. We have previously shown that elevated sulfatide levels in HCC cells enhanced integrin αVβ3 expression by promoting ITGAV transcription [14, 17, 19]. Here, we showed a novel role for lncRNA AY as a pioneer factor in regulating ITGAV gene transcription and promoting metastasis.
Targeted gene transcription is controlled by transcription factors that mediate the binding of chromatin-modifying machinery to specific genomic loci [10]. However, transcription factors cannot access the cognate sites in the compacted chromatin without chromatin remodeling [20]. Pioneer transcription factors (PFs) have the ability to bind to the transcription site prior to chromatin remodeling [10]. In fact, PFs can penetrate repressed chromatin and initiate chromatin decompaction to access the cognate DNA sequences in nucleosomes that are locked by linker histones [21]. RNAs have been shown to interact with proteins or small RNAs, little is known about lncRNA interaction with target gene in chromatin. In this study ITGAV promoter was identified in the AY complex. Also AY significantly induced chromosome remodeling on ITGAV promoter and stimulated the promoter activity.
Although lncRNAs are involved in many biological processes, most lncRNAs show limited evolutionary conservation of motifs or folding structures that are independent of the RNA sequence [22]. We identified the central domain of AY (AY371-522), which was critical for its stimulation of the ITGAV promoter and interaction with histone 1FX (H1FX). Analysis of the AY secondary structure by RNAfold (an online prediction algorithm) (Figure 5C) revealed a distinct molecule that was shaped like an umbrella, in which the central domain, AY371-522, constituted the handle section that interacted with H1FX.
Ectopically expressed AY interacted with H1FX and reduced H1FX occupancy on the ITGAV gene promoter. AY may reduce the binding affinity between H1FX and the DNA/nucleosome, which could result in the displacement of H1FX from the ITGAV promoter region. Binding of linker histones to the nucleosome is enabled by histone chaperone proteins [18]. Interestingly, we found that histone chaperone, NCL, directly interacted with AY, also a RNA binding protein, and not just via the H1FX-NCL complex [18].
Notably AY significantly reduced NCL enrichment on the ITGAV promoter as well. NCL preferentially binds to H3K4Me2 and not H3K4Me3 [23]. H1FX is usually associated with the poorly acetylated core histone-enriched regions of genomic DNA [12, 24, 25], but has low binding affinity for promoters with highly acetylated histones [26]. We showed that AY significantly enriched H3K4me3 and acH3K9K14 on the ITGAV promoter. It is possible that these proteins repel NCL/H1FX from the ITGAV promoter regions. Reduced occupancy of H1FX might create an open chromatin state which allows interaction between permissive chromatin enriched in H3K4me3 and the pre-initiation complex for transcription of ITGAV. H1FX is often associated with histone deacetylase [12] and its histone tail impedes H3 access by PCAF, which prevents modification of H3 [2]. We observed that AY significantly enhanced PCAF and acH3K9/14 enrichment on the ITGAV promoter, and reduced SIRT1 occupancy. It is possible that AY interaction with H1FX alters the position of the H1FX tail, which allows PCAF to access H3 on the ITGAV promoter.
In conclusion, high levels of AY promoted HCC metastasis and were correlated with poor prognosis in patients with HCC. Thus, AY becomes a novel potential molecular signature for metastasis of HCC. The promotion of metastasis by AY was associated with activation of ITGAV transcription by recruitment of the chromatin-modifying machinery to the ITGAV promoter and reducing H1FX binding.
Abbreviations
HCC: human hepatocellular carcinoma; lncRNA: long non-coding RNA; AY: AY927503; ITGAV: integrin αV; NCL: nucleolin; EMT: epithelial-mesenchymal transition; pol II: RNA polymerase II.
Supplementary Material
Supplementary information, figures and tables.
Acknowledgements
Author Contributions
CLK & QB: acquisition, analysis and interpretation of data, manuscript preparation; QC, LSF, YY, PZ, CT, QC, JP, and MHC: technical support and data acquisition; XZW: study design and manuscript editing.
Grant support
This work was supported by grants from National Natural Science Foundation of China (31570800, 81571359).
Competing Interests
The authors have declared that no competing interest exists.
References
1. Chaffer CL, Weinberg RA. A perspective on cancer cell metastasis. Science. 2011;331:1559-64
2. Lambert AW, Pattabiraman DR, Weinberg RA. Emerging Biological Principles of Metastasis. Cell. 2017;168:670-91
3. Felding-Habermann B, Fransvea E, O'Toole TE, Manzuk L, Faha B, Hensler M. Involvement of tumor cell integrin alpha v beta 3 in hematogenous metastasis of human melanoma cells. Clin Exp Metastasis. 2002;19:427-36
4. Cai QQ, Dong YW, Qi B, Shao XT, Wang R, Chen ZY. et al. BRD1-Mediated Acetylation Promotes Integrin alphaV Gene Expression Via Interaction with Sulfatide. Molecular cancer research: MCR. 2018;16:610-22
5. Seguin L, Kato S, Franovic A, Camargo MF, Lesperance J, Elliott KC. et al. An integrin beta(3)-KRAS-RalB complex drives tumour stemness and resistance to EGFR inhibition. Nat Cell Biol. 2014;16:457-68
6. McCarty JH. Alphav integrins lead the way for colorectal metastases. Clin Cancer Res. 2008;14:6351-3
7. Desgrosellier JS, Barnes LA, Shields DJ, Huang M, Lau SK, Prevost N. et al. An integrin alpha(v)beta(3)-c-Src oncogenic unit promotes anchorage-independence and tumor progression. Nat Med. 2009;15:1163-9
8. Bergmann JH, Spector DL. Long non-coding RNAs: modulators of nuclear structure and function. Curr Opin Cell Biol. 2014;26:10-8
9. Sallam T, Jones M, Thomas BJ, Wu X, Gilliland T, Qian K. et al. Transcriptional regulation of macrophage cholesterol efflux and atherogenesis by a long noncoding RNA. Nat Med. 2018;24:304-12
10. Sartorelli V, Puri PL. Shaping Gene Expression by Landscaping Chromatin Architecture: Lessons from a Master. Mol Cell. 2018;71:375-88
11. Song F, Chen P, Sun D, Wang M, Dong L, Liang D. et al. Cryo-EM study of the chromatin fiber reveals a double helix twisted by tetranucleosomal units. Science. 2014;344:376-80
12. Fyodorov DV, Zhou BR, Skoultchi AI, Bai Y. Emerging roles of linker histones in regulating chromatin structure and function. Nature reviews Molecular cell biology. 2018;19:192-206
13. Dong RC, Zhou RH, Lv FD, Tao FD. Establishment and biological observation of human hepatocellular carcinoma cell line SMMC-7721. Bulletin of the Second Millitary Medical University. 1980;1:5
14. Wu W, Dong YW, Shi PC, Yu M, Fu D, Zhang CY. et al. Regulation of integrin alphaV subunit expression by sulfatide in hepatocellular carcinoma cells. J Lipid Res. 2013;54:936-52
15. Kim K, Choi J, Heo K, Kim H, Levens D, Kohno K. et al. Isolation and characterization of a novel H1.2 complex that acts as a repressor of p53-mediated transcription. The Journal of biological chemistry. 2008;283:9113-26
16. Chu C, Qu K, Zhong FL, Artandi SE, Chang HY. Genomic maps of long noncoding RNA occupancy reveal principles of RNA-chromatin interactions. Mol Cell. 2011;44:667-78
17. Wu XZ, Honke K, Zhang YL, Zha XL, Taniguchi N. Lactosylsulfatide expression in hepatocellular carcinoma cells enhances cell adhesion to vitronectin and intrahepatic metastasis in nude mice. International Journal of Cancer. 2004;110:504-10
18. Hammond CM, Stromme CB, Huang H, Patel DJ, Groth A. Histone chaperone networks shaping chromatin function. Nature reviews Molecular cell biology. 2017;18:141-58
19. Wang R, Qi B, Dong YW, Cai QQ, Deng NH, Chen Q. et al. Sulfatide interacts with and activates integrin alphaVbeta3 in human hepatocellular carcinoma cells. Oncotarget. 2016;7:36563-76
20. Mayran A, Drouin J. Pioneer transcription factors shape the epigenetic landscape. The Journal of biological chemistry. 2018;293:13795-804
21. Iwafuchi-Doi M, Zaret KS. Pioneer transcription factors in cell reprogramming. Genes Dev. 2014;28:2679-92
22. Paralkar VR, Taborda CC, Huang P, Yao Y, Kossenkov AV, Prasad R. et al. Unlinking an lncRNA from Its Associated cis Element. Mol Cell. 2016;62:104-10
23. Wu M, Wei W, Chen J, Cong R, Shi T, Bouvet P. et al. Acidic domains differentially read histone H3 lysine 4 methylation status and are widely present in chromatin-associated proteins. Sci China Life Sci. 2017;60:138-51
24. Schroter H, Gomez-Lira MM, Plank KH, Bode J. The extent of histone acetylation induced by butyrate and the turnover of acetyl groups depend on the nature of the cell line. Eur J Biochem. 1981;120:21-8
25. Reczek PR, Weissman D, Huvos PE, Fasman GD. Sodium butyrate induced structural changes in HeLa cell chromatin. Biochemistry. 1982;21:993-1002
26. Ichihara-Tanaka K, Kadomatsu K, Kishida S. Temporally and Spatially Regulated Expression of the Linker Histone H1fx During Mouse Development. J Histochem Cytochem. 2017;65:513-30
Author contact
![]() Corresponding author: Xing Zhong Wu, Department of Biochemistry and Molecular Biology, School of Basic Medical Sciences, NHC Key Laboratory of Glycoconjugates Research, Fudan University,138 Yi Xue Yuan Road, Shanghai 200032, PR China. Tel: 8621-5423-7697; E-mail: xz_wuedu.cn.
Corresponding author: Xing Zhong Wu, Department of Biochemistry and Molecular Biology, School of Basic Medical Sciences, NHC Key Laboratory of Glycoconjugates Research, Fudan University,138 Yi Xue Yuan Road, Shanghai 200032, PR China. Tel: 8621-5423-7697; E-mail: xz_wuedu.cn.