Impact Factor
 Global reach, higher impact
Theranostics 2019; 9(14):4141-4155. doi:10.7150/thno.35033 This issue Cite
Research Paper
Survey of the translation shifts in hepatocellular carcinoma with ribosome profiling
Qin Zou1,2,3,4, Zhengtao Xiao1,2,3,#, Rongyao Huang1,2,3,#, Xin Wang1,2,3, Xun Wang5, Haitao Zhao6, Xuerui Yang1,2,3 ![]()
1. MOE Key Laboratory of Bioinformatics, Tsinghua University, Beijing 100084, China
2. Center for Synthetic & Systems Biology, Tsinghua University, Beijing 100084, China
3. School of Life Sciences, Tsinghua University, Beijing 100084, China
4. Joint Graduate Program of Peking-Tsinghua-National Institute of Biological Science, Tsinghua University, Beijing 100084, China.
5. Department of Hepatobiliary Surgery, The General Hospital of Chinese People's Liberation Army, Beijing 100853, China.
6. Department of Liver Surgery, Peking Union Medical College Hospital, Chinese Academy of Medical Sciences and Peking Union Medical College, Beijing, 100730, China.
# These authors contributed equally to this work.
Received 2019-3-19; Accepted 2019-4-27; Published 2019-5-31
Abstract

Despite the critical position of translation in the multilevel gene expression regulation program, high-resolution and genome-wide view of the landscape of RNA translation in solid tumors is still limited.
Methods: With a ribosome profiling procedure optimized for solid tissue samples, we profiled the translatomes of liver tumors and their adjacent noncancerous normal liver tissues from 10 patients with hepatocellular carcinoma (HCC). A set of bioinformatics tools was then applied to these data for the mining of novel insights into the translation shifts in HCC.
Results: This is the first translatome data resource for dissecting dysregulated translation in HCC at the sub-codon resolution. Based on our data, quantitative comparisons of mRNA translation rates yielded the genes and processes that were subjected to patient specific or universal dysregulations of translation efficiencies in tumors. For example, multiple proteins involved in extracellular matrix organization exhibited significant translational upregulation in tumors. We then experimentally validated the tumor-promoting functions of two such genes as examples: AGRN and VWA1. In addition, the data was also used for de novo annotation of the translatomes in tumors and normal tissues, including multiple types of novel non-canonical small ORFs, which would be a resource for further functional studies.
Conclusions: The present study generates the first survey of the HCC translatome with ribosome profiling, which is an insightful data resource for dissecting the translatome shift in liver cancer, at sub-codon resolution.
Keywords: hepatocellular carcinoma, ribosome profiling, RNA translation, translatome, translation efficiency
Introduction
It has long been recognized that translation dysregulation is a signature feature and potential driver of tumorigenesis, as many translation initiation factors and up-stream signaling regulators of translation bear extensive genetic alterations in cancers [1, 2]. On one hand, rapid proliferation of the cancer cells requires accelerated protein production in general [3], and on the other hand, gene-specific translational regulation is critical for the significantly shifted cellular activities such as metabolism, attachment and migration, and stress-responses of the tumor cells [4, 5]. Selective changes in translation of specific mRNA, which could be independent of the alterations at the transcription level, have been shown to be critical for tumorigenesis [1, 2]. Therefore, genome-wide surveys of the translation landscapes in tumors are of great value in dissecting the multilevel gene expression regulation programs in cancer.
Since its original publication [6], the high-throughput method of ribosome profiling (also called Ribo-seq) has been widely exploited to characterize the landscapes of translation in various species [7], generating novel insights into key translational regulators involved in many biological processes [8]. In cancer research, ribosome profiling of model cancer cell lines has facilitated multiple detailed studies about translation inhibition in cancer cells by tumor inhibitory drugs such as mTOR inhibitors [9, 10] and an eIF4A inhibitor [11, 12]. These studies revealed potential oncogenes that were translationally regulated via 5'UTR structures and 5'TOP-like regulatory elements in cancer cells. Such translational regulation programs control expression of key proteins in tumor cell activities such as proliferation, metastasis, and adaptation to stress. In addition to these mechanistic studies of the specific oncogenic translational regulations, comprehensive and detailed view of the translation landscape in cancer remains very limited. The translation abnormalities taking places in solid tumors are largely unknown. In the present study, we applied the translatome profiling method of ribosome profiling to comprehensively characterize the RNA translation landscapes in hepatocellular carcinoma (HCC) tumors in comparison with the adjacent non-cancerous normal liver tissues. Our specially designed bioinformatics pipelines were then applied to dissect the translatome shifts in tumors, including the altered translation rates of specific genes and novel ORFs that are specific to the tumors or normal tissues. Our study generated the first high-resolution data resource of the translatomes in human solid tumors. The analysis results should help in filling the gap between the transcriptome and the proteome landscapes in cancer and serve as the basis for further studies of the translational regulation program in HCC.
Results and discussion
Ribosome profiling of paired HCC tumors and adjacent non-cancerous liver tissues
We profiled the paired tumor and adjacent normal liver tissue samples from 10 HCC patients with ribosome profiling, which was adapted and optimized for processing of clinical solid tissue samples. As shown by one of our experiments as an example, RNase treatment during ribosome profiling effectively digested the polysome RNA into ribosome monomers (Supplementary Fig. 1). Total RNA sequencing was performed in parallel for the same samples. Basic statistics of the sequencing data are provided in Supplementary Table 1, and the read counts of ribosome protected fragments (RPFs) and RNA for each gene in the 20 samples are supplied in Supplementary File 1.
As shown in Supplementary Fig. 2A and 2B, the RPF reads from each sample are all tightly distributed within lengths of 28-32 nt, while the peaks (length with the most abundant reads) could be slightly shifted by 1 or 2 nt between different patients. We think that this was due to different digestion efficiencies of RNase I treatment of the RNA samples or simply different amounts of starting materials of RNA. Because the tissue samples were collected at different times, we could not perform all ribosome profiling experiments at once. Therefore, the potential differences in RNA digestion efficiencies or starting materials could result in batch effects between different patients. However, the paired tumor and normal tissues from the same patient were always processed in parallel at the same time, following the same procedure. Indeed, the footprint length differences only occur between different patients, but not between any pair of tumor and adjacent normal tissue samples (Supplementary Fig. 2A, B). This necessitates paired tumor-normal comparisons instead of unpaired group comparisons.
Metagene analysis of the RPF reads aligned by their 5' ends on the known protein-coding genes showed strong enrichment of the reads in the coding regions from the start to the stop codons (Supplementary Fig. 3). In addition, for each sample, the majority of the RPF reads with different lengths exhibited strong 3-nt periodicity (figures provided in Supplementary File 2). Note that the periodicity of all reads pooled together was not obvious for some samples (Supplementary Fig. 3). This is normal for ribosome profiling, as the RPF reads with different lengths could have slight shifts (usually +/-1nt) of the P-site positions relative to their 5' ends (+12, 11, or 13 nt offset from the 5' ends, as shown in Supplementary File 2). Once the offsets were adjusted for different read lengths, the RPFs showed predominant allocations to the main open reading frame 0, compared to the other two frames +1 and +2 (Supplementary Fig. 2C, D). Taken together, these informative features reflect high quality of the ribosome profiling data, which allows quantitative assessment of the translatomes at sub-codon resolution. To our knowledge, this is the first ribosome profiling dataset of human solid tumors and their adjacent normal tissues. Such a data resource opens up an unprecedented opportunity to dissect the transcriptome-wide abnormality of RNA translation in HCC tumors.
Dysregulated mRNA translation efficiencies in tumors
Based on the ribosome profiling data above, we sought to systematically identify the genes with differential mRNA translation rates in liver tumors compared to their adjacent normal liver tissues. In contrast to the data from cultured cells or model organisms, the mRNA and RPF profiles of these clinical tumor and normal tissue samples exhibited strong heterogeneity across the 10 patients (Fig. 1A, B). Based on these RPF and mRNA profiles, translation efficiencies (TE) were inferred for the 10 pairs of tumor and normal tissue samples with our bioinformatics analysis pipeline, Xtail [13]. We then performed differential translation analysis by comparing the paired tumor and normal samples from each patient with the tool Xtail [13] (Supplementary Fig. 4, Supplementary File 3). Genes with substantially up- or down-regulated TE in the tumor vs. the normal tissue from each of the 10 patients were illustrated in Fig. 1C and listed in Supplementary File 3.
Comparisons of mRNA translation efficiencies between HCC tumors and adjacent normal tissues. (A, B) Principal component analysis (PCA) of the tumors and normal tissues based on the RPF (A) or RNA (B) read counts of 8527 genes that have read-outs in all the samples. The two main components (PC1 and PC2) are shown on the X- and Y-axis. The 10 tumor samples are marked in red and the normal samples are in green. (C) Translation efficiencies (TEs) of genes in paired tumor and normal samples from 10 HCC patients. A total of 2199 genes were selected, as they exhibited differential TE (1392 down and 807 up) in at least one patient between the tumor and the adjacent normal tissue (Supplementary File 3). (D) Biological processes enriched in the translationally up- or down-regulated genes in each tumor compared to the adjacent normal tissue. Saturation of the color indicates the statistical significance (-log10(Pv)) of each process.
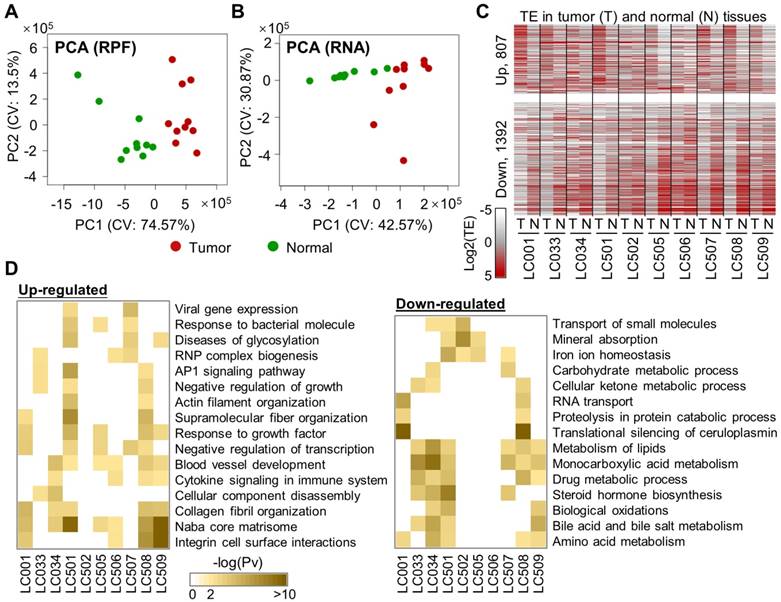
As solid tumors are known for the intra-tumoral heterogeneity, i.e., heterogeneous non-tumor cells infiltrated in the tumor tissues, we used ESTIMATE [14] to assess purities of the 10 HCC tumors with the RNA-seq data. The results ranged from 0.821 to 0.905. Indeed, according to literature and our previous experiences, HCC tumors in general have high purities of tumor cells [15, 16]. In addition, as shown in Fig. 1A and B, there are clear differences between the molecular profiles of the tumor and normal tissues. Therefore, we think that our analyses should have reliably captured the major differences between the tumor and normal tissues.
Next, functional enrichment analyses were performed on the translationally up- or down-regulated genes for each individual patient (Fig. 1D). As shown by the results, up-regulations of mRNA translation frequently take place for genes related to biological processes such as matrisome and collagen fibril organization, blood vessel development, response to growth factors, and integrin cell surface interactions. On the other hand, genes in several metabolic processes were subjected to translational repression in multiple patients (Fig. 1D).
Although the general metabolism level is up-regulated in cancer cells, it is not unusual to see many metabolism-related genes being down-regulated in cancers. For example, according to our results, LDHB was one of the translationally repressed genes in multiple HCC patients. Indeed, it has been shown that LDHB protein is generally down-regulated in HCC and associated to poor prognosis [17]. In fact, as the metabolic system is considered largely shifted in cancer cells and adapted to the highly variable contexts of different cancer types, specific metabolic pathways could be altered in either direction of up or down [18]. Therefore, our study revealed the processes enriched by translational up- or down-regulations of some genes, but these observations should not directly lead to a conclusion that these processes themselves were always altered to the same directions.
Finally, it is also worth noting that our study has been focused on translation alterations in HCC, while other transcriptional and post-transcriptional dysregulations in HCC also make major contributions in shaping the overall shifted gene regulation program in HCC. For example, it has been recently shown that the mitochondrial respiratory chain genes were transcriptionally repressed in HCV-infected HCC cell line Huh-7.5, which potentially contributed to metabolic reprogramming in HCC cancer [19]. Here we showed that many key genes in lipid metabolism were translationally repressed, which in our minds represents another part of metabolic reprogramming. Therefore, such observation strengthens the necessity of studying the protein translation landscapes, in addition to the transcriptomes, in cancer.
Consensus translation perturbations in HCC tumors
Despite the inter-tumoral heterogeneity of the translation landscapes across HCC patients, in general, there are clear differences between the two groups of normal and tumor tissues with respect to their RNA and RPF profiles (Fig. 1A, B). Based on the assessments of differential mRNA translation in the 10 independent comparisons above between paired tumor and normal tissues, we recovered consensus TE up- or down-regulation of the genes in multiple tumors (Fig. 2A, Supplementary Fig. 5A, and details in Supplementary File 4). Note that in general, the genes with consistently dysregulated TE in the 10 HCC patients did not show similarly consistent abnormality in their mRNA expression levels in tumors compared to normal tissues (Supplementary Fig. 5B). On the other hand, many of the genes with dysregulated mRNA levels in these HCC patients bear relatively stable translation efficiencies (Supplementary Fig. 5A). These observations suggested that for most of the top genes that were altered at the level of mRNA or translation, these two types of dysregulation are generally independent from each other.
Genes with consensus translational dysregulations in HCC tumors. (A) TE (log2) of the top 100 genes with consensus TE up, or of the top 100 genes with consensus TE down, in the tumors compared to the normal tissues. (B) Enrichment of the GO functional annotations in the top 100 genes with consensus TE up or TE down in the tumors. Each circle, representing a GO term, was color-coded according to the P-value (-log10) of the enrichment. The size of a circle represents the ratio of the genes annotated to the respective GO term in the gene list with TE up or down. (C) Relative mRNA expression levels of AGRN and VWA1 in 5 pairs of tumor and adjacent normal tissue samples. (D) Western blots showing protein expression levels of AGRN and VWA1 in 5 pairs of tumor and adjacent normal tissue samples. Beta actin was included as an endogenous reference. Relative quantifications of the blots are provided above the images.
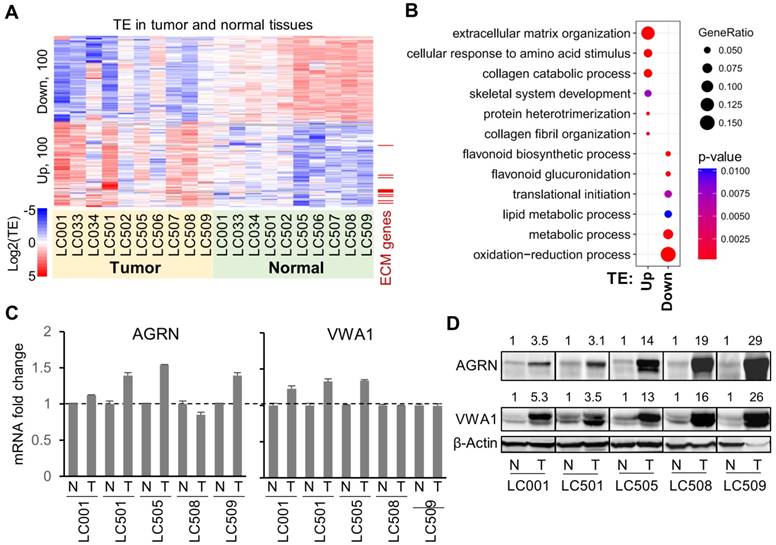
Interestingly, the consensus top 100 translationally up-regulated genes showed significant enrichments in the biological processes related to extracellular structures such as extracellular matrix (ECM) organization and collagen catabolism (Fig. 2B), whereas the top 100 down-regulated genes were mostly enriched in metabolic processes (Fig. 2B). In contrast, the consensus genes with up- or down-regulated mRNA expression profiles in these 10 pairs of samples showed almost completely different functional enrichments (Supplementary Fig. 5C), again suggesting that the mRNA regulations and translational dysregulations in tumors are generally not co-occurring and that they impact different sets of cellular processes.
Intrigued by the findings above, we looked further into the genes involved in the ECM organization that were subjected to translational up-regulation in the HCC tumors (marked in Fig. 2A). Specifically, we selected AGRN and VWA1 as examples. As a proteoglycan, AGRN functions as a membrane protein or a secreted protein in the extracellular matrix [20]. Previous studies have reported tumor-promoting functions of AGRN in liver cancer cells by regulating focal adhesion integrity [21], in oral squamous cell carcinoma cells [22] and glioblastoma cells [23] by regulating the extracellular microenvironment, and in prostate cancer cells potentially by regulating DNA integrity and DNA repair [24]. VWA1 encodes a von Willebrand factor A‐domain‐related protein (WARP), an orphan ECM protein whose function is largely unclear [25]. It is suspected to play important roles in basement membrane structures, which remains to be validated. Potential involvement of VWA1 in cancer has never been proposed or studied before.
Both AGRN and VWA1 have largely consistent mRNA expression levels in tumors compared to the adjacent normal tissues (Fig. 2C), which therefore provided a clean background for study of their translational regulations. Strikingly, the protein expression levels of AGRN and VWA1 were dramatically elevated in the tumor samples compared to their adjacent normal tissues (Fig. 2D). Given the unchanged mRNA expression levels, such dramatic increases of AGRN and VWA1 proteins are well in-line with the up-regulated TEs of these two genes. However, as protein degradation rates were not examined, the up-regulated TEs may not be the only factors contributing to the elevated protein levels. In other words, we do not preclude other factors such as protein degradation in controlling the protein levels. Nevertheless, as these two examples have shown, quantitative assessments of the translation profiles provided valuable information that explains at least some of the abnormal protein expression in tumors.
Tumor-promoting functions of ECM proteins AGRN and VWA1
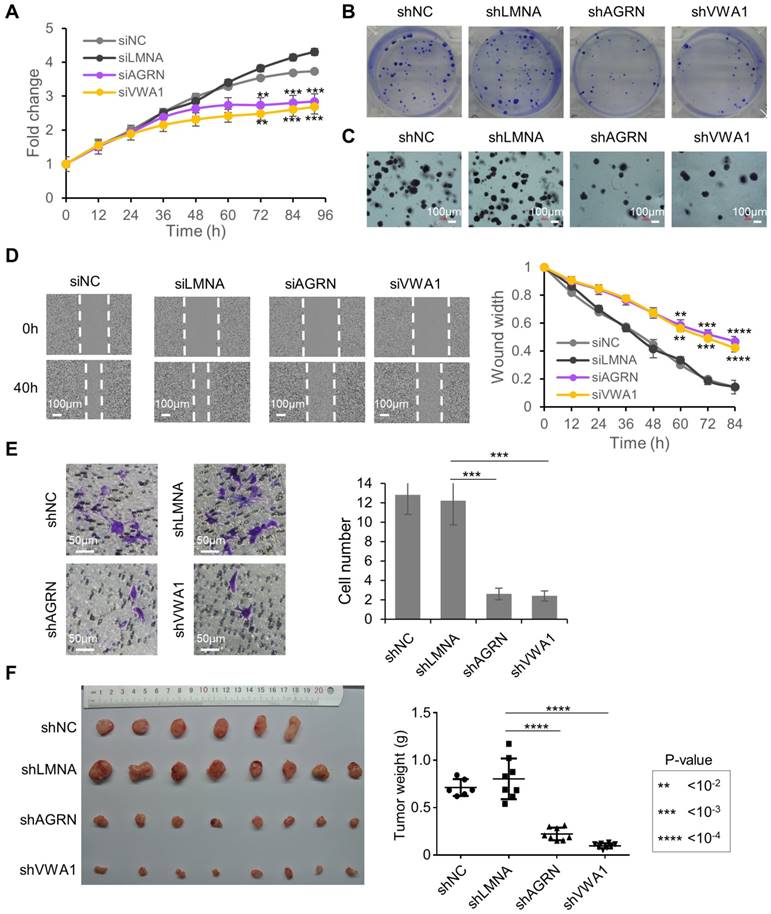
Considering the strong translational up-regulation of the two proteins AGRN and VWA1 in HCC tumors, we looked further into their potential functions in liver cancer cells. Knock-down of AGRN (Supplementary Fig. 6A, B) or VWA1 (Supplementary Fig. 6C, D) in the HCC cell line Huh7 induced potent inhibition of cell proliferation (Fig. 3A). Cell colony formation and anchorage-independent growth from single-cells were also repressed upon stable knock-down of AGRN (Supplementary Fig. 6E, F) or VWA1 (Supplementary Fig. 6G, H), indicating critical involvements of these two genes in promoting the malignant potential of the cells (Fig. 3B, C). In addition, as a highly metastatic cell type, the Huh7 cells exhibited largely suppressed migration rate upon knock-down of AGRN or VWA1, as shown by the scratch wound healing and trans-well migration assays (Fig. 3D, E). Indeed, silencing AGRN or VWA1 induced repression of two well-established EMT markers involved in cancer cell migration, Vimentin (VIM) and N-cadherin (CDH2), at both the mRNA (Supplementary Fig. 6A, C, E, G) and protein levels (Supplementary Fig. 6B, D, F, H). Finally, repression of AGRN or VWA1 dramatically inhibited in vivo tumorigenesis of Huh7 cells in xenograft tumor models in immunodeficient NSG mice (Fig. 3F). Collectively, these results illustrated essential tumor-promoting roles of AGRN and VWA1 in the HCC cell line Huh7. These two genes, which are up-regulated at the level of translation in HCC tumors, nicely exemplified the translational dysregulation events that confer advantages upon the tumor cells and therefore play essential roles in tumor development.
Tumor promoting functions of AGRN and VWA1 in Huh7 cells. (A) Proliferation of Huh7 cells upon silencing of AGRN and VWA1 with siRNAs. Silencing of Lamin A/C (siLMNA) was used as a negative control. Error bars represent the means ± SD. (B) Colony formation from Huh7 single-cells with stable knock down of AGRN, VWA1, or LMNA with shRNA. (C) Anchorage independent growth from Huh7 single-cells with stable knock down of AGRN, VWA1, or LMNA with shRNA. (D) Wound healing assay showing scratched area being reoccupied by the Huh7 cells migrating from the two sides. (E) Images of Huh7 cells that have migrated across the membrane of a transwell chamber. Cells were stained with crystal violet. Counts of cells in 6 fields of 2 replicates were summarized as bar plots to the right. (F) Images and weights of the tumors grown in xenograft transplantation models in NSG mice from the Huh7 cells with lentivirus-mediated stable gene knock-down. The error bars represent ± SEM.
De novo annotation of the translatomes in HCC tumors and normal liver tissues
Ribosome profiling assays generate genome-wide snapshots of translation at sub-codon resolution, which allows systematic identification of the RNA species or regions that are actively translated, i.e., de novo annotation of the translatomes. Specifically, as an active ribosome moves along the open reading frame (ORF) by steps of a codon (tri-nucleotides), the density of RPF reads aligned on the ORFs by their P-sites should exhibit 3-nt periodicity. This has been the most efficient feature for identification of active translation [26]. Context-dependent translatomes in various model organisms and cells have been assembled based on this feature of the ribosome profiling data [27-30]. These valuable resources revealed multiple categories of novel ORFs that are actively translated under specific experimental or physiological conditions. However, in cancer research, comprehensive annotation of the translatomes of tumors has been lacking. Our ribosome profiling data is a new resource for de novo annotation of active ORFs in HCC tumors. Here, we applied our analysis pipeline RiboCode [31] to systematically identify the actively translated ORFs and assemble the translatomes of tumors and normal tissues.
Fig. 4A summarized the translatomes assembled with the combined ribosome profiling datasets from the 10 tumors or from the 10 normal tissue samples. As expected, the majorities of the translatomes were canonical ORFs from protein coding genes that have been annotated previously. In addition, significant proportions of the translatomes were composed of non-canonical ORFs, most of which have not been reported before, including upstream ORFs in the 5'UTR (uORFs), downstream ORFs in the 3'UTR (dORFs), overlapping ORFs, and other novel ORFs from the protein coding and noncoding genes (Fig. 4A, and details in Supplementary File 5). A multitude of studies have revealed strong biological relevance of the non-canonical small ORFs, for example uORFs [32-36], in coding functional peptides or proteins [33, 37] and regulating gene expression [38, 39] such as mRNA translation [34, 40] and decay [41, 42]. Here, collections of the actively translated non-canonical ORFs in contexts of HCC tumors and non-cancerous liver tissues have provided a new resource for further studies of these ORFs in HCC.
Translatomes assembled with ribosome profiling data of the HCC tumors and normal tissues. (A) Composition of the translatomes assembled with the ribosome profiling data of the tumors and normal tissues. (B) Average TE fold changes of the uORFs and dORFs in the 10 tumors compared to their matched normal tissue samples. The uORFs or dORFs were sorted by the average TE fold changes of their corresponding main CDS regions from the same protein coding genes.
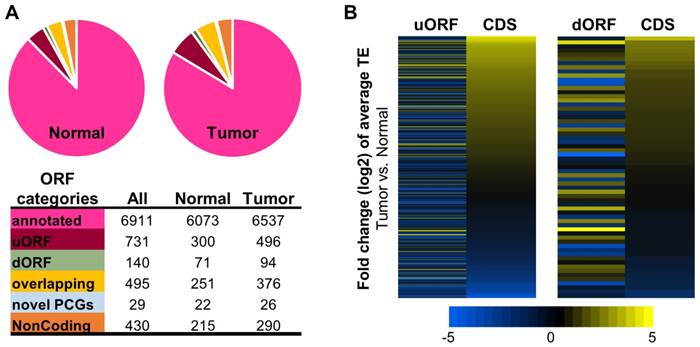
The RPF read counts of all the ORFs in tumors and normal tissues are provided in Supplementary File 5. As shown by the data, many non-canonical ORFs were subjected to up- or down-regulation of their translation efficiencies in the HCC tumors compared to the normal tissues (Supplementary Fig. 7 and data in Supplementary File 6). It is worth nothing that in general, the average TE changes of the uORFs or dORFs in the 10 tumors vs. the 10 normal samples were not coordinated with the translational up- or down-regulations of the corresponding main CDS regions of the protein coding genes that host the uORFs or dORFs (Fig. 4B). Interestingly, some uORFs and dORFs showed opposite directions of translational dysregulations compared to their corresponding main CDS regions of the hosting genes (Fig. 4B).
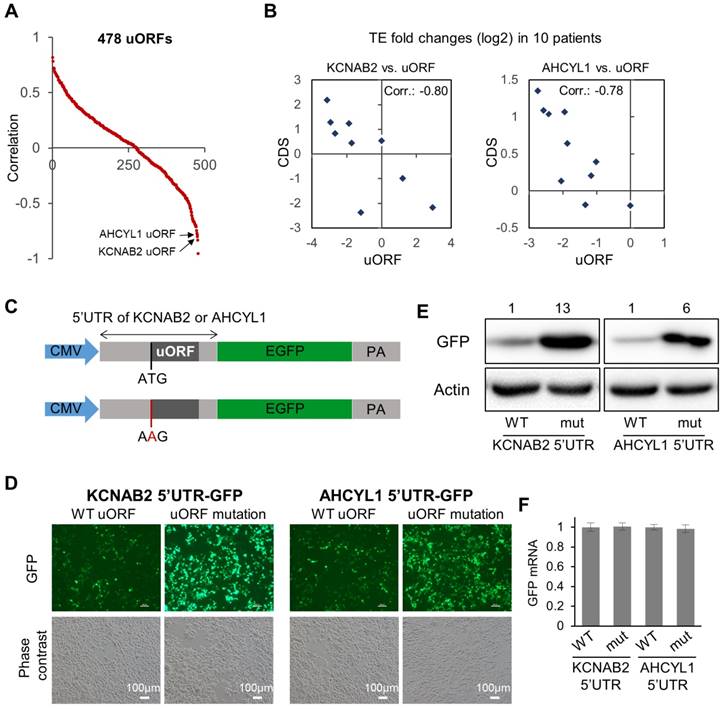
Inspired by the observations above (Fig. 4B), we then looked further into the potential associations between the uORFs with their corresponding main CDS regions (data in Supplementary File 7). Specifically, for each uORF, we calculated the Spearman's correlation between its TE abnormalities (fold change of TE in tumor vs. normal) in the 10 patients and the TE abnormalities of its corresponding main CDS in the 10 patients (Fig. 5A, Supplementary File 7). Some uORFs showed strong positive associations with their corresponding main CDS regions, which could simply indicate concurrent translational abnormalities of the two ORFs on the same RNA transcript. More interestingly, some uORFs were strongly anti-associated with their down-stream main CDS regions with respect to their TE abnormalities in the 10 HCC tumors (Fig. 5A). Two of these uORFs were shown as examples in Fig. 5B, one from the 5'UTR of KCNAB2 and another from the 5'UTR of AHCYL1. KCNAB2, a potassium channel protein, was subjected to translational up- or down-regulation in tumors of different HCC patients, and its uORF almost always showed opposite directions of translational abnormalities (Fig. 5B). AHCYL1 is an inositol 1,4,5-trisphosphate receptor-binding protein involved in various essential cellular processes such as IP3 signaling, mRNA processing, and DNA replication. AHCYL1 was translationally elevated in most of the 10 HCC patients, while its uORF was suppressed in all of these tumors. The magnitude of uORF suppression was proportional to that of CDS activation, suggesting a potential inhibitory effect of the uORF on the main CDS of AHCYL1 (Fig. 5B). To illustrate potential regulatory functions of these uORFs, we constructed GFP reporter systems, in which the 5'UTR of AHCYL1 or KCNAB2 was conjugated to the CDS of GFP in a plasmid (Fig. 5C). For comparison, the same constructs were prepared, but the uORFs were disabled simply by mutating their start codons (from AUG to AAG) (Fig. 5C). These reporter constructs were then transfected into Huh7 cells. Clearly, cells with the mutated 5'UTR of AHCYL1 or KCNAB2, in which the uORFs were disabled, expressed much more GFP than did the control cells with wild-type 5'UTR of AHCYL1 or KCNAB2, respectively (Fig. 5D, E). Note that GFP mRNA expression levels remained stable in these cells with either wild-type or uORF-disabled 5'UTRs (Fig. 5F). Therefore, these reporter assays support the idea that the AHCYL1 or KCNAB2 uORFs inhibited the translation of their down-stream main CDS.
Associations between uORFs and the downstream main CDS. (A) Scatter plot for 478 uORFs, for which the data of TE fold changes (tumor vs. adjacent normal) were available in at least 8 out of the 10 patients. For each uORF, the value on the Y-axis represents the Spearman's correlation between its TE fold changes across the patients and the TE fold changes of the corresponding main CDS. (B) Two example pairs of uORF-CDS, which are marked in panel (A). Each dot represents one of the 10 patients. The TE fold changes of the uORF in the 10 patients were shown on the X-axis, and the TE fold changes of the main CDS on the Y-axis. (C) Schematic description of the 5'UTR reporter constructs. After a CMV promoter, 5'UTR of AHCYL1 or KCNAB2 was conjugated with the CDS of GFP. To disable the uORFs, in another set of plasmids, the uORF start codon was mutated from ATG to AAG. (D) Green fluorescence and phase contrast images of the cells upon transfection of the 5'UTR reporter plasmids described in panel C. (E) Protein expression levels of GFP in Huh7 cells upon transfection of the 5'UTR reporter plasmids as described in panel C. Relative quantifications of the blots are provided above the images. (F) Relative expression levels of GFP mRNA in the cells upon transfection of the 5'UTR reporter plasmids.
There are many other examples showing different patterns of associations between translation of the uORFs with their main CDS regions. The potential underlying mechanisms are certainly worth further investigations. Therefore, the de novo translatomes assembled for the HCC tumors and normal tissues provided new collections of non-canonical ORFs, which is the basis for further dissection of the previously unannotated translation events and the potential functions of these new ORFs.
In summary, with the technique of ribosome profiling, we have generated the first high-resolution and comprehensive survey of the RNA translation landscapes in HCC. Our data serve as a timely resource, which should help in elucidating the multilayer gene regulation programs in HCC by filling the knowledge gap between the transcriptome and proteome profiles in liver tumors. We performed a series of bioinformatics analyses to showcase deep data mining strategies based on this data resource for insights into the translatomes of HCC. We illustrated a significant and highly selective layer of translational dysregulation in tumors, which is largely independent of the extensively studied transcriptional and post-transcriptional layers of regulations that shape the mRNA expression profiles (Fig. 1, 2). For example, many genes involved in ECM organization were frequently elevated in tumors at the level of translation, and we further confirmed the tumor-promoting functions of two of these genes, AGRN and VWA1.
Furthermore, we took advantage of the sub-codon resolution of the ribosome profiling data and systematically identified the actively translated ORFs in HCC tumors and non-cancerous normal tissues. These ORFs include canonical ORFs from protein coding genes and new non-canonical ORFs from noncoding genes or regions. This is the first de novo annotation of the translatomes in the context of cancer. Such a detailed description of the translatomes in HCC provides an unprecedented insightful resource for further characterization of the novel non-canonical ORFs, especially for their dysregulations in tumors and their potential functions in the translational regulation programs.
Methods
Clinical samples
The primary liver cancer tumor tissues and the adjacent non-cancerous liver tissues were obtained from 10 randomly selected patients with HCC, who underwent radical resections in the Chinese PLA general hospital and Peking Union Medical College Hospital. 9 out of the 10 HCC patients were diagnosed HBV positive, except LC033. All patients were HCV negative. Informed consent was obtained from the patients. Ethical consent was granted from the Committee on Ethics of Biomedicine, Chinese PLA general hospital and Peking Union Medical College Hospital.
Purification of RPFs and total RNA for ribosome profiling
Tumors and adjacent normal tissues from HCC patients were flash-frozen and stored in liquid nitrogen. Prior to the experiments, the tissue samples were crushed into powder in an automatic cryogenic grinder (HORIBA, Freezer/Mill 6770) filled with liquid nitrogen. Approximately 50 mg of each of the powdered samples was lysed in 400 ul of lysis buffer containing 20 mM Tris-HCl (pH 7.4) (Invitrogen, AM9850G), 150mM NaCl (Invitrogen, AM9760G), 5mM MgCl2 (Invitrogen, AM9530G), 1% Triton X-100 (Sigma Aldrich, T8787), 0.1% NP40 (Amresco, E109), 1 mM DTT (Sigma Aldrich, 43816), 25 U/ml DNase I (Invitrogen, AM2239) and 0.1 mg/ml cycloheximide (Inalco, 1758-9310). The mixture was clarified for 10 minutes at 20,000 g at 4°C. Then, 200ul of the clarified lysate was used for purification of the RPFs, which was analyzed by ribosome profiling, and 100ul of the lysate was used for the total RNA sequencing in parallel.
For the RPFs, 90 Units of RNase I (Life Technologies, AM2294) for each A260 of the lysate was added to 200 ul of the supernatant and incubated at room temperature for 45 min with gentle mixing. Nuclease digestion was stopped with 15 ul of SUPERase InTM RNase Inhibitor (Life Technologies, AM2696), and samples were chilled on ice. Ribosome-RNA complexes were purified by Sephacryl S400 spin column chromatography (GE Healthcare, 27514001). The ribosome-protected RNA was extracted with Trizol (Invitrogen, 15596018), following the manufacturer's protocol. Next, the ribosomal RNA was depleted using the RiboZero kit (Illumina; MRZH11124), following the manufacturer's protocol. The samples were then resolved in a 15% urea gel by electrophoresis, and the 25-35nt fragment was excised from the gel. The RNA fragments were finally eluted for least 2 hours in 400ul nuclease-free water, 40 ul of 5 M ammonium acetate (Invitrogen, AM9070G) and 2 ul of 10% SDS (Invitrogen, AM9823), followed by isopropanol (Sigma Aldrich, I9030) precipitation.
Total RNA from the tissue samples was isolated from 100 ul of the clarified tissue lysate with Trizol (Invitrogen, 15596018), and the ribosomal RNA was then depleted using the RiboZero kit (Illumina; MRZH11124). Next, the rRNA-depleted total RNA was fragmented with PNK buffer (NEB, M0201L) at 95°C for 20min.
Sequencing library preparation
Both RPF and fragmented total RNA were cloned and amplified for next-generation sequencing with a tagging-based workflow. In brief, the RNA fragments were end repaired with T4 PNK (NEB, M0201L) and ligated with 3' adaptor, followed by cDNA synthesis, cDNA gel purification, circularization and PCR amplification [43]. The sequencing libraries were assessed with a BioAnalyzer and quantified using KAPA SYBR FAST Universal qPCR Kit (Kapa Biosystems, KK4601) prior to and after pooling for sequencing. Library insert sizes were typically around 30 bp. The pooled libraries were sequenced on the Illumina HiSeq 2500 platform with a single-end sequencing strategy for 50 cycles.
Processing of the Ribosome profiling and RNA-seq data
The pre-processing procedure of the ribosome profiling data and the parallel RNA-seq data has been described previously [13, 44]. Specifically, the 3' adaptors were trimmed from the raw reads of both the mRNA and RPF. Low-quality reads with Phred quality scores lower than 20 (>50% of bases) were removed using the fastx quality filter (http://hannonlab.cshl.edu/fastx_toolkit/). The reads originated from rRNAs were identified and discarded by aligning the reads to human rRNA sequences (5S, 5.8S, 18S, and 28S) using Bowtie (version 1.1.2) with no mismatch allowed. The remaining reads were then mapped to the human genome and spliced transcripts using STAR with the following parameters: --outFilterType BySJout --outFilterMismatchNmax 2 --outSAMtype BAM --quantMode TranscriptomeSAM --outFilterMultimapNmax 1 --outFilterMatchNmin 16.
Analysis of gene differential translation efficiencies
The bioinformatics pipeline Xtail was used for quantitative and systematic analyses of the differential translation efficiencies between each pair of tumor and normal tissue samples for each HCC patient [13]. Preparation of the data for Xtail has been described previously [13, 44]. Specifically, the mRNA expression was estimated by the RNA-seq reads, which were counted using HTSeq-count (version 0.7.2) [13, 45]. The RPF reads were subjected to multiple steps of read filtering, which reduced the technical noise of ribosome profiling and extracted the reads originating from ribosome-binding and translating sequences in coding regions. First, RPF reads with lengths of 25-35 nt were deemed high quality and most likely to be from ribosome-occupied RNA in human cells. Second, reads with multiple alignments were discarded, and only the reads uniquely mapped to the coding regions were counted for RPFs. Third, due to the potential accumulation of ribosomes around the starts and ends of coding regions, reads aligned to the first 15 and last 5 codons were excluded for counting of RPFs.
Most of the bioinformatics algorithms for differential translation analysis with ribosome profiling data require at least 2 replicates for each group of samples. However, due to the extensive inter-tumoral heterogeneity across the 10 HCC patients as shown in Fig. 1, it would be inappropriate to treat the 10 tumors and the 10 adjacent normal samples simply as two groups with 10 replicates each. Therefore, we first performed genome-wide differential translation analysis between the tumor and normal tissues for each HCC patient. This was done with Xtail, as it allows analysis of differential translation without replicates [13]. Specifically, the RNA and RPF read counts of the paired tumor and adjacent normal tissue samples from one patient were processed by the Xtail algorithm, which yielded TE fold change and P-value as an assessment of the differential translation for each gene in each of the 10 HCC patients (Supplementary File 3).
Results from the 10 differential translation analyses for the 10 HCC patients were then treated as independent sources of evidence for general assessments of translation dysregulations in HCC. Specifically, we derived the consensus TE up- or down-regulation of each gene by integrating the evidence of differential TE of the gene in the 10 comparisons between the matched tumor and normal samples (Supplementary File 4). Many genes indeed showed consistent trends of up- or down-regulation of their TEs in all HCC patients. However, there are also genes showing opposite directions of TE changes in different patients. We reasoned that a gene could be subjected to heterogeneous perturbations of translation in different patients. We wished to assess the extent of translation perturbation in the dominating direction by collecting and integrating the supporting evidence from some patients. However, this does not preclude the possibility that this gene could be subjected to strong translational dysregulation in the opposite direction in other patients.
Specifically, for the 10 HCC patients, if a gene showed up-regulated TE in more than half (5) of the tumors and down-regulated TE in no more than 3 patients, this gene was identified to have consensus up-regulation of TE. We then used Stouffer's method to integrate the P-values from the patient-specific comparisons above that showed up-regulated TE in the tumors. This yielded the consensus P-value for up-regulated TE. Similarly, genes with down-regulated TE in more than half of the 10 patients and up-regulated TE in no more than 3 patients were defined as TE down. The consensus P-values for down-regulated TE of these genes were inferred with Stouffer's method, which integrated the P-values from the tumor-normal comparisons showing down-regulated TE. Finally, the genes with consensus TE up or down were sorted by their P-values, separately, and the top 100 genes from the two lists are shown in Fig. 2A.
Gene Ontology functional enrichment analyses
For the various gene sets selected by the different analyses, GO enrichment analysis was conducted using the Metascape tool. The GO terms with P-values < 0.001 were selected and imported into REVIGO, which visualizes the terms as nodes in a network. Each GO term was color-coded according to the P-value (-log10) of the enrichment. The size of each node is proportional to the number of genes belonging to the GO term, whereas the link between different terms represents the number of shared genes between two GO terms.
Polysome fractionation
Samples were resuspended in polysome lysis buffer (10 mM Tris pH 7.4, 150 mM KCl, 5 mM MgCl2, 0.1mg/ml CHX, 1 mM DTT, 1% Triton X-100, 0.1% NP-40, 140 U/ml RNasin), lysed on ice, and clarified by centrifugation at 20,000 × g for 10 min. Lysates were then centrifuged through a 10-50% sucrose gradient in gradient buffer (10 mM Tris pH 7.4, 150 mM KCl, 5 mM MgCl2, 0.1mg/ml CHX, 1 mM DTT) for 2 hours at 36,000 rpm in a SW41Ti rotor (Beckman). Gradients were collected with an ISCO gradient fractionator coupled to an optical density recorder.
RNA extraction and real-time qPCR analysis
RNA was isolated using Trizol reagent following the manufacturer's instructions, followed by DNase1 digestion (NEB, M0303L). Reverse transcription of RNA was performed with High-Capacity cDNA RT Kit with random primers (Invitrogen, 4368814). The first-strand cDNA was diluted 1:5 in nuclease-free water and used as a template. Real-time qPCR was performed with SYBR Green PCR Master Mix (Invitrogen, 4364346) and the gene-specific primers shown in the following table. The housekeeping gene, Beta-actin, was used as an endogenous control. The relative expression of RNAs was calculated using the comparative Ct method.
Heading
| Gene name | Forward primer (5'-3') | Reverse primer (5'-3') |
|---|---|---|
| β-actin | CACCATTGGCAATGAGCGGTTC | AGGTCTTTGCGGATGTCCACGT |
| AGRN | GATGGAGTCACATACGGCAACG | TCACAGTCACGGAGGCAGATGT |
| VWA1 | GAGAAGCACCTGCACTTTGTGG | TGGACGTGATCTCCGTGGCATG |
| CDH2 | CCTCCAGAGTTTACTGCCATGAC | GTAGGATCTCCGCCACTGATTC |
| VIM | AGGCAAAGCAGGAGTCCACTGA | ATCTGGCGTTCCAGGGACTCAT |
| GFP | GACCACATGAAGCAGCACGAC | CTTCAGCTCGATGCGGTTCAC |
Western blot analysis
Powdered samples of HCC tumor or normal liver tissues or cells were lysed in cell lysis buffer (Solarbio, J619) containing a protease inhibitor cocktail (Roche, 4693124001). Total protein levels were quantified by bicinchoninic acid (BCA) assay Kit (Pierce, 23228). Twenty to forty microgram of total protein were resolved by SDS-polyacrylamide gels, transferred to nitrocellulose membranes (Millipore, HATF00010), and detected with the appropriate primary and HRP-conjugated secondary antibody. Prestained protein ladders (Thermo, 26619) were loaded to one well of each SDS-PAGE gel on western blots. Antibody detection was performed using the SuperSignal West Pico Chemiluminescent Substrate (Pierce Biotechnology, 34080) and imaged on the Molecular Imager ChemiDox XRS System from Bio-Rad. Primary anti-AGRN (PA5-37121) was purchased from Thermofisher, anti-VWA1 (14322-1-AP), anti-CDH2 (22018-1-AP), anti-VIM (10366-1-AP) and anti-GFP (50430-2-AP) were purchased from Proteintech, anti-α-tubulin (ab7291) and anti-β-actin (ab8227) antibodies were purchased from abcam. Secondary anti-rabbit (#31466) and anti-mouse (#31431) antibodies were purchased from Pierce Biotechnology.
Cell culture
Huh7 cells were obtained from the American Type Culture Collection (ATCC). The cells were cultured in Dulbecco's modified Eagle's medium containing 4.5 g/L glucose (Corning, 10-013-CVR) supplemented with 10% (v/v) fetal bovine serum (FBS) (HyClone, SH30084.03). Cells were grown in a humidified cell culture incubator containing 5% CO2 at 37˚C. All cells were routinely tested as mycoplasma-free with the Mycoplasma Detection kit (Bimake, B39032).
Constructs and transfections
5'UTR sequences of AHCYL1 and KCNAB2, including both the wile type forms and the uORF start codon mutants (AUG to AAG), were synthesized at Wuxi Qinglan Biotech Co. Ltd. The fragments were inserted into a Xho1- and EcoR1-digested enhanced green fluorescent protein (eGFP) expression cassette (pEGFP-N1) (Fig. 5C). The plasmids were then transfected into the cells with Lipofectamine 2000 by the manufacturer's protocol.
Imaging
Fluorescent microscopy was performed (ECLIPSE Ti, Nikon) and images were captured with a Nikon DIGITAL SIGHT DS U3 camera at identical settings and exposure time.
Small interfering RNA (siRNA) synthesis and transfection
The siRNAs specifically targeting AGRN and VWA1, scrambled non-targeting control siNC and negative controls siLMNA were synthesized by GenePharma (Suzhou, Jiangsu, China). The sequences of siRNAs are listed in the following table. siRNAs were transfected at a final concentration of 10nM using Lipofectamine RNAiMAX Reagent (Invitrogen, 13778075) following the manufacturer's protocol. Briefly, siRNAs were diluted in Opti-MEM medium and then RNAiMAX was added in. Mix gently and incubate for 20 minutes at room temperature. For 96-well plates, 100ul medium containing 104 cells were added to the transfection mixture. 6 hours after transfection, replace the cell supernatant with fresh cell medium.
Heading
| Gene name | Sense (5'-3') | Antisense (5'-3') |
|---|---|---|
| AGRN (human) | GCAGGAGCACGUGCGAUUUAU | AUAAAUCGCACGUGCUCCUGC |
| VWA1 (human) | CCUGCACAUCAUUGUCCAAGA | UCUUGGACAAUGAUGUGCAGG |
| NC | UUCUCCGAACGUGUCACGU | ACGUGACACGUUCGGAGAA |
| LMNA (human) | GAAGCAACUUCAGGAUGAGAU | AUCUCAUCCUGAAGUUGCUUC |
Lentivirus production and construction of stable cell lines
The shRNA plasmids were obtained from Sigma-Aldrich. For packaging of lentivirus, 70% confluent HEK293FT cells in Flask T-175 were transfected with 10 ug of the shRNA vector with 15 ug and 10 ug of Δ8.9 envelope and Vsv-G packaging vectors, respectively. 6 hours after transfection, the medium was replaced with fresh medium. Infectious lentivirus supernatant was harvested at 72 h post-transfection. After centrifugation, lentivirus supernatant was filtered through 0.45 um PVDF filters (Millex, SLHV033RB), aliquoted and stored at -80℃. The lentivirus-containing supernatant supplemented with 8 ug/mL of polybrene (Sigma-Aldrich, H9268) were used to infect Huh7 cell lines. Twenty-four hours after infection, the Huh7 cells were selected in medium containing 2 ug/mL puromycin (Amresco, J593) and passaged under continuous selection for at least 2 passages before the experiments. The TRC IDs of the shRNAs are listed in the following table. Scrambled shRNA as a non-targeting control (shNC) and the shRNAs targeting LMNA were used as negative controls.
Heading
| Gene Symbol | TRC_ID | Gene Symbol | TRC_ID |
|---|---|---|---|
| AGRN | TRCN0000056391 | LMNA | TRCN0000061833 |
| VWA1 | TRCN0000117177 | shNC | TRCN0000050849 |
Cell proliferation assay
Proliferation experiments were carried out by plating 8,000 cells or 50,000 cells (about 30% confluence) in 96-well or 24-well plates respectively and cultured in regular media. The IncuCyte live-cell imaging and analysis system (Essen Bioscience) was used to monitor the long-term cell growth and morphology change. Cell proliferation was quantified by measuring the occupied area (% confluence) of the cell images over time.
Colony formation assay
For colony formation assays, 1,000 cells were seeded in the 6-well plates or 35 mm dishes and incubated with normal medium for 2 weeks. Colonies were fixed with methanol (Fisher Scientific, A452) for 5 min at room temperature and stained with 0.5% crystal violet (YEASEN, 60506ES60) for 10min at room temperature. Finally, the colonies were imaged by a camera or under a microscope.
Anchorage independent growth assay
The anchorage independent growth assay was performed in 6-well plates using stable cells plated at a density of 3,000 cells/well. Cells were suspended in medium with 0.3% agarose and seeded onto plates pre-coated with 0.6% base agarose. Cells were then cultured for about 2 weeks. The colonies were photographed under a microscope after cells had been stained with 0.005% crystal violet.
Wound-healing assay
The wound healing assay was performed to monitor and quantify cell motility. Briefly, cells were seeded in a 96-well plate at 3*104 cells per well and allowed to reach confluence before the surface was uniformly scratched across the center of the well by an Essen wound maker (Essen Bioscience). The wells were then rinsed with fresh medium to remove floating cells, and the wound healing process was monitored continuously in the IncuCyte live-cell imaging system (Essen Bioscience). Images were obtained at each set time point and then analyzed by the IncuCyte scratch wound assay software to quantify wound healing. Data were expressed as wound widths.
Transwell cell migration assay
A total of 3*104 cells were suspended in 100 ul of DMEM without FBS and seeded into the top chamber of 24-well plate-sized transwell inserts (Millipore, MCEP24H48) with a membrane with a pore size of 8 um. The medium containing 10% FBS was placed into the lower chamber as a chemoattractant. After incubation for 24 h, the cells that did not migrate through the pores were manually removed with a cotton swab. Cells presented at the bottom of the membrane were fixed with methanol and stained with 0.5% crystal violet and then counted and imaged under a microscope.
In vivo xenograft tumor models
Male immune deficient NSG mice (6-8 weeks old) were used for animal studies. Huh cells (2*106) were injected subcutaneously into the left or the right flanks of mice. Tumors were allowed to grow for 4 weeks. The mice were sacrificed, and the tumors were isolated, photographed and weighed. To confirm knock-down efficiency in the grown tumors, small fractions of the tumors were also collected for RNA extraction and qPCR assays.
De novo assembly of the translatomes
The bioinformatics package RiboCode [31] was used to annotate the active ORFs and assemble the translatomes with the RPF reads from the tumors and normal tissue samples. The RPF reads with lengths 25-35 nt were supplied to RiboCode, which was run with the default settings. The minimal ORF length was set to 30 nt (10 amino acids for the translation product), and the P-value cutoff was set to 0.05. The “ORFcount” function in RiboCode was used to count the RPF reads on each ORF.
Supplementary Material
Supplementary figures, table, and file legends.
Supplementary file 1.
Supplementary file 2.
Supplementary file 3.
Supplementary file 4.
Supplementary file 5.
Supplementary file 6.
Supplementary file 7.
Acknowledgements
The authors wish to acknowledge the supports from the Platforms of Genome Sequencing, High-Performance Computing, and shRNA Library of the National Protein Science Facility (Beijing), and the Lab Animal Center at Tsinghua University. This work was supported by the National key research and development program, Precision Medicine Project (2016YFC0906001), the National Natural Science Foundation of China (91540109, 81472855, and 31671381), the Tsinghua University Initiative Scientific Research Program (2014z21046), the Tsinghua-Peking Joint Center for Life Sciences, and the 1000 talent program (Youth Category).
Author contributions
QZ and XY conceived and designed the study. ZX and RH conducted the bioinformatics analysis of the data. QZ performed all the experiments with help of Xin W. Xun W and HZ provided the clinical samples. XY supervised the whole project. QZ and XY wrote the manuscript with help of ZX and RH. All authors have read and approved the final manuscript.
Data availability
The ribosome profiling data generated in this study has been deposited in the Gene Expression Omnibus (GEO) with the accession code GSE112705. All the data analysis results have been provided in the supplementary files.
Competing Interests
The authors have declared that no competing interest exists.
References
1. Bhat M, Robichaud N, Hulea L, Sonenberg N, Pelletier J, Topisirovic I. Targeting the translation machinery in cancer. Nat Rev Drug Discov. 2015;14:261-78
2. Truitt ML, Ruggero D. New frontiers in translational control of the cancer genome. Nat Rev Cancer. 2016;16:288-304
3. Graff JR, Konicek BW, Carter JH, Marcusson EG. Targeting the eukaryotic translation initiation factor 4E for cancer therapy. Cancer Res. 2008;68:631-4
4. Silvera D, Formenti SC, Schneider RJ. Translational control in cancer. Nat Rev Cancer. 2010;10:254-66
5. Blagden SP, Willis AE. The biological and therapeutic relevance of mRNA translation in cancer. Nat Rev Clin Oncol. 2011;8:280-91
6. Ingolia NT, Ghaemmaghami S, Newman JR, Weissman JS. Genome-wide analysis in vivo of translation with nucleotide resolution using ribosome profiling. Science. 2009;324:218-23
7. Brar GA, Weissman JS. Ribosome profiling reveals the what, when, where and how of protein synthesis. Nat Rev Mol Cell Biol. 2015;16:651-64
8. Andreev DE, O'Connor PB, Loughran G, Dmitriev SE, Baranov PV, Shatsky IN. Insights into the mechanisms of eukaryotic translation gained with ribosome profiling. Nucleic Acids Res. 2017;45:513-26
9. Hsieh AC, Liu Y, Edlind MP, Ingolia NT, Janes MR, Sher A. et al. The translational landscape of mTOR signalling steers cancer initiation and metastasis. Nature. 2012;485:55-61
10. Thoreen CC, Chantranupong L, Keys HR, Wang T, Gray NS, Sabatini DM. A unifying model for mTORC1-mediated regulation of mRNA translation. Nature. 2012;485:109-13
11. Wolfe AL, Singh K, Zhong Y, Drewe P, Rajasekhar VK, Sanghvi VR. et al. RNA G-quadruplexes cause eIF4A-dependent oncogene translation in cancer. Nature. 2014;513:65-70
12. Rubio CA, Weisburd B, Holderfield M, Arias C, Fang E, DeRisi JL. et al. Transcriptome-wide characterization of the eIF4A signature highlights plasticity in translation regulation. Genome Biol. 2014;15:476
13. Xiao Z, Zou Q, Liu Y, Yang X. Genome-wide assessment of differential translations with ribosome profiling data. Nat Commun. 2016;7:11194
14. Yoshihara K, Shahmoradgoli M, Martinez E, Vegesna R, Kim H, Torres-Garcia W. et al. Inferring tumour purity and stromal and immune cell admixture from expression data. Nat Commun. 2013;4:2612
15. Aran D, Sirota M, Butte AJ. Systematic pan-cancer analysis of tumour purity. Nat Commun. 2015;6:8971
16. Liu Y, Huang R, Liu Y, Song W, Wang Y, Yang Y. et al. Insights from multidimensional analyses of the pan-cancer DNA methylome heterogeneity and the uncanonical CpG-gene associations. Int J Cancer. 2018;143:2814-27
17. Chen R, Zhou X, Yu Z, Liu J, Huang G. Low Expression of LDHB Correlates With Unfavorable Survival in Hepatocellular Carcinoma: Strobe-Compliant Article. Medicine (Baltimore). 2015;94:e1583
18. Nakagawa H, Hayata Y, Kawamura S, Yamada T, Fujiwara N, Koike K. Lipid Metabolic Reprogramming in Hepatocellular Carcinoma. Cancers (Basel). 2018:10
19. Gerresheim GK, Bathke J, Michel AM, Andreev DE, Shalamova LA, Rossbach O. et al. Cellular Gene Expression during Hepatitis C Virus Replication as Revealed by Ribosome Profiling. Int J Mol Sci. 2019:20
20. Neumann FR, Bittcher G, Annies M, Schumacher B, Kroger S, Ruegg MA. An alternative amino-terminus expressed in the central nervous system converts agrin to a type II transmembrane protein. Molecular and cellular neurosciences. 2001;17:208-25
21. Chakraborty S, Lakshmanan M, Swa HL, Chen J, Zhang X, Ong YS. et al. An oncogenic role of Agrin in regulating focal adhesion integrity in hepatocellular carcinoma. Nat Commun. 2015;6:6184
22. Kawahara R, Granato DC, Carnielli CM, Cervigne NK, Oliveria CE, Rivera C. et al. Agrin and perlecan mediate tumorigenic processes in oral squamous cell carcinoma. PloS one. 2014;9:e115004
23. Noell S, Wolburg-Buchholz K, Mack AF, Ritz R, Tatagiba M, Beschorner R. et al. Dynamics of expression patterns of AQP4, dystroglycan, agrin and matrix metalloproteinases in human glioblastoma. Cell and tissue research. 2012;347:429-41
24. Li X, Wang X, Song W, Xu H, Huang R, Wang Y. et al. Oncogenic Properties of NEAT1 in Prostate Cancer Cells Depend on the CDC5L-AGRN Transcriptional Regulation Circuit. Cancer research. 2018;78:4138-49
25. Fitzgerald J. WARP: A Unique Extracellular Matrix Component of Cartilage, Muscle, and Endothelial Cell Basement Membranes. Anatomical record (Hoboken, NJ: 2007). 2019
26. Calviello L, Ohler U. Beyond Read-Counts: Ribo-seq Data Analysis to Understand the Functions of the Transcriptome. Trends Genet. 2017;33:728-44
27. Ingolia NT, Lareau LF, Weissman JS. Ribosome profiling of mouse embryonic stem cells reveals the complexity and dynamics of mammalian proteomes. Cell. 2011;147:789-802
28. Calviello L, Mukherjee N, Wyler E, Zauber H, Hirsekorn A, Selbach M. et al. Detecting actively translated open reading frames in ribosome profiling data. Nat Methods. 2016;13:165-70
29. Fields AP, Rodriguez EH, Jovanovic M, Stern-Ginossar N, Haas BJ, Mertins P. et al. A Regression-Based Analysis of Ribosome-Profiling Data Reveals a Conserved Complexity to Mammalian Translation. Mol Cell. 2015;60:816-27
30. Ji Z, Song R, Regev A, Struhl K. Many lncRNAs, 5'UTRs, and pseudogenes are translated and some are likely to express functional proteins. Elife. 2015;4:e08890
31. Xiao Z, Huang R, Xing X, Chen Y, Deng H, Yang X. De novo annotation and characterization of the translatome with ribosome profiling data. Nucleic Acids Res. 2018;46:e61
32. Laing WA, Martinez-Sanchez M, Wright MA, Bulley SM, Brewster D, Dare AP. et al. An upstream open reading frame is essential for feedback regulation of ascorbate biosynthesis in Arabidopsis. The Plant cell. 2015;27:772-86
33. Starck SR, Tsai JC, Chen K, Shodiya M, Wang L, Yahiro K. et al. Translation from the 5' untranslated region shapes the integrated stress response. Science. 2016;351:aad3867
34. Young SK, Wek RC. Upstream Open Reading Frames Differentially Regulate Gene-specific Translation in the Integrated Stress Response. The Journal of biological chemistry. 2016;291:16927-35
35. Gerashchenko MV, Lobanov AV, Gladyshev VN. Genome-wide ribosome profiling reveals complex translational regulation in response to oxidative stress. Proceedings of the National Academy of Sciences of the United States of America. 2012;109:17394-9
36. Brar GA, Yassour M, Friedman N, Regev A, Ingolia NT, Weissman JS. High-resolution view of the yeast meiotic program revealed by ribosome profiling. Science. 2012;335:552-7
37. Cabrera-Quio LE, Herberg S, Pauli A. Decoding sORF translation - from small proteins to gene regulation. RNA Biol. 2016;13:1051-9
38. Barbosa C, Peixeiro I, Romao L. Gene expression regulation by upstream open reading frames and human disease. PLoS Genet. 2013;9:e1003529
39. Wethmar K. The regulatory potential of upstream open reading frames in eukaryotic gene expression. Wiley Interdiscip Rev RNA. 2014;5:765-78
40. Calvo SE, Pagliarini DJ, Mootha VK. Upstream open reading frames cause widespread reduction of protein expression and are polymorphic among humans. Proc Natl Acad Sci U S A. 2009;106:7507-12
41. Yepiskoposyan H, Aeschimann F, Nilsson D, Okoniewski M, Muhlemann O. Autoregulation of the nonsense-mediated mRNA decay pathway in human cells. RNA. 2011;17:2108-18
42. Arribere JA, Gilbert WV. Roles for transcript leaders in translation and mRNA decay revealed by transcript leader sequencing. Genome Res. 2013;23:977-87
43. Ingolia NT, Brar GA, Rouskin S, McGeachy AM, Weissman JS. The ribosome profiling strategy for monitoring translation in vivo by deep sequencing of ribosome-protected mRNA fragments. Nat Protoc. 2012;7:1534-50
44. Lin Z, Hsu PJ, Xing X, Fang J, Lu Z, Zou Q. et al. Mettl3-/Mettl14-mediated mRNA N(6)-methyladenosine modulates murine spermatogenesis. Cell research. 2017;27:1216-30
45. Anders S, Pyl PT, Huber W. HTSeq-a Python framework to work with high-throughput sequencing data. Bioinformatics. 2015;31:166-9
Author contact
![]() Corresponding author: Xuerui Yang, Medical Science Building D231, School of Life Sciences, Tsinghua University, Beijing 100084, China. Tel: 86-10-62783943. Email: yangxueruiedu.cn
Corresponding author: Xuerui Yang, Medical Science Building D231, School of Life Sciences, Tsinghua University, Beijing 100084, China. Tel: 86-10-62783943. Email: yangxueruiedu.cn