Impact Factor
- Issue 14; 2026
- Issue 13; 2026
- Issue 12; 2026
- Issue 11; 2026
- Issue 10; 2026
- Volume 16; 2026
- Advance Articles
- Past Issues
- Cover Images
- Cover Suggestion
- Index & Coverage
- Special Issues
Introduction
Results
Discussion
Methods
EM imaging
Abbreviations
Supplementary Material
Acknowledgements
References
International Journal of Biological Sciences
International Journal of Medical Sciences
 Global reach, higher impact

Theranostics 2019; 9(12):3501-3514. doi:10.7150/thno.31951 This issue Cite
Research Paper
Identification of a rhodanine derivative BML-260 as a potent stimulator of UCP1 expression
Zhuanghui Feng1, Yuda Wei1, Yongxian Zhang1, Yan Qiu1, Xiaojian Liu1, Li Su2, Ningning Liang1, Huiyong Yin1, Qiurong Ding1,3 ![]()
1. CAS Key Laboratory of Nutrition, Metabolism and Food Safety, Shanghai Institute of Nutrition and Health, Shanghai Institutes for Biological Sciences, University of Chinese Academy of Sciences, Chinese Academy of Sciences, 200031, P. R. China.
2. Institute of Translational Medicine, Shanghai University, Shanghai, China.
3. Institute for Stem Cell and Regeneration, Chinese Academy of Sciences, Beijing 100101, P. R. China.
Received 2018-12-2; Accepted 2019-4-14; Published 2019-5-26
Abstract

Identification of proper agents to increase or activate UCP1+ cells in adipose tissues remains a potent therapeutic strategy to combat obesity. Screening systems for UCP1 activators have been previously established and allow for unbiased discovery of effective compound(s).
Methods: A previously established Ucp1-2A-GFP reporter system was applied to a chemical library containing 33 phosphatase inhibitors. Compounds that can significantly activate UCP1 expression were further tested in vivo in mouse adipose tissues. Possible underlying mechanism was explored via RNA profiling, CMAP analysis, CRISPR targeting as well as inhibitor treatments.
Results: We identified BML-260, a known potent inhibitor of the dual-specific phosphatase JSP-1, that significantly increased UCP1 expression in both brown and white adipocytes. BML-260 treatment also activated oxidative phosphorylation genes, increased mitochondrial activity as well as heat generation in vitro and in vivo. Mechanistic studies revealed that effect of BML-260 on adipocytes was partly through activated CREB, STAT3 and PPAR signaling pathways, and was unexpectedly JSP-1 independent.
Conclusion: The rhodanine derivate BML-260 was previously identified to be a JSP-1 inhibitor, and thus was proposed to treat inflammatory and proliferative disorders associated with dysfunctional JNK signaling. This work provides evidences that BML-260 can also exert a JSP-1-independent effect in activating UCP1 and thermogenesis in adipocytes, and be potentially applied to treat obesity.
Keywords: BML-260, Uncoupling protein 1, Adipocyte browning, Mitochondrial activity
Introduction
Adipose tissues exist within multiple anatomical locations and exert key functions to control energy expenditure and regulate metabolic homeostasis. Dysfunctional adipose tissues can result in severe human diseases including insulin resistance, dyslipidemia and cancer. Adipose tissues are in general classified into white adipose tissue (WAT) and brown adipose tissue (BAT), with the former storing lipids, whereas the latter utilizing lipids to produce heat mainly through uncoupling of fatty acid oxidation from ATP production by the uncoupling protein 1 (UCP-1) [1]. Therefore, it has been an attractive strategy to combat obesity by promoting the expression and activity of UCP1 in adipocytes, with the aim to ignite or increase thermogenesis within WAT or BAT.
Multiple key signaling pathways and an increasing number of compounds have been reported to increase UCP1 expression in BAT or induce UCP1 expression in WAT, which is usually referred as “browning”. Although the induced UCP1 expression in WAT is considerably lower than UCP1 expression in BAT, and exclusively depends on external stimuli, regulation of UCP1 in WAT and BAT share many signaling pathways discovered thus far. Activation of UCP1 expression in both BAT and WAT have been demonstrated to be a sympathetic event. Acute or chronic stimulation by norepinephrine (NE) released from the sympathetic nerves or treatment with a β3-adrenergic agent can significantly activate UCP1 expression in both BAT and WAT [1-4], whereas in mice without β3-adrenergic adrenoceptors, browning was barely induced [5]. The formation of the 3',5'cyclic adenosine monophosphate (cAMP) and consequent stimulation of protein kinase A (PKA) are crucial for adrenergic signaling in upregulating UCP1 expression [6]. cAMP/PKA then elicits signaling cascades via p38 MAPK, PGC-1α, ATF and CREB to increase transcriptional levels of UCP1 as well as thermogenic genes [7-9]. Besides adrenergic signaling pathway and β-adrenergic agonists, several other signaling pathways, for example, the janus kinase (JAK)/signal transducer and activator of transcription (STAT) pathway [10,11], the vascular endothelial growth factor (VEGF) pathway [12] and the silent information regulator type 1 (SIRT1) pathway [13]; and a number of other compounds or cytokines, including fibroblast growth factor 21 (FGF21) [14], artemisinin derivatives [15], berberine [16] and resveratrol [17,18], have been demonstrated to be able to induce UCP1 expression in BAT or WAT.
Despite these findings, more efficacious reagents and comprehensive understanding of the UCP1 regulation in different adipocytes are still lacking. Several cellular screening systems for UCP1 activators have been previously established that allow for high-throughput and unbiased identification of effective compounds [19-21]. For example, we have generated an immortalized brown adipocyte cell line that harbors an Ucp1-2A-GFP reporter system. In this system, the 2A-GFP cassette was knocked-in immediately before the stop codon of the endogenous Ucp1 gene, the GFP intensity thus serves as a surrogate of the endogenous expression level of the UCP1 protein [21]. Using this reporter system, we have screened ~1,000 FDA-approved compounds and identified 42 drugs that may activate UCP1 expression in brown adipocytes [21]. In this study, with an initial purpose to discover possible phosphatases that may involve in UCP1 regulation, we applied the same screening platform to a phosphatase inhibitor library. We unexpectedly discovered a rhodanine derivative compound that can significantly upregulate UCP1 and act independently of its phosphatase inhibitor effect. This study offered another example where unbiased screening was applied that led to unexpected findings; and meanwhile, opened up a possibility that rhodanine derivatives can be used to treat obesity through UCP1 regulation.
Results
BML-260 activates UCP1 expression and increases mitochondrial activity in vitro
We initially wanted to identify possible phosphatases that may involve in UCP1 regulation. We screened a small chemical library by using the Ucp1-2A-GFP cellular system we have established before [21]. This chemical library composes 33 phosphatase inhibitors targeting several phosphatases, including protein phosphatase 1 (PP1), protein phosphatase 2A (PP2A), protein phosphatase 2B (PP2B), protein tyrosine phosphatase 1B (PTP1B), phosphatase CDC25, phosphatase CD45, and JNK Stimulatory Phosphatase-1 (JSP-1) (Table S1). We treated the cells with individual compound starting at day 3 during the differentiation process and the result was assessed by eye-checking of the GFP intensity at day 10. After primary screening, only one compound showed significant effect in enhancing GFP intensity, which was a potent inhibitor of JSP-1 and named BML-260 (Figure 1B) [22].
BML-260 activates UCP1 expression in brown adipocytes. (A) Schematic view of the adipocyte differentiation procedure and compound treatment protocol. Red arrows indicate time points of cell collection for analysis. (B) Molecular structure of BML-260. (C) Representative images of GFP intensity of cells upon treatment with BML-260 for indicated days, in comparison to cells treated by ISO and DMSO. Scale bar = 200 μm. (D) Analysis of UCP1 mRNA expression in above cells with DMSO, ISO or BML-260 treatment. (E) Analysis of UCP1 protein expression in above cells with DMSO, ISO or BML-260 treatment. Pre-BAT, undifferentiatied brown preadipoctyes. Data are represented as means with SEM. * P<0.05, ** P<0.01, *** P<0.001, **** P<0.0001.
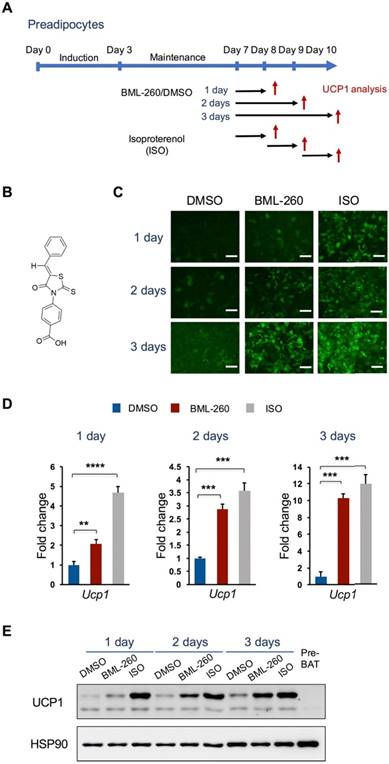
We further confirmed the effect of BML-260 in upregulating UCP1 expression. Mature brown adipocytes were treated with BML-260 for 1, 2 or 3 days and were compared with cells treated with isoproterenol (ISO) for UCP1 expression (Figure 1A). BML-260 treatment significantly increased the expression of UCP1, at both the mRNA level and the protein level, and the effect appeared to be treatment-time dependent (Figure C-E). After 3 days' treatment with BML-260, the UCP1 expression level in the cells was comparable with the level in ISO-treated cells (Figure C-E). The BML-260 effect was also tested in the adipocyte differentiation process. Cells were treated with BML-260 for 10 days along the whole differentiation process (Figure S1A) or with BML-260 for 3 days at the differentiation induction stage (Figure S2A). Cells treated with BML-260 for 10 days displayed a comparable expression level of UCP1 when compared with ISO-treated cells (Figure S1B-C); whereas cells treated with BML-260 at the induction stage did not induce significant change in UCP1 expression (Figure S2B). These results altogether suggest that BML-260 mainly functions in mature adipocytes.
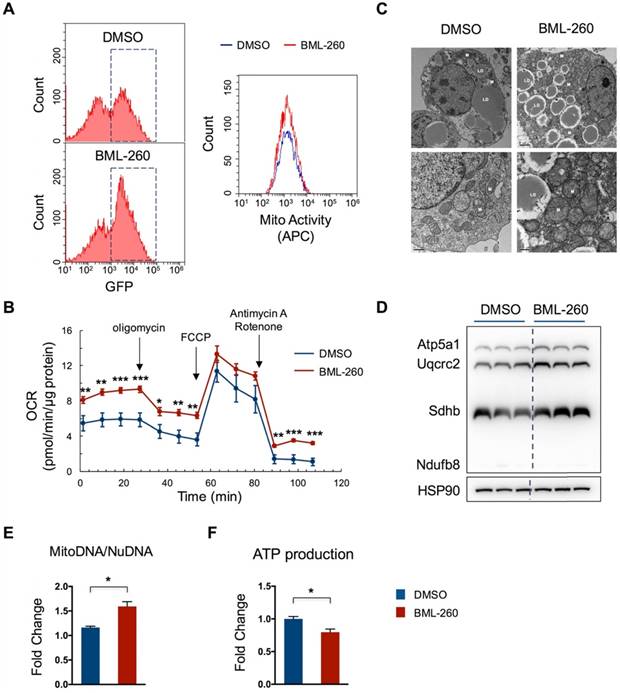
We next assessed whether BML-260 treatment increases mitochondrial activity. Cells were stained with a far-red mito-probe, which does not fluoresce until it enters an actively respiring cell, thus only stains active-respiring mitochondria. Cells showed an increase in number of GFP+ cells upon BML-260 treatment, as compared to DMSO-treated cells, corresponding to upregulated UCP1 expression. Moreover, those GFP+ cells displayed high mitochondrial activity as indicated by the mito-probe fluorescence signal (Figure 2A). Consistently, the oxygen consumption rate (OCR) in BML-260-treated cells was significantly higher than in control cells (Figure 2B). We also assessed the possible change of mitochondrial copy numbers after BML-260 treatment. As shown by the EM image, cells after BML-260 treatment displayed significantly increased number of mitochondria (Figure 2C). Moreover, the OXPHOS proteins and the ratio of MitoDNA/NuDNA also showed a clear increase in BML-260-treated cells (Figure 2D-E). Despite of enhanced mitochondrial activity, the ATP production in BML-260-treated cells decreased as compared to control cells, suggesting promoted energy uncoupling by UCP1 (Figure 2F). Overall, the results demonstrated that BML-260 treatment can increase UCP1 expression, mitochondrial number and activity in brown adipocytes.
BML-260 enhances mitochondrial activity in brown adipocytes. (A-F) Functional analysis of mature brown adipocytes treated with DMSO or BML-260 for 3 days. (A) FACS analysis of GFP intensity of cells treated with DMSO or BML-260 (Left panel); GFP+ cells as indicated in dashed boxes were further analysed for mitochondrial activity (APC intensity) (Right panel). (B) Oxygen consumption analysis. (C) EM imaging. LD, lipid droplet; M, mitochondrion. Scale bar = 2 µm (upper images); Scale bar = 0.5 µm (lower images). (D) OXPHOS protein expression levels. (E) The ratio of mitochondrial DNA (mitoDNA) vesus nuclear DNA (nuDNA). (F) ATP production. Data are represented as means with SEM. * P<0.05, ** P<0.01, *** P<0.001, **** P<0.0001.
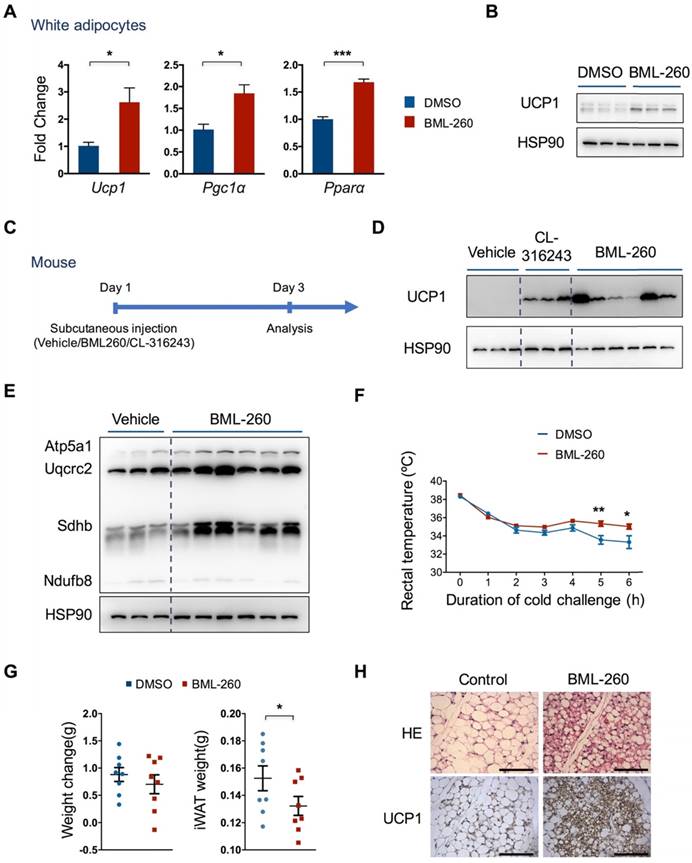
We next examined whether BML-260 can also induce UCP1 expression in white adipocytes. Pre-adipocytes were isolated from mouse subcutaneous white adipose tissue and differentiated into white adipocytes. We found that BML-260 treatment also induced a significant increase, albeit not as strong as in brown adipocytes, in UCP1 expression level (Figure 3A, B). BML-260 treatment also stimulated expression of two other brown thermogenic genes, Pgc1α and Pparα, indicating the induction of a browning process in white adipocytes (Figure 3A).
BML-260 induces UCP1 expression in white adipocytes and enhances thermogenesis in vivo. (A) mRNA expression analysis of indicated genes in white adipocytes treated with DMSO or BML-260 for 5 days after 7 days' differentiation. (B) UCP1 protein expression analysis of white adipocytes treated with DMSO or BML-260 for 5 days after 7 days' differentiation. (C) Schematic view of mouse experiments. (D) UCP1 protein expression analysis of subcutaneous white adipose tissue after compound treatment as indicated. (E) OXPHOS protein expression of subcutaneous white adipose tissue after compound treatment as indicated. (F) Cold challenge experiment with vehicle or BML-260-treated mice. N = 8. (G) Changes in body weight and iWAT weight. iWAT, inguinal WAT. N = 8. (H) Representative images of HE staining and UCP1 staining of subcutaneous white adipose tissue after compound treatment as indicated. Scale bar = 200 μm. Data are represented as means with SEM. * P<0.05, ** P<0.01, *** P<0.001. OXPHOS, oxidative phosphorylation.
BML-260 activates UCP1 and increases thermogenesis in vivo
We next further assessed the effect of BML-260 in vivo. We initially tried intraperitoneal injection of BML-260 into mice. However, due to low solubility of BML-260 in water as well as in specific solvent (DMSO + PBS + 5% Tween 80) we used, we found significant precipitation of BML-260 in the abdominal cavity. We therefore examined the effect of BML-260 by direct in situ injection into the subcutaneous white adipose depot. We also injected CL-316243 (CL) as a positive control. Three days after a single injection, mice were dissected and subcutaneous adipose tissues were obtained for UCP1 expression analysis (Figure 3C). Similar to CL treatment, we noticed that BML-260 treatment resulted in a very significant increase of UCP1 expression (Figure 3D). The effect of UCP1 upregulation after BML-260 treatment seemed quite variable between individual mouse, which was possibly due to the randomness in obtaining tissue chunks for western analysis, as in situ injection may result in locus-dependent variation in drug concentration. And compared to CL that can be easily dissolved in PBS, the solubility as well as the diffusion ability of BML-260 in the solvent is low, which may amplify the locus-dependent effect as a result of in situ injection. Nonetheless, in consistency with increased UCP1 expression, levels of the OXPHOS proteins also displayed a significant increase in BML-260-treated WAT (Figure 3E). Moreover, BML-260-treated mice displayed higher rectal temperature in the cold challenge experiment (Figure 3F); in the meantime, weight of WAT decreased significantly after one single shot of BML-260 (Figure 3G). Further staining of WAT section also displayed a clear browning phenomenon after BML-260 treatment, as indicated by smaller lipid droplets and substantially enhanced UCP1 expression (Figure 3H).
The effect of BML-260 is JSP-1 independent
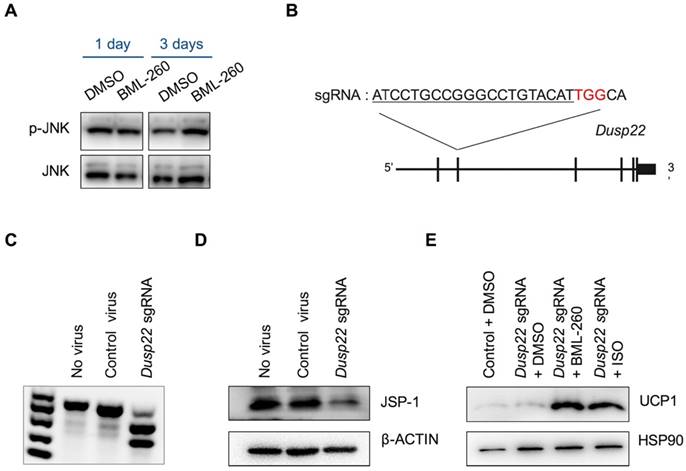
BML-260 is a rhodanine derivative, originally designed to inhibit JSP-1 activity. JSP-1 is a dual-specific phosphatase encoded by DUSP22 (dual specificity phosphatase 22), which is also known as JKAP (JNK pathway-associated phosphatase) [23]. JSP-1 is a JNK activator, and a proposed target for the treatment of inflammatory and proliferative disorders associated with dysfunctional JNK signaling. We next wanted to examine whether the effect of BML-260 was mediated by JSP-1 inhibition. JSP-1 inhibition was supposed to inactivate JNK signaling pathway. However, we did not observe significant change in JNK phosphorylation after BML-260 treatment (Figure 4A). To directly assess whether JSP-1 is involved in UCP1 upregulation, we next knocked out Dusp22 using CRISPR-Cas technology in adipocytes. We screened an sgRNA targeting the 2nd exon of the mouse Dusp22 gene (Figure 4B), which showed high editing activity (Figure 4C). When we delivered CRISPR targeting Dusp22 in pre-adipocytes, expression of JSP-1 protein was significantly attenuated, demonstrating successful targeting of Dusp22 in majority of the cells (Figure 4D). However, we did not observe significant increase of UCP1 expression in Dusp22 knockout adipocytes; and meanwhile, Dusp22 knocking-out did not abrogate the effect of BML-260 as well as ISO in upregulating UCP1 expression (Figure 4E). Taken together, these results demonstrated that, although BML-260 was supposed to be a potent inhibitor of JSP-1, it stimulated the expression of UCP1 in adipocytes in a JSP-1 independent manner.
The effect of BML-260 is JSP-1 independent. (A) Western blot analysis of indicated proteins in DMSO or BML-260-treated brown adipocytes. (B) Schematic view of CRISPR targeting to Dusp22. Red: PAM sequence. (C) Genome editing activity of identified sgRNA targeting Dusp22. (D) JSP-1 protein expression analysis of adipocytes treated with control or CRISPR-Dusp22 sgRNA viruses. (E) UCP1 protein expression analysis of adipocytes treated with CRISPRs and compounds as indicated.
BML-260 upregulates thermogenic genes
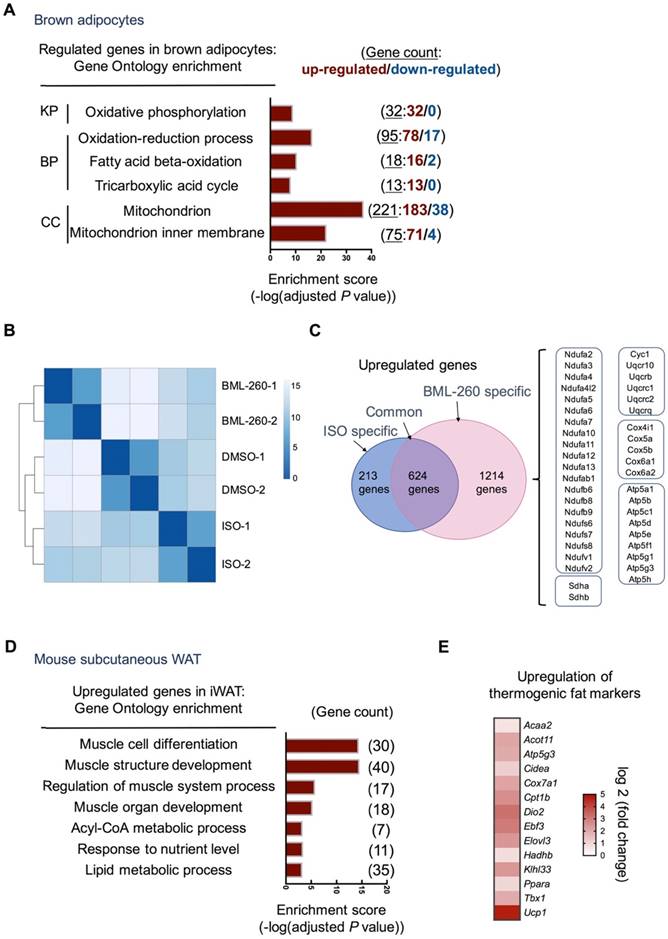
To delineate the effect of BML-260 in adipocytes and adipose tissue, RNAseq analysis was further performed. Consistent with increased mitochondrial activity, BML-260 treatment led to very significant upregulation of genes involved in oxidative phosphorylation, fatty acid beta-oxidation, and mitochondrial function (Figure 5A, Figure S3A). When compared to cells treated with ISO, although both showed significant upregulation of UCP1, BML-260-treated cells showed a rather distinct gene profile when compared to ISO-treated cells (Figure 5B). Specifically, among the upregulated genes upon treatment, 624 genes were common genes regulated by both BML-260 and ISO, which were mostly grouped to primary metabolic process, catabolic process, and others (Figure S3B). There were 1214 genes that were specifically upregulated in BML-260-treated cells, among which genes coding for mitochondrial complexes I-V of the electron transport chain were very consistently enriched (Figure 5C). This indicates that BML-260 can significantly stimulate the transcription of the group of genes involved in mitochondrial electron transport chain reaction, which was not observed in ISO-treated cells. Whereas in mouse subcutaneous white adipose tissues treated with BML-260, gene signatures of muscle cell differentiation, muscle structure development, regulation of muscle system process were among the most enriched GO terms (Figure 5D). This is in correspondence with the discovery that smooth muscle-like signature is enriched in UCP1+ cells from both inguinal and subcutaneous white adipose depots versus BAT [24]. Besides, there was also significant upregulation of genes involved in thermogenesis (Figure 5E). Consistent with the in vivo functional analyses, these results altogether suggest a “browning” phenomenon of white adipose tissue upon BML-260 treatment. However, despite the fact that many muscle signature genes were upregulated in BML-260-treated WAT, we did not observe clear upregulation of these genes in in vitro differentiated white adipocytes after BML-260 treatment (Figure S3C). In the meantime, we also recognized a much stronger effect of BML-260 to white adipose tissues in vivo (Figure 3D, 5E), when compared to the effect to white adipocytes in vitro (Figure 3A, B), in upregulating UCP1 expression. For example, at the Ucp1 mRNA levels, one-shot local injection of BML-260 to the white adipose tissues in vivo led to 26-fold increase in the mRNA level (Figure 5E); whereas BML-260 treated-white adipocytes in vitro had a moderate 2.5-fold change in mRNA expression (Figure 3A). The detailed mechanism needs further investigation. Nevertheless, the varied effects between in vivo and in vitro systems indicate a context-dependent effect of BML-260, which may involve functional regulation of multiple cell types and the tissue microenvironment, which are lacking in the in vitro adipocyte culture system.
BML-260 upregulates thermogenic and muscle program genes. (A) Gene Ontology and pathway analysis of regulated genes in brown adipocytes after BML-260 treatment identified by RNA-seq. (KP, KEGG Pathway; BP, Biological Process; CC, Cellular Component). (B) Clustering analysis of samples from DMSO, BML-260 and ISO-treated brown adipocytes. (C) Venn analysis of upregulated genes from BML-260 and ISO-treated brown adipocytes. Genes listed in the right boxes are genes specifically upregulated upon BML-260 treatment in brown adipocytes. (D) Gene Ontology analysis of upregulated genes in subcutaneous white adipose after BML-260 treatment identified by RNA-seq. (E) Heatmap depicting of upregulated thermogenic fat markers in subcutaneous white adipose after BML-260 treatment.
The effect of BML-260 is partly through activated CREB, STAT3 and PPAR signaling pathways
The above results have demonstrated that the effect of BML-260 is JSP-1 independent, suggesting that BML-260 has another unknown target(s) besides JSP-1. We next checked several signaling pathways that are previously reported to regulate UCP1 expression, including STAT3, PKA, p38 and CREB. We observed clear increase of p-CREB and p-STAT3 signals in both BML-260 treated adipocytes and adipose tissues (Figure 6A, B). Surprisingly, while the phosphorylation signals of PKA, p38 and ATF2 showed significant increase in BML-260-treated white adipose tissues (Figure 6D), we did not observe the same change in brown adipocytes (Figure 6C). Further tests with in vitro cultured white adipocytes showed that after BML-260 treatment, there was also a moderate increase in phosphorylation PKA signals in cells (Figure S4B), consistent with increased OXPHOS proteins (Figure S4A). These results indicate that although BML-260 treatment led to UCP1 upregulation in both brown and white adipocytes, the targeting signaling pathways might be different and cell-type dependent. Altogether, these results indicate that through direct or indirect targeting, BML-260 can activate STAT3 and CREB signaling pathways, which contribute, at least partly, to the UCP1 upregulation in both brown and white adipocytes.
The effect of BML-260 is partly through activated CREB, STAT3 and PPAR signaling pathways. (A, C) Western blot analysis of indicated proteins in DMSO or BML-260-treated brown adipocytes. (B, D) Western blot analysis of indicated proteins in vehicle, CL, or BML-260-treated subcutaneous white adipose tissue. (E) The schematic overview of CMAP analysis. (F) Representative images of GFP intensity of cells upon different treatments as indicated. Scale bar = 250 μm. (G) UCP1 protein expression analysis in brown adipocytes upon different treatments as indicated.
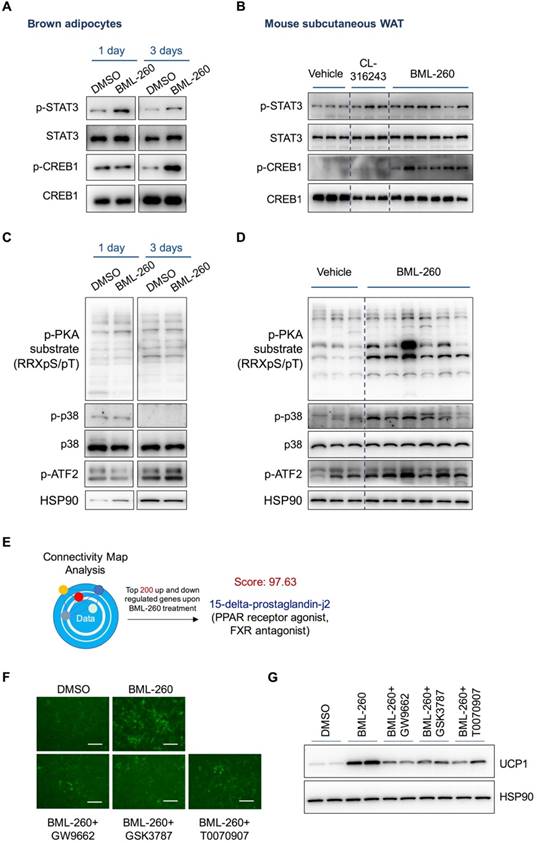
In a different way to study the possible working mechanism by BML-260, we also subjected the RNA expression profile of BML-260-treated cells to the Connectivity Map (CMAP) analysis [25]. CMAP is a database with a collection of gene expression profiles that are obtained from cultured human cells treated with various small molecules. Transcriptional expression data of interest can be compared against CMAP database using pattern-matching algorithms, in order to identify small molecules that upon treatment show high similarity in gene expression pattern with submitted data of interest [25]. These identified small molecules sometimes can offer important clues that may assist in mechanistic study or even therapeutic efforts [26]. We therefore applied CMAP analysis to identify possible targets of BML-260. The analysis results showed that the mRNA profile of BML-260-treated cells were in high degree of resemblance with cells treated with 15-delta-prostaglandin-j2 (score:97.63), which is a PPAR receptor agonist as well as a FXR antagonist (Figure 6E). As PPAR is also a key regulator of UCP1 expression, we next tested whether PPAR signaling pathway is involved in BML-260 function. We co-treated the cells with BML-260 and several PPAR inhibitors, including GSK3787 (PPARδ inhibitor), GW9662 (PPAR γ and PPARα inhibitor) and T0070907 (PPAR γ inhibitor). We observed alleviated UCP1 upregulation when cells were co-treated with BML-260 and the above PPAR inhibitors (Figure 6 F, G). These results indicate that the possible targets of BML-260 can be complicated and involve STAT3, CREB, PPAR and probably also other signaling pathways.
Lastly, rhodanine compound is known to be susceptible to pH values and can undergo hydrolysis to thioenolate. Thus, it is possible that the hydrolyzed thioenolate product mediates the biological functions of rhodanines [27]. To understand the stability of BML-260 under different pH values, especially in physiological conditions, we performed High Performance Liquid Chromatography (HPLC) analysis to assess the structure changes of BML-260 in different buffers. The BML-260 standard displayed a unique peak at 377 nm absorbance with a retention time around 8.5 min (Figure S5A). BML-260 was then dissolved in different buffers and either used immediately for HPLC analysis (Figure S5B) or incubated overnight before HPLC analysis (Figure S5C). When dissolved BML-260 was immediately tested for structure change, two or three small peaks besides the standard peak with a retention time around 1.8 min, 7 min, 19.5 min, respectively, appeared in all buffers with pH values ranging from 3 to 9 (Figure S5B). However, analyses using samples after overnight incubation showed that there was no further significant structure change in neutral and acidic buffers (pH = 3~7.4), and the intensity of these extra peaks did not seem to be related to pH values, questioning whether these peaks represent the hydrolyzed product(s). Instead, BML-260 incubated overnight in the alkaline buffers (pH = 8~9) displayed a dramatic change in the peak profile with entire loss of the standard peak (Figure S5C), suggesting overall structure changes after overnight incubation due to possible hydrolysis reaction. Based on the results, we suspect that BML-260 is relatively stable at the pH values within a normal physiological condition (pH = 3~7.4), but is susceptible to hydrolysis in alkaline conditions.
Discussion
The discovery of thermogenic brown adipose tissue in adult human [28-32], together with the increasing understanding of the “browning” phenomenon of white adipose tissue [33-35], enthuses the idea to identify gene targets or more importantly, proper treatments to increase or activate UCP1+ cells to treat obesity. In order to identify possible compounds to regulate UCP1 expression in an unbiased manner, ideally with no restriction from the existing knowledge system, we have previously established a cellular platform that allows easy-screening for UCP1 activators [21]. In this study, with an initial goal to identify possible phosphatases that may involve in regulating UCP1 expression, we screened a small compound library composed of dozens of phosphatase inhibitors. We successfully identified a rhodanine derivative BML-260, which was supposed to be a potent inhibitor to JSP-1, which could significantly increase UCP1 expression and activate thermogenic genes in both brown and white adipocytes. Further mechanistic study revealed that the effect of BML-260 in UCP1 regulation was JSP-1 independent; whereas BML-260 treatment could activate several signaling pathways, including STAT3, CREB and PPAR, which altogether contributed to the upregulation of UCP1 and thermogenic program in adipocytes (Figure S4B).
BML-260 belongs to the rhodanine derivative family, and is originally synthesized to inhibit JSP-1 as a potential treatment to inflammatory and proliferative disorders [22]. Rhodanine is a 5-membered heterocyclic organic compound possessing a thiazolidine core. The molecules based on the rhodanine core are known for their rich pharmacological profile [36-38], as well as the nature that can easily undergo different chemical optimizations. Rhodanine derivatives are therefore widely used in drugs discovery processes. Different rhodanine compounds have been demonstrated to have numerous pharmacological activities, including anti-diabetic, anti-cancer, anti-bacterial, anti-fungal, anti-viral and anti-inflammatory [39]. Furthermore, rhodanines are classified as non-mutagenic and considered to have overall low mammalian toxicity, although toxicity of rhodanine derivatives depends on the structure of each compound [40]. Among different rhodanine derivatives, Epalrestat (ONO Pharmaceuticals, 1982) has been approved by FDA for the treatment of diabetic complications as aldose reductase inhibitor. However, no rhodanine derivatives have so far been proposed to treat obesity, especially through targeting UCP1 to increase thermogenesis. Our study, for the first time, have identified BML-260 as a rhodanine derivative that can significantly activate UCP1 expression, enhance mitochondrial activity and increase thermogenesis, and therefore can potentially serve as a lead compound with anti-obese activity.
Most rhodanine derivatives presented as frequent hitters with compromised specificity [41-44]. It is very likely that BML-260 functions through multiple direct targets. However, having multiple targets does not equivalent with being non-specific. In the case of BML-260 in our study, BML-260 seemed to function in a cell-type or cell-context specific manner: 1) although BML-260 was previously demonstrated to be a JSP-1 inhibitor, we did not observe significant change of JNK signaling pathway in adipocytes upon treatment with BML-260; 2) the signaling pathways involved in brown and white adipocytes after BML-260 treatment were different. BML-260 treatment to white adipose tissues showed a clear activation of the PKA / p38 / CREB / ATF2 signaling cascade; whereas BML-260 treatment to brown adipocytes only caused an activation of p-CREB with no clear changes in PKA, p38 or ATF2; 3) BML-260 triggered different transcriptional events in brown and white adipocytes. Although both brown and white adipocytes displayed increased UCP1 mRNA expression, BML-260 treatment specifically led to upregulation of a group of genes coding for mitochondrial complexes I-V in the electron transport chain in brown adipocytes, whereas genes with clear muscle signatures were specially upregulated in white adipose tissues. It would be interesting to further identify the direct targets of BML-260 in each cell type and look into the detailed mechanism that mediates the cell-type dependent effects. The general multi-target properties of rhodanines are sometimes considered to be problematic. However, this wide variety of biological activities exhibited by the rhodanine derivatives may be an advantage, not a drawback. One of the efficient modern directions in the search for novel drugs is multi-ligand approach, which presents a pharmacologically efficient and profitable approach in terms of the risks and costs involved; and moreover, carries lower risk of drug-drug interactions compared to drug cocktails or multicomponent drugs [45]. And it is possible that because BML-260 has multiple targets, its effect in upregulating UCP1 and thermogenic gene expression in adipocytes is prominent. In the in vitro experiment, BML-260 treatment can remarkably activate the expression of a great many mitochondrial genes; whereas in the in vivo experiment, a single local injection can result in remarkable upregulation of UCP1 and thermogenic gene expression in subcutaneous adipose tissue and significant decrease in adipose weight, highlighting a potent compound to treat obesity. However, the long-term toxicity of BML-260 needs to be assessed in the furture; and optimization of the chemical structure, such as through judicious choice of substituents on the rhodanine cycle, may be applied to reduce potential toxicity and increase solubility in proper solvent.
Our discovery that BML-260 can also target other signaling pathways besides JSP-1 also needs to be taken into account when the compound is applied in basic research and tested in treating certain diseases, such as cancer. In fact, in cancer patients, weight reduction is a severe side effect as cachexia can be life-threatening. Nevertheless, as rhodanines present attractive, easy to synthesize reagents and building blocks for the construction of functionalized rhodanine derivative, our discovery that BML-260 can significantly activate UCP1 expression and enhance thermogenesis, opened up the possibility that rhodanine derivatives can be applied to combat obesity and offered BML-260 as a starting reagent.
Methods
Materials
The Phosphotase Inhibitor Library was obtained from the National Compound Resource Center (NCRC, Shanghai). Other reagents were obtained as indicated: BML-260 (Life Chemicals, F0207-0150), ISO (Sigma, I6379), CL316243 disodium salt (Tocris, 1499), GW9662 (Selleck, S2915), T0070907(Selleck, S2871), GSK3787(Selleck, S8025), insulin (Sigma, I3536), T3 (Sigma, T2877), indomethacin (Sigma, I7378), dexamethasone (Sigma, D4902), isobutylmethylxanthine (Sigma, I5879), and rosiglitazone (Santa Cruz, sc202795).
Adipocyte culture and differentiation
Brown pre-adipocytes and white pre-adipocytes were all maintained at 37°C in 5% CO2 in primary culture medium (high-glucose Dulbecco's modified Eagle's medium (DMEM) with 20% fetal bovine serum (FBS) and 1% penicillin/streptomycin). When brown pre-adipocytes reached confluent (designated as day 0), differentiation was initiated with induction media (high-glucose DMEM supplemented with 10% FBS, 1% penicillin/streptomycin, 1 μg/mL insulin, 1 nmol/L T3, 0.125 mmol/L indomethacin, 1 μmol/L dexamethasone, 0.5 mmol/L isobutylmethylxanthine and 1 μmol/L rosiglitazone). After 3 days' induction, the medium was changed into maintenance medium (high-glucose DMEM supplemented with 10% FBS, 1% penicillin/streptomycin, 1 μg/mL insulin, 1 nmol/L T3). Maintenance medium was changed daily. For the culture and differentiation of white pre-adipocytes, the procedure was similar as the one used for brown pre-adipocytes, except that the concentration of insulin was changed to 5 μg/mL in the induction and maintenance medium.
Chemical screening
Brown pre-adipocytes were plated in 96-well plates and subjected to differentiation and chemical screening. Cells were treated with individual compound at 10 µM starting at day 3 during the differentiation process and the result was assessed by eye-checking of the GFP intensity at day 10. Cells treated with DMSO and ISO were regarded as negative and positive controls, respectively.
RNA isolation and real-time quantitative PCR
Total RNA was extracted from brown adipocytes, white adipocytes or subcutaneous adipose tissues using Trizol reagent (ThermoFisher, 15596018) according to the manufacturer's instructions. Reverse transcription of isolated RNA from cells was performed using the reverse transcription kit (Takara, RR047A). Quantitative real-time PCR was carried out on the 7900 System (ABI) using SYBR Green supermix (ABI, 4472908). The sequences of primers were designed as previously described [21]. Relative mRNA expression was determined by the ΔΔCT method using Actin as internal control.
RNA-seq analysis
RNA-seq analysis was performed following standard procedures. Sequencing of total RNA from brown adipocytes treated with BML-260, DMSO or ISO was performed in Omics Core of Bio-Med Big Data Center (SIBS, CAS, Shanghai). And sequencing of total RNA from white adipose tissue treated with BML-260 or solvent control was performed in Majorbio Company (Shanghai). For data analysis, differentially expressed genes were then identified by using FDR 0.05 as cutoff. GO term annotations were performed with online software (http://geneontology.org/).
Western analysis
Protein from cells or tissues was extracted by the RIPA buffer (Millipore, 20188) and subjected to regular western procedure. The primary antibodies used in the experiments were antibodies to UCP1 (Abcam, ab10983), β-Actin (Abclonal, AC004), HSP90 (Cell Signaling Technology, 4874S), DUSP22 (Abcam, ab70124), p-STAT3 (Tyr 705) (Santa Cruz , sc8059), STAT3 (Cell Signaling Technology, 9139S), p-p38 (ABclonal, AP0526), p38 (ABclonal, A10382), p-ERK1/2 (Cell Signaling Technology, 9106S), ERK1/2 (ABclonal, A11116), p-ATF2 (Cell Signaling Technology, 9221), ATF2 (ABclonal, A2155), p-CREB1-S133 (ABclonal, AP0019),CREB1 (ABclonal, A1189), phosphor-PKA substrate (RRXS*/T*) (Cell Signaling Technology, 2912) and OXPHOS cocktail (Abcam, ab110413).
Mitochondrial activity analysis
MitoTracker Deep Red FM (Invitrogen, M22426) was used to stain active respiring mitochondria. Brown adipocytes subjected to different treatments were incubated with 25 nM MitoTracker Deep Red FM in the dark at 37 °C in 5% CO2 for 30 minutes. Cells were then digested by trypsin and washed in PBS. The samples were analyzed immediately by flow cytometry, and data were further processed by CytExpert (Beckman).
For oxygen consumption analysis, cells were plated in the XF24 V28 cell culture microplate (Seahorse Bioscience) and subjected to adipocyte differentiation for 7 days. Then cells were treated with BML-260 (10 μM) or DMSO as control for 3 days before measuring the oxygen consumption rate (OCR) using an XF24 Extracellular Flux Analyzer (Seahorse Bioscience). Oligomycin (2 μM), FCCP (1.5 μM) and Rotenone/Antimycin A (1 μM) from the Agilent Seahorse XF Cell Mito Stress Test kit (Agilent Technologies, 103015-100) were added during fixed time intervals to modulate respiration. The OCR values were normalized by total protein levels in each-well for calculation.
Mitochondrial DNA quantification
Genome DNA from brown adipocytes was extracted using a TIANamp Genomic DNA Kit (Tiangen, DP304-03). Quantitative PCR was used to amplify mitochondria DNA and nuclear DNA in the extract. The primers were designed as follows: 5'-DNAATGGAAAGCCTGCCATCATG-3' and 5'- TCCTTGTTGTTCAGCATCAC-3' for nuclear DNA (nuDNA); 5'- CCTATCACCCTTGCCATCAT - 3' and 5'- GAGGCTGTTGCTTGTGTGAC - 3' for mitochondrial DNA (mitoDNA). And the mitoDNA/nuDNA ratio was calculated by the ΔΔCT method.
ATP production
The measurement of ATP in live brown adipocytes were performed using Luminescent ATP Detection Assay Kit (Abcam, ab113849) following the manufacture's procedures.
EM imaging
The brown adipocytes following different treatments were harvested in PBS and fixed in glutaraldehyde. All subsequent steps for sample preparation were performed in the core facility (INS, SIBS, CAS) according to standard protocols. The Electron microscopic observations were conducted through scanning electron microscope (PHILIPS CM120).
CRISPR targeting
The 20 bp sequence of sgRNA targeting Dusp22 (5'- ATCCTGCCGGGCCTGTACAT -3') for mouse Dusp22 was inserted to lentiCRISPR v2 plasmid and used for lentivirus packaging. Lentiviruses carrying CRISPR-Cas9 targeting Dusp22 or empty lentiCRISPR v2 vector as control viruses were packaged in HEK 239T cells. The brown pre-adipocytes were infected and selected with puromycin (1.5 μg/ml). Cells were next subjected to genomic DNA extraction for T7EI analysis (NEB, E3321) or to protein extraction for western blot to determine gene editing efficiency. Primers used in T7EI analysis for Dusp22 were as follows: 5'- ATGGTGCTCTCTCCCAATGC-3' and 5'- GTCCACTTGAGCATGCAGGA -3'.
CMAP analysis
The RNAseq results obtained from BML-260 treated brown adipocytes vs. control cells were used as queries for Connectivity Map (the Broad Institute) after conversion into human homologs. The top 200 up-regulated genes (up-list) and the top 200 down-regulated genes (down-list) were compared against the CMAP database and enrichment scores and p-value was used to identify possible compounds that have similar gene signatures as BML-260 treatment.
HPLC analysis
To obtain buffer solutions with gradient pH values varying from 3 to 9, four different stock solutions were prepared first: stock solution A, 50 mmol/L citric acid; stock solution B, 50 mmol/L sodium citrate; stock solution C, 50 mmol/L sodium dihydrogen phosphate; and stock solution D, 50 mmol/L disodium hydrogen phosphate. Buffer solutions with different pH values were then prepared by mixing stock solutions accordingly: pH 3, 93 ml solution A + 7 ml solution B; pH 4, 65.5 ml solution A + 34.5 ml solution B; pH 5, 41 ml solution A + 59 ml solution B; pH 6, 87.7 ml solution C + 12.3 ml solution D; pH 7, 39 ml solution C + 61 ml solution D; pH 8, 5.3 ml solution C + 94.7 ml solution D. pH 9 buffer solution was made by 7 ml 0.1 mol/L HCl and 50 ml 0.1 mol/L Tris. pH values of all buffers were confirmed by a pH probe and adjusted slightly by phosphoric acid or sodium hydroxide as necessary.
For HPLC analysis, the 10 mM stock solution of BML-260 in DMSO was diluted in the above buffer solution (1 μl dilution in 500 μl buffer solution) varying from 3 to 9 pH values and PBS. They were treated 37℃ overnight or used immediately. To extract the BML-260 from the medium, 100 μl media sample was added to a micro-centrifuge tube, together with 100 μl CH3OH and 100 μl CHCl3. Samples were then vortexed for 30 s and centrifuged at 3000 rpm for 5 mins. At the end of centrifugation, the organic phase was dried and 100 ul mobile phase was added. The injection volume was 20 μl. The HPLC system was comprised of a Waters e2695 Separations Module, and a Waters 2998 Photodiode Array Detector. The column was a Phenomenex C18 column (150 mm × 2 mm, 3 μm particle size, and 100 Å pore size) used at ambient temperature. The samples were separated at a flow rate of 300 μl/min with gradient elution [46]. The mobile phase consisted of an aqueous phase (A) containing 50 mM HCOOH and 2 mM CH3COONH4, and an organic phase (B), which was composed of 95% acetonitrile, 5% water, 50 mM HCOOH and 2 mM CH3COONH4. Briefly, the gradient elution was performed as following: mobile phase started at 40% A and 60% B and changed in a linear manner to 20% A to 80% B in 6.5 min. Between 6.5 and 7.5 min, the mobile phase changed to 80% A and 85% B. The mobile phase was reverted to 5% A and 95% B by 8 min and was held constant until 11 min. By 11.5 min the mobile phase changed to 100% B and hold for 2.5 min. Then the mobile phase was changed to 40% A and 60% B by 14 min and held constant until 20 min. Peaks were monitored at wave length of 377 nm using the UV detector.
Animals
All animal procedures were performed according to guidelines by the Institutional Animal Care and Use Committee of the Shanghai Institutes for Biological Sciences. Six to seven weeks' old male C57BL/6J mice were purchased (Shanghai Laboratory Animal Co. Ltd, China), and randomly divided into two groups (n = 8 in each group). The mice were fed with normal chow diet and adapted to the environment until eight weeks' old for experiments.
In situ drug injection
Eight weeks' old male C57BL/6J mice were injected bilaterally with 2.5 mg/kg BML-260, 1 mg/kg CL316243 or solvent as control into the inguinal fat pads after general anesthesia. The stock concentration of BML-260 was 1 mg/ml dissolving in DMSO + PBS + 5% Tween 80. CL316243 was dissolved in PBS. Mice were sacrificed after metabolic analysis, and inguinal fat pads were dissected for further analysis.
Cold challenge experiment
Eight weeks' old male mice treated with BML-260 or solvent control were individually caged without beddings and exposed to 4℃ for 6 hours. Rectal temperatures were measured each hour (Physitemp Instruments).
Histology
Mice adipose tissues were fixed in 4% paraformaldehyde and embedded in paraffin following standard procedures for HE staining and immunohistochemistry. Tissue sections were subjected to hematoxylin and eosin staining or immunohistochemistry analysis for UCP1 (Abcam, ab10938) expression.
Statistics
All data were represented as means with SEM. The statistical differences in mean values were assessed by Student t test. Raw data were deposited in the NCBI Gene Expression Omnibus (GEO) datasets with the accession numbers GEO: GSE129771 and GSE129791.
Abbreviations
BAT, brown adipose tissue; BP, biological process; cAMP, 3',5'cyclic adenosine monophosphate; CC, cellular component; CMAP, connectivity map; CL, CL-316243; DMSO, dimethyl sulfoxide; DUSP22, dual specificity phosphatase 22; FGF21, fibroblast growth factor 21; HPLC, high performance liquid chromatography; ISO, isoproterenol; JAK, the janus kinase; iWAT, inguinal white adipose tissue; JKAP, JNK pathway-associated phosphatase; JSP-1, JNK stimulatory phosphatase-1; KP, keggpathway; NE, norepinephrine; OCR, oxygen consumption rate; OXPHOS, oxidative phosphorylation; PKA, protein kinase A; PP, protein phosphatase; PTP, protein tyrosine phosphatase; SIRT1, the silent information regulator type 1; STAT, signal transducer and activator of transcription; UCP-1, uncoupling protein 1; VEGF, vascular endothelial growth factor.
Supplementary Material
Supplementary figures and tables.
Acknowledgements
We thank Hua Feng (Omics Core of Bio-Med Big Data Center, CAS-MPG Partner Institute for Computational Biology, SIBS, CAS) for assistance in data analysis and Lin Qiu (Core facility, CAS Key Laboratory of Nutrition, Metabolism and Food Safety, SIBS, CAS) for assistance in FACS analysis.
Funding Sources
This work was supported by grants from the National Key R&D Program of China (2017YFA0102800, 2017YFA0103700), the Strategic Priority Research Program of the Chinese Academy of Sciences (XDA16030402), the National Natural Science Foundation of China (31670829, 81500614), the Key Research Program of the Chinese Academy of Sciences (ZDRW-ZS-2017-1, KFZD-SW-213), and the National Youth 1000 Talents Program (Q.D.).
Author contributions
Q.D. designed the research. Z.F. performed all experiments. N.L. performed HPLC analyses. Y.W., Y.Z., Y.Q., X.L., L.S., and H.Y. assisted with either experiments or data analysis. Z.F. and Q.D. wrote the manuscript. Q.D. supervised the project.
Competing Interests
The authors have declared that no competing interest exists.
References
1. Cannon B, Nedergaard J. Brown adipose tissue: function and physiological significance. Physiol Rev. 2004;84:277-359
2. Cousin B, Cinti S, Morroni M, Raimbault S, Ricquier D, Pe ́nicaud L. et al. Occurrence of brown adipocytes in rat white adipose tissue: molecular and morphological characterization. J Cell Sci. 1992;103:931-42
3. Ghorbani M, Himms-Hagen J. Appearance of brown adipocytes in white adipose tissue during CL 316,243-induced reversal of obesity and diabetes in Zucker fa/fa rats. Int J Obes Relat Metab Disord. 1997;21:465-75
4. Ghorbani M, Claus TH, Himms-Hagen J. Hypertrophy of brown adipocytes in brown and white adipose tissues and reversal of diet-induced obesity in rats treated with a beta3-adrenoceptor agonist. Biochem Pharmacol. 1997;54:121-31
5. Jimenez M, Barbatelli G, Allevi R, Cinti S, Seydoux J, Giacobino JP. et al. Beta 3-adrenoceptor knockout in C57BL/ 6J mice depresses the occurrence of brown adipocytes in white fat. Eur J Biochem. 2003;270:699-705
6. Hoffmann LS, Etzrodt J, Willkomm L, Sanyal A, Scheja L, Fischer AW. et al. Stimulation of soluble guanylyl cyclase protects against obesity by recruiting brown adipose tissue. Nat Commun. 2015;6:7235
7. Cao WH, Medvedev AV, Daniel KW, Collins S. beta-adrenergic activation of p38 MAP kinase in adipocytes - cAMP induction of the uncoupling protein 1 (UCP1) gene requires p38 MAP kinase. J Biol Chem. 2001;276:27077-82
8. Cao WH, Daniel KW, Robidoux J, Puigserver P, Medvedev AV, Bai X. et al. p38 mitogen-activated protein kinase is the central regulator of cyclic AMP-dependent transcription of the brown fat uncoupling protein 1 gene. Mol Cell Biol. 2004;24:3057-67
9. Robidoux J, Cao WH, Quan H, Daniel KW, Moukdar F, Bai X. et al. Selective activation of mitogen-activated protein (MAP) kinase kinase 3 and p38 alpha MAP kinase is essential for cyclic AMP-dependent UCP1 expression in adipocytes. Mol Cell Biol. 2005;25:5466-79
10. Derecka M, Gornicka A, Koralov SB, Szczepanek K, Morgan M, Raje V. et al. Tyk2 and Stat3 Regulate Brown Adipose Tissue Differentiation and Obesity. Cell Metab. 2012;16:814-24
11. Shi SY, Zhang W, Luk CT, Sivasubramaniyam T, Brunt JJ, Schroer SA. et al. JAK2 promotes brown adipose tissue function and is required for diet- and cold-induced thermogenesis in mice. Diabetologia. 2016;59:187-96
12. Garcia-Martin R, Alexaki VI, Qin N, Rubin de Celis MF, Economopoulou M, Ziogas A. et al. Adipocyte-specific HIF2alpha deficiency exacerbates obesity-induced brown adipose tissue dysfunction and metabolic dysregulayion. Mol Cell Biol. 2015;36:376-93
13. Boutant M, Joffraud M, Kulkarni SS, Garcia-Casarrubios E, Garcia-Roves PM, Ratajczak J. et al. SIRT1 enhances glucose tolerance by potentiating brown adipose tissue function. Mol Metab. 2015;4:118-31
14. Fisher FM, Kleiner S, Douris N, Fox EC, Mepani RJ, Verdeguer F. et al. FGF21 regulates PGC-1alpha and browning of white adipose tissues in adaptive thermogenesis. Genes Dev. 2012;26:271-81
15. Lu P, Zhang FC, Qian SW, Li X, Cui ZM, Dang YJ. et al. Artemisinin derivatives prevent obesity by inducing browning of WAT and enhancing BAT function. Cell Res. 2016;26:1169-72
16. Zhang Z, Zhang H, Li B, Meng X, Wang J, Zhang Y. et al. Berberine activates thermogenesis in white and brown adipose tissue. Nat Commun. 2014;5:5493
17. Lagouge M, Argmann C, Gerhart-Hines Z, Meziane H, Lerin C, Daussin F. et al. Resveratrol improves mitochondrial function and protects against metabolic disease by activating SIRT1 and PGC-1alpha. Cell. 2006;127:1109-22
18. Qiang L, Wang L, Kon N, Zhao W, Lee S, Zhang Y. et al. Brown remodeling of white adipose tissue by SirT1-dependent deacetylation of Ppargamma. Cell. 2012;150:620-32
19. Galmozzi A, Sonne SB, Altshuler-Keylin S, Hasegawa Y, Shinoda K, Luijten IHN. et al. ThermoMouse: an in vivo model to identify modulators of UCP1 expression in brown adipose tissue. Cell Rep. 2014;9:1584-93
20. Mao L, Nie B, Nie T, Hui X, Gao X, Lin X. et al. Visualization and Quantification of Browning Using a Ucp1-2A-Luciferase Knock-in Mouse Model. Diabetes. 2017;66:407-17
21. Qiu Y, Sun Y, Xu D, Yang Y, Liu X, Wei Y. et al. Screening of FDA-approved drugs identifies sutent as a modulator of UCP1 expression in brown adipose tissue. EBiOMedicine. 2018 pii: S2352-3964(18)30430-4
22. Cutshall NS. O'Day C, Prezhdo M. Rhodanine derivatives as inhibitors of JSP-1. Bioorg Med Chem Lett. 2005;15:3374-9
23. Shen Y, Luche R, Wei B, Gordon ML, Diltz CD, Tonks NK. Activation of the JNK signaling pathway by a dual-specificity phosphatase, JSP-1. Proc Natl Acad Sci U S A. 2001;98:13613-8
24. Long JZ, Svensson KJ, Tsai L, Zeng X, Roh HC, Kong X. et al. A smooth muscle-like origin for beige adipocytes. Cell Metab. 2014;19:810-20
25. Lamb J, Crawford ED, Peck D, Modell JW, Blat IC, Wrobel MJ. et al. The Connectivity Map: using gene-expression signatures to connect small molecules, genes, and disease. Science. 2006;313:1929-35
26. Liu J, Lee J, Salazar Hernandez MA, Mazitschek R, Ozcan U. Treatment of obesity with celastrol. Cell. 2015;161:999-1011
27. Brem J, van Berkel SS, Aik W, Rydzik AM, Avison MB, Pettinati I. et al. Rhodanine hydrolysis leads to potent thioenolate mediated metallo-β-lactmaseinhibiton. Nat Chem. 2014;6:1084-90
28. Cypess AM, Lehman S, Williams G, Tal I, Rodman D, Goldfine AB. et al. Identification and importance of brown adipose tissue in adult humans. N Engl J Med. 2009;360:1509-17
29. Saito M, Okamatsu-Ogura Y, Matsushita M, Watanabe K, Yoneshiro T, Nio-Kobayashi J. et al. High incidence of metabolically active brown adipose tissue in healthy adult humans: effects of cold exposure and adiposity. Diabetes. 2009;58:1526-31
30. van Marken Lichtenbelt WD, Vanhommerig JW, Smulders NM, Drossaerts JM, Kemerink GJ, Bouvy ND. et al. Cold-activated brown adipose tissue in healthy men. N Engl J Med. 2009;360:1500-8
31. Virtanen KA, Lidell ME, Orava J, Heglind M, Westergren R, Niemi T. et al. Functional brown adipose tissue in healthy adults. N Engl J Med. 2009;360:1518-25
32. Sidossis L, Kajimura S. Brown and beige fat in humans: thermogenic adipocytes that control energy and glucose homeostasis. J Clin Invest. 2015;125:478-86
33. Kajimura S, Spiegelman BM, Seale P. Brown and Beige Fat: Physiological Roles beyond Heat Generation. Cell Metab. 2015;22:546-59
34. Loft A, Forss I, Mandrup S. Genome-Wide Insights into the Development and Function of Thermogenic Adipocytes. Trends Endocrinol Metab. 2017;28:104-20
35. Nedergaard J, Cannon B. The browning of white adipose tissue: some burning issues. Cell Metab. 2014;20:396-407
36. Tomašić T, PeterlinMašič L. Rhodanine as a scaffold in drug discovery: a critical review of its biological activities and mechanisms of target modulation. Exp Op Drug Disc. 2012;7:549-60
37. Mendgen T, Steuer C, Klein CD. Privileged scaffolds or promiscuous binders: a comparative study on rhodanines and related hetero-cycles in medicinal chemistry. J Med Chem. 2012;55:743-53
38. Lesyk RB, Zimenkovsky BS, Kaminskyy DV, Kryshchyshyn AP, Havryluk DY, Atamanyuk DV. et al. Thiazolidinone motif in anticancer drug discovery. Experience of DHLNMU medicinal chemistry scientific group. Biopolym Cell. 2011;27:107-17
39. Kaminskyy D, Kryshchyshyn A, Lesyk R. Recent developments with rhodanine as a scaffold for drug discovery. Expert Opin Drug Discov. 2017;12:1233-52
40. Zeiger E, Anderson B, Haworth S, Lawlor T, Mortelmans K, Speck W. Salmonella mutagenicity tests: III. Results from the testing of 255 chemicals. Environm Mol Mutagen. 1987;9:61-109
41. Glaser J, Holzgrabe U. Focus on PAINS: false friends in the quest for selective anti-protozoal lead structures from Nature? Med Chem Comm. 2016;7:214-23
42. Baell JB. Observations on screening-based research and some concerning trends in the literature. Future Med Chem. 2010;2:1529-46
43. Baell JB, Holloway GA. New substructure filters for removal of pan assay interference compounds (PAINS) from screening libraries and for their exclusion in bioassays. J Med Chem. 2010;53:2719-40
44. Baell JB, Walters MA. Chemical con artists foil drug discovery. Nature. 2014;513:481-3
45. Morphy R, Rankovic Z. Designed multiple ligands. An emerging drug discovery paradigm. J Med Chem. 2005;48:6523-43
46. Thomas MC, Dunn SR, Altvater J, Dove SG, Nette GW. Rapid identification of long-chain polyunsaturated fatty acids in a marine extract by HPLC-MS using data-dependent acquisition. Anal Chem. 2012;84:5976-83
Author contact
![]() Corresponding author: Qiurong Ding (qrdingac.cn), 86-21-54920998
Corresponding author: Qiurong Ding (qrdingac.cn), 86-21-54920998