Impact Factor
- Issue 14; 2026
- Issue 13; 2026
- Issue 12; 2026
- Issue 11; 2026
- Issue 10; 2026
- Volume 16; 2026
- Advance Articles
- Past Issues
- Cover Images
- Cover Suggestion
- Index & Coverage
- Special Issues
Introduction
Methods
Results
Discussion
Abbreviations
Supplementary Material
Acknowledgements
References
International Journal of Biological Sciences
International Journal of Medical Sciences
 Global reach, higher impact

Theranostics 2019; 9(10):2868-2881. doi:10.7150/thno.28892 This issue Cite
Research Paper
Imaging fibrosis in inflammatory diseases: targeting the exposed extracellular matrix
Nicolas Beziere1 ![]() *, Kerstin Fuchs1*, Andreas Maurer1, Gerald Reischl1, Jürgen Brück2, Kamran Ghoreschi2, Birgit Fehrenbacher2, Daniel Carvajal Berrio3, Katja Schenke-Layland3,4,5, Ursula Kohlhofer6, Leticia Quintanilla-Martinez6, Meinrad Gawaz7, Manfred Kneilling1,2, Bernd Pichler1
*, Kerstin Fuchs1*, Andreas Maurer1, Gerald Reischl1, Jürgen Brück2, Kamran Ghoreschi2, Birgit Fehrenbacher2, Daniel Carvajal Berrio3, Katja Schenke-Layland3,4,5, Ursula Kohlhofer6, Leticia Quintanilla-Martinez6, Meinrad Gawaz7, Manfred Kneilling1,2, Bernd Pichler1
1. Werner Siemens Imaging Center, Department of Preclinical Imaging and Radiopharmacy, Eberhard Karls University Tübingen, 72076 Tübingen, Germany
2. Department of Dermatology, University Medical Center, Eberhard Karls University Tübingen, 72076 Tübingen, Germany
3. Department of Women's Health, Research Institute for Women's Health, Eberhard Karls University Tübingen, 72074 Tübingen, Germany
4. The Natural and Medical Sciences Institute (NMI) at the University of Tübingen, Markwiesenstr. 55, 72770 Reutlingen, Germany
5. Department of Medicine/ Cardiology, Cardiovascular Research Laboratories, David Geffen School of Medicine at UCLA, 675 Charles E. Young Drive South, MRL 3645, Los Angeles, CA, USA
6. Institute of Pathology, University Hospital Tübingen, Eberhard Karls University Tübingen, 72076 Tübingen, Germany.
7. Department of Cardiology and Cardiovascular Medicine, University Hospital Tübingen, University of Tübingen, 72076 Tübingen, Germany.
* These authors contributed equally to this work.
Received 2018-7-31; Accepted 2018-12-10; Published 2019-4-13
Abstract

In a variety of diseases, from benign to life-threatening ones, inflammation plays a major role. Monitoring the intensity and extent of a multifaceted inflammatory process has become a cornerstone in diagnostics and therapy monitoring. However, the current tools lack the ability to provide insight into one of its most crucial aspects, namely, the alteration of the extracellular matrix (ECM). Using a radiolabeled platelet glycoprotein VI-based ECM-targeting fusion protein (GPVI-Fc), we investigated how binding of GPVI-Fc on fibrous tissue could uncover the progression of several inflammatory disease models at different stages (rheumatoid arthritis, cutaneous delayed-type hypersensitivity, lung inflammation and experimental autoimmune encephalomyelitis).
Methods: The fusion protein GPVI-Fc was covalently linked to 1,4,7-triazacyclononane-1,4,7-triacetic acid (NOTA) and subsequently labeled with 64Cu. We analyzed noninvasively in vivo 64Cu-GPVI-Fc accumulation in murine cutaneous delayed-type hypersensitivity, anti-glucose-6-phosphate isomerase serum-induced rheumatoid arthritis, lipopolysaccharide-induced lung inflammation and an experimental autoimmune encephalomyelitis model. Static and dynamic Positron Emission Tomography (PET) of the radiotracer distribution was performed in vivo, with ex vivo autoradiography confirmation, yielding quantitative accumulation and a distribution map of 64Cu-GPVI-Fc. Ex vivo tissue histological staining was performed on harvested samples to highlight the fusion protein binding to collagen I, II and III, fibronectin and fibrinogen as well as the morphology of excised tissue.
Results: 64Cu-GPVI-Fc showed a several-fold increased uptake in inflamed tissue compared to control tissue, particularly in the RA model, with a peak 24 h after radiotracer injection of up to half the injected dose. Blocking and isotype control experiments indicated a target-driven accumulation of the radiotracer in the case of chronic inflammation. Histological analysis confirmed a prolonged accumulation at the inflammation site, with a pronounced colocalization with the different components of the ECM (collagen III and fibronectin notably). Binding of the fusion protein appeared to be specific to the ECM but unspecific to particular components.
Conclusion: Imaging of 64Cu-GPVI-Fc accumulation in the ECM matrix appears to be a promising candidate for monitoring chronic inflammation. By binding to exposed fibrous tissue (collagen, fibronectin, etc.) after extravasation, a new insight is provided into the fibrotic events resulting from a prolonged inflammatory state.
Keywords: fibrosis, positron emission tomography, glycoprotein VI
Introduction
The inflammatory process is the initial host response to an aggression from various stimuli and plays a crucial role in removing the cause of the aggression and repairing tissues. Inflammatory diseases typically present at different stages: 1) An acute phase, during which the first responder cells are quickly recruited to face the immediate threat, which is usually characterized by increased permeation, recruitment of neutrophils and increased blood flow; and 2) a long-lasting phase, possibly evolving into chronic inflammation, with a shift in the balance of the recruited cells, particularly activated fibroblasts responsible for the generation of fibrous tissue. The resulting extensive fibrosis and an associated loss of function of the affected tissue stems from the overwhelming deposition of connective tissue, disrupting the integrity and balance of the extracellular matrix (ECM) [1]. Evidence shows that several major pathologies, such as Rheumatoid Arthritis (RA) [2], end-stage liver diseases [3], idiopathic pulmonary fibrosis [4], Crohn's disease [5] and cancer [6], have chronic inflammation as either a driving force or as a major component of the worsening of the associated symptoms and will show signs of ECM alteration during their different stages.
Imaging the different components of connective tissue, such as collagen, fibrinogen or notably fibronectin, has been routinely performed ex vivo using different histological techniques, from eosin and fluorescent microscopy, and more recently in vivo on tissue surfaces using second harmonic imaging microscopy to highlight collagen distribution [7]. However, noninvasive in vivo imaging, particularly as a clinical modality, remains a challenge, as optical-based techniques that are used ex vivo do not have the necessary penetration depths and most whole-body imaging technologies are blind to fibrous tissues. Magnetic Resonance Imaging (MRI) has provided interesting results in the last decade by using contrast agent-based collagen targeted gadolinium (Gd) techniques [8, 9], relying on a comparison of pre- and post-injection images. Magnetic Resonance Elastography has also proven to be an interesting method for looking into connective tissue-induced changes in the mechanical properties of tissue, but does not provide any molecular information [10]. Positron Emission Tomography (PET), the molecular imaging technique of choice in clinics due to its superb detection sensitivity, has shown promise in imaging fibrotic events [11], notably through the use of targeted radiotracers (chemical compounds with radioactive isotopes that can be monitored in nuclear medicine imaging) for specific ECM components such as collagen subtypes [12, 13] or fibronectin [14]. For the interested reader, comprehensive reviews have recently been published on the topic [15, 16]. However, to the best of our knowledge no current technique allows for a global overview of fibrotic events, from the disruption of the vessel walls inducing an exposure of the ECM to actual building of new fibrous tissue.
To overcome these limitations, we investigated how a fusion protein based on the soluble human IgG1 Fc domain and the extracellular part of platelet glycoprotein VI (GPVI), GPVI-Fc, a type I trans-membrane glycoprotein expressed on platelets and responsible for the recognition of and adhesion to the ECM, could be used as a targeting moiety for PET assessment of fibrosis during inflammation (Figure 1A-B).
Glycoprotein-VI (GPVI), fusion protein of GPVI with Immunoglobulin 1 Fc domain (GPVI-Fc) and [64Cu]Cu-NOTA-GPVI-Fc (64Cu-GPVI-Fc). (A) The GPVI is expressed by platelets and displays a high collagen affinity. (B) GPVI-Fc binds to extracellular matrix fibers and prevents platelet aggregation. 64Cu-GPVI-Fc is obtained by conjugation of GPVI-Fc to the chelator p-SCN-Bn-NOTA and complexation using a 64CuCl2 solution. GPIb: glycoprotein Ib; GPVI: glycoprotein-VI; IgG: immunoglobulin; vWF: von Willebrand factor.
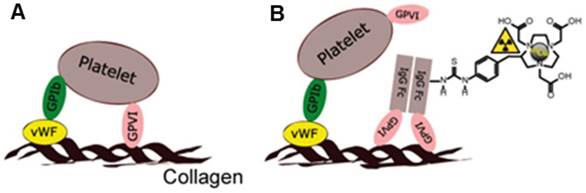
While initially developed for use in atherosclerotic patients as an antithrombotic agent devoid of influence on general hemostasis in humans [17], GPVI-Fc was shown to have a high affinity to multiple components of the ECM, such as collagen [18], fibronectin[19] and notably fibrinogen/fibrin [20], with KD values of around 2 µg/mL [19]. We, thus, developed an efficient 64Cu labeling method to initially yield [64Cu]Cu-NOTA-GPVI-Fc (64Cu-GPVI-Fc, Figure 1B) for atherosclerosis [21], and show herein its potential as a fibrosis-driven PET imaging agent in selected inflammatory disease models: a trinitrochlorobenzene (TNCB)-induced cutaneous delayed-type hypersensitivity (DTHR), giving access to both acute and chronic inflammation states [22]; anti-glucose-6-phosphate isomerase (GPI)-serum induced rheumatoid arthritis (RA), a chronic inflammation model presenting extensive permeation of the synovia with a progressive appearance of a fibrous cap; lipopolysaccharide (LPS)-induced subchronic lung inflammation, devoid of fibrosis; and experimental autoimmune encephalomyelitis (EAE), a progressive spinal cord and brain inflammation model presenting light fibrosis around capillary vessels. All of these models are imaged multimodally and noninvasively in vivo. Ex vivo histological validation revealed colocalization of the targeted contrast agent with several proteins of the ECM and a selective accumulation at the inflammation sites correlating with a physiological examination, pointing at a potential novel solution for imaging chronic inflammation clinically.
Methods
Labeling of the molecular imaging biomarker
Chelator conjugation: GPVI-Fc (Revacept®) was provided by advanceCOR GmbH (Martinsried, Germany). All reagents for the conjugation process were from standard commercial suppliers, and the lowest metal content available quality was purchased. All buffers were treated with 1.2 g/L of Chelex 100 (sodium form, Sigma-Aldrich, Taufkirchen, Germany) to avoid metal contaminations. GPVI-Fc was chelator-conjugated using p-SCN-Bn-NOTA (2-S-(4-isothiocyanatobenzyl)-1,4,7-triazacyclononane-1,4,7-triacetic acid (Macrocyclics)) following the procedure in the literature[23]. Briefly, 2.5 mg/mL Revacept® dissolved in a PBS solution containing 4% mannitol and 1% saccharose was pretreated with 0.1 M ammonium acetate containing 50 mM EDTA (pH 6, 5 µL per mg of protein) to remove metal contaminations (30 min, r.t.). The buffer was exchanged by repeated ultrafiltration using 0.1 M HEPES (pH 8.5) and Amicon Ultra-15 centrifugal filter units with a molecular weight cut-off of 30 kDa (Merck KGaA, Darmstadt, Germany). The protein concentration was adjusted to 8 mg/mL. p-SCN-Bn-NOTA was dissolved in DMSO and added to the antibody at a 15x molar excess, followed by overnight incubation at 4 °C. Subsequently, the conjugated protein was purified from excess chelator and buffered with 0.1 M ammonium acetate with a pH of 6 via repeated Amicon Ultra-15 centrifugation. The protein concentration was determined to be 14.7 mg/mL in the final NOTA-GPVI solution. For further quality control the product was tested for chemical purity (size-exclusion HPLC), radiolabeling properties (see below) and endotoxins.
Radiolabeling: 64Cu was produced using a PETtrace cyclotron (16 MeV; GE Medical Systems, Munich, Germany) by proton irradiation of 64Ni on a platinum/iridium plate (90/10) (approx. 30 mg, > 95% enrichment; Chemotrade Chemiehandelsgesellschaft mbH, Dusseldorf, Germany) and separated from metal impurities using ion-exchange chromatography (AG1x8, Bio-Rad Laboratories, Munich, Germany), according to a modified procedure [24]. For radiolabeling [23], NOTA-GPVI was incubated with 64CuCl2 at a ratio of 2 µg/MBq for 1 h at 42 °C. Then, 1 µL of 20% Ca-DTPA (injection solution for human use, Heyl, Chem.-pharm. Fabrik GmbH, Berlin, Germany) was added to the radiotracer solution for quenching and complexing unreacted 64Cu, followed by dilution with PBS and sterile filtration. Quality control samples were analyzed for appearance, identity, chemical and radiochemical purity (TLC, SE-HPLC), pH, radionuclidic purity (gamma-spectrometry), endotoxins, and sterility.
Mouse models and experiments
All animal experiments were performed in accordance with the local guidelines and with approval from the local authorities (German Animal Protection Law protocols for animal use and care, Regierungspräsidium Tübingen). Animals were purchased from Charles River Laboratory. Animal handling was performed under anesthesia using 1.5% isoflurane vaporized in 100% oxygen at 1.5 L/min. Animals were randomly assigned to various experimental groups. To avoid bias, all experiments and processing were performed blind.
Cutaneous delayed-type hypersensitivity: Mice (8-12 weeks old, C57BL/6J) were sensitized by an application of 80 µL of a 5% TNCB (Fluka, Switzerland) solution (dissolved in acetone:Miglyol 4:1; SASOL, Witten, Germany) on their shaved abdomen. After one week, mice were challenged on both sides of their right ear with 20 µL of 1% TNCB (dissolved in acetone:Miglyol 1:9), using a pipette for local topical application. Challenges were repeated every 2 days, with a maximum of 5 times for chronic DTHR induction [25]. 64Cu-GPVI-Fc injections for PET imaging were performed i.v. approximately 12 h after the final TNCB challenge.
Rheumatoid arthritis model: Glucose 6-phosphate isomerase (GPI) serum was obtained from generation 1 of 2-4-month-old K/BxN mice. Control serum was obtained from 2-3-month-old C57BL/6J mice. Sera were pooled and diluted 1:1 (v/v) with saline [26] before intraperitoneal injection of 100 µL into female BALB/c mice between 8 and 12 weeks of age (Charles River, Sulzbach, Germany) to elicit rheumatoid arthritis. 64Cu-GPVI-Fc injection was performed i.v. three days (acute) or six days (chronic) after serum injection.
Experimental autoimmune encephalomyelitis (EAE) model: Active EAE was induced by subcutaneous immunization of female SJL mice with 75 µg of PLP139-151 Peptide in Complete Freund´s Adjuvant (CFA) in the calf and i.p. injection of 200 µg of pertussis toxin (Calbiochem) as previously described [27]. The choice of this injection location was made to elicit a gradual response starting from the lower spine. An i.v. injection of 64Cu-GPVI-Fc was performed on day 3 after induction.
Subchronic lipopolysaccharide (LPS)-induced lung inflammation model: Sprague-Dawley rats were intratracheally deposited with 0.1 mg/kg LPS using a bronchoscope application method for 2 days, 1 day and 1 h before an i.v. injection of the 64Cu-GPVI-Fc bolus to elicit lung inflammation. Procedures were performed under anesthesia.
Target blocking experiments and labeled-isotype antibody experiments: Blocking experiments aimed at confirming the targeting properties of GPVI-Fc were performed using unlabeled GPVI-Fc. One mg/mouse GPVI-Fc was injected i.v. directly before radiotracer injection, resulting in competitive binding of the two fusion proteins. The isotype antibody, a humanized JF5 antibody targeting Aspergillus fumigatus, was radiolabeled according to published methods [28]. Injection of the radiolabeled hJF5 was performed i.v. using 10 MBq per animal.
In vivo imaging techniques
Positron emission tomography (PET): High-resolution in vivo PET imaging was conducted using Inveon small-animal PET scanners (Siemens Healthcare, Erlangen, Germany). Analysis of the data was performed using PMOD software (PMOD Technologies Ltd., Zurich, Switzerland), and images for figures were prepared using Inveon Research Workplace software (Siemens Healthcare). PET radiotracer uptake is reported as the percentage of the injected dose (%ID) per gram of tissue, segmented manually using anatomical images (MRI or CT images). Briefly, list-mode data were reconstructed using an iterative ordered-subset expectation maximization (OSEM 2D), corrected for decay and normalized to the injected activity. Performance of the scanner is estimated as follows; spatial resolution of the reconstructed PET images: 1.4 mm, axial field-of-view: 12.7 cm, and transaxial field-of-view: 10 cm [29]. Approximately 10 MBq of 64Cu-GPVI-Fc was injected into the tail vein of arthritic and healthy mice, or approximately 30 MBq in the rat model experiments.
Twenty-minute static PET scans were initiated 1 h, 24 h or 48 h after radiotracer injection. Dynamic PET scans began at the time of radiotracer injection and continued for 50 min, and the data were divided into time frames to construct time-activity curves. Isoflurane (1.5 vol%) vaporized in 100% oxygen (1.5 L/min) was used for anesthesia throughout the imaging experiments. The animal's body temperature was kept constant at 37 °C during imaging and radiotracer uptake and monitored using a rectal temperature probe.
Magnetic resonance (MR) imaging: MR imaging was performed using a 7-T small-animal scanner (ClinScan; Bruker Biospin MRI GmbH, Ettlingen, Germany). Anesthesia was maintained during imaging using 1.5 vol% isoflurane vaporized in 100% oxygen with continuous respiration monitoring, which was also used to trigger MR imaging acquisition (model 1030; SAI Inc.). Imaging was performed using a T2-weighted 3-dimensional turbo spin-echo sequence with the following parameters : echo time/repetition time: 205/3,000 ms, field-of-view: 35 × 57 mm2, matrix: 160 × 256, slice thickness: 0.22 mm, flip angle: 120°.
Computed tomography (CT): Small-animal CT scans were performed using a combined high-resolution SPECT/CT scanner (Inveon; Siemens Healthcare, Erlangen, Germany) with 80-kVp X-rays and a 500-mA current. The animals were kept under anesthesia using 1.5 vol% isoflurane vaporized in 100% medical oxygen with continuous respiration monitoring. The exposure time per projection was 250 ms with a binning factor of 4, resulting in a reconstructed pixel size of 104 µm. Four hundred projections with over 200° of rotation in step-and-shoot mode were acquired. The final images were reconstructed using a cone-beam filtered back-projection algorithm.
Histology
Mice were sacrificed immediately after the last imaging acquisition. For staining, tissues were fixed in formalin and embedded in paraffin. Next, 5-µm sections were cut using a microtome (Leica, Wetzlar, Germany) and stained with Hematoxylin and Eosin (H&E) according to standard procedures [26]. Masson-Goldner trichrome staining was performed using the Masson Goldner staining kit Nr. 100485 (Merck Millipore, Darmstadt, Germany). For Movat Pentachrome and Picro Sirius Red staining, paraffin-embedded samples were sectioned into serial sections 3-µm thick. The sections were deparaffinized in xylene and rehydrated by being washed with graded ethanol (100% - 70% v/v) to water. Picro Sirius Red staining was performed for 1 h in a 1:1 solution of 0.1% fast green (Fast Green FCF, Sigma-Aldrich) and 0.1% Sirius Red in saturated picric acid (Morphisto GmbH, Frankfurt am Main, Germany) as previously described [30]. The stained sections were cleared for 2 min in acidified water. The overall distribution of ECM components was evaluated as previously described (collagen, elastin and proteoglycans/glycosaminoglycans) [31-34]. After completing histological staining, the sections were dehydrated with ethanol, mounted and imaged with an Observer.Z1 light microscope (Carl Zeiss GmbH, Oberkochen, Germany.
Immunohistochemistry was performed using the following array of primary antibodies: anti-fibronectin (Abcam, Cambridge, United Kingdom, # ab23750), anti-fibrinogen (DAKO, Jena, Germany, # F 0111), anti-collagen I (Abcam, # ab34710), anti-collagen II (Abcam, # ab34712) and anti-collagen III (Abcam, # ab7778), After washing, the sections were incubated for 60 min in the dark with the following secondary antibodies: anti-rabbit Cy3 (Dianova, Hamburg, Germany, # 711-166-152) and anti-human IgG-FITC (Inova Diagnostics Inc., San Diego, CA, USA, # 508113). Nuclei staining was performed using a 5-min incubation of either TO-PRO-3 (Molecular Probes, Darmstadt, Germant, # T3605) or YO-PRO-1 (Molecular Probes, # Y3603). Images were acquired on a Zeiss LSM 800 system (Carl Zeiss) using ZEN software or on a Leica TCS-SP/Leica DM RB confocal laser scanning microscope with Leica Confocal Software LCS (Version 2.61), depending on availability.
When applicable, an evaluation of the colocalization between GPVI-Fc and the extracellular matrix protein was performed with the results given using Pearson's correlation (rp) and Manders' colocalization coefficients (M1, representing the fraction of ECM protein subtype bound to GPVI-Fc, and M2 representing the fraction of GPVI-Fc bound to the ECM protein subtype) [35].
Autoradiography
After sacrificing animals immediately after the last imaging timepoint, dissection was directly performed and the samples were embedded in the optimal cutting temperature compound (TissueTek, Sakura Finetek, Staufen im Breisgau, Germany) and frozen with a coolant spray. Autoradiography of 20-µm sections of the samples was performed using a Storage Phosphor Screen (Molecular Dynamics), scanned after 24 h of exposure time at a resolution of 50 µm/pixel with a STORM Phosphor-Imager (Molecular Dynamics).
Biodistribution
After cervical dislocation, ex vivo biodistribution studies were performed on the selected animals directly after the last time-point of PET imaging sessions. Several organs, including the paws, liver and lungs, were then taken from the specimen, put in a 5-mL tube and had their activity measured with a standard γcounter (Wizard single-detector-counter; Perkin Elmer, Rotgau, Germany). The results are normalized per weight and decay-corrected. The radioactivity standard was defined as a water-based solution with a known activity.
Statistical data analysis
Quantification data were analyzed using the GraphPad Prism software, and the results presented have been calculated as the geometric means ×÷ the geometric standard deviation factor (to be understood as: times or divided by, a×÷b = ab±1). P values were calculated using t-tests or Dunnett's test depending on the comparison hypothesis. P ≤ 0.05 indicates statistical significance. P values are indicated in the figures using * (P ≤ 0.05), ** (P ≤ 0.01) and *** (P ≤ 0.001).
Results
Synthesis of 64Cu-GPVI-Fc
Figure 1B shows a schematic structure of the fusion protein GPVI-Fc. 64Cu was obtained in small volumes of 0.1 N HCl of approximately 200 µL (3-10 MBq/µL). Radionuclidic purity was always far above 99.99%, the specific activities of 64Cu were approximately 350 GBq/µmol at the start of radiolabeling, and the tests for metal contamination (Fe, Ni, Co, Zn, Cu) gave overall values of approximately 75 nmol per batch (200 µL, n = 3). Radiolabeling of NOTA-GPVI consistently gave radiochemical purities of more 95% (Thin Layer Chromatography and SE-HPLC, n = 8), and product solutions were clear, colorless and free of visible particles at a pH of approximately 7.3. SE-HPLC showed no fragmentation or aggregation or other chemical impurities, bacterial endotoxins were less than 1 I.E./mL, and the sterility was verified. A specific activity of ~0.5 MBq/µg was routinely obtained for 64Cu-GPVI-Fc.
These data demonstrate the feasibility of 64Cu-labeling for GPVI using the chelator p-SCN-Bn-NOTA and the conjugation protocol as described.
Biodistribution in a healthy animal
Intravenous injection of labeled GPVI in a healthy mouse, displayed in Figure S1, shows a predominant 64Cu-GPVI-Fc accumulation in the liver at all timepoints (1 h, 24 h and 48 h). However, at the earliest timepoint, a significant portion of the radiotracer remained detectable in the blood circulation, as can be seen in the lungs, heart and jugular veins. At later timepoints, no specific organ besides the liver appeared to provide significant 64Cu-GPVI-Fc accumulation (notably, the heart, kidney, brain, and joints).
Contact hypersensitivity reaction
First, we analyzed 64Cu-GPVI-Fc accumulation patterns in acute and chronic experimental cutaneous TNCB-induced DTHR, a T cell-driven contact hypersensitivity model. Experimental mice were sensitized with TNCB at the abdomen to induce DTHR, and TNCB was challenged seven days later at the right ear to elicit acute skin inflammation (acute TNCB-induced DTHR). To induce inflammation, mice were challenged with TNCB one or five times on the right ear (acute and chronic TNCB-induced DTHR, respectively). 64Cu-GPVI-Fc was injected i.v. 12 h after the 1st and 5th TNCB-ear challenge followed by static PET investigations. Figure 2A represents an experimental mouse asymmetrically TNCB-challenged (right ear) with unilateral chronic TNCB-induced cutaneous DTHR 24 h after 64Cu-GPVI-Fc injection. PET investigations revealed enhanced 64Cu-GPVI-Fc accumulation in the inflamed TNCB-challenged right ear compared to the healthy contralateral control ear. Ex vivo autoradiography confirmed our in vivo results (Figure S2A).
64Cu-GPVI-Fc in cutaneous delayed-type hypersensitivity reaction (DTHR). (A) Representative section images of 64Cu-GPVI-Fc distribution 24 h after injection in an animal presenting unilateral DTHR with in vivo CT (top), highlighting the inflamed (dashed circle, right) ear and the contralateral unstimulated ear (dotted circle, left), PET (middle) and overlay (bottom). The ears were laid flat on the holder surface during acquisition. (B) Accumulation of 64Cu-GPVI-Fc 24 h after injection in control animal ears (Control, n=3) or after 1 (Acute, Ac., n=3) or 5 inflammatory challenges leading to DTHR (Chronic, Ch., n=6). The results obtained with a coinjection of nonradioactive Cu-GPVI-Fc for each group are indicated (Blocked). They are shown as single values with geometric means and a geometric standard deviation. P values are indicated using * (P ≤ 0.05), ** (P ≤ 0.01) and *** (P ≤ 0.001). % ID/cc: percentage of injected dose per cubic centimeter.
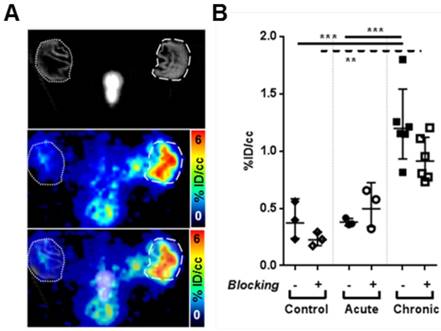
A quantitative analysis, presented in Figure 2B, indicates that 24 h after injection, the 64Cu-GPVI-Fc accumulation in chronically inflamed animal ears is approximately three-fold higher compared to both the control and DTHR models after a single TNCB challenge (1.20 ×÷ 1.29 vs 0.37 ×÷ 1.57 and 0.38 ×÷ 1.09 %ID/cc, respectively, p < 0.0001), indicating a link between the stage of inflammation and radiotracer accumulation. As early as 1 h after 64Cu-GPVI-Fc injection into littermates with chronic inflammation, accumulation in the ears was low but still approximately three-fold higher compared to healthy (sensitized but not TNCB-challenged) contralateral control ears (0.40 ×÷ 1.60 vs 0.15 ×÷ 1.62 %ID/cc, p < 0.05) (Figure S2B). Blocking experiments, performed by simultaneously injecting unlabeled GPVI-Fc, yielded a reduced 64Cu-GPVI-Fc accumulation 24 h after injection in animals that received 5 TNCB challenges (Figure 2B; 1.20 ×÷ 1.29 vs 0.91 ×÷ 1.23 %ID/cc, p < 0.07). No reduction was evident at the 1-h timepoint. Dynamic PET images acquired during the first hour postinjection of 64Cu-GPVI-Fc suggest slow accumulation kinetics (Figure S2C). Figure 2B indicates significantly enhanced 64Cu-GPVI-Fc accumulation in the ear during chronic inflammation but not during acute inflammation. Acute cutaneous DTHR (after a single TNCB ear challenge) revealed similar 64Cu-GPVI-Fc accumulation patterns compared to healthy control animals (0.36 ×÷ 1.09 vs 0.37 ×÷ 1.57 %ID/cc) with no significant changes after blocking (Figure 2B). Movat and Masson Goldner stains of sections derived from chronically inflamed ears were performed to highlight connective tissue in light green and distinguish it from other tissue components such as muscle fibers and cells. The results are presented in Figure 3 and demonstrate significantly larger areas of fibrous tissue between the epidermis and the auricular cartilage as well as an increased infiltration of inflammatory cells (predominantly neutrophils), compared to healthy tissue. Brightfield and birefringence images of Picro Sirius Red stains, highlighting connective tissue in red, correlated with this finding. Most importantly, fluorescence microscopy (nuclei (blue), fibronectin (red) and 64Cu-GPVI-Fc (green)) showed a remarkable colocalization (yellow) between fibronectin and 64Cu-GPVI-Fc (rp = 0.41, M1 = 0.973, M2 = 0.847) (Figure 3).
GPVI-Fc distribution at the microscopic scale in a cutaneous delayed-type hypersensitivity reaction (DTHR) model. Movat (top left) and Masson (bottom left) staining of sections of chronically inflamed DTHR ears. Fluorescence images of nuclei (blue), fibronectin (red) and glycoprotein-VI fusion protein (GPVI-Fc) (green) distribution in histological samples (top middle), with selected overlay of fibronectin and GPVI-Fc (yellow) (bottom middle). Bright field image of Picro Sirius stain (top right), along with an image of the same sample observed under polarized light. Scale bar: 150 µm.
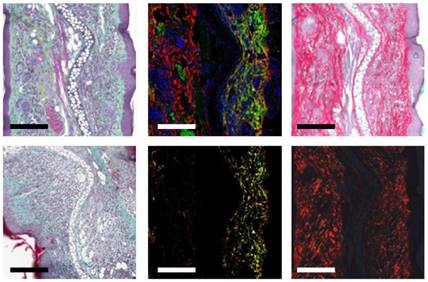
Continuative fluorescence microscopy analysis of chronically inflamed ears revealed colocalization of 64Cu-GPVI-Fc with collagen fibers, mostly collagen type II and III, and collagen I to a lesser extent: rp = 0.37, M1 = 0.808, M2 = 0.918; rp = 0.08, M1 = 0.633, M2 = 0.731 and rp = 0.03, M1 = 0.638, M2 = 0.554, respectively, albeit not as extensively as with Fibronectin (Figure S3, colocalization values above). In comparison, healthy tissue presented a minimal amount of fibrous tissue and almost no accumulation of 64Cu-GPVI-Fc, as visualized in Figure S3.
Rheumatoid arthritis model
As a next step, we investigated the potential of 64Cu-GPVI-Fc imaging to uncover tissue conversion including fibrosis in GPI-serum-induced experimental rheumatoid arthritis (RA), a T and B cell-independent experimental model of RA. Figure 4A shows representative PET images 1 h, 24 h and 48 h after 64Cu-GPVI-Fc injection i.v. into experimental mice before, 3 days after and 6 days after the onset of GPI-arthritis. A quantitative analysis, presented in Figure 4B, shows that hardly any radiotracer uptake was seen at 1 h, 24 h, and 48 h postinjection in the healthy ankles (3.8 ×÷ 1.9, 5.6 ×÷ 1.4, 7.5 ×÷ 1.4 %ID/cc, respectively). On the contrary, animals with an ongoing ankle swelling and inflammatory process (day 3 after RA induction by i.p. GPI-serum injection) displayed the highest and most stable 64Cu-GPVI-Fc accumulation in their inflamed joints at all timepoints post an i.v. radiotracer injection. While the 64Cu-GPVI-Fc signal was already high at 1 h postinjection (28.5 ×÷ 1.3 %ID/cc), it increased to reach a plateau with similar values 24 h and 48 h after radiotracer injection (46.3 ×÷ 1.2 and 43.3 ×÷ 1.2 %ID/cc, respectively). At 6 days after induction of RA, the point in time displaying the strongest ankle swelling (reflecting severe ankle inflammation) and 64Cu-GPVI-Fc uptake in the joints was markedly higher than that in healthy animals, but remained approximately two-fold lower than that in animals on day 3 with a similar plateau behavior (18.0 ×÷ 1.1, 25.6 ×÷ 1.1 and 23.1 ×÷ 1.1 %ID/cc at 1, 24 and 48 h post-radiotracer injection, respectively). Differences in 64Cu-GPVI-Fc uptake in inflamed ankles between the day 0, 3 and 6 groups are highly statistically significant relative to the control (p < 0.0001 at all timepoints) and between acute and chronic exposure (p < 0.005 at 1 h, p < 0.0001 at 24 h and 48 h, respectively). At the end of the experiment, 48 h after 64Cu-GPVI-Fc injection into mice with severe arthritic ankle inflammation (6 days after the onset of GPI-arthritis), we performed a biodistribution analysis of the liver, spleen, blood, muscle and several joints derived from healthy and arthritic mice (Figure S4A).
64Cu-GPVI-Fc in Rheumatoid Arthritis (RA). (A) Representative in vivo PET images of 64Cu-GPVI-Fc distribution 1 h (top row), 24 h (middle row) and 48 h (bottom row) after injection in a mouse before (left column), 3 days (middle column) and 6 days (right column) after anti-glucose-6-phosphate isomerase (GPI) stimulation. (B) Accumulation kinetics of 64Cu-GPVI-Fc in animals on day 0, 3 and 6 of GPI serum stimulation 1 h, 24 h and 48 h after tracer injection (n=3 animals, both sides). (C) Accumulation profile of 64Cu-GPVI-Fc in RA animals on day 6 after stimulation 1 h, 24 h and 48 h after injection of 64Cu-GPVI-Fc alone (Ref., n=13 animals, both sides), with nonradioactive Cu-GPVI-Fc co-injection (Blck. n=7) and of a labeled isotype antibody (Iso. n=3). The results are shown as single values with a geometric means and geometric standard deviation. P values are indicated using * (P ≤ 0.05), ** (P ≤ 0.01) and *** (P ≤ 0.001). % ID/cc: percentage injected dose per cubic centimeter.
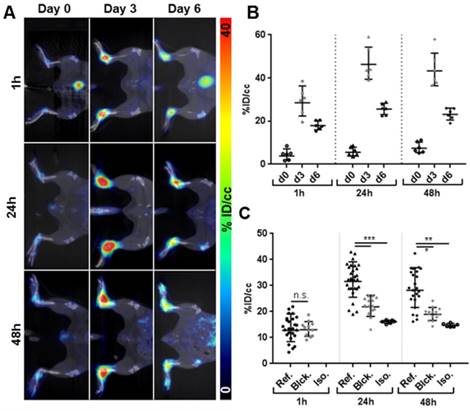
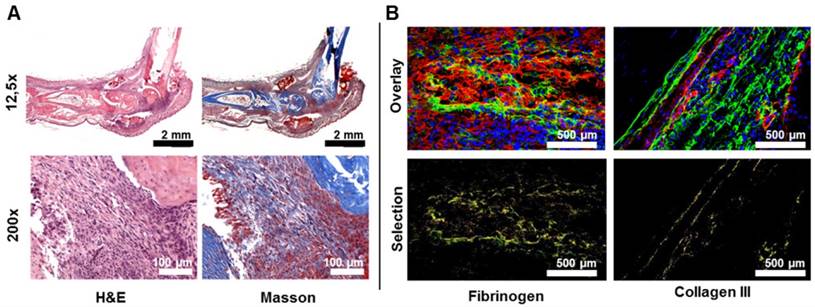
We determined that there was a significantly increased 64Cu-GPVI-Fc uptake in inflamed paws and ankles of mice with GPI-arthritis but not in the paws and ankles of healthy mice (paws: 29.1 ×÷ 1.01 vs 6.2 ×÷ 1.06 %ID/g). A slight increase in 64Cu-GPVI-Fc accumulation was evident in the spleens and livers of arthritic mice when compared to healthy mice (spleen: 6.7 ×÷ 1.12 vs 3.6 ×÷ 1.07 %ID/g and liver: 16.2 ×÷ 1.06 vs 10.6 ×÷ 1.09 %ID/g), with no differences in the blood and muscle tissues (Figure S4A). Additionally, an autoradiography analysis of slices from arthritic ankles confirmed a significantly increased 64Cu-GPVI-Fc accumulation when compared to ankle slices from healthy mice (Figure S4B). This excludes the notion that the effect was solely caused by the partial volume effect due to thicker ankles. The first 50 min after i.v. 64Cu-GPVI-Fc injection (Figure S4C) indicate a continuous accumulation of the radiotracer in the target tissue. Blocking experiments (Figure 4C) performed on day 6 after the onset of GPI-arthritis demonstrated no blocking effect 1 h after 64Cu-GPVI-Fc injection, but a successful blocking was demonstrated by a significant decrease in radiotracer uptake in the arthritic animals coinjected with unlabeled GPVI-Fc compared to 64Cu-GPVI-Fc injected mice at 24 h and 48 h after radiotracer injection (21.8 ×÷ 1.20 vs 31.6 ×÷ 1.24 %ID/cc, p < 0.0001 and 19.0 ×÷ 1.14 vs 28.2 ×÷ 1.31 %ID/cc, p < 0.0001, respectively). The 64Cu-GPVI-Fc uptake values in arthritic ankles after blocking were almost similar to the uptake values of radiolabeled IgG1 isotype antibodies (hJF5 targeting Aspergillus fumigatus, absent in this model [28]) at 24 and 48 h after injection (16.1 ×÷ 1.04 and 14.8 ×÷ 1.05 %ID/cc, respectively). H&E as well as Masson's trichrome staining presented in Figure 5A confirmed severe joint inflammation with a pronounced infiltration of leucocytes and neutrophils and a significant increase in fibrous tissue deposition within the joint. Fluorescence microscopy presented in Figure 5B highlighted the distribution of 64Cu-GPVI-Fc (green) with a pronounced colocalization with Fibrinogen (rp = 0.17, M1 = 0.769, M2 = 0.916) and Collagen III (rp = 0.19, M1 = 0.815, M2 = 0.796) (shown in red, colocalization in yellow). A similar fluorescence microscopy experiment of a murine joint on day 3 after GPI induction of arthritis showed only very limited fibrosis, despite an intense GPVI-Fc presence (Figure S5). Using GPVI-Fc for fluorescence microscopy in the control and arthritic joints after cryo-sectioning of the sample, global staining of all fibrous and conjunctive tissue was achieved (Figure S6) with no differences in the distribution nor the intensity of the signal between samples.
Microscopic view of 64Cu-GPVI-Fc in the ankles of rheumatoid arthritis mice. (A) Histological stains of the ankle of an RA animal on day 6 after stimulation. Left: hematoxylin and eosin (H&E) stain, right: Masson stain (top: 12.5x, bottom 200x magnification). (B) Fluorescence image overlay of nuclei (blue), GPVI-Fc (green) and fibrinogen (left, red) or collagen III (right, red). Bottom: selected overlay of GPVI-Fc and fibrinogen or collagen (yellow) for the fluorescence images.
Subchronic LPS-induced lung inflammation
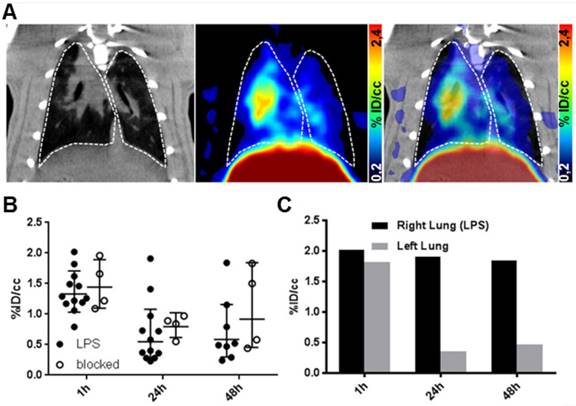
As a model for acute inflammation, we chose the subchronic lipopolysaccharide (LPS)-induced lung inflammation model. Acute lung inflammation was induced by intratracheal deposition of lipopolysaccharide in rats. We conducted PET imaging of rats with acute LPS-induced lung inflammation 1 h, 24 h and 48 h after an i.v. 64Cu-GPVI-Fc injection (Figure 6A). We used lung segmentation on the CT image to highlight the targeted organ in the PET image, showing a low-to-moderate and uneven distribution of 64Cu-GPVI-Fc. As indicated in Figure 6B, the 64Cu-GPVI-Fc accumulation remained low at all timepoints, close to the background level. However, the 1 h timepoint presented a two-fold signal increase compared to 24 and 48 h (1.32 ×÷ 1.27, 0.55 ×÷ 1.97 and 0.59 ×÷ 1.97 %ID/cc, respectively). Blocking experiments by simultaneous injection of unlabeled GPVI-Fc revealed no significant difference in 64Cu-GPVI-Fc accumulation at the site of inflammation at all measured timepoints after radiotracer injection (1.44 ×÷ 1.31, 0.79 ×÷ 1.29 and 0.91 ×÷ 2.01 %ID/cc). In a test animal with an asymmetrical inoculation of LPS (right lobe inoculated, left lobe naïve), a difference in the 64Cu-GPVI-Fc accumulation was found as shown in Figure 6C. This difference was, however, only present at the 24 h and 48 h timepoints (1.91 vs 0.36 and 1.84 vs 0.47 %ID/cc, respectively, n = 1), as 1 h after the injection, the signal remained similar in both lobes (2.02 vs 1.82 %ID/cc).
64Cu-GPVI-Fc in a lipopolysaccharide (LPS)-induced lung inflammation model. (A) Representative in vivo images of the distribution of 64Cu-GPVI-Fc in a lung inflammation model in rats with CT image (left), PET image (middle) and PET overlaid on CT background (right) 48 h after tracer injection. Lungs are highlighted with a dashed white outline. (B) Accumulation kinetics of 64Cu-GPVI-Fc in LPS-induced bilateral lung inflammation injected alone (LPS, n=12) or alongside nonradioactive Cu-GPVI-Fc (n=4) in the lungs observed by PET in vivo. Results shown as single values with a geometric mean and geometric standard deviation. (C) Accumulation kinetics of 64Cu-GPVI-Fc in LPS-induced unilateral lung inflammation in one example animal. % ID/cc: percentage injected dose per cubic centimeter.
Experimental model of multiple sclerosis
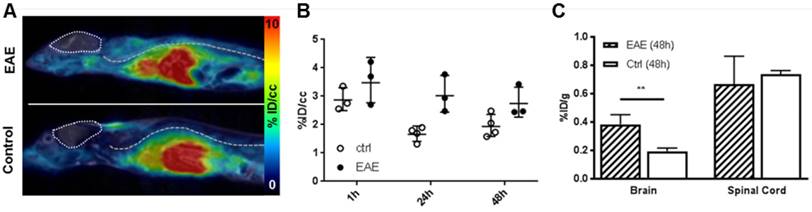
Lastly, we investigated a T cell-driven experimental model of multiple sclerosis, called experimental autoimmune encephalomyelitis (EAE). EAE was induced by an injection of a PLP emulsion in CFA with pertussis toxin. We conducted noninvasive in vivo 64Cu-GPVI-Fc-PET measurements 3 days after the onset of EAE. Figure 7A shows that, similar to the LPS-induced lung inflammation model, liver accumulation due to the metabolic pathway of 64Cu-GPVI-Fc-PET is dominant 1 h after injection. Figure 7B indicates that there is almost no difference between the diseased and healthy control mice as early as 1 h after 64Cu-GPVI-Fc injection in the animals' spinal cords (2.87 ×÷ 1.15 vs 3.58 ± 1.26 %ID/cc, respectively), achieving the highest signal in the time span of the investigation. A significant difference 24 h after injecting 64Cu-GPVI-Fc was observed (1.66 ×÷ 1.18 vs 3.02 ×÷ 1.24 %ID/cc, respectively, p < 0.01), reducing in value 48 h after the injection (1.93 ×÷ 1.22 vs 2.74 ×÷ 1.21 %ID/cc, respectively) with a low statistical significance (p < 0.07). Ex vivo biodistribution investigations performed 48 h after the radiotracer injection (Figure 7C) confirmed the similar accumulation of 64Cu-GPVI-Fc in the spinal cord at a late timepoint in the control and EAE animals (0.74 ×÷ 1.04 vs 0.65 ×÷ 1.35 %ID/g). However, while the brain signal remained too low for detection in vivo, ex vivo quantification of radiotracer accumulation by gamma-counting revealed a significant, albeit low, difference in accumulation between healthy and EAE animals (0.19 ×÷ 1.15 vs 0.38 ×÷ 1.20 %ID/g respectively).
64Cu-GPVI-Fc in an experimental autoimmune encephalomyelitis (EAE) model. (A) Representative images of 64Cu-GPVI-Fc accumulation in the spine of an EAE model (top) and control animal (bottom) acquired by PET and overlaid on MRI data. Brain: outlined by a pointed line. Spine location: dashed line. (B) Accumulation kinetics of 64Cu-GPVI-Fc in the spine of control animals (ctrl, n=4) and EAE animal model (n=3). Results shown as single values with a geometric mean and geometric standard deviation. (C) Biodistribution of 64Cu-GPVI-Fc measured ex vivo in an EAE model (EAE, n=3) and in control animals (Ctrl, n=4) in the brain and in the spinal cord. Average values and standard deviations are shown. P values are indicated using * (P ≤ 0.05), ** (P ≤ 0.01) and *** (P ≤ 0.001). % ID/cc: percentage injected dose per cubic centimeter.
Discussion
Herein, we present methods for imaging inflammation and induced fibrosis, enabled by the use of a radiolabeled ECM-targeting fusion protein, 64Cu-GPVI-Fc. Our data demonstrate the specific active targeting of the fusion protein to fibrotic sites during chronic inflammation in vivo, with a correlation between inflammation intensity and characteristics and radiotracer accumulation. A histological analysis confirmed the binding of GPVI-Fc to the exposed ECM in a nonselective manner, with partial colocalization with fibronectin, fibrinogen and different subtypes of collagen (I, II and III).
As an adhesion protein expressed by platelets, GPVI plays a crucial role in the process of thrombosis [36], notably in atherosclerotic lesions. The soluble dimeric fusion protein GPVI-Fc, initially designed as an antithrombotic, was shown to exhibit a high affinity towards collagen in various studies [37]. Radioactive or fluorescence labeling enabled the visualization of vascular injury in the carotid arteries and the aortic arch of mice, notably with optical imaging [38] and PET [21, 39]. It was later shown that GPVI binds not only to collagen fiber but also to most ECM proteins [19, 20]. Surprisingly, this was not capitalized on for a broader application of the fusion protein, and very limited attention was given to other fibrotic diseases, particularly auto-immune inflammatory diseases in which fibrosis leads to pain and/or reduced function of the organ.
As antibodies', and by extension fusion proteins', circulation times span days, long-lasting isotopes were needed to provide a complete picture of the distribution of the radiotracer after injection. 64Cu, with a physical half-life of 12.7 h and accessible conjugation chemistry, was selected as the most promising labeling route. By producing extensive in-house amounts of high-quality 64Cu-GPVI-Fc, we were able to perform a systematic study of the potential of GPVI-Fc as an imaging tool for documenting the extent of inflammation and fibrotic events in various inflammatory diseases. To obtain excellent radiolabeling results, the minimization of contamination with bi- and tri-valent metal ions is essential during this process and could be achieved here using EDTA and Chelex 100 as scavengers. A first attempt at the conjugation of GPVI using NOTA-NHS-ester gave unsatisfactory results; so, p-SCN-Bn-NOTA was chosen as the chelating agent. The advantage of NOTA vs. DOTA for the chelation of 64Cu was already discussed elsewhere [40, 41].
It can be expected that using a 15x molar excess of chelator for conjugation will result in 2-5 chelators per protein molecule, as we found in conjugation experiments with other proteins (unpublished results). Further quality control of NOTA-GPVI showed neither fragmentation nor aggregation in SE-HPLC, nor other chemical impurities. Radiolabeling of the synthesized NOTA-GPVI gave excellent radiolabeling results, proving the adequate quality of this product. The endotoxin content was well below the pharmacopoeia limits.
By evaluating 64Cu-GPVI-Fc in several preclinical models, we could draw attention to the variety and accessibility of the binding sites of GPVI for circulating fusion proteins. The cutaneous delayed-type hypersensitivity model used here allows easy access to both phases (acute, with a single TNCB challenge and chronic with 5+) [22]. By monitoring the distribution of 64Cu-GPVI-Fc in both cases, we could clearly see that acute inflammation, i.e., devoid of novel accessible fibrous tissue, does not generate 64Cu-GPVI-Fc accumulation. Conversely, chronic dermatitis and its associated scarring showed increased accumulation and retention through the distribution of the radiotracer. Ex vivo staining confirmed not only the accumulation of 64Cu-GPVI-Fc in the fibrotic areas but also highlighted its affinity for a broad array of fibrous connective tissue proteins with significant overlay with multiple types of collagen and fibronectin. The similar absence of any accumulation of 64Cu-GPVI-Fc in the control and acute inflammation ears is most likely due to the very limited thickness, swelling and vascularization of the target organ, which does not allow for the proper visualization of a possible passive targeting (i.e., not affinity-driven) to the site of inflammation after extravasation. However, during chronic inflammation, the exposed and newly formed ECM combined with the increased permeation of the blood vessels, allowing 64Cu-GPVI-Fc to reach and bind to its target and accumulate sufficiently for PET detection. While the blocking experiments did not show a major reduction in 64Cu-GPVI-Fc accumulation in the chronically inflamed ears, it can be explained by seeing the 64Cu-GPVI-Fc accumulation as the sum of unspecific extravasation and specific binding; after 5 challenges, the ears present a massive amount of immune cell infiltrates, which correlates to a passive accumulation of 64Cu-GPVI-Fc as well as a very important scaring that allows for a large amount of accessible fibrotic tissue. As the chosen blocking model is a simultaneous injection of radiolabeled and unlabeled GPVI-Fc, akin to a competition experiment, all binding sites remain accessible for both of the injected fusion proteins, which results in a significant amount of signal remaining detectable, even during the blocking experiment.
As a second step and in order to visualize both the active targeting and passive targeting components of 64Cu-GPVI-Fc affinity for inflammatory sites, we used a GPI-serum-induced RA model, characterized by its reproducibility and quick onset [42]. RA is characterized by an increased permeation of the synovia, particularly during the first few days after induction, as visualized for diagnostic purposes clinically with Gd-enhanced MRI [43], disruption of the cartilage and bone, significant infiltration of inflammatory cells and the creation of a fibrous cap within the joint [44, 45], as shown in the histology images. We found that in certain heavily arthritic animals that exhibited advanced pathological symptoms, such as redness, swelling and loss of mobility, the accumulation of 64Cu-GPVI-Fc could reach up to 40% of the injected doses in specific joints (ankles and paws), while the control animals remained at around 5%. The contrast improvement between arthritic and healthy animals appeared higher 3 days after induction rather than after 6 days, which we believe is mostly due to passive accumulation during this intense swelling (and thus, it is highly prone to extravasation and retention) sequence of the model, as the microscopic evaluation did not show any excess fibrous tissue. This result points at a significant contrast ratio enhancement for a fibrosis-based assessment of disease progression and suggests a very high sensitivity as well as possibilities for early detection and therapy monitoring, which are outside the scope of this study. To discriminate between active and passive targeting, blocking experiments (simultaneously injecting unlabeled GPVI-Fc) and control isotype experiments were performed. Interestingly, accumulation in the inflamed joints during blocking and isotype experiments remained significantly higher than in healthy joints 48 h after injection but lower than in RA animals injected solely with 64Cu-GPVI-Fc. This can be explained by the high permeability of the synovia, which led to permeation and retention of large molecules in the capsule. This effect is routinely used as an RA staging method, using a Gd-based contrast agent in MRI, and may be described as a passive targeting property of the fusion protein. The 1.5- to 2-fold difference in accumulation between solely injected 64Cu-GPVI-Fc and blocking/isotype experiments clearly points at active binding to fibrous tissue in the inflamed joint, driving its accumulation and retention, as confirmed by histological staining of excised tissue. This can also explain the lack of uniformity in the fluorescence images of GPVI bindings sites, as extravasation and diffusion (“passive” targeting) are required as the first steps before 64Cu-GPVI-Fc can effectively recognize and bind to its target, effectively limiting the extent of staining within such a dense network of fibers. Similar to the DTHR experiments, 64Cu-GPVI-Fc was found colocalized to multiple types of fibrous fibers, explaining its high concentration in the fibrous cap. Direct ex vivo post-slicing staining of thin ankle sections with GPVI-Fc revealed no specific staining in inflamed tissue compared to healthy ankles, with a homogeneous staining of the entire fibrous tissue present in the sample. As slicing exposes all possible GPVI-Fc binding sites during immunohistological procedures, this further indicates a correlation between an accumulation of GPVI-Fc and target accessibility, i.e., exposure of the ECM protein to circulating GPVI-Fc.
To uncover the potential of 64Cu-GPVI-Fc in pathologies with distinct progression characteristics, we first selected subchronic LPS-induced lung inflammation as an example of acute inflammation caused by exogenous pathogens [46]. At an early stage (less than 72 h after LPS induction), no recruitment of fibroblast occurred, even in models using several LPS-hits [47]. As such, no fibrosis is expected. In our experiments, this is reflected by the absence of retention of 64Cu-GPVI-Fc in the lungs. While the PET signal was measured close to 1.5%ID/cc in the initial hours following injection, partly justified by the large vascularization of the organ and general vascular modifications caused by inflammation, the level of 64Cu-GPVI-Fc in the organ quickly diminished to a low value (approximately 0.5 %ID/cc 24 and 48 h after injection). Similar to the DTHR model, this underlines the lack of fibrotic events in the acute stages of inflammation. However, the lung model benefits from extensive vascularization from the bronchia, with the good perfusion explaining the signal 1 h after injection. However, quantification remains difficult due to the proximity to the liver, comprising the favored metabolic route of the radiotracer and thus emitting a strong signal at all timepoints, as could be seen in the biodistribution assays in healthy animals.
The second specific model, EAE, presents a high inflammation localized during its first stage in the spinal cord and is evolving towards the brain, with a potential scar formation in response to severe tissue damage [48]. This fibrosis is particularly located around vascular capillaries, which is a distinct setting from RA and DTHR [49]. Using 64Cu-GPVI-Fc, we can observe a clear difference in the behavior of the radiotracer in control (healthy) and EAE animals. While the initial timepoints show approximately 3%ID/cc in both cases, later timepoints indicate a longer retention time in the spine of the diseased animals. This is coherent with a fibrosis located predominantly around the blood vessels, with the fusion protein binding in close proximity to the endothelial wall and not being washed out by the circulating blood flow as quickly as in the control animals. Similar to other models, 24 h postinjection appeared to provide the most significance as a diagnostic mean.
Taken together, 64Cu-GPVI-Fc has shown outstanding promise as an imaging tool for visualizing fibrosis alongside extravasation caused by chronic inflammation. With multiple specific binding sites within the ECM fibers family, it allowed for a broad overview of the disruption and creation of the ECM in several example pathologies, relying on passive targeting via extravasation at early timepoints after injection and retention as well as active targeting onto protein fibers for prolonged contrast enhancement starting 24 h after injection. Such an approach would provide valuable information in a variety of settings, such as imaging the fibrous cap during rheumatoid arthritis or internal organ scaring postsurgery, monitoring fibrosis development around biomaterial implants known to hinder their efficacy, providing a molecular insight in vivo into liver cirrhosis, or delineating fibrous tissue from cancerous tumors in a variety of stroma-driven cancers (e.g., pancreatic cancer). Furthermore, we envision GPVI-Fc-based imaging as a powerful tool to monitor the efficiency of treatment, whether surgical or drug-based, by relying on repeated imaging sessions, hopefully serving as a tool to validate a therapy choice before symptoms subside or worsen. For these uses, two specific cases seem to have great potential: first, idiopathic lung fibrosis, a noninflammatory fibrosis-driven disease that is currently difficult to diagnose; second, the visualization of peritoneal scaring after surgical removal of tumors in the vicinity, as fibrotic plaque favors metastases implantation. A potential improvement in the technique of attempting fibrosis-selective imaging, not combined with extravasation and retention of the contrast agent, could lie in the use of isotopes with longer half-lives for labeling, such as 89Zr. A longer imaging window would allow for sufficient time for the extravasation and retention effect to wear off, with the non-ECM-bound fusion protein being excreted, leaving only the fibrosis-specific fraction to provide PET contrast. Proper clinical translation of the entire radiotracer would, however, require careful examination of the respective affinity of GPVI and of Fc fragments to their targets, as a human Fc fragment is involved in an immune reaction and could shift the targeting balance of the GPVI-Fc fusion protein away from the pure ECM protein fibers. However, strategies are already available to circumvent this issue, using a slight modification of the Fc fragment to negate its affinity toward Fc receptors.
Abbreviations
CT: computed tomography; DTHR: cutaneous delayed-type hypersensitivity reaction; EAE: experimental autoimmune encephalomyelitis; ECM: extracellular matrix; GPI: glucose-6-phosphate isomerase; GPVI: glycoprotein VI; H&E: hematoxylin and eosin; LPS: lipopolysaccharide; MRI: magnetic resonance imaging; NOTA: 1,4,7-triazacyclononane-1,4,7-triacetic acid; PET: positron emission tomography; RA: rheumatoid arthritis; TNCB: trinitrochlorobenzene.
Supplementary Material
Supplementary materials and figures.
Acknowledgements
This work was supported by the Werner Siemens-Foundation and the German Research Foundation (SFB TRR156 (to KG, MK and BP); SFB TRR240 with the DFG project number 374031971 - TRR240 (MG and BP); KFO274 (MG, BP); as well as INST 2388/34-1 and SCHE701/14-1 (DCB and KSL)). We thank advanceCOR GmbH for providing the fusion protein GPVI-Fc. We thank Prof. Dr. Eichner for his input on data analysis and Sandro Aidone, Walter Ehrlichmann, Maren Harant, Natalie Mucha, Simone Pöschel and Linda Schramm for their excellent technical assistance.
Contributions
NB: analyzing experiments and writing the manuscript. KF: planning, performing and analyzing experiments. AM, GR: synthesis and analysis of the radiolabeled fusion protein. JB, KG: planning and performing EAE experiments. BF: performing and analyzing fluorescence microscopy experiments. UK, LQM, DCB, KSL: performing and analyzing ex vivo microscopy experiments, MG: planning and supervising experiments, MK, BP: planning and supervising experiments, analyzing data and writing the manuscript.
Competing interests
M. Gawaz is a shareholder of advanceCOR GmbH.
References
1. Wynn TA, Ramalingam TR. Mechanisms of fibrosis: therapeutic translation for fibrotic disease. Nat Med. 2012;18:1028-40
2. Krane S. Overview: Destruction of the Extracellular Matrix in Rheumatoid Arthritis. Arthritis Res Ther. 1999:1
3. Bataller R, Brenner DA. Liver fibrosis. J Clin Invest. 2005;115:209-18
4. Ryu JH, Moua T, Daniels CE, Hartman TE, Yi ES, Utz JP. et al. Idiopathic pulmonary fibrosis: evolving concepts. Mayo Clin Proc. 2014;89:1130-42
5. Li C, Kuemmerle JF. Mechanisms that mediate the development of fibrosis in patients with Crohn's disease. Inflamm Bowel Dis. 2014;20:1250-8
6. Kalluri R. The biology and function of fibroblasts in cancer. Nat Rev Cancer. 2016;16:582-98
7. Zoumi A, Yeh A, Tromberg BJ. Imaging cells and extracellular matrix in vivo by using second-harmonic generation and two-photon excited fluorescence. Proc Natl Acad Sci U S A. 2002;99:11014-9
8. Fuchs BC, Wang H, Yang Y, Wei L, Polasek M, Schuhle DT. et al. Molecular MRI of collagen to diagnose and stage liver fibrosis. J Hepatol. 2013;59:992-8
9. Caravan P, Das B, Dumas S, Epstein FH, Helm PA, Jacques V. et al. Collagen-targeted MRI contrast agent for molecular imaging of fibrosis. Angew Chem Int Ed Engl. 2007;46:8171-3
10. Batheja M, Vargas H, Silva AM, Walker F, Chang YH, De Petris G. et al. Magnetic resonance elastography (MRE) in assessing hepatic fibrosis: performance in a cohort of patients with histological data. Abdom Imaging. 2015;40:760-5
11. Catalano OA, Gee MS, Nicolai E, Selvaggi F, Pellino G, Cuocolo A. et al. Evaluation of Quantitative PET/MR Enterography Biomarkers for Discrimination of Inflammatory Strictures from Fibrotic Strictures in Crohn Disease. Radiology. 2016;278:792-800
12. Muzard J, Sarda-Mantel L, Loyau S, Meulemans A, Louedec L, Bantsimba-Malanda C. et al. Non-invasive molecular imaging of fibrosis using a collagen-targeted peptidomimetic of the platelet collagen receptor glycoprotein VI. PLoS One. 2009;4:e5585
13. Desogere P, Tapias LF, Hariri LP, Rotile NJ, Rietz TA, Probst CK. et al. Type I collagen-targeted PET probe for pulmonary fibrosis detection and staging in preclinical models. Sci Transl Med. 2017:9
14. Han Z, Lu ZR. Targeting Fibronectin for Cancer Imaging and Therapy. J Mater Chem B. 2017;5:639-54
15. Desogere P, Montesi SB, Caravan P. Molecular Probes for Imaging Fibrosis and Fibrogenesis. Chemistry. 20180
16. Baues M, Dasgupta A, Ehling J, Prakash J, Boor P, Tacke F. et al. Fibrosis imaging: Current concepts and future directions. Advanced drug delivery reviews. 2017;121:9-26
17. Ungerer M, Rosport K, Bultmann A, Piechatzek R, Uhland K, Schlieper P. et al. Novel antiplatelet drug revacept (Dimeric Glycoprotein VI-Fc) specifically and efficiently inhibited collagen-induced platelet aggregation without affecting general hemostasis in humans. Circulation. 2011;123:1891-9
18. Miura Y, Takahashi T, Jung SM, Moroi M. Analysis of the interaction of platelet collagen receptor glycoprotein VI (GPVI) with collagen. A dimeric form of GPVI, but not the monomeric form, shows affinity to fibrous collagen. J Biol Chem. 2002;277:46197-204
19. Bultmann A, Li Z, Wagner S, Peluso M, Schonberger T, Weis C. et al. Impact of glycoprotein VI and platelet adhesion on atherosclerosis-a possible role of fibronectin. J Mol Cell Cardiol. 2010;49:532-42
20. Mammadova-Bach E, Ollivier V, Loyau S, Schaff M, Dumont B, Favier R. et al. Platelet glycoprotein VI binds to polymerized fibrin and promotes thrombin generation. Blood. 2015;126:683-91
21. Bigalke B, Phinikaridou A, Andia ME, Cooper MS, Schuster A, Schonberger T. et al. Positron emission tomography/computed tomographic and magnetic resonance imaging in a murine model of progressive atherosclerosis using (64)Cu-labeled glycoprotein VI-Fc. Circ Cardiovasc Imaging. 2013;6:957-64
22. Schwenck J, Griessinger CM, Fuchs K, Bukala D, Bauer N, Eichner M. et al. In vivo optical imaging of matrix metalloproteinase activity detects acute and chronic contact hypersensitivity reactions and enables monitoring of the antiinflammatory effects of N-acetylcysteine. Mol Imaging. 2014;13:7290201400044
23. Cooper MS, Sabbah E, Mather SJ. Conjugation of chelating agents to proteins and radiolabeling with trivalent metallic isotopes. Nat Protoc. 2006;1:314-7
24. McCarthy DW, Shefer RE, Klinkowstein RE, Bass LA, Margeneau WH, Cutler CS. et al. Efficient production of high specific activity 64Cu using a biomedical cyclotron. Nucl Med Biol. 1997;24:35-43
25. Pichler BJ, Kneilling M, Haubner R, Braumuller H, Schwaiger M, Rocken M. et al. Imaging of delayed-type hypersensitivity reaction by PET and 18F-galacto-RGD. J Nucl Med. 2005;46:184-9
26. Kneilling M, Hultner L, Pichler BJ, Mailhammer R, Morawietz L, Solomon S. et al. Targeted mast cell silencing protects against joint destruction and angiogenesis in experimental arthritis in mice. Arthritis Rheum. 2007;56:1806-16
27. Bruck J, Pascolo S, Fuchs K, Kellerer C, Glocova I, Geisel J. et al. Cholesterol Modification of p40-Specific Small Interfering RNA Enables Therapeutic Targeting of Dendritic Cells. J Immunol. 2015;195:2216-23
28. Davies G, Rolle AM, Maurer A, Spycher PR, Schillinger C, Solouk-Saran D. et al. Towards Translational ImmunoPET/MR Imaging of Invasive Pulmonary Aspergillosis: The Humanised Monoclonal Antibody JF5 Detects Aspergillus Lung Infections In vivo. Theranostics. 2017;7:3398-414
29. Constantinescu CC, Mukherjee J. Performance evaluation of an Inveon PET preclinical scanner. Phys Med Biol. 2009;54:2885-99
30. Monaghan M, Holeiter M, Brauchle E, Layland S, Lu Y, Deb A. et al. Exogenous miR-29B delivery via a hyaluronan-based injectable system yields functional maintenance of the infarcted myocardium; 2017.
31. Votteler M, Carvajal Berrio DA, Pudlas M, Walles H, Stock UA, Schenke-Layland K. Raman spectroscopy for the non-contact and non-destructive monitoring of collagen damage within tissues. Journal of biophotonics. 2012;5:47-56
32. Schenke-Layland K, Stock UA, Nsair A, Xie J, Angelis E, Fonseca CG. et al. Cardiomyopathy is associated with structural remodelling of heart valve extracellular matrix. Eur Heart J. 2009;30:2254-65
33. Schenke-Layland K, Riemann I, Opitz F, Konig K, Halbhuber KJ, Stock UA. Comparative study of cellular and extracellular matrix composition of native and tissue engineered heart valves. Matrix Biol. 2004;23:113-25
34. Russell HK Jr. A modification of Movat's pentachrome stain. Archives of pathology. 1972;94:187-91
35. Manders EMM, Verbeek FJ, Aten JA. Measurement of Colocalization of Objects in Dual-Color Confocal Images. J Microsc-Oxford. 1993;169:375-82
36. Kehrel B, Wierwille S, Clemetson KJ, Anders O, Steiner M, Graham Knight C. et al. Glycoprotein VI Is a Major Collagen Receptor for Platelet Activation: It Recognizes the Platelet-Activating Quaternary Structure of Collagen, Whereas CD36, Glycoprotein IIb/IIIa, and von Willebrand Factor Do Not. Blood. 1998;91:491-9
37. Massberg S, Konrad I, Bultmann A, Schulz C, Munch G, Peluso M. et al. Soluble glycoprotein VI dimer inhibits platelet adhesion and aggregation to the injured vessel wall in vivo. FASEB J. 2004;18:397-9
38. Bigalke B, Pohlmeyer I, Schonberger T, Griessinger CM, Ungerer M, Botnar RM. et al. Imaging of injured and atherosclerotic arteries in mice using fluorescence-labeled glycoprotein VI-Fc. Eur J Radiol. 2011;79:e63-9
39. Schulz C, Penz S, Hoffmann C, Langer H, Gillitzer A, Schneider S. et al. Platelet GPVI binds to collagenous structures in the core region of human atheromatous plaque and is critical for atheroprogression in vivo. Basic Res Cardiol. 2008;103:356-67
40. Di Bartolo N, Sargeson AM, Smith SV. New 64Cu PET imaging agents for personalised medicine and drug development using the hexa-aza cage, SarAr. Org Biomol Chem. 2006;4:3350-7
41. Stasiuk GJ, Long NJ. The ubiquitous DOTA and its derivatives: the impact of 1,4,7,10-tetraazacyclododecane-1,4,7,10-tetraacetic acid on biomedical imaging. Chem Commun (Camb). 2013;49:2732-46
42. Fuchs K, Kohlhofer U, Quintanilla-Martinez L, Lamparter D, Kotter I, Reischl G. et al. In vivo imaging of cell proliferation enables the detection of the extent of experimental rheumatoid arthritis by 3'-deoxy-3'-18f-fluorothymidine and small-animal PET. J Nucl Med. 2013;54:151-8
43. Borrero CG, Mountz JM, Mountz JD. Emerging MRI methods in rheumatoid arthritis. Nat Rev Rheumatol. 2011;7:85-95
44. Lee DM, Weinblatt ME. Rheumatoid arthritis. Lancet. 2001;358:903-11
45. Klareskog L, Catrina AI, Paget S. Rheumatoid arthritis. Lancet. 2009;373:659-72
46. vanHelden HPM, Kuijpers WC, Steenvoorden D, Go C, Bruijnzeel PLB, vanEijk M. et al. Intratracheal aerosolization of endotoxin (LPS) in the rat: A comprehensive animal model to study adult (acute) respiratory distress syndrome. Exp Lung Res. 1997;23:297-316
47. Li H, Du S, Yang L, Chen Y, Huang W, Zhang R. et al. Rapid pulmonary fibrosis induced by acute lung injury via a lipopolysaccharide three-hit regimen. Innate Immun. 2009;15:143-54
48. Constantinescu CS, Farooqi N, O'Brien K, Gran B. Experimental autoimmune encephalomyelitis (EAE) as a model for multiple sclerosis (MS). Br J Pharmacol. 2011;164:1079-106
49. Mohan H, Krumbholz M, Sharma R, Eisele S, Junker A, Sixt M. et al. Extracellular matrix in multiple sclerosis lesions: Fibrillar collagens, biglycan and decorin are upregulated and associated with infiltrating immune cells. Brain Pathol. 2010;20:966-75
Author contact
![]() Corresponding author: Nicolas Beziere, Werner Siemens Imaging Center, Department of Preclinical Imaging and Radiopharmacy, Eberhard Karls University Tübingen, 72076 Tübingen, Germany. Email: nicolas.beziereuni-tuebingen.de
Corresponding author: Nicolas Beziere, Werner Siemens Imaging Center, Department of Preclinical Imaging and Radiopharmacy, Eberhard Karls University Tübingen, 72076 Tübingen, Germany. Email: nicolas.beziereuni-tuebingen.de