Impact Factor
 Global reach, higher impact
Theranostics 2019; 9(10):2827-2842. doi:10.7150/thno.33823 This issue Cite
Research Paper
Dual-modality optical diagnosis for precise in vivo identification of tumors in neurosurgery
Mingyu Zhu1#, Wei Chang1#, Linkai Jing2#, Yingwei Fan1, Ping Liang2, Xinran Zhang1, Guihuai Wang2 ![]() , Hongen Liao1
, Hongen Liao1 ![]()
1. Department of Biomedical Engineering, School of Medicine, Tsinghua University, Beijing 100084, China
2. Department of Neurosurgery, Beijing Tsinghua Changgung Hospital, Beijing 102218, China
# These authors contributed equally to this manuscript.
Received 2019-2-3; Accepted 2019-3-9; Published 2019-4-13
Abstract

In neurosurgery, the precise diagnosis and treatment of tumor diseases are challenging to realize. Current clinical diagnoses lack fast and accurate intraoperative information. Therefore, the development of new methods and techniques to assist neurosurgeons intraoperatively is necessary. Optical diagnosis is a promising method to provide accurate information about biological tissues in a short time. Therefore, in this study, we proposed a dual-modality optical diagnostic method through point-to-face registration fusion in the optical system. We incorporated quantitative autofluorescence spectroscopy and optical coherence tomography (OCT) and evaluated our methods in an animal model.
Methods: A mouse model consisting of 16 nude mice was built by injecting the mouse brains with human glioma cells. Preoperative bioluminescence imaging was used to evaluate the growth states of tumors and locate the tumor sites. Quantitative autofluorescence spectroscopy, which provided local biochemical information with single-point detection, and OCT, which provided relatively global structural information with en face mapping scanning, were combined using the point-to-face registration fusion method to provide precise diagnostic information for identifying the brain tumors. Postoperative pathology was performed to evaluate the sensitivity and specificity of optical diagnosis.
Results: Ex vivo quantitative autofluorescence spectroscopy and OCT imaging were first performed in eight mice to acquire the optimal measuring parameters for tumor staging and identification. We then performed in vivo quantitative autofluorescence spectroscopy and OCT imaging. The results showed that tumor staging could be realized through quantitative autofluorescence spectroscopy, and fusion images could be used to precisely identify tumors. The autofluorescence spectral map, OCT en face map, and fused diagnostic map had average sensitivities of 91.7%, 86.1%, and 95.9% and specificities of 93.2%, 96.0%, and 88.7%, respectively, for tumor identification.
Conclusion: The dual-modality optical point-to-face registration fusion method and system we proposed could provide both biochemical information and structural information. The in vivo experimental results validated that the sensitivity (95.9%) of the fused map was higher than that of either single diagnostic modality (86.1% or 91.7%). Tumor staging was realized through quantitative autofluorescence spectroscopy. The proposed method will be applicable to future intelligent theranostic systems and improve many clinical neurosurgeries.
Keywords: dual-modality optical diagnosis, quantitative autofluorescence spectroscopy, optical coherence tomography, neurosurgery, brain tumor
Introduction
In neurosurgery, brain tumors are one of the most threatening diseases affecting human health. It is estimated that 250,000 primary brain tumors occur per year all over the world, and the five-year survival rate is approximately 30% [1]. Currently, surgical resection is the best way to treat most tumors in neurosurgery [2]. It is important for surgeons to resect tumors completely to reduce tumor recurrence. On the other hand, the function of the normal brain is important; thus, the intraoperative protection of normal tissues is also essential. Achieving both goals intraoperatively is difficult for surgeons.
In current clinical practice, the intraoperative diagnosis and treatment of tumors mainly depend on the experience of surgeons [3]. However, due to the vague boundary between tumors and normal tissues, incomplete resection of tumors usually occurs [4]. Auxiliary methods such as intraoperative ultrasound imaging or frozen biopsy analysis are difficult to provide precise pathological information of tissues in a short time. Therefore, new methods and techniques that are able to provide precise intraoperative diagnostic information on tumors are urgently needed.
Optical biopsy methods, such as fluorescence spectroscopy and optical coherence tomography (OCT), are a promising approach for achieving the fast and accurate diagnosis of tissues [5]. These methods utilize the interaction between light and the examined tissues to acquire the optical properties of the latter and further determine their biochemical or structural properties. Many types of research have been carried out to validate the efficiency of different optical diagnostic methods [6].
For fluorescence spectroscopy, Stummer et al. [7,8] first conducted a phase III trial to evaluate the resection of malignant gliomas using fluorescence-guided surgery with 5-aminolevulinic acid (5-ALA). The results showed that fluorescence derived from 5-ALA enables more complete resection of tumors. Liao et al. [9-11] combined 5-ALA-induced fluorescence with laser ablation to treat brain tumors. The results showed that the system worked well for the precise diagnosis and treatment of brain tumors. Lazarides et al. [12] also proposed a fluorescence-guided laser ablation system for removing residual cancer. Fluorescence imaging was used as a depth-estimation tool. Schebesch et al. [13,14] showed that fluorescein sodium (NaFL) was safe and effective for guiding the resection of brain tumors. However, diagnostic methods using extrinsic fluorophores may face problems for low-grade tumors. Another way to distinguish different tissues using intrinsic fluorophores instead of extrinsic fluorophores is autofluorescence spectroscopy. Because tumors and normal tissues have different contents of intrinsic fluorophores, such as proteins, collagen, and lipids, some spectral parameters can be used to judge the properties of tissues. Nguyen et al. [15] used near-infrared autofluorescence spectroscopy to analyze the margin of soft tissue sarcomas and obtained an accuracy of 88% for tumor classification. Croce et al. [16] used autofluorescence emission under excitation at 366 nm to discriminate different liver tissues and suggested that autofluorescence-based optical biopsy techniques could be used for the real-time diagnosis of liver diseases. In our previous study, we applied autofluorescence spectroscopy to classify different types of spinal cord tumors [17]. The results showed that autofluorescence spectroscopy could be used for the diagnosis of tumors in neurosurgery.
OCT, a label-free, radiation-free and high-speed imaging tool, is an emerging in vivo imaging modality widely used in ophthalmology and dermatology [18]. By measuring the echoes of backscattered light, OCT shows the internal structural information of biological tissues with cross-sectional and three-dimensional images. Due to its noninvasive, noncontact and high-resolution features, OCT is suitable for intraoperatively discriminating the tumorous areas from the normal areas in neurosurgery [19,20]. Jeon et al. [21] and Lopez et al. [22] used OCT to differentiate gray matter from white matter to study the feasibility of deep-brain stimulation probe guidance. Böhringer et al. [23] demonstrated that OCT could discriminate normal brain, areas of tumor-infiltrated brain, solid tumor, and necrosis. Bizheva et al. [24] imaged the brain morphology of animal models with ultrahigh-resolution OCT. Boppart et al. [25] constructed a pen-sized handheld surgical imaging probe and evaluated the feasibility of using OCT as a real-time intraoperative imaging technique to identify an intracortical melanoma. Kut et al. [26] used OCT to detect and quantitatively differentiate cancerous tissues from noncancerous tissues in human brain models. To discriminate tumors and identify the tumor margin, methods with cross-sectional characteristics [27,28], en face characteristics [29] and cross-referencing optical characteristics were proposed [30]. Research has demonstrated that intraoperative brain tumor diagnosis using OCT is effective.
However, single-modality optical methods do not easily satisfy the precise diagnostic requirements of tumors in neurosurgery. Thus, methods and systems based on multimodality optical information have been proposed [31]. Kantelhardt et al. [32] first applied multiphoton and fluorescence lifetime imaging for in vivo imaging during neurosurgical procedures. Jermyn et al. [33] combined intrinsic fluorescence spectroscopy, diffuse reflectance spectroscopy and Raman spectroscopy for intraoperative cancer detection, and the experimental results showed high diagnostic accuracy. Mohs et al. [34] developed a handheld spectroscopic device based on fluorescence and surface-enhanced Raman scattering for in vivo tumor detection. However, the imaging view of their methods was limited. Barton et al. [35] and Hariri et al. [36] applied endoscopic OCT-LIF (OCT-laser-induced fluorescence spectroscopy) to a murine colon cancer model and successfully identified the cancerous regions from the normal tissues. Jung et al. [37] and Ryu et al. [38] proposed a dual-channel fiber scanning probe to obtain the swept source OCT (SS-OCT) images and the fluorescence spectrum simultaneously. Barton et al. [39] compared the B-scan OCT images with a line of light spots of fluorescence spectrum along the OCT scanning line. However, the two kinds of information were not combined to provide diagnostic results. Fan et al. [40] used bioluminescence imaging and two-photon microscopy to guide the laser ablation of brain tumors. The experimental results suggest that the proposed method could extend the lifetime of mice used for the model, but there is a lack of structural depth information.
OCT provides information on the micrometer-level microstructure of biological tissues based on optical characteristics, while quantitative autofluorescence spectroscopy reveals the differences in the biochemical composition of the tissue. By combining these two modalities, better functional and structural diagnosis can possibly be obtained than either modality alone. Therefore, in this study, we developed a precise point-to-face registration-based dual-modality optical diagnostic method for brain tumors and normal tissues in neurosurgery. An in vivo quantitative autofluorescence spectroscopy measurement module and an OCT module were established. We established a batch of mouse models with brain tumors and used bioluminescence imaging to provide preoperative information. The quantitative autofluorescence spectroscopy and OCT imaging were performed, and their information was combined to provide a precise diagnostic map. Pathological information was used to evaluate the effectiveness of our proposed method. Our main contributions include three aspects:
1) Previous studies have only combined several points of fluorescence information with OCT to provide diagnostic results, which were difficult for surgeons to judge the tumor margin and stage precisely. In this study, we proposed a point-to-face registration-based dual-modality optical diagnostic method, which could provide a precise 2-D diagnostic map containing both biochemical and structural information of tissues for surgeons. Thus, the information provided by our method is more comprehensive and accurate.
2) Compared with current techniques that were used in neurosurgery such as the frozen-biopsy method and fluorescence imaging, our method was able to provide more quantitative and robust diagnostic results in a short time.
3) The proposed method is universal and easy to use in similar optical diagnostic systems. We believe that our work will be of great worth for intraoperative guidance and future intelligent theranostic system in neurosurgery.
Methods
Optical diagnosis system flowchart
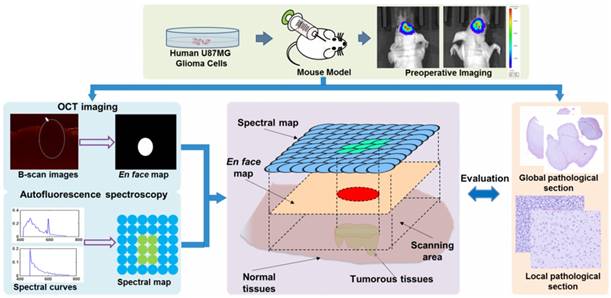
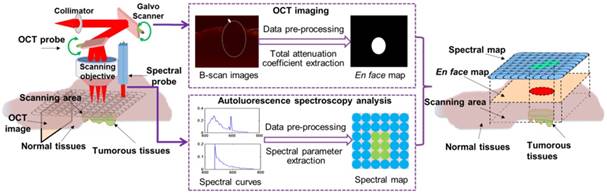
The flowchart of our study is shown in Figure 1. We built a murine model by injecting U87MG human glioma cells into the brain of a mouse. Before surgery, bioluminescence imaging was used to evaluate the growth state of the tumor and to locate the tumor sites. During surgery, in vivo quantitative autofluorescence spectroscopy and OCT information was acquired and combined to help surgeons judge the properties of the tissues. Quantitative autofluorescence spectroscopy mainly provided precise local biochemical information, while OCT mainly provided global structural information of tissues. The postoperative pathology was used to evaluate the fast optical diagnosis.
The research flowchart of the proposed point-to-face registration-based dual-modality optical diagnostic method for precise identification of tumors in neurosurgery.
Animal model establishment
In total, 16 female BALB/c-Nu nude mice at 6-8 weeks of age were used to establish the brain tumor model. The laboratory animal facility was accredited by AAALAC (Association for Assessment and Accreditation of Laboratory Animal Care International), and the IACUC (Institutional Animal Care and Use Committee) of Tsinghua University approved all animal protocols (No. 17-LHE1 and No. 18-LHE1) used in this study.
A human U87MG glioma cell line labeled with the luciferase gene was acquired. Before cell injection, the weight of each nude mouse was recorded. Anesthesia was performed using 0.4% pentobarbital sodium at a dose of 16 μL/g. After anesthesia, the mouse was placed on a stereotaxic frame. An incision with a diameter of 5 mm was made, and craniotomy was performed. A 7 μL cell suspension containing approximately 5×10⁵ cells was injected into the cortex of the parietal lobe approximately 1 mm below the skin. Then, the opening in the skull was closed using bone wax, and the wound was sutured. After injection, the nude mice were maintained under sterile conditions for two weeks.
We also established another C6 rat model for the evaluation of our method. In total, eight male SD rats at 6-8 weeks of age were used. Anesthesia was performed using 3% pentobarbital sodium at a dose of 10 μL/g, and a 10 μL cell suspension containing approximately 5×10⁵ C6 cells was injected into the cortex of the parietal lobe. After injection, the rats were maintained under sterile conditions for eight days.
Bioluminescence imaging module
Bioluminescence imaging was used to evaluate the growth states of tumors and provide preoperative information before surgery. Before bioluminescence imaging, the weight of each mouse was recorded. Then, a 15 mg/mL D-luciferin potassium salt solution in D-PBS (Dulbecco's phosphate-buffered saline, without Mg2+ and Ca2+) was intraperitoneally injected into the mouse at a dose of 10 μL/g ten minutes before imaging. Afterwards, bioluminescence imaging was performed to locate the tumor sites and guide the surgeons in making the treatment plan.
In vivo quantitative autofluorescence spectroscopy module
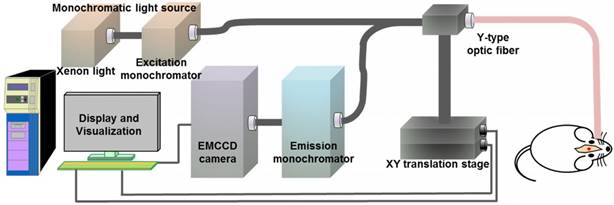
The quantitative autofluorescence spectroscopy module mainly consisted of a 150-W xenon light source, an excitation monochromator (Omni-3028i; Zolix Instrument, Beijing, China), a 6-around-1 Y-type fiber-optic probe (QR400-7-SR; Ocean Optics, Florida, USA), an X-Y motorized precision translation stage (GCD-202050M; Daheng Optics, Beijing, China), an emission monochromator, an electron-multiplying charge-coupled device (EMCCD) camera (iXon Ultra 888; Andor Technology, Oxford, UK) and a data acquisition device, as shown in Figure 2.
The configuration of the in vivo quantitative autofluorescence spectroscopy module.
To provide precise information about the stage and boundary of the tumor, some preliminary ex vivo experiments were necessary. We set the excitation wavelength to vary from 300 nm to 450 nm at 10-nm increments and acquired the excitation-emission matrixes (EEM) of the tumorous and normal tissues. Then, we were able to obtain the optimal excitation bands by calculating the peak intensity ratios and analyzing the difference between tumorous and normal tissues. In vivo measurements and diagnoses were performed using these excitation wavelengths. Dark noise was recorded for data analysis, and the spectrum at 300-nm excitation was measured again at the end of each measurement to determine if photobleaching occurred.
SS-OCT module
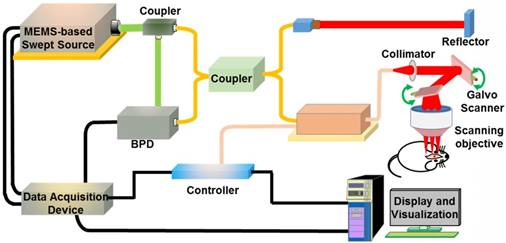
We used SS-OCT to image the brain tissues. The SS-OCT module consisted of a MEMS-based swept source (HSL-20-100-B, Santec Technologies, central wavelength: 1310 nm; power: 20 mW; bandwidth: 80 nm), a balanced photodetector (Thorlabs, INT-MSI-1300B), a data acquisition device (ATS9350, Alarztec Technologies, sampling rate: 500 M/s) and other components. The OCT equipment could provide images with 12 μm axial resolution and 22 μm lateral resolution. The depth of field of the OCT scanning objective lens was  0.8 mm. A schematic of the SS-OCT module is shown in Figure 3.
Schematic of the SS-OCT module. A 2-D galvo scanner was used. BPD: balanced photodetector.
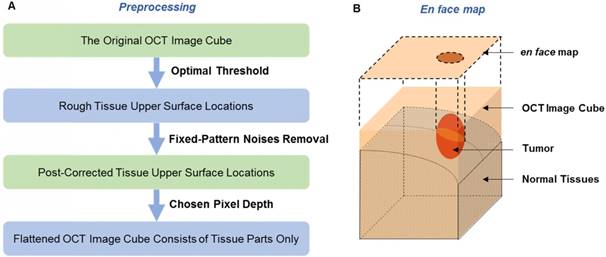
A series of image preprocessing procedures were conducted to prepare the original images for en face map acquisition (Figure 4(A)). First, to distinguish the tissue parts from the aerial parts in each OCT image, we set a proximate threshold to find the tissue upper surface locations and saved them in a 2-D matrix. Second, to remove the fixed-pattern noises and correct the locations, we compared the value of each location with the values of its four neighboring locations to identify the abnormal mutations. Third, based on the upper surface locations, we saved the data of tissue parts along the upper surface with one chosen thickness (every A-scan had the same pixels). This way, the prepared OCT data showed roughly the same physical depth as that of tissues. During the imaging process, we tried to set the position of the brain to make the imaging plane horizontal in order to weaken the intensity change caused by the difference in imaging distance.
(A) The preprocessing procedure. (B) The en face map of an OCT image cube; the tumor position is shown in the 2-D mode.
We used a simplified exponential function [26] to express the signal intensity along the depth:
(2-1)
where  is the tissue pixel depth from the surface, A is the overall coefficient,
  is the backscattering coefficient,
  is the total attenuation coefficient, multiplier 2 is the round-trip travel of light in the tissue, and
  is the point spread function. Based on the function (2-1), we obtained the en face map (Figure 4(B)) of the total attenuation coefficient extracted from each A-scan using the FD (frequency-domain) method [29]. In this method, the ratio of the discrete Fourier transform of normalized signal intensities on any two harmonics was used to calculate the total attenuation coefficient. The intensity was normalized by a phantom, and the discriminating capability of this method was insensitive to the phantom coefficient. The attenuation coefficient of each A-scan data point along the imaging depth was calculated separately.
Point-to-face registration-based dual-modality information fusion and evaluation
The autofluorescence spectral map that provided local biochemical information was matched with the OCT en face map that provided global structural information, as shown in Figure 5. After craniotomy, the tumorous area was exposed. We used India ink to label several points to ensure that the scanning area for quantitative autofluorescence spectroscopy and OCT was consistent. Then, spectral data scanning and OCT imaging were performed. The spectral data of the area were acquired and processed including dark noise subtraction and normalization. Some featured spectral parameters were extracted, and binary classification was performed to generate a spectral map of the tissue surface. The OCT images were also processed as described above, and an en face map was generated. The spectral information was mapped to the global OCT information after data scanning.
The framework of quantitative autofluorescence spectroscopy and OCT information fusion based on the point-to-face registration fusion method.
During the information fusion process, the final diagnostic map was acquired by calculating the union set of the spectral map and the en face map. The intersection of the two maps was considered the central part of the tumorous tissues, and the other parts were considered tumors either by quantitative autofluorescence spectroscopy alone or by OCT alone.
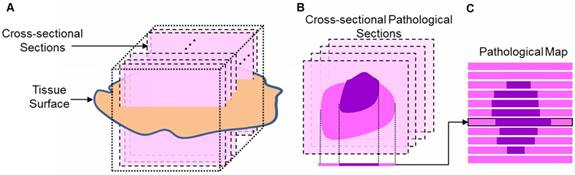
To evaluate the actual area of the tumor, we calculated the tumorous area in pathology by an approximation method (Figure 6). The whole brain was frozen, and the imaging target region was cut along the mark of India ink to minimize the deformation. Then, the tissue was embedded in a wax block, yielding dozens of cross-sectional pathological sections that were almost uniformly distributed. We regarded the rectangular region around the section as having the same pathological features as the section and got the approximate pathological map. The tumorous area on the OCT en face map, the diagnostic lattice of autofluorescence spectroscopy and the fused map were outlined by the surgeon and compared with the pathological map to calculate the sensitivity (the proportion of the actual tumorous part that was correctly identified) and specificity (the proportion of the actual normal part that was correctly identified).
(A) The diagram of cutting pathological sections. (B) The cross-sectional pathological section and its corresponding rectangle. (C) The pathological map.
Results
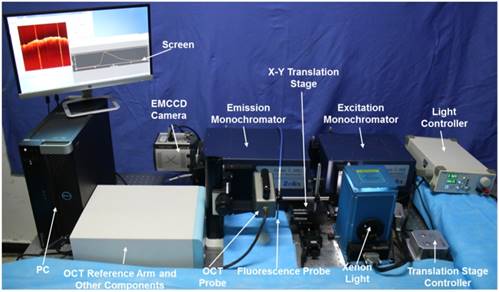
The whole optical measurement system, including the autofluorescence spectral scanning module and the OCT module, is shown in Figure 7.
The dual-modality optical diagnostic system containing the quantitative autofluorescence spectroscopy module and the OCT module.
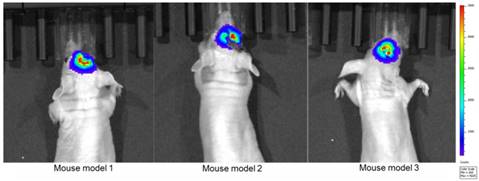
We first established the tumor mouse model and maintained these 16 mice for two weeks in the experimental animal center of Tsinghua University. We divided these mice into two groups: the first group contained eight mice for ex vivo quantitative autofluorescence spectroscopy and OCT imaging to acquire the optimal detecting parameter; the second group contained eight mice for in vivo measurement and information fusion to evaluate the proposed method. Before surgery, all mice were examined in the bioluminescence imaging system (IVIS Spectrum, PerkinElmer, USA) to locate the tumor and evaluate its size (Figure 8). After bioluminescence imaging, craniotomy was performed by the neurosurgeon, and the tumorous areas were exposed for subsequent measurements. The bioluminescence lasted for 2-3 h after the injection of luciferin. We acquired the optical information three hours after the bioluminescence imaging to avoid the influence of the bioluminescence.
Bioluminescence imaging after two weeks of tumor cell injection.
Quantitative autofluorescence spectroscopy measurement
We set up the quantitative autofluorescence spectroscopy module as shown in Figure 7. To acquire the optimal spectral parameters for differentiating tumorous tissues from normal tissues, we conducted ex vivo measurement experiments. We obtained some normal and tumorous tissues, and the properties of these tissues were validated by pathological diagnosis.
During the measurement process, the integration time of the EMCCD camera was set to 0.5 s, the EM (electron-multiplying) gain was set to 10 times, and the cryogenic temperature was set to -60°C. The EEMs of the normal and tumorous tissues are shown in Figure 9(A)-(B). From the EEMs, we saw that the two types of tissues had different spectral properties. To quantitatively distinguish tumors from normal tissues, we extracted some featured emission peaks and calculated the peak intensity ratios. The emission spectra at excitation wavelengths of 380 nm and 450 nm are shown in Figure 9(C)-(D).
(A) EEM of the brain tissue. (B) EEM of the tumorous tissue. (C) Spectral curves at 380 nm excitation. The emitted photon numbers of normal tissues and tumorous tissues at the emission wavelength of 462 nm were approximately 4000 and 2000, respectively; the emitted photon numbers of normal tissues and tumorous tissues at the emission wavelength of 614 nm were approximately 2000 and 4000, respectively. (D) Spectral curves at 450 nm excitation. The emitted photon numbers of normal tissues and tumorous tissues at the emission wavelength of 550 nm were approximately 1500 and 800, respectively; the emitted photon numbers of normal tissues and tumorous tissues at the emission wavelength of 612 nm were approximately 1000 and 2000, respectively. (E) Distribution of R1. (F) Distribution of R2.
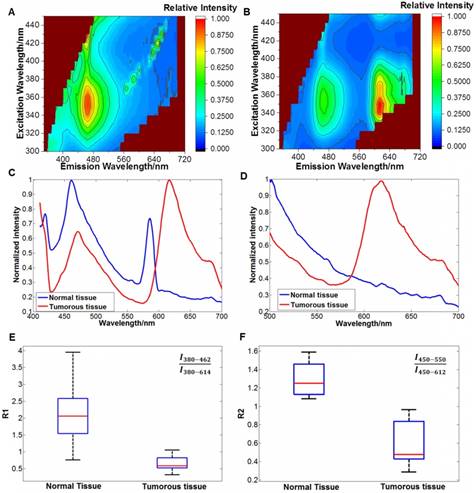
We then extracted the intensity ratios, R1: I380-462/ I380-614 (I380-462 indicates the intensity at the emission wavelength of 462 nm when excited by 380 nm) and R2: I450-550/I450-612. The distributions of the two ratios are shown in Figure 9(E)-(F). Tumorous tissues showed low R1 and R2 values (<1), while normal tissues showed high R1 and R2 values (>1). These two ratios were used as the featured parameters for subsequent tumor boundary division. The main reason for the different spectral properties of tumorous and brain tissues might be the different contents of intrinsic fluorophores [41], such as collagen or flavins. Different studies have reported different optimal bands and parameters for brain tumor identification [42,43], possibly because the tumor type and the measurement mode were different.
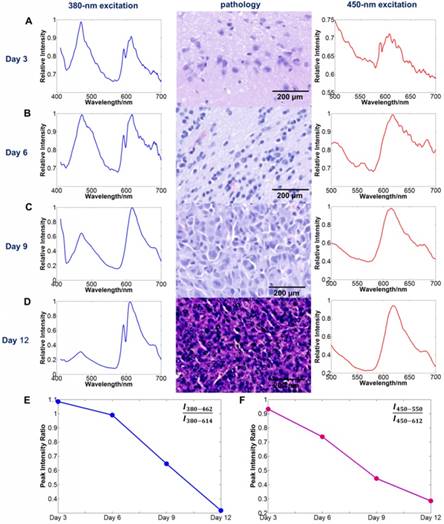
To determine the relationship between quantitative autofluorescence spectroscopy and tumor stage, we performed the spectral measurement using two mice in the first group at each time every three days after the tumor cell injection. We acquired the spectral information of the tumors at excitation wavelengths of 380 nm and 450 nm. For each mouse, at least three tumorous points were measured for spectral analysis. Then, we extracted the peak intensity ratios from each data and averaged them for further analysis. The results are shown in Figure 10. As the tumor stage increased, the featured parameters R1 and R2 trended downward.
The relationship between the tumor stage and quantitative autofluorescence spectroscopy. (A-D) The average spectral curves and the corresponding pathology three, six, nine and 12 days after tumor cell injection. (E, F) The trends of the average spectral parameters R1 and R2 with increasing tumor stage.
OCT image processing
By imaging the tumor in a 5 mm  5 mm square region, we obtained an image cube with a size of 250 (A-scan)
  500 (B-scan)
  200 (C-scan) pixels. The imaging depth was approximately 2 mm, as measured by the pixels of the longitudinal sectional photograph of the tissues. To further remove the fixed-pattern noises around the corner and confirm that all the A-scan data have enough depth to be flattened, we manually cropped the image into a 250
  341
341  180 cube with all the tumorous regions. In the 3-D OCT cube rendered by triangle patches, the tumor resembled a hump that was conspicuously higher than the normal surrounding tissues, corresponding to the tumorous region visible by the naked eye. The greatest height of the tumor out of the normal tissue was approximately 0.8 mm. The height difference caused by the natural unevenness of the whole brain reached 1.5 mm. During the imaging process, we found that the attenuation coefficient difference had already appeared when the tumor height was very small. That means in our experiment, the difference in the attenuation coefficient had little relationship with its height, and the intensity change caused by the height of tumor was acceptable within the whole image.
Preprocessing of the OCT image
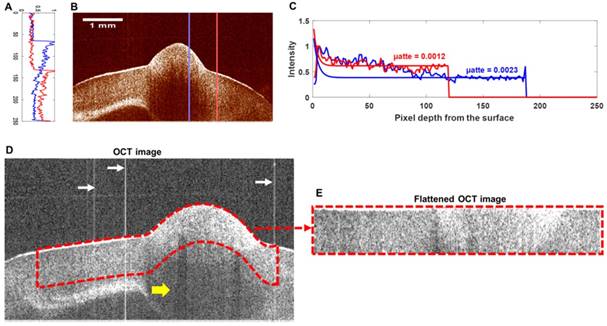
A cross-sectional OCT image is shown in Figure 11(B). By exponentially fitting the A-scan intensity curves in the tumorous region (blue curve in Figure 11(A)) and the normal region (red curve in Figure 11(A)), a notable difference in the attenuation coefficient can be observed (Figure 11(C)). After we removed the fixed-pattern noises marked by white arrows in Figure 11(D), we obtained the upper surface of the tissue in the B-scan image. Due to the characteristics of the OCT image, the darker area in Figure 11(D) marked by the yellow arrow was likely to reveal weak light incidence (which was caused by the strong backscattering or back-reflecting tissues above) rather than weak backscattering. Thus, we cropped the most reliable data at a depth of 50 pixels from the surface (region outlined by the red dashes in Figure 11(D)) and flattened them (Figure 11(E)).
(A) The intensity curves of the A-scan data. (B) A cross-sectional OCT image. (C) The intensity curves for the tissue surface and their exponential fitting curves. The blue curves in (A) and (C) correspond to the blue line in (B), and the red curves in (A) and (C) correspond to the red line in (B). The attenuation coefficients of the red curve and blue curve were 0.0012 and 0.0023, respectively. (D) One B-scan OCT image of the cube. (E) Flattened OCT data with a thickness of 50 pixels. The fixed-pattern noises are marked by white arrows.
En face map and threshold selection
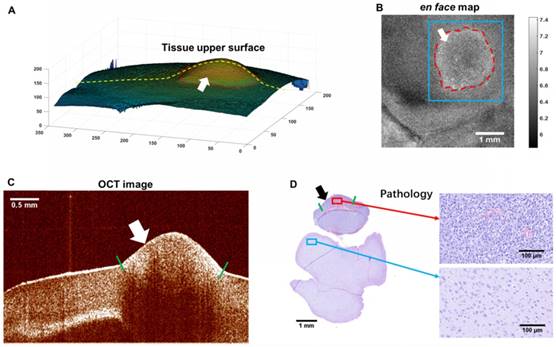
The en face map, which consisted of the total attenuation coefficients of all the A-scan data, is shown in Figure 12(B). The tumorous region outlined by the red dashes showed a higher attenuation coefficient, possibly due to the increased density of the cell nuclei (refer to Figure 12(D)). The pathology (Figure 12(D)) at the same OCT B-scan line showed good agreement with the OCT image (Figure 12(C)).
The en face map of attenuation coefficients and other reference information. (A) Tissue upper surface. (B) The en face map of the OCT image cube. (C) The OCT image corresponding to the yellow line in (A). (D) Pathology corresponding to the image in (C). The tumorous regions are marked by arrows. The tumor margins on the tissue surface were visible to the naked eye and were marked by the surgeon using India ink, as shown by the red dashes in (A) and (B), and short green lines in (C) and (D).
To improve the diagnostic results of the OCT en face map, we cropped the target area (the blue square region in Figure 13(A)) around the tumor. The binary map of the target area was calculated separately with nine thresholds and is shown in Figure 13(B). To choose the best threshold, the diagnostic decisions made by the surgeon were analyzed by pathology, and the results are shown as the sensitivity (blue)/specificity (red) curves and ROC (receiver operating characteristic) curve in Figure 13(C) and Figure 13(D), respectively. The largest area of the rectangle under the ROC curve appeared at the point where the threshold equaled 6.6. Thus, we chose a threshold of 6.6 with 86.0% sensitivity and the corresponding binary map as the final diagnostic basis. The attenuation coefficient data based on the optimal threshold of 6.6 were calculated and are shown in Table 1.
Binary map processing based on different thresholds. (A) The target area in the en face map. (B) Binary maps under different thresholds. (C) Diagnostic sensitivity (blue)/specificity (red) data. (D) The ROC curve. The binarization was conducted on the region in the inset outlined by blue lines in (A). The largest area of the rectangle under the ROC curve appeared at the point where the threshold equaled 6.6.
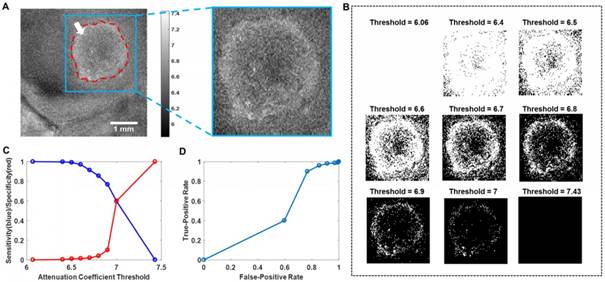
The attenuation coefficient data of the normal and tumorous tissues when threshold = 6.6 and sensitivity = 86%. The diagnostic data are provided by n = 8 nude mice with brain tumors.
| Tissue | n | Mean (mm-1) | SD (mm-1) |
|---|---|---|---|
| Tumorous | 8 | 6.982 | 0.0759 |
| Normal | 8 | 6.285 | 0.0919 |
Optical information fusion and evaluation
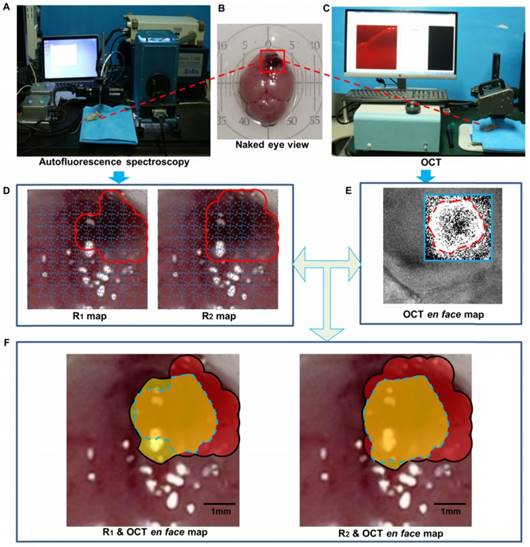
We acquired the autofluorescence spectral information and OCT information in a 5 mm  5 mm square region with tumorous tissues. For quantitative autofluorescence spectroscopy, we acquired the autofluorescence spectral data in the remaining eight mice. The integration time of the EMCCD camera was set to 0.2 s. The diameter of the light spot of the probe was approximately 1 mm. The monochromatic light source produced an irradiance of 25 mW/cm2 on the tissue. The step length of the translation stage was set to 0.5 mm, and the spectral data of 81 points were acquired. During spectral data scanning, emission spectra were recorded from 450 nm to 650 nm at 380 nm excitation and from 500 nm to 650 nm at 450 nm excitation. Then, the R1 and R2 values of each point were calculated and used for information fusion. We considered the regions to be tumorous tissues where the R1 or R2 value was smaller than 1.0. For OCT, we binarized the en face map with the chosen threshold. The single-modality maps and their fused diagnostic map are shown in Figure 14.
The fused map of OCT attenuation information and autofluorescence spectral indexes. (A). In vivo autofluorescence spectral scanning. (B). The naked-eye view of the mouse brain. The target scanning area is marked by the red box. (C). In vivo OCT imaging. (D). The spectral maps of R1 and R2 values of the target areas. (E). The OCT en face map of attenuation. The area outlined by the blue box was further cropped and binarized as the final map. (F). The fused map of the OCT en face map and the spectral maps, overlapped by the real scanning area. The tumorous area identified by OCT is in yellow, the tumorous area identified by autofluorescence is in red, the intersection tumorous area of the two modalities is in orange and is outlined by the blue dashes, and the union area is indicated by the black outline.
By comparing the pathology and the diagnostic decision made by the surgeon, we evaluated the sensitivity and specificity of the OCT en face maps, the autofluorescence spectral maps, and the fused maps of eight mice, as shown in Table 2.
Evaluation of the OCT, quantitative autofluorescence spectroscopy and fused maps. S.D.: standard deviation.
| Mouse No. | OCT en face Map | Autofluorescence R1 | Autofluorescence R1 | R2 & OCT Fused Map | ||||
|---|---|---|---|---|---|---|---|---|
| sensitivity | specificity | sensitivity | specificity | sensitivity | specificity | sensitivity | specificity | |
| 1 | 77.3% | 87.1% | 78.6% | 90.6% | 89.3% | 94.3% | 96.6% | 83.4% |
| 2 | 87.6% | 95.7% | 88.0% | 92.9% | 92.0% | 91.1% | 96.3% | 87.9% |
| 3 | 91.2% | 98.3% | 86.2% | 88.5% | 96.6% | 92.3% | 98.5% | 85.7% |
| 4 | 85.1% | 99.1% | 76.7% | 94.1% | 90.0% | 94.1% | 95.7% | 91.5% |
| 5 | 86.0% | 97.2% | 91.7% | 91.2% | 91.7% | 89.5% | 95.5% | 85.6% |
| 6 | 88.3% | 93.3% | 86.4% | 93.2% | 95.5% | 91.5% | 98.1% | 90.8% |
| 7 | 86.1% | 99.0% | 78.6% | 96.2% | 85.7% | 96.2% | 89.0% | 94.3% |
| 8 | 86.8% | 98.6% | 88.9% | 88.9% | 92.6% | 96.3% | 97.2% | 90.7% |
| Mean | 86.1% | 96.0% | 84.4% | 92.0% | 91.7% | 93.2% | 95.9% | 88.7% |
| S.D. | 0.037 | 0.039 | 0.052 | 0.025 | 0.032 | 0.023 | 0.028 | 0.034 |
Detection based on the R2 value performed better than detection based on the R1 value; thus, we evaluated the fusion map composed of the R2 values and the OCT map. The fused map showed a higher sensitivity and lower specificity than did the OCT en face map or the quantitative autofluorescence spectral map alone. The average diagnostic sensitivity and specificity of the fused map were 95.9% and 88.7%, respectively.
Discussion
Brain tumors are challenging for neurosurgeons, and one possible reason may be the lack of intraoperative diagnostic information. Currently, different kinds of optical methods have the potential to provide intraoperative information, but they have their own disadvantages. Thus, we have proposed a point-to-face registration-based dual-modality optical method for the diagnosis of tumors in neurosurgery. We combined autofluorescence biochemical information with global OCT structural information to locate the tumor and identify its boundary. We established an animal model and conducted in vivo measurement experiments to evaluate the performance of our method. The fusion of the quantitative autofluorescence spectral map and the OCT en face map provides an accurate and comprehensive diagnosis of tumors, as our results have shown.
The sensitivity of the fusion map is improved compared to that of the OCT en face map or the autofluorescence map alone, while the specificity shows an obvious decline. This phenomenon is possibly due to the low resolution of quantitative autofluorescence spectroscopy compared to that of OCT; thus, normal areas near the tumor boundary are considered tumors by quantitative autofluorescence spectroscopy, leading to the decline in the final specificity. Although properly extending the resection areas is helpful in the treatment of some brain tumors, the resolution of the autofluorescence spectroscopy system (1 mm) still needs improvement. Therefore, in the future, we will improve the resolution of the autofluorescence spectroscopy system by developing new probes and scanning modes.
To evaluate whether our proposed method could be used in other tumor models and compare our method with the fluorescence imaging that has been studied for a long time in neurosurgery [44], we built another C6 rat model and used NaFL for fluorescence imaging. We chose NaFL for fluorescence imaging mainly because NaFL has been widely used in clinical surgery [14,45]. The drug was administered by intravenous injection, which was more feasible in the animal model. We acquired the optical information four and eight days after tumor cell injection. For fluorescence imaging, we injected the NaFL solution into the tail vein around one hour before the craniotomy at the dose of 10 mg/kg. After craniotomy, we performed fluorescence imaging using a stereoscopic fluorescence microscope (MZ10F, Leica, Germany). We then acquired the dual-modality optical information after fluorescence imaging. Pathology was finally performed to evaluate and contrast the two methods. The results using the two diagnostic methods are shown in Figure 15. It can be seen that the fluorescence imaging four days after tumor cell injection could not easily identify the tumorous area, while the fluorescence imaging eight days after tumor cell injection was clearer.
The comparison between fluorescence imaging and our proposed method in the C6 rat model four and eight days after tumor cell injection. (A, B) The diagnostic results by fluorescence imaging. The tumorous regions are marked by the green dashes. (C, D) The fused maps overlapped by the white-light image. The tumorous regions are marked by the orange dashes.
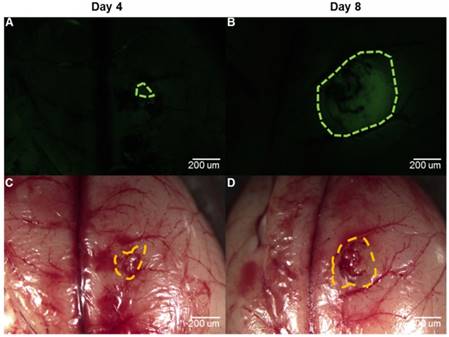
The quantitative evaluation of the two methods is given in Table 3. It can be seen that the sensitivity of the fluorescence imaging four days after tumor cell injection was much lower than that of our proposed method, while the sensitivity eight days after tumor cell injection was almost equal to that of our method. The specificity of the fluorescence imaging four days after tumor cell injection was higher than that of our method, while the specificity eight days after tumor cell injection was much lower than that of our method.
Evaluation of fluorescence imaging and the proposed dual-modality diagnostic method.
| Method | Speed (s) | Sensitivity | Specificity | |||
|---|---|---|---|---|---|---|
| Day 4 | Day 8 | Day 4 | Day 8 | |||
| Fluorescence imaging | 2 | 83.5% | 97.1% | 96.2% | 81.2% | |
| Dual-modality fused map | 60 | 94.1% | 96.6% | 90.5% | 92.4% | |
The speed of image processing is also an important factor. Fluorescence imaging needs approximately two seconds to yield an image under the proper excitation wavelength. Our proposed method needs three steps to acquire the final fused map. For quantitative autofluorescence spectroscopy, the acquisition of the peak intensity ratio of one point needs approximately 0.5 s, and the time to scan the whole area (81 points) is approximately 40 s. For OCT, the acquisition time of 200 OCT images (250  500 pixels) is approximately four seconds, and the time of image processing to get an en face map is approximately 15 s. For information fusion, the time is within 1 s. Thus, the whole processing time of our method is approximately 60 s.
From the experimental results, we can see that the fluorescence imaging for early-stage brain tumors is unsatisfying. Moreover, the fluorescence imaging for late-stage brain tumors may give some false-positive results, leading to a decreased specificity. The diagnostic results of our proposed method are better for early-stage tumors and late-stage tumors. Our method is faster than the current frozen-biopsy method. Compared with single-modality optical methods such as fluorescence imaging, our method is able to provide more accurate and comprehensive information. Both OCT and autofluorescence spectroscopy are able to realize real-time detection. Thus, in the future, we will improve the data acquisition and analysis speed and incorporate the imaging modules to realize real-time intraoperative diagnosis and reduce the impact of manual data registration.
Some researchers have proposed a dual-modality system that is able to obtain fluorescence spectral information and OCT images simultaneously. Ryu et al. [38] proposed a double-clad combined system, and Barton et al. [39] proposed a combined instrument based on the beam splitter. However, both groups only combined a cross-sectional OCT image with one or several points of fluorescence along the OCT B-scan line. In such a way, the combined information was limited and inconvenient for the surgeon to locate the tumor or to identify the tumor margin. Pahlevaninezhad et al. [46,47] proposed a combined autofluorescence and OCT imaging system for fast in vivo imaging of tissues. However, the autofluorescence imaging module only contained one excitation band; thus, the autofluorescence information was limited and nonquantitative. The fused map we proposed combined an OCT en face map that contained the whole information of a 3-D OCT cube and an autofluorescence spectral lattice that contained dense and overlapped points covering the whole OCT imaging region. In addition, the diagnostic results contained a substantial amount of quantitative information. Thus, we could provide relatively global information and could have the capability to give the surgeon a clear location of the tumor and its margin.
To explain the significance of information fusion, the basic mechanism of autofluorescence spectroscopy and OCT should be considered. The contrast of quantitative autofluorescence spectral information is based on the difference in the biochemical compositions of normal and tumorous tissues. The contrast of OCT images is based on the difference in the optical characteristics of tissues. For example, for the tumorous area, backscattering coefficient and attenuation coefficient may be high, which is mainly caused by an increase in cell density, especially the number of nuclei. Therefore, in our research, the information of the two modalities is complementary:
1) Margin identification by the OCT en face map may face problems when the tumorous regions are infiltrative and transitional. The biochemical composition of this kind of area has changed, and the tissue structure may be unclear. Quantitative autofluorescence spectroscopy is capable of discriminating minor and complex biochemical changes with high sensitivity.
2) The lateral resolution of quantitative autofluorescence spectroscopy depends on the diameter of the light spots and the step length between the spots. This type of resolution is limited by the instrument and can reach millimeter-level, much lower than the micrometer-level resolution of OCT. Therefore, if the tumorous area is small and the light intensity is low, quantitative autofluorescence spectroscopy may misdiagnose the area as normal tissues. In contrast, OCT is capable of discriminating slight structural changes with high resolution and provides precise margin information.
Therefore, by combining two modalities with the point-to-face registration method, we can acquire intraoperative structural and functional information and provide a large imaging view with an appropriate resolution. Considering the high diagnostic accuracy and speed of our proposed method, incorporating automatic therapeutic methods such as laser ablation to realize an intelligent theranostic system will be possible in the future, which will be helpful for neurosurgeons.
Conclusion
In this paper, we have developed a precise point-to-face registration-based optical diagnostic method for fast tumor identification using the dual-modality optical information of quantitative autofluorescence spectroscopy and OCT. In vivo animal experiments validate that the method and system provide a credible tumor location and identify its margin with high sensitivity and specificity compared with pathology. The proposed method is an effective auxiliary tool for the fast and accurate diagnosis of tumors in neurosurgery.
Acknowledgements
This work was supported in part by the National Key Research and Development Program of China (2017YFC0108000), National Natural Science Foundation of China (81427803, 81771940), Beijing Municipal Natural Science Foundation (7172122, L172003), and China Postdoctoral Science Foundation (No. 2018M643846). The authors thank the experimental animal center at Tsinghua University and the Department of Neurosurgery in Beijing Tsinghua Changgung Hospital for their technical support.
Competing Interests
The authors have declared that no competing interest exists.
References
1. Allemani C, Matsuda T, Di Carlo V, Harewood R, Matz M, Nikšić M. et al. Global surveillance of trends in cancer survival 2000-14 (CONCORD-3): analysis of individual records for 37 513 025 patients diagnosed with one of 18 cancers from 322 population-based registries in 71 countries. Lancet. 2018;391:1023-75
2. Asthagiri AR, Pouratian N, Sherman J, Ahmed G, Shaffrey ME. Advances in brain tumor surgery. Neurol Clin. 2007;25:975-1003
3. Garzon-Muvdi T, Kut C, Li X, Chaichana KL. Intraoperative imaging techniques for glioma surgery. Future Oncol. 2017;13:1731-45
4. Hsu S, Quattrone M, Ostrom Q, Ryken TC, Sloan AE, Barnholtz-Sloan JS. Incidence patterns for primary malignant spinal cord gliomas: a Surveillance, Epidemiology, and End Results study. J Neurosurg-Spine. 2011;14:742-7
5. Boppart SA, Brown JQ, Farah CS, Kho E, Marcu L, Saunders CM. et al. Label-free optical imaging technologies for rapid translation and use during intraoperative surgical and tumor margin assessment. J Biomed Opt. 2017;23:021104
6. Valdés PA, Roberts DW, Lu F-K, Golby A. Optical technologies for intraoperative neurosurgical guidance. Neurosurg Focus. 2016;40:E8
7. Stummer W, Novotny A, Stepp H, Goetz C, Bise K, Reulen HJ. Fluorescence-guided resection of glioblastoma multiforme utilizing 5-ALA-induced porphyrins: a prospective study in 52 consecutive patients. J Neurosurg. 2000;93:1003-13
8. Stummer W, Pichlmeier U, Meinel T, Wiestler OD, Zanella F, Reulen H-J. et al. Fluorescence-guided surgery with 5-aminolevulinic acid for resection of malignant glioma: a randomised controlled multicentre phase III trial. Lancet Oncol. 2006;7:392-401
9. Liao H, Shimaya K, Wang K, Maruyama T, Noguchi M, Muragaki Y. et al. Combination of intraoperative 5-aminolevulinic acid-induced fluorescence and 3-D MR imaging for guidance of robotic laser ablation for precision neurosurgery. International Conference on Medical Image Computing and Computer-Assisted Intervention: Springer. 2008 p. 373-80
10. Liao H, Noguchi M, Maruyama T, Muragaki Y, Kobayashi E, Iseki H. et al. An integrated diagnosis and therapeutic system using intra-operative 5-aminolevulinic-acid-induced fluorescence guided robotic laser ablation for precision neurosurgery. Med Image Anal. 2012;16:754-66
11. Liao H, Fujiwara K, Ando T, Maruyama T, Kobayashi E, Muragaki Y. et al. Automatic laser scanning ablation system for high-precision treatment of brain tumors. Laser Med Sci. 2013;28:891-900
12. Lazarides AL, Whitley MJ, Strasfeld DB, Cardona DM, Ferrer JM, Mueller JL. et al. A fluorescence-guided laser ablation system for removal of residual cancer in a mouse model of soft tissue sarcoma. Theranostics. 2016;6:155
13. Schebesch K-M, Proescholdt M, Höhne J, Hohenberger C, Hansen E, Riemenschneider MJ. et al. Sodium fluorescein-guided resection under the YELLOW 560 nm surgical microscope filter in malignant brain tumor surgery—a feasibility study. Acta Neurochir. 2013;155:693-9
14. Schebesch K-M, Hoehne J, Hohenberger C, Proescholdt M, Riemenschneider MJ, Wendl C. et al. Fluorescein sodium-guided resection of cerebral metastases—experience with the first 30 patients. Acta Neurochir. 2015;157:899-904
15. Nguyen JQ, Gowani Z, O'Connor M, Pence I, Holt G, Mahadevan-Jansen A. Near-infrared autofluorescence spectroscopy of in vivo soft tissue sarcomas. Opt Lett. 2015;40:5498-501
16. Croce AC, De Simone U, Freitas I, Boncompagni E, Neri D, Cillo U. et al. Human liver autofluorescence: an intrinsic tissue parameter discriminating normal and diseased conditions. Laser Surg Med. 2010;42:371-8
17. Zhu M, Chen F, Liu J, Wang G, Liao H. Ex vivo classification of spinal cord tumors using autofluorescence spectroscopy with immunohistochemical indexes. Biomed Opt Express. 2018;9:4401-12
18. Huang D, Swanson EA, Lin CP, Schuman JS, Stinson WG, Chang W. et al. Optical coherence tomography. Science. 1991;254:1178-81
19. Fan Y, Xia Y, Zhang X, Sun Y, Tang J, Zhang L. et al. Optical coherence tomography for precision brain imaging, neurosurgical guidance and minimally invasive theranostics. Biosci Trends. 2018;12:12-23
20. Assayag O, Grieve K, Devaux B, Harms F, Pallud J, Chretien F. et al. Imaging of non-tumorous and tumorous human brain tissues with full-field optical coherence tomography. NeuroImage- Clin. 2013;2:549-57
21. Jeon SW, Shure MA, Baker KB, Huang D, Rollins AM, Chahlavi A. et al. A feasibility study of optical coherence tomography for guiding deep brain probes. J Neurosci Meth. 2006;154:96-101
22. Lopez W, Ângelos J, Martinez R, Takimura C, Teixeira M, Neto L. et al. Optical coherence tomography imaging of the basal ganglia: feasibility and brief review. Braz J Med Biol Res. 2015;48:1156-9
23. Böhringer H, Lankenau E, Stellmacher F, Reusche E, Hüttmann G, Giese A. Imaging of human brain tumor tissue by near-infrared laser coherence tomography. Acta Neurochir. 2009;151:507-17
24. Bizheva KK, Unterhuber A, Hermann BM, Považay B, Sattmann H, Drexler W. et al. Imaging ex vivo and in vitro brain morphology in animal models with ultrahigh resolution optical coherence tomography. J Biomed Opt. 2004;9:719-25
25. Boppart SA, Boppart SA, Brezinski ME, Pitris C, Pitris C, Fujimoto JG. Optical coherence tomography for neurosurgical imaging of human intracortical melanoma. Neurosurgery. 1998;43:834-41
26. Kut C, Chaichana KL, Xi J, Raza SM, Ye X, McVeigh ER. et al. Detection of human brain cancer infiltration ex vivo and in vivo using quantitative optical coherence tomography. Sci Transl Med. 2015;7:292ra100-292ra100
27. Moiseev A, Snopova L, Kuznetsov S, Buyanova N, Elagin V, Sirotkina M. et al. Pixel classification method in optical coherence tomography for tumor segmentation and its complementary usage with OCT microangiography. J Biophotonics. 2018;11:e201700072
28. Yücel D, Themstrup L, Manfredi M, Jemec G. Optical coherence tomography of basal cell carcinoma: density and signal attenuation. Skin Res Technol. 2016;22:497-504
29. Yuan W, Kut C, Liang W, Li X. Robust and fast characterization of OCT-based optical attenuation using a novel frequency-domain algorithm for brain cancer detection. Sci Rep-UK. 2017;7:44909
30. Xi J, Chen Y, Li X. Characterizing optical properties of nano contrast agents by using cross-referencing OCT imaging. Biomed Opt Express. 2013;4:842-51
31. Haj-Hosseini N, Richter JC, Milos P, Hallbeck M, Wårdell K. 5-ALA fluorescence and laser Doppler flowmetry for guidance in a stereotactic brain tumor biopsy. Biomed Opt Express. 2018;9:2284-96
32. Kantelhardt SR, Kalasauskas D, König K, Kim E, Weinigel M, Uchugonova A. et al. In vivo multiphoton tomography and fluorescence lifetime imaging of human brain tumor tissue. J Neuro-Oncol. 2016;127:473-82
33. Jermyn M, Mercier J, Aubertin K, Desroches J, Urmey K, Karamchandiani J. et al. Highly accurate detection of cancer in situ with intraoperative, label-free, multimodal optical spectroscopy. Cancer Res. 2017:77
34. Mohs AM, Mancini MC, Singhal S, Provenzale JM, Leyland-Jones B, Wang MD. et al. Hand-held spectroscopic device for in vivo and intraoperative tumor detection: contrast enhancement, detection sensitivity, and tissue penetration. Anal Chem. 2010;82:9058-65
35. Barton JK, Hariri L, Tumlinson A. Combined optical coherence tomography and fluorescence spectroscopy for characterization of tissues. Lasers and Electro-Optics Society, 2003 LEOS 2003 The 16th Annual Meeting of the IEEE: IEEE. 2003 p. 458-9
36. Hariri LP, Tumlinson AR, Besselsen DG, Utzinger U, Gerner EW, Barton JK. Endoscopic optical coherence tomography and laser-induced fluorescence spectroscopy in a murine colon cancer model. Lasers in Surgery and Medicine: The Official Journal of the American Society for Laser Medicine and Surgery. 2006;38:305-13
37. Min EJ, Lee JH, Shin JG, Kwon S-M, You H, Yoon J-H. et al. Dual-channel fiber-probe for simultaneous imaging of swept source optical coherence tomography and fluorescence spectroscopy. Optical Fibers and Sensors for Medical Diagnostics and Treatment Applications XIII: International Society for Optics and Photonics. 2013 p. 85760B
38. Ryu SY, Choi HY, Chang KS, Kim GH, Choi WJ, Ahn S-G. et al. A fiber-based single-unit dual-mode optical imaging system: swept source optical coherence tomography and fluorescence spectroscopy. Opt Commun. 2012;285:2478-82
39. Barton JK, Guzman F, Tumlinson AR. Dual modality instrument for simultaneous optical coherence tomography imaging and fluorescence spectroscopy. J Biomed Opt. 2004;9:618-24
40. Fan Y, Sun Y, Chang W, Zhang X, Tang J, Zhang L. et al. Bioluminescence imaging and two-photon microscopy guided laser ablation of GBM decreases tumor burden. Theranostics. 2018;8:4072
41. Bachmann L, Zezell DM, Ribeiro AdC, Gomes L, Ito AS. Fluorescence spectroscopy of biological tissues—a review. Appl Spectrosc Rev. 2006;41:575-90
42. Lin W-C, Toms SA, Motamedi M, Jansen ED, Mahadevan-Jansen A. Brain tumor demarcation using optical spectroscopy: an in vitro study. J Biomed Opt. 2000;5:214-21
43. Saraswathy A, Jayasree R, Baiju K, Gupta AK, Pillai VM. Optimum wavelength for the differentiation of brain tumor tissue using autofluorescence spectroscopy. Photomed Laser Surg. 2009;27:425-33
44. Li Y, Rey-Dios R, Roberts DW, Valdés PA, Cohen-Gadol AA. Intraoperative fluorescence-guided resection of high-grade gliomas: a comparison of the present techniques and evolution of future strategies. World Neurosurg. 2014;82:175-85
45. Koc K, Anik I, Cabuk B, Ceylan S. Fluorescein sodium-guided surgery in glioblastoma multiforme: a prospective evaluation. Brit J Neurosurg. 2008;22:99-103
46. Pahlevaninezhad H, Lee AM, Rosin M, Sun I, Zhang L, Hakimi M. et al. Optical coherence tomography and autofluorescence imaging of human tonsil. PloS One. 2014;9:e115889
47. Pahlevaninezhad H, Lee AM, Hohert G, Lam S, Shaipanich T, Beaudoin E-L. et al. Endoscopic high-resolution autofluorescence imaging and OCT of pulmonary vascular networks. Opt Lett. 2016;41:3209-12
Author biographies
 Mingyu Zhu is a Ph.D. student in the Department of Biomedical Engineering, School of Medicine, Tsinghua University, Beijing, China. He received his B.S. degree in biomedical engineering from Tianjin University in 2014. His current research interests include medical optical diagnosis, surgical navigation, and medical deep learning.
 Wei Chang is a graduate student in the Department of Biomedical Engineering, School of Medicine, Tsinghua University, Beijing, China. She received her B.S. degree in Electrical Engineering from the School of Electronic Information and Electrical Engineering, Shanghai Jiaotong University, China, in 2014. Her current research interests include minimally invasive theranostics, biomedical optics, image processing, and deep learning.
 Linkai Jing is a Ph.D. student in the Department of Neurosurgery, Beijing Tsinghua Changgung Hospital, School of Clinical Medicine, Tsinghua University, Beijing, China. He graduated from Capital Medical University and educated at Tsinghua University in 2016. His current research interests include O-arm and robot-assisted spine surgery, and MR imaging analysis.
 Yingwei Fan received his Ph.D. degree in the Department of Biomedical Engineering, School of Medicine, Tsinghua University, Beijing, China, in 2018. He received his B.S. degree in Biomedical Engineering from Kunming University of Science and Technology, China, in 2012. He received his M.E. degree in Biomedical Engineering from Northeastern University, Shenyang, China in 2014. His current research interests include minimally invasive theranostics, optical theranostics, biomedical optics, medical imaging analysis, and image-guided surgery.
 Ping Liang is a Ph.D. student in the Department of Neurosurgery, Beijing Tsinghua Changgung Hospital, School of Clinical Medicine, Tsinghua University, Beijing, China. He received his bachelor's and master's degree from Southeast University and has nine years of professional experience. His research fields include combination therapy for glioma and local drug implantation in glioma surgery, including immune drugs, protein drugs, and other polymer drugs.
 Xinran Zhang received a B.S. degree in biomedical engineering from South China University of Technology, Guangzhou, China, in 2013, and a master's degree from the Department of Biomedical Engineering, School of Medicine, Tsinghua University, Beijing, China, in 2016. She is currently a Research Associate in the Department of Biomedical Engineering, School of Medicine, Tsinghua University, Beijing, China. Her research interests include high-quality and accurate 3D imaging technologies and their application in 3D surgical guidance systems.
 Dr. Guihuai Wang received his B.M. and Ph.D. degrees in neurosurgery from Nantong Medical University in 1988 and from Capital Medical University in 1997, respectively. He is now a surgeon in the Department of Neurosurgery, Beijing Tsinghua Changgung Hospital, Beijing, China. His research interests include surgical navigation and precise treatment in neurosurgery.
 Prof. Hongen Liao, Ph.D., received a B.S. degree in Mechanics and Engineering Sciences from Peking University, Beijing, China, in 1996, and M.E. and Ph.D. degrees in Precision Machinery Engineering from the University of Tokyo, Tokyo, Japan, in 2000 and 2003, respectively. He was a Research Fellow of the Japan Society for the Promotion of Science. Since 2004, he has been a faculty member at the Graduate School of Engineering, University of Tokyo, where he became an Associate Professor in 2007. He has been selected as a National “Thousand Talents” Distinguished Professor, National Recruitment Program of Global Experts, China, since 2010 and is currently a full professor and Vice Director in the Department of Biomedical Engineering, School of Medicine, Tsinghua University, Beijing, China. His research interests include 3D medical imaging, image-guided surgery, medical robotics, computer-assisted surgery, and the fusion of these techniques for minimally invasive precision diagnosis and therapy. Prof. Liao is an Associate Editor of IEEE Engineering in Medicine and Biology Society Conference, and he has been the Organization Chair of Medical Imaging and Augmented Reality Conference (MIAR) 2008, the Program Chair of the Asian Conference on Computer-Aided Surgery Conference (ACCAS) 2008 and 2009, the Tutorial co-chair of the Medical Image Computing and Computer Assisted Intervention Conference (MICCAI) 2009, the Publicity Chair of MICCAI 2010, the General Chair of MIAR 2010 and ACCAS 2012, the Program Chair of MIAR 2013, the Workshop Chair of MICCAI 2013, and the General co-chair of MIAR 2016 and ACCAS 2018. He was the President of the Asian Society for Computer Aided Surgery and the Secretary of Asian-Pacific Activities Working Group, International Federation for Medical and Biological Engineering.
![]() Corresponding authors: Prof. Hongen Liao, Email: liaoedu.cn and Dr. Guihuai Wang, Email: youngneurosurgeoncom
Corresponding authors: Prof. Hongen Liao, Email: liaoedu.cn and Dr. Guihuai Wang, Email: youngneurosurgeoncom