Impact Factor
- Issue 14; 2026
- Issue 13; 2026
- Issue 12; 2026
- Issue 11; 2026
- Issue 10; 2026
- Volume 16; 2026
- Advance Articles
- Past Issues
- Cover Images
- Cover Suggestion
- Index & Coverage
- Special Issues
Introduction
Methods
Results
Discussion
Abbreviations
Supplementary Material
Acknowledgements
References
International Journal of Biological Sciences
International Journal of Medical Sciences
 Global reach, higher impact

Theranostics 2019; 9(10):2812-2826. doi:10.7150/thno.34485 This issue Cite
Research Paper
A Circulating Tumor Cell-RNA Assay for Assessment of Androgen Receptor Signaling Inhibitor Sensitivity in Metastatic Castration-Resistant Prostate Cancer
Yu Jen Jan1*, Junhee Yoon2*, Jie-Fu Chen1*, Pai-Chi Teng1, Nu Yao1, Shirley Cheng1, Amber Lozano1, Gina C.Y. Chu1, Howard Chung7, Yi-Tsung Lu1, Pin-Jung Chen7, Jasmine J. Wang7, Yi-Te Lee7, Minhyung Kim2, Yazhen Zhu7, Beatrice S. Knudsen3,6, Felix Y. Feng9, Isla P. Garraway8, Allen C. Gao10, Leland W. K. Chung1, Michael R. Freeman2,4,6 ![]() , Sungyong You2
, Sungyong You2 ![]() , Hsian-Rong Tseng7
, Hsian-Rong Tseng7 ![]() , Edwin M. Posadas1,3,5
, Edwin M. Posadas1,3,5 ![]()
1. Urologic Oncology Program and Uro-Oncology Research Laboratories, Cedars-Sinai Medical Center, Los Angeles, California, USA
2. Division of Cancer Biology and Therapeutics, Departments of Surgery, Cedars-Sinai Medical Center, Los Angeles, California, USA
3. Translational Oncology Program, Cedars-Sinai Medical Center, Los Angeles, California, USA
4. Cancer Biology Program, Samuel Oschin Comprehensive Cancer Institute, Cedars-Sinai Medical Center, Los Angeles, California, USA
5. Division of Hematology/Oncology, Department of Medicine, Cedars-Sinai Medical Center, Los Angeles, California, USA
6. Department of Biomedical Sciences, Cedars-Sinai Medical Center, Los Angeles, California, USA
7. Department of Molecular and Medical Pharmacology, California NanoSystems Institute, Crump Institute for Molecular Imaging, University of California, Los Angeles, Los Angeles, California, USA
8. Department of Urology, David Geffen School of Medicine, University of California, Los Angeles, Los Angeles, California, USA
9. Departments of Radiation Oncology, Urology, and Medicine, University of California, San Francisco, San Francisco, California, USA.
10. Department of Urology, University of California Davis, Davis, CA, USA
* These authors contribute equally to this work.
Received 2019-2-28; Accepted 2019-3-22; Published 2019-4-13
Abstract

Rationale: Our objective was to develop a circulating tumor cell (CTC)-RNA assay for characterizing clinically relevant RNA signatures for the assessment of androgen receptor signaling inhibitor (ARSI) sensitivity in metastatic castration-resistant prostate cancer (mCRPC) patients.
Methods: We developed the NanoVelcro CTC-RNA assay by combining the Thermoresponsive (TR)-NanoVelcro CTC purification system with the NanoString nCounter platform for cellular purification and RNA analysis. Based on the well-validated, tissue-based Prostate Cancer Classification System (PCS), we focus on the most aggressive and ARSI-resistant PCS subtype, i.e., PCS1, for CTC analysis. We applied a rigorous bioinformatic process to develop the CTC-PCS1 panel that consists of prostate cancer (PCa) CTC-specific RNA signature with minimal expression in background white blood cells (WBCs). We validated the NanoVelcro CTC-RNA assay and the CTC-PCS1 panel with well-characterized PCa cell lines to demonstrate the sensitivity and dynamic range of the assay, as well as the specificity of the PCS1 Z score (the likelihood estimate of the PCS1 subtype) for identifying PCS1 subtype and ARSI resistance. We then selected 31 blood samples from 23 PCa patients receiving ARSIs to test in our assay. The PCS1 Z scores of each sample were computed and compared with ARSI treatment sensitivity.
Results: The validation studies using PCa cell line samples showed that the NanoVelcro CTC-RNA assay can detect the RNA transcripts in the CTC-PCS1 panel with high sensitivity and linearity in the dynamic range of 5-100 cells. We also showed that the genes in CTC-PCS1 panel are highly expressed in PCa cell lines and lowly expressed in background WBCs. Using the artificial CTC samples simulating the blood sample conditions, we further demonstrated that the CTC-PCS1 panel is highly specific in identifying PCS1-like samples, and the high PCS1 Z score is associated with ARSI resistance samples. In patient bloods, ARSI-resistant samples (ARSI-R, n=14) had significantly higher PCS1 Z scores as compared with ARSI-sensitive samples (ARSI-S, n=17) (Rank-sum test, P=0.003). In the analysis of 8 patients who were initially sensitive to ARSI (ARSI-S) and later developed resistance (ARSI-R), we found that the PCS1 Z score increased from the time of ARSI-S to the time of ARSI-R (Pairwise T-test, P=0.016).
Conclusions: Using our new methodology, we developed a first-in-class CTC-RNA assay and demonstrated the feasibility of transforming clinically-relevant tissue-based RNA profiling such as PCS into CTC tests. This approach allows for detecting RNA expression relevant to clinical drug resistance in a non-invasive fashion, which can facilitate patient-specific treatment selection and early detection of drug resistance, a goal in precision oncology.
Keywords: Circulating Tumor Cell, Cancer RNA Profiling, Metastatic Castration-Resistant Prostate Cancer, Androgen Receptor Signaling Inhibitors
Introduction
In the United States, prostate cancer (PCa) is the most common cancer among men and second leading cause of cancer death. This year, it is estimated that more than 31,000 men will die from this disease [1]. The transition to metastatic, castration-resistant PCa (mCRPC) represents a common and lethal progression of the disease. Since 2004, multiple therapeutic agents, including androgen receptor signaling inhibitors (ARSIs), have become available and have been shown to dramatically improve survival and quality of life in mCRPC [2]. Emerging studies in oncology point toward the use of molecular biomarkers in patient selection as a means of improving the likelihood and degree of benefit [3], and thereby moving toward the goal of precision oncology. As such, there is an unmet need for new biomarker assays for mCRPC to facilitate treatment selection and monitor treatment responses, especially for ARSIs.
Current approaches to risk stratification in PCa employ histopathology (e.g., Gleason score [4]) and clinical parameters (e.g., CAPRA [5]). More modern approaches, including tissue-based RNA profiling such as Decipher® [6], Prolaris® [7] and PAM50 [8], further improve patient prognostic outcome measurement [9]. Tissue-based RNA signatures could also provide insights into the underlying cancer biology that may predict response to therapy. For example, our team developed a PCa-specific RNA subtyping method known as the Prostate Cancer Classification System (PCS) [10], which categorizes PCa into 3 subtypes (i.e., PCS1, 2, and 3) with prognostic significance and treatment sensitivity information. Among the three subtypes, PCS1 is associated with the worst prognosis, shortest time to metastasis, and highest risk of resistance to ARSIs such as enzalutamide.
These diagnostic approaches typically rely on the tissue specimens obtained by surgical excision or biopsy, which is limited due to the invasiveness, cost, risk of morbidity and psychological stress on the patients. Circulating tumor cells (CTCs) have been proposed as a non-invasive alternative to tissue biopsy. The use of CTC-based “liquid biopsy” offers the opportunity to obtain information of the underlying cancer using a less-invasive approach than surgery or core needle biopsies. CTCs can be identified and recovered throughout the disease course with a simple blood draw, allowing for monitoring alterations of disease behaviors. The value of CTC enumeration as a prognostic biomarker has been shown in PCa [11]. Beyond enumeration, research efforts are moving toward molecular characterization of CTCs [12]. Recently, methodologies for CTC-based RNA expression analyses have been developed [13-20] that provide information on metastasis detection [14, 15] and survival [15]. Particularly in PCa, androgen receptor splice variant-7 (AR-V7) expression in CTCs has been put forward as a putative biomarker for emerging resistance to ARSIs [19-21]. However, the current technologies for CTC-based RNA analysis still fall short of efficiently detecting larger RNA signatures such as the PCS panel to further provide biological insights into response to therapy. Therefore, there is an unmet need to establish methodologies that are not only able to purify CTCs with high efficiency, but also preserve RNA in high quality for larger RNA panel detection. Furthermore, highly sensitive and specific molecular assays (e.g., the NanoString nCounter platform [22]) are also needed to quantify a larger panel of RNA markers derived from CTCs. Moreover, the RNA expression background in which CTCs exist is mostly contributed by white blood cells (WBCs), which is significantly different background than that of tumor tissue biopsies. As such, a bioinformatic process of refining tissue-based RNA panels for use with CTC analysis is also required.
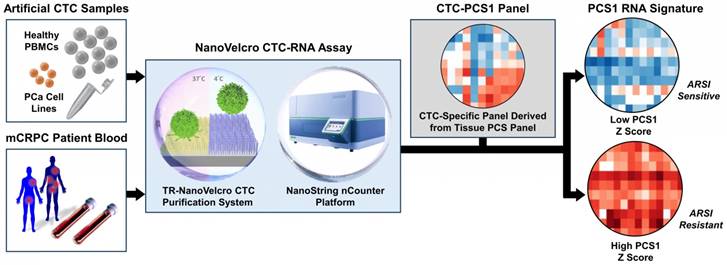
To address the unmet needs, we developed the NanoVelcro CTC-RNA assay (Figure 1) with the goal of performing CTC-based RNA profiling in a noninvasive manner and achieve PCa subtyping equivalent to tissue-based classification scheme. The NanoVelcro CTC-RNA assay is composed of the Thermoresponsive (TR)-NanoVelcro CTC purification system [23, 24] and the NanoString nCounter platform [22] for CTC purification and downstream analysis of CTC-derived RNA, respectively. Over the past decade, our team has pioneered the development of the NanoVelcro CTC assay [25-27], in which capture agent-coated nanosubstrates are used to selectively enrich CTCs. Recently, we introduced the TR-NanoVelcro CTC purification system [23, 24], which allows for purification of PCa CTCs with intact mRNA for subsequent RNA profiling. Quantification of RNA transcripts can then be performed on the NanoString nCounter platform, which allows for multiplexed quantitative measurement of RNA expression in a single reaction. Based on the aforementioned tissue-based, well-validated PCS subtyping [10], we focus on the most aggressive and ARSI-resistant PCS subtype, i.e., PCS1, for CTC analysis. We implemented a rigorous bioinformatic process to develop the CTC-PCS1 panel by selecting genes that have high expression in PCa and low expression in WBCs. We validated the NanoVelcro CTC-RNA assay with the CTC-PCS1 panel using artificial CTC samples constituted of well-characterized PCa cell lines with different biological properties (i.e., PCS1 vs. non-PCS1, and ARSI sensitive vs. ARSI resistance). We further analyzed CTCs from a retrospective cohort of mCRPC patients receiving ARSI therapy (i.e., abiraterone acetate or enzalutamide). These findings demonstrate the feasibility of conducting measurements of CTC gene expression relevant to disease biology over the clinical course of ARSI treatment.
The workflow of NanoVelcro CTC-RNA assay. Artificial CTC samples were generated by spiking 10 cells of PCa cell line into 2 x 10⁶ PBMCs from healthy donor to simulate actual CTC blood samples. Blood samples collected from mCRPC patients were processed through the TR-NanoVelcro CTC purification system and CTCs are purified. The purified CTCs are subjected to RNA extraction and reverse transcription. Quantification of PCa-specific RNA markers is carried out using the NanoString nCounter platform. The combination of TR-NanoVelcro CTC purification system and the NanoString nCounter platform results in the NanoVelcro CTC-RNA assay. Differential expression analysis of PCa-specific RNA markers in CTC-PCS1 panel will be performed for disease profiling. The resulting PCS1 RNA signature expression will be utilized to calculate the PCS1 Z score which will be used to associate with the ARSI drug sensitivity.
Methods
Materials for Validation Studies
We selected 2 PCa cell lines, i.e., 22Rv1 and LNCaP, to test the performance of the NanoVelcro CTC-RNA assay in conjunction with CTC-PCS1 panel. 22Rv1 exhibits a PCS1-like profile, while LNCaP exhibits a non-PCS1 profile [10]. The 2 cell lines were obtained from American Type Culture Collection (ATCC). To further assess the CTC-PCS1 panel and its association with ARSI resistance, we selected another PCa cell line-the C4-2B [28] and its ARSI resistant lineages, i.e., C4-2B ABI-R [29] and C4-2B MDV-R [30, 31], to test in the assay. The C4-2B treatment naïve control cell line was considered to be sensitive to ARSIs (ARSI-S) while C4-2B ABI-R showed resistance to abiraterone acetate, an ARSI (ARSI-R) and C4-2B MDV-R showed resistance to enzalutamide, another ARSI (ARSI-R). C4-2B treatment naïve (control) cell line was provided and authenticated by Dr. Leland Chung's group [28]. Abiraterone-resistant C4-2B ABI-R cells and enzalutamide-resistant C4-2B MDV-R cells were provided and authenticated by Dr. Allen Gao's group. C4-2B ABI-R cells were established by culture in 5-20 μM abiraterone acetate over 12 months and maintained in 10 μM abiraterone acetate containing RPMI-1640 medium supplemented with 10% FBS and 1% penicillin streptomycin [29]. C4-2B MDV-R cells were established as previously described [30, 31] and maintained in 20 μM enzalutamide containing RPMI-1640 medium supplemented with 10% FBS and 1% penicillin streptomycin. Blood from healthy volunteers was obtained with appropriate oversight from the Cedars-Sinai Medical Center Institutional Review Board (CSMC IRB). Healthy donor peripheral blood mononuclear cells (PBMCs) were processed using the blood processing method described below. The artificial blood samples were prepared by spiking 10 cells of PCa cell lines (i.e., 22Rv1 or LNCaP or C4-2B control or C4-2B ABI-R or C4-2B MDV-R) into 2 x 10⁶ PBMCs from healthy donor blood in an RPMI medium (Corning, VA, USA). This model simulates the number of CTCs and WBCs in 2-mL of actual patient blood samples according to our previous experiences [24-27, 32-34]. We conducted CTC purification, RNA extraction and quantification according to the methods described below.
Patient and Sample Selection
Blood specimens for this study were extracted from existing biobanking protocols approved by the CSMC IRB. This study was conducted in accordance with the Declaration of Helsinki and Good Clinical Practice guidelines. The entire pool of patients consisted of men with histologically confirmed PCa agreeing to provide blood as part of CSMC Urologic Oncology Program Blood and Biospecimen Bank (UOPBBB) protocols who underwent evaluation and/or treatment at CSMC between September 2014 and September 2017. Use of all biospecimens from the banking studies was also conducted under IRB oversight. All treatments and radiographic examinations were performed as part of ongoing clinical care. All patient blood samples from the CSMC UOPBBB were considered for the study if the patients were diagnosed with mCRPC and underwent treatment with an ARSI (abiraterone acetate or enzalutamide). Both pre-treatment and on-treatment blood samples were analyzed when possible. Samples used in this study were adequately annotated with regard to clinical response if clinical, biochemical (serum prostate-specific antigen, PSA), and radiographic studies were available within 12 weeks of the blood draw. For the purpose of this retrospective analysis, disease response was classified using Prostate Cancer Working Group 3 (PCWG3) [35] and Response Evaluation Criteria in Solid Tumors 1.1 (RECIST1.1) [36]. Using these clinical data, each sample was annotated as follows: (i) Abiraterone acetate or enzalutamide sensitive (ARSI-S)- absence of biochemical (serum PSA) and radiographic progression within 12 weeks of the blood draw. (ii) Abiraterone acetate or enzalutamide resistant (ARSI-R)- radiographic progression and/or biochemical progression at the time of blood draw. Altogether, 31 samples from 23 patients were identified. Of all 31 samples, 17 samples were identified as ARSI-S and 14 samples were identified as ARSI-R. In this cohort, 8 patients (patient ID 1 to 8) provided serial samples: an ARSI-S sample prior to or during therapy and an ARSI-R sample collected when drug resistance emerged as defined above. Detailed information and patient characteristics are shown in the Supplementary Table 1.
The NanoVelcro CTC-RNA Assay
The workflow of the NanoVelcro CTC-RNA assay is illustrated in Figure 1. In brief, artificial CTC samples and mCRPC patient blood samples were processed through the TR-NanoVelcro CTC purification system as previously published [23, 24] (Supplementary Figure 1). The purified CTCs were then subjected to RNA extraction and reverse transcription. Quantification of disease-relevant RNA markers was accomplished using the NanoString nCounter platform [22], a commercially available technology that allows multiplexed direct measurement and quantification of gene expression in a single reaction. Differential expression analysis of RNA markers of CTC-PCS1 panel was performed to create a PCS1 RNA profile and PCS1 Z score. Detailed methodology of each step and information of materials used are described as follows:
Blood Sample Processing
Venous blood was collected in acid-citrate dextrose-containing vacutainers (BD Bioscience, CA, USA) and stored at 4°C. All the blood samples were processed within 4 hours upon collection. PBMCs including CTCs were separated by gradient centrifugation with the use of Ficoll-Paque solution (Sigma-Aldrich, MO, USA) using the manufacturer's protocol. PBMCs were suspended in fetal bovine serum (FBS, Omega Scientific, CA, USA) and Dimethyl sulfoxide (DMSO, Fisher Scientific, NH, USA). Specimens were aliquoted into labeled cryovials at 1-mL whole blood equivalency and banked under -180°C at CSMC-UOPBBB. At time of experimentation, 2-mL whole blood equivalency of samples was retrieved from UOPBBB, immediately thawed completely in 37°C water bath. After washing by PBS, the PBMCs were re-suspended in 200-μL PBS for the TR-NanoVelcro CTC purification system.
TR-NanoVelcro CTC Purification System
The TR-NanoVelcro CTC purification system [23, 24] is built upon the combined use of two materials, i.e., NanoVelcro substrates [25-27] and thermoresponsive-polymer brushes [23, 24], to achieve highly efficient CTC enrichment and purification. By grafting polymer brushes, i.e., poly(N-isopropylacrylamide), PIPAAm, onto the NanoVelcro substrates, the thermo-responsiveness is conferred to the TR-NanoVelcro chips. This device utilizes the temperature-dependent conformational changes of polymer brushes that can effectively alter the accessibility of the capture agent (i.e., anti-EpCAM) on the NanoVelcro substrates, allowing for rapid CTC purification with well-preserved RNA. By switching between physiologically endurable temperatures, (i.e., 4 and 37°C), the TR-NanoVelcro system is able to recover viable CTCs with well-preserved RNA (Supplementary Figure 1). The cell-line-spiked artificial CTC samples and the PBMC samples processed from patients' blood were loaded into the TR-NanoVelcro CTC purification system at 37°C with flow rate of 0.5 mL/h. After 3 rounds of heating and cooling cycles between 37°C and 4°C, the captured CTCs were released at 4°C under a flow rate of 0.5 mL/h for 15 min. The released CTCs were subjected to downstream RNA extraction and analysis by NanoString nCounter platform. The detailed manufacture materials and methods of the TR-NanoVelcro CTC Purification System can be found in Supplementary Materials.
RNA Extraction and Whole Transcriptome Amplification
After purified by the TR-NanoVelcro CTC purification system, the purified cells were lysed, and the RNA was extracted using the Direct-zolTM RNA MicroPrep (Zymo Research, CA, USA) kit following the manufacturer's protocol. In brief, cells were lysed with 600 μL of Trizol solution and mixed with 600 μL of ethanol. The mixed solution was put in to Zymo-SpinTM IIC Column and centrifuged. After centrifugation the solution was washed twice with supplied wash buffer. The RNA was eluted from the column using 12 μL of RNA grade water. The amount of the eluted RNA needs to be above 2 ng/μL to pass the internal quality control. The RNA was then subjected to reverse transcription to convert to cDNA and whole transcriptome amplification using the nCounter Low RNA Input Amplification Kit (NanoString Technologies, Inc., WA, USA) following manufacturer's protocol.
NanoString nCounter Platform
The cDNA samples were run on the NanoString nCounter Analysis System (NanoString Technologies, Inc., WA, USA) according to the manufacturer's directions. Briefly, total cDNA was hybridized overnight at 65°C, then run on the Prep Station at maximum sensitivity. Cartridges were then scanned on the Digital Analyzer at 555 fields of view. The nSolver analysis software version 3.0 provided by NanoString was used to analyze the raw count data and the counts were normalized according to the expression of housekeeping genes and positive/negative-control probes.
Gene Expression Analysis
NanoStringNorm R package was used for expression data normalization, and Variance Stabilizing Normalization (VSN) method with adopting Log2 was applied to entire data to reduce systematic variance. The PCS1 Z score, which represents the likelihood estimate of being PCS1 subtype, was computed from the RNA expression of our CTC-PCS1 panel using a weighted Z score method [37]. The Z-score was defined by the difference between the error-weighted mean of the expression values of the genes in a gene signature and the error-weighted mean of all genes in a sample after normalization. In addition to the CTC-PCS1 panel, we selected another gene set developed from a Massachusetts General Hospital (MGH) group, i.e., Miyamoto et al.[15] for analysis. The group showed that quantification of mRNA gene expression could be used to predict the presence of occult metastatic PCa. This study developed a CTCM score based on expression of 8 genes (i.e., KLK3, KLK2, TMPRSS2, AGR2, FOLH1, HOXB13, FAT1 and STEAP2) and found that a higher CTCM score was associated with metastatic PCa. To obtain the MGH CTCM score, we used a weighted CTC score following the method described by Miyamoto et al. [17]. All 8 genes except for FAT1, which failed in probe design and standard quality control, were included in our analysis. For the visualization of the gene expression data, hierarchical clustering of the CTC gene expression profiles was done with two distance measures: Euclidean distance for gene clustering and cosine distance for sample clustering. We also included the widely used PCa CTC biomarker for ARSI sensitivity, AR-V7, in our analysis. AR-V7 is an AR splicing variant that can activate AR signaling without the need for ligand binding, which has been put forward as a putative biomarker for emerging resistance to ARSIs [18, 19, 21]. All the bioinformatic analysis in this study were performed using the R statistical software version 3.5 (http://www.r-project.org/) and Python version 3.7 (https://www.python.org/).
Statistical Analysis
We performed receiver operating characteristic (ROC) analysis and utilize area under curve (AUC) to assess and compare the performance between the original 37-gene PCS panel and the CTC-PCS1 panel for identifying the PCS1 subtype. We performed linear regression analysis to assess the linearity of the RNA expression readout in PCa cell line (22Rv1 and LNCaP) and healthy donor PBMC calibration study during analytical validation. The slopes and coefficient of determination (R-square) were calculated. T-test was used to assess the difference in PCS1 Z scores between different PCa cell line spiking samples (LNCaP vs. 22Rv1, C4-2B control vs. C4-2B ABI-R, C4-2B control vs. C4-2B MDV-R). For the total 31 patient samples, we performed a Wilcoxon Rank-Sum test to check if there is any statistical significance in PCS1 Z scores, MGH CTCM scores, AR-V7 expression and serum PSA concentration between sensitive and resistant samples. For the 8 patients with continuous samples from sensitive to resistant, a paired t-test was performed to check the differences in PCS1 Z scores, MGH CTCM scores, AR-V7 expression and serum PSA concentration between sensitive and resistant samples. The statistical tests in this study were performed using the R statistical software version 3.5 (http://www.r-project.org/) and Python version 3.7 (https://www.python.org/). All tests are two-sided and P* < 0.05 is considered statistically significant.
Results
The CTC-PCS1 Panel Development
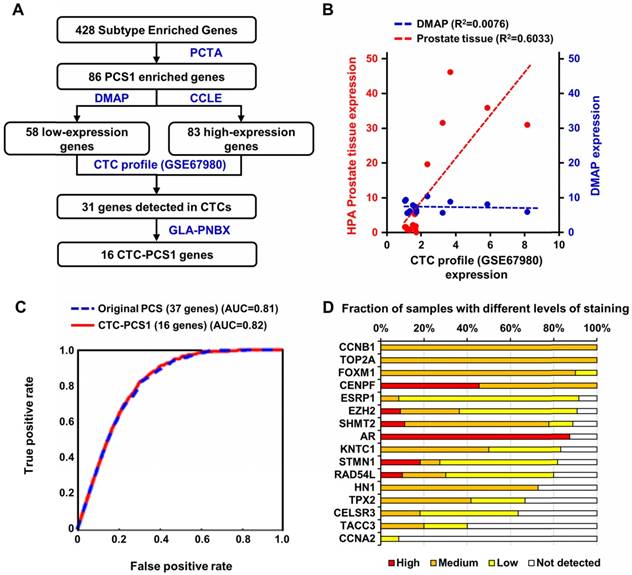
Based on the previously validated PCS subtyping [10], we selected the most aggressive and ARSI-resistant subtype, PCS1, for CTC analysis. Because CTC samples obtained from blood contain background RNA expression from blood cells, especially WBCs [24], we needed to refine the tissue-based PCS to fit into our CTC analysis. We implemented the following bioinformatic process to develop the CTC-PCS1 panel by selecting genes that have high expression in PCa and low expression in WBCs (Figure 2A). From the original 428 subtype-enriched genes in the PCS, we focused on 86 genes that exhibit high expression in PCS1 tumors, in comparison to PCS2 and PCS3 tumors, in the virtual cohort described in You et al. [10]. The gene expression profiles of 1,321 PCa tumors from the virtual cohort are available on the website of the Prostate Cancer Transcriptome Atlas (PCTA: http://www.thepcta.org). To ensure the specificity of the CTC-RNA signature and avoid the signals from WBC-derived RNA, we selected PCa-specific genes based on two strategies: 1. Low expression in WBCs and 2. High expression in PCa. Among the 86 PCS1 genes initially selected, 58 are below average expression in 21 immune cells from the Differentiation Map (DMAP) [38] and 83 exceed the mean value of genes expressed in 8 human PCa cell lines in the Cancer Cell Line Encyclopedia (CCLE) [39]. As a result, 84 genes were selected satisfying either one of two conditions simultaneously. Using this gene set, we examined expression levels in CTC RNA sequencing (RNA-seq) data (GSE67980) previously published [17], resulting in 31 genes demonstrated to be expressed in CTCs. To select genes reflecting deregulation of PCa, we queried the expression of these 31 genes in RNA-seq data from a diagnostic prostate needle biopsy (PNBX) cohort (n=99) at the Greater Los Angeles Veterans Affairs Healthcare System (GLA-PNBX). Sixteen genes were highly expressed over the mean value in the biopsy profiles. To further evaluate prostate expression of the 16 genes, we compared the expression of these genes with gene expression profiles from normal prostate tissue in the Human Protein Atlas (HPA) [40, 41] and examined how the expression of these genes correlated with prostate cells or immune cells from the DMAP (Figure 2B). This 16-gene set showed a high correlation with normal prostate tissue, while no correlation was found with immune cell profiles, meaning that this gene set is prostate-specific. To evaluate the classification efficiency of this 16-gene panel for classifying PCS1 tumors, we developed a naïve Bayes classifier using these genes to interrogate 1,321 PCa transcriptome profiles from the PCTA and compared the results with a naïve Bayes classifier using a 37-gene PCS panel that was originally developed for classification of PCa tissue expression data [10]. Notably, the 16-gene CTC-PCS1 panel was able to correctly assign the PCS1 tumors with the same performance level as the original 37-gene PCS panel in the PCTA data. The area under curve (AUC) of receiver operating characteristic (ROC) analysis for the original PCS and revised CTC-PCS1 panels are 0.81 and 0.82, respectively (Figure 2C). We further confirmed the expression of these 16 genes at the protein level using HPA data consisting of immunohistochemical staining of PCa tissues. Fifteen of the 16 proteins (all genes except CCNA2) were expressed with medium or high level in PCa tissues (Figure 2D). Collectively, these results indicate that the 16-gene CTC-PCS1 panel identifies the PCS1 subtype with high confidence.
Selection and performance of the CTC-PCS1 gene panel. (A) Schematic flow of the selection of 16 CTC-PCS1 genes. (B) Scatter plot and regression lines shows expression of the 16 CTC-PCS1 genes in comparisons of CTCs (GSE67980) versus HPA prostate tissue, and CTCs (GSE67980) versus DMAP immune cells. Red dots and red dotted line indicate expressions in CTCs and prostate tissue, and blue dots and blue dotted line indicate expressions of CTCs and immune cells. (C) ROC curves of classifiers using the 16 CTC-PCS1 genes and original 37 PCS gene panel shows comparable level of performance of both classifiers. Red line indicates performance of 16 CTC-PCS1 genes and blue dotted line indicates performance of original 37 PCS gene panel for identification of PCS1 subtype. (D) Stacked bar graph depicts human PCa tissue staining of 16 CTC-PCS1 gene products in HPA database (https://www.proteinatlas.org/).
Analytical Validation of NanoVelcro CTC-RNA Assay and the CTC-PCS1 Panel
To determine the sensitivity and dynamic range of the NanoVelcro CTC-RNA assay for quantification of the CTC-PCS1 signature, we first tested the assay with a PCa cell line, i.e., 22Rv1 using different cell numbers (n = 5, 10, 50, and 100 cells) that mimicked the CTC numbers present in 2-mL clinical blood samples [24-27, 32-34]. We demonstrated that the NanoVelcro CTC-RNA assay can detect RNA transcripts of a housekeeping gene (i.e., HPRT) and the 16 genes in CTC-PCS1 panel with high sensitivity and linearity in the dynamic range of 5-100 cells (Supplementary Figure 2A, 2B). We then demonstrated that the CTC-PCS1 panel is capable of detecting PCa CTC-derived PCS1 signatures in the presence of WBC background by quantifying CTC-PCS1 RNA expression with NanoString nCounter platform using three sets of RNA samples extracted from 2 PCa cell lines (i.e., 22Rv1 and LNCaP), and healthy donor PBMCs with cell numbers mimicked the CTC and WBC numbers (i.e., 5-100 PCa cells and 50-1000 WBCs) in the CTC samples purified by the TR-NanoVelcro system [24] from 2-mL of patient blood. We demonstrated that the RNA counts of the CTC-PCS1 panel genes in PCa cells were significantly higher than the RNA counts in WBCs in the given cell number range (Supplementary Figure 2C). This further validated the bioinformatic process of developing the CTC-PCS1 panel. The detailed experimental design and data is summarized in Supplementary Materials.
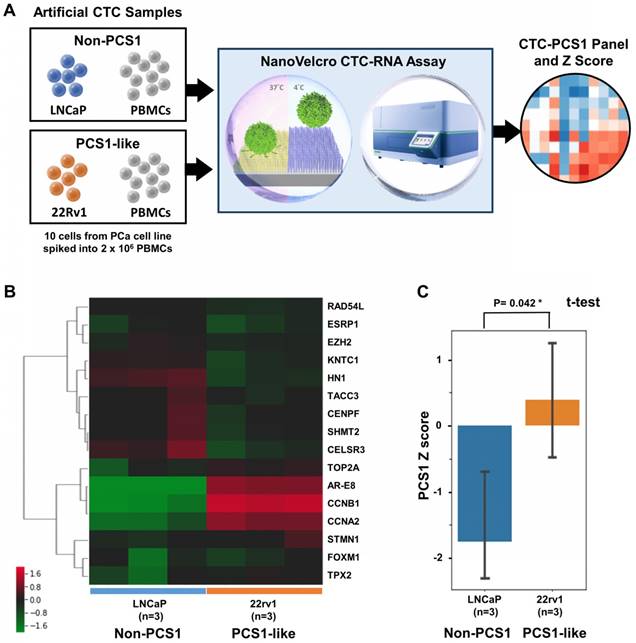
We tested the feasibility of applying the NanoVelcro CTC-RNA Assay in conjunction with the CTC-PCS1 panel for distinguishing the PCS1 subtype (i.e., PCS1-like profile) from non-PCS1 profiles using artificial CTC samples with different PCS signatures. We prepared artificial CTC samples by spiking 10 PCa cells into 2 x 10⁶ PBMCs from healthy donor blood. This model simulates the number of CTCs and WBCs in 2-mL patient blood sample according to our previous experiences [24-27, 32-34]. In this experiment, we used 2 PCa cell lines, i.e., 22Rv1 cells and LNCaP cells to create the artificial CTC samples for testing. According to previous analysis, 22Rv1 has a PCS1-like profile, while LNCaP cells exhibits a non-PCS1 profile [10]. The artificial samples were processed following the workflow in Figure 3A in triplicate and underwent normalization and hierarchical clustering focusing on CTC-PCS1 genes (Figure 3B). We computed PCS1 Z scores for each sample based on the expression of CTC-PCS1 genes using the weighted Z-score method [37], which represents the likelihood estimate of the PCS1 phenotype in each sample. Consistent with previous analysis in tissue-based PCS [10], 22Rv1 samples have significantly higher PCS1 Z score than the LNCaP samples (T-test P value= 0.042*, Figure 3C). This result showed that the PCS1 Z score from the CTC-PCS1 panel is capable of distinguishing PCS1-like samples from non-PCS1 samples.
Cell line study of CTC-PCS1 panel for profiling PCS1 subtype. (A) Study workflow of the NanoVelcro CTC-RNA assay and CTC-PCS1 panel for profiling artificial blood samples of PCS1-like and non-PCS1 subtypes. Artificial CTC samples were prepared by spiking 10 cells of PCa cell line LNCaP (Non-PCS1) and 22Rv1(PCS1-like) into 2 x 10⁶ healthy donor PBMCs respectively to simulate actual CTC blood samples with different PCS signatures. These artificial samples were then subjected to the NanoVelcro CTC-RNA assay to measure expression of CTC-PCS1 RNA expression and Z scores. (B) Normalized and hierarchical clustered heatmap of PCS1 RNA expression in the artificial blood samples (3 sets of 10 LNCaP cells spiked in 2 x 10⁶ healthy donor PBMCs and 3 sets 10 22Rv1 cells spiked in 2 x 10⁶ healthy donor PBMCs). (C) PCS1 Z score comparison of LNCaP artificial blood samples and 22Rv1 artificial blood samples. (T-test, P=0.042*).
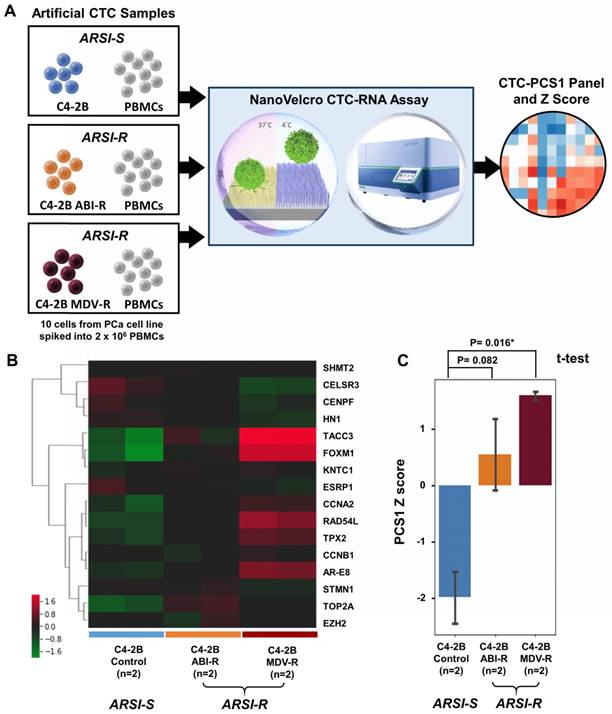
To demonstrate the ability of the NanoVelcro CTC-RNA Assay and the CTC-PCS1 panel for differentiating ARSI sensitivities of CTC samples, we prepared three sets of artificial CTC samples using the same number of PCa cell lines with different ARSI sensitivity (10 cells for each sample) and healthy donor PBMCs (2 x 10⁶ cells for each sample) as described above. Three well-characterized PCa cell lines, i.e., C4-2B treatment naïve (control) [28], C4-2B ABI-R [29], and C4-2B MDV-R [30, 31] were chosen to conduct the experiment. The C4-2B treatment naïve control cell line was considered to be sensitive to ARSIs (ARSI-S) while C4-2B ABI-R showed resistance to abiraterone acetate, an ARSI (ARSI-R) and C4-2B MDV-R showed resistance to enzalutamide, another ARSI (ARSI-R). We processed the samples using the workflow described in Figure 4A in duplicate and performed normalization and hierarchical clustering using on the CTC-PCS1 gene expression (Figure 4B). The PCS1 Z score of each sample was calculated based-on the CTC-PCS1 gene expression (Figure 4C). As expected, the C4-2B control samples (ARSI-S) had the lowest Z score, whereas the C4-2B ABI-R (abiraterone-resistant, ARSI-R) samples and C4-2B MDV-R (enzalutamide-resistant, ARSI-R) samples showed higher Z score (T-test P=0.082 and 0.016*, respectively) comparing to the control. Overall, this result showed that the increase in PCS1 Z score is associated with ARSI resistance.
Cell line study of CTC-PCS1 panel for distinguishing ARSI sensitivity (A) Study workflow of the NanoVelcro CTC-RNA assay and CTC-PCS1 panel for profiling artificial blood samples of different ARSI sensitivities. Artificial CTC were prepared by spiking 10 cells of C4-2B treatment naïve (control, ARSI-S), C4-2B ABI-R (abiraterone-resistant, ARSI-R), and C4-2B MDV-R (enzalutamide-resistant, ARSI-R) into 2 x 10⁶ healthy donor PBMCs respectively to simulate actual CTC blood samples. These artificial samples were then subjected to the NanoVelcro CTC-RNA assay, generating CTC-PCS1 RNA expression and Z scores. (B) Normalized and hierarchical clustered heatmap of PCS1 RNA expression in C4-2B treatment naïve (control, ARSI-S), C4-2B ABI-R (abiraterone-resistant, ARSI-R) and C4-2B MDV-R (enzalutamide-resistant, ARSI-R) artificial blood samples. (2 sets of 10 C4-2B control cells spiked in 2 x 10⁶ healthy donor PBMCs, 2 sets 10 C4-2B ABI-R cells spiked in 2 x 10⁶ healthy donor PBMCs and 2 sets 10 C4-2B MDV-R cells spiked in 2 x 10⁶ healthy donor PBMCs). (C) PCS1 Z score comparison of C4-2B control artificial blood samples comparing to C4-2B ABI-R artificial blood samples and C4-2B MDV-R artificial blood samples. (T-test, P=0.082 and 0.016* respectively)
Altogether, the NanoVelcro CTC-RNA assay and the CTC-PCS1 Panel demonstrate high capacity of profiling the PCS1 subtype and ARSI resistance in artificial CTC samples of PCa cells with background WBCs, paving the way for further testing in clinical blood samples.
NanoVelcro CTC-RNA Assay Results in Patient Samples
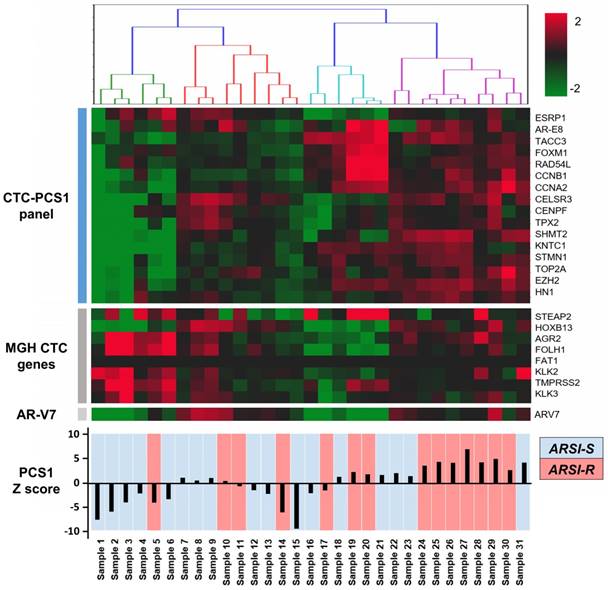
We performed CTC isolation and RNA quantification of the CTC-PCS1 panel using the NanoVelcro CTC-RNA assay with the selected 31 patient blood samples. After normalization, the expression of genes in the CTC-PCS1 panel, MGH CTC panel, as well as AR-V7 are shown in Figure 5. The 31 CTC samples were ordered by hierarchical clustering against CTC-PCS1 genes. The heatmap shows that samples from patients obtained during the emergence of drug resistance (i.e., ARSI-R, in red) have higher RNA expression in the CTC-PCS1 panel, while samples obtained from patients stable during therapy (i.e., ARSI-S, in blue) exhibited lower RNA expression in CTC-PCS1 panel. The PCS1 Z scores were computed to represent the likelihood of the PCS1 phenotype in each sample (Figure 5). We also calculated the MGH CTCM score using the genes and weightings designated by the published study [15] (shown in Figure 6B).
NanoVelcro CTC-RNA assay results in patient samples. RNA expression of target genes in the PCS1 panel, MGH CTC panel, as well as AR-V7 are shown. Total of 31 mCRPC patient samples are labeled as abiraterone acetate and enzalutamide sensitive (ARSI-S, in blue) and abiraterone acetate and enzalutamide resistant (ARSI-R, in red). The PCS1 Z score generated by gene expression in PCS1 panel is also shown, which is highly correlated with patients' clinical drug sensitivity status.
Analysis of gene scores between ARSI-S and ARSI-R samples. Comparison of (A) PCS1 Z score and (B) MGH CTCM score among 31 mCRPC samples, with 17 samples from ARSI sensitive state (ARSI-S), and 14 samples from ARSI resistant state (ARSI-R). PCS1 Z score is statistically significant higher in resistant patients (Rank-sum test, P=0.003*). No statistically significant trend was found in MGH CTCM score between the 2 groups (P=0.309). Similar tests performed using (C) AR-V7 expression and (D) serum PSA level are also shown. Serum PSA level exhibits statistically significant higher value in the resistant patients (P=0.007*). (E) Receiving Operating Characteristics (ROC) curve analysis of PCS1 Z score separating ARSI-S and ARSI-R patients. ROC curve exhibits Area Under Curve (AUC)= 0.75, P=0.0192*.
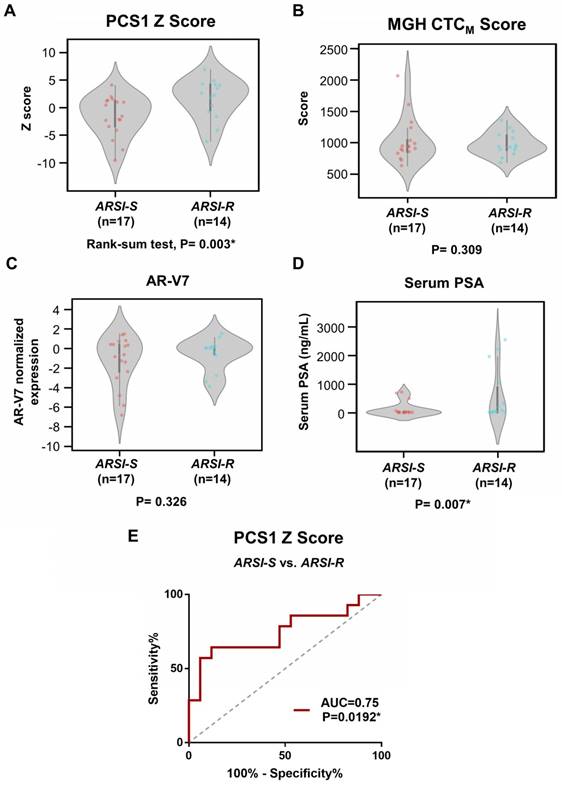
We compared the difference of PCS1 Z score and the MGH CTCM score between drug sensitive (i.e., ARSI-S, n=17) and drug resistant (i.e., ARSI-R, n=14) samples. The PCS1 Z scores were higher in ARSI-R samples when compared with ARSI-S samples with statistical significance (Rank-sum test, P=0.003*, Figure 6A). There was no detectable difference in the MGH CTCM score between the two cohorts (P=0.309, Figure 6B). We performed similar tests comparing ARSI-S samples and ARSI-R samples using AR-V7 expression (Figure 6C) and serum PSA concentration (Figure 6D). There was no detectable difference in AR-V7 expression (P=0.326) while serum PSA concentration was higher in ARSI-R patients (P=0.007*). Receiving Operating Characteristic (ROC) curve analysis of the PCS1 Z score was performed to test the sensitivity and specificity of the PCS1 Z score as a means of identifying sensitive and resistant patients. The area-under-curve (AUC) was 0.75, P=0.0192* (Figure 6E).
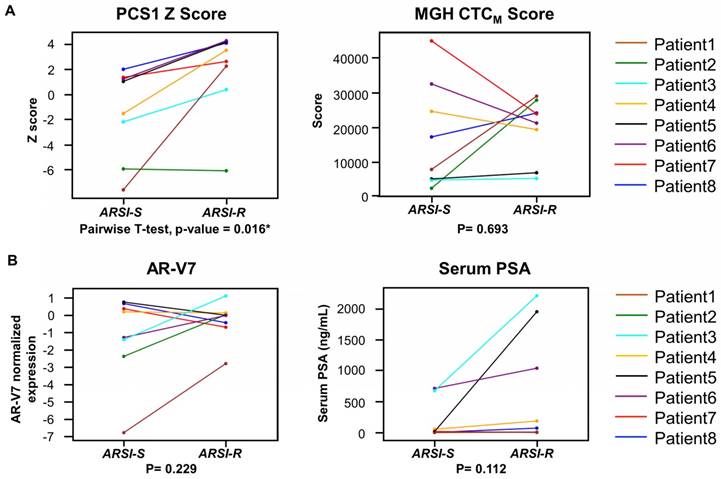
We next compared the 2 different time points (from ARSI sensitive to resistant) in PCS1 Z score, MGH CTCM score, AR-V7 and serum PSA of the same patients who had serial blood specimens available (Figure 7). In this study, of the eight patients (Patient ID 1-8) provided serial samples as noted above (1 ARSI-S sample and 1 ARSI-R sample), seven patients (87.5%) had an increase in their PCS1 Z score as resistance emerged (Figure 7A). A pairwise t-test showed a statistically significant increase of PCS1 Z score (P=0.016*). The same analysis was done with MGH CTCM score. However, no consistent trend or statistically significant difference was found within between the two timepoints (P=0.693). AR-V7 expression and serum PSA level also showed differences that were not statistically significant in pairwise t-test (P=0.229 and 0.112, respectively, Figure 6B).
Analysis of gene signature score changes in continuous samples from individual patients. (A) Line plot depicts changes of PCS1 Z score for each patient from ARSI sensitive to resistant. Individual patients are displayed with different colors. Pairwise t-tests were conducted and PCS1 Z score showed a statistically significant increase from ARSI sensitive to resistant (P = 0.016*). No statistically significant trend of the MGH CTCM score was observed between the 2 timepoints (P = 0.693). (B) Same analysis was done with AR-V7 expression and serum PSA level. No statistically significant trend was observed in pairwise t-tests between the 2 timepoints (P = 0.229 and 0.112, respectively).
Discussion
The successful demonstration of a nanotechnology-enabled liquid biopsy platform, i.e., the NanoVelcro CTC-RNA Assay, allows for reliable and reproducible profiling of biologically and clinically relevant RNA signatures (i.e., the CTC-PCS1 panel) in mCRPC. Proof-of-concept studies using artificial and mCRPC patient blood samples revealed that the resulting CTC-derived PCS1 signature and PCS1 Z score can be used to correlate with ARSI sensitivities.
In PCa, the use of clinically relevant RNA profiling is a rapidly growing area of research. The use of these classifiers can improve risk categorization beyond the current CAPRA classification [42] and can provide additional information of disease prognosis [6-8]. The availability of these RNA expression classifiers creates an opportunity for studying mCRPC where there is an unmet need for more precise treatment selection given the growing number of available therapeutic agents [2]. The PCS system developed by our group [10] tried to address this unmet need by identifying resistance of the most widely used mCRPC treatment, i.e., the ARSIs, using RNA profiling of PCa tumors. Previously, we developed the PCS system by computationally assembling a large virtual cohort (n = 1,321) of human PCa transcriptomic RNA profiles from 38 distinct cohorts and, using pathway activation signatures of known relevance to PCa. A novel classification system was developed consisting of three distinct subtypes (i.e., PCS1 vs. non-PCS1 subtypes-PCS2/3), and we showed that diseases with a PCS1 profile progress more rapidly to metastasis in comparison with other subtypes. We also demonstrated that the PCS1 subtype reflected resistance to ARSIs (e.g., enzalutamide). Although the PCS subtyping can provide additional information about ARSI resistance and prognosis, this kind of RNA subtyping method is still limited by the need of tumor tissue acquisition. In the setting of advanced mCRPC, tissue biopsies are not typically obtained as a part of standard practice because the majority of metastases happens in bone. The bone biopsy procedures are invasive, and the yield of materials obtained from bone are often insufficient for reliably generating tumor RNA profiling, thus have prevented this approach from being widely disseminated.
To address the unmet need for non-invasive tumor RNA profiling, we developed the NanoVelcro CTC-RNA assay (i.e., TR-NanoVelcro CTC purification system + NanoString nCounter platform) for profiling a refined CTC-PCS1 panel that allowed for non-invasively characterize ARSI sensitivities in mCRPC patients (Figure 1). In contrast to the current CTC purification assays [13, 15], which are limited in their ability to quantify the small amount of disease-specific RNA in the background of molecular signatures from WBCs, the NanoVelcro CTC-RNA assay is capable of quantifying disease-specific RNA markers with high sensitivity and specificity in CTC samples. By using the TR-NanoVelcro technology [23, 24], CTCs were purified with high efficiency providing high quality of CTC-derived RNA. Moreover, the use of the digital barcode system of the NanoString nCounter platform enabled quantification of small amounts of disease-specific RNA in a single reaction [22], even with background signals from contaminating WBCs. The ability to measure expression of multiple genes simultaneously led us to develop and test a unique gene panel (i.e., the CTC-PCS1 panel) refined from the PCS system [10] and capable of identifying the PCS1 subtype in CTCs. We translated the tissue-based PCS panel into CTC-PCS1 panel by specifically selecting the genes known to have high expression in PCa and low expression in WBCs. The RNA signature of the CTC-PCS1 panel were selected through multiple public and internal PCa RNA expression datasets and validated with the original PCS classifier to ensure the robustness (Figure 2). This rigorous bioinformatic process for the CTC-PCS1 panel results in a CTC-specific RNA expression profile with minimal signals from the background WBC.
We performed analytical validation of the NanoVelcro CTC-RNA assay and the CTC-PCS1 panel by using well-validated PCa cell lines as model systems. We examined the feasibility of applying the NanoVelcro CTC-RNA assay combined with the CTC-PCS1 panel for distinguishing PCS1-like subtype and non-PCS1 subtype. We prepared artificial CTC samples of PCa cells (i.e., 22Rv1 and LNCaP) spiked into healthy donor PBMCs (Figure 3A) to simulate the condition of the real CTC samples with different PCS signatures [10, 24-27, 32-34]. We found that the PCS1 Z score was significantly higher in the 22Rv1(PCS1-like) spiking samples compared with the LNCaP(non-PCS1) spiking samples (Figure 3B, 3C), indicating that the CTC-PCS1 panel is highly specific for identifying PCS1-like subtype. We further showed that the use of NanoVelcro CTC-RNA assay and the CTC-PCS1 panel can differentiate ARSI sensitivities by using a unique and well-validated PCa cell line model of ARSI sensitive and resistant developed by our group [28-31]. Using artificial samples of PCa cell lines spiked into healthy PBMCs (Figure 4A), we found that the C4-2B control cell (ARSI-S) samples have significantly lower PCS1 Z score comparing with C4-2B ABI-R (ARSI-R) and C4-2B MDV-R (ARSI-R) samples (Figure 4B, 4C). These results confirm the association between high PCS1 Z score with ARSI resistance, paving the way for testing the NanoVelcro CTC-RNA assay and the CTC-PCS1 panel in clinical patient samples.
Our clinical studies with 31 samples (17 ARSI-S samples and 14 ARSI-R samples) show that RNA expression profiles using the CTC-PCS1 panel are associated with sensitivity to ARSI treatment in individual mCRPC patients (Figure 6A). Furthermore, we showed that in individual patients, the PCS1 Z score increases (Figure 7A) when patients developed ARSI resistance defined by current clinical criteria (i.e., the PCWG3 and RECIST1.1 criteria). Our data demonstrate that CTC-derived RNA signature of the CTC-PCS1 panel can be measured in blood samples and used to associate with ARSI sensitivities. To our knowledge, this is the first study demonstrating the feasibility of transforming tissue-based RNA profiling into a non-invasive blood. Although there were 2 ARSI-R samples (sample 5, 14) showed relatively low PCS1 Z score while 1 ARSI-S sample (sample 31) showed relatively high PCS1 Z score, this might be due to our retrospective sample selection method, which was based on availability. There was some heterogeneity in baseline among the selected samples (Supplementary Table 1). Overall, we demonstrated the trend that the ARSI-R samples have higher PCS1 Z score and ARSI-S samples have lower PCS1 Z score.
For comparison, we have also conducted NanoVelcro CTC-RNA assay to measure a small panel of 8 genes reported by Miyamoto et al. [15] and generate the respective CTCM score. The resulting CTCM score failed to distinguish ARSI sensitivities in the same patient cohort (Figure 6B). This could be attributed to the fact that the CTCM score was originally developed to distinguish patients with metastases from those with localized disease [15], which is different from our patient cohort design. Furthermore, we were unable to identify differences in AR-V7 expression between ARSI sensitive and resistant patients using our approach (Figure 6C). The expression of AR-V7 has been associated with a resistance to ARSI therapy [19, 20]. However, recent reports also showed that expression of AR-V7 in CTCs [43, 44] and cell-free RNAs [44] does not entirely preclude the response to abiraterone or enzalutamide. Since AR-V7 expression only reflects a single variant interrupting the androgen signaling axis, focused characterization of AR-V7 may not be sufficient to provide insight into all the biological drivers that govern ARSI resistance of the disease. The CTC-PCS1 panel measures activity in key disease pathways embedded the PCS system [10], which regulate ARSI resistance and provide a wider view of biology than is the case with a single gene. Serum PSA, on the other hand, is the most widely used blood-borne biomarker in cancer. However, there is increasing evidence that serum PSA measurements have limited value in relating disease status or in guiding treatment selection. This is true especially for mCRPC patients whose PSA concentration remains low despite disease progression. From our data, the PCS1 Z score showed a significant increase when drug resistance emerged in individual patients (Figure 7A), while PSA concentration changes did not show a significant increase in every patient (Figure 7B). This might be due to the fact that PSA is a prostate epithelial differentiation marker that reflects AR pathway activity, while the PCS1 subtype reflects underlying mCRPC biology, including AR-indifferent disease [10]. As a blood-borne biomarker, our NanoVelcro CTC-RNA assay and CTC-PCS1 panel showed a more comprehensive view of ARSI sensitivity than serum PSA.
We recognize that our study consisted of a single-institution mCRPC cohort. However, even with a relatively small cohort, we were able to identify some significant, initial associations between CTC-PCS1 Z score and ARSI sensitivities. This initial finding justifies further study of this feature in a larger cohort to validate the discovery. This effort is currently ongoing.
In summary, we have demonstrated a first-in-class, non-invasive assay to characterize RNA signature panel in PCa CTCs by developing the NanoVelcro CTC-RNA assay (a combination of the TR-NanoVelcro CTC purification system, and the NanoString nCounter platform) and creating the CTC-PCS1 panel that consists of RNA signature specific to PCa CTCs. Utilizing this technology, we were able to non-invasively perform real-time disease profiling and detect RNA expression in mCRPC patients undergoing ARSI therapies. Moving forward, this approach could be used to study developed or developing tissue-based RNA panels that may help physicians to select therapies based on the RNA readouts at different time points of disease. Furthermore, this approach could be used to detect the relevant RNA signature changes associated with emergence of treatment resistance, allowing for patient-specific treatment selection and early detection of drug resistance, a goal in precision oncology.
Abbreviations
ARSI: androgen receptor signaling inhibitor
ARSI-R: androgen receptor signaling inhibitor-resistant
ARSI-S: androgen receptor signaling inhibitor-sensitive
AR-V7: androgen receptor splice variant-7
ATCC: American Type Culture Collection
AUC: area-under-curve
CCLE: Cancer Cell Line Encyclopedia
CSMC: Cedars-Sinai Medical Center
CTC: circulating tumor cell
DMAP: Differentiation Map
GLA-PNBX: Greater Los Angeles Veterans Affairs Healthcare System prostate needle biopsy
HPA: Human Protein Atlas
IRB: Institutional Review Board
mCRPC: metastatic, castration-resistant prostate cancer
PBMC: peripheral blood mononuclear cell
PCa: prostate cancer
PCS: Prostate Cancer Classification System
PCTA: Prostate Cancer Transcriptome Atlas
PCWG3: Prostate Cancer Working Group 3
PSA: prostate-specific antigen
RECIST1.1: Response Evaluation Criteria in Solid Tumors 1.1
RNA-seq: RNA sequencing
ROC: Receiving Operating Characteristic
TR: thermoresponsive
UOPBBB: Urologic Oncology Program Blood and Biospecimen Bank
VSN: Variance Stabilizing Normalization
WBC: white blood cell
Supplementary Material
Supplementary methods, figures and table.
Acknowledgements
This work was supported by the National Institutes of Health (R01-CA218356, R21-CA151159, R33-CA157396, P01-CA168585, R33-CA174562, P01-CA098912, U01-CA198900, and R44-CA180482) the Department of Defense Prostate Cancer Research Program- PC151088, PC171066, the Steven Spielberg Discovery Fund in Prostate Cancer Research, the St. Anthony Prostate Cancer Research Fund, the CD McKinnon Memorial Fund for Neuroendocrine Prostate Cancer, the Michael & Patricia Berns Family Fund, the Prostate Cancer Foundation Creativity Award and Stuart Rahr Young Investigator Award, the UCLA Prostate Cancer SPORE Program.
Competing Interests
The authors declare the following competing financial interest(s): Following the guideline of CSMC conflicts of interest (COI) policy, Edwin Posadas would like to disclose his conflict of interest as an uncompensated advisory board member of CytoLumina Technologies Corp. Following the guideline of UCLA Conflict of Interest Review Committee (CIRC), Hsian-Rong Tseng would like to disclose his financial interest in CytoLumina Technologies Corp. given his role as the founder of the company.
References
1. Siegel RL, Miller KD, Jemal A. Cancer statistics, 2019. CA Cancer J Clin. 2019;69:7-34
2. Litwin MS, Tan H. The diagnosis and treatment of prostate cancer: A review. JAMA. 2017;317:2532-42
3. Goodall J, Mateo J, Yuan W, Mossop H, Porta N, Miranda S. et al. Circulating Cell-Free DNA to Guide Prostate Cancer Treatment with PARP Inhibition. Cancer Discov. 2017;7:1006
4. Humphrey PA. Gleason grading and prognostic factors in carcinoma of the prostate. Mod Pathol. 2004;17:292
5. Cooperberg MR, Pasta DJ, Elkin EP, Litwin MS, Latini DM, DuChane J. et al. The UCSF Cancer of the Prostate Risk Assessment (CAPRA) Score: a straightforward and reliable preoperative predictor of disease recurrence after radical prostatectomy. J Urol. 2005;173:1938-42
6. Erho N, Crisan A, Vergara IA, Mitra AP, Ghadessi M, Buerki C. et al. Discovery and Validation of a Prostate Cancer Genomic Classifier that Predicts Early Metastasis Following Radical Prostatectomy. PLoS One. 2013;8:e66855
7. Cuzick J, Swanson GP, Fisher G, Brothman AR, Berney DM, Reid JE. et al. Prognostic value of an RNA expression signature derived from cell cycle proliferation genes in patients with prostate cancer: a retrospective study. Lancet Oncol. 2011;12(3):245-55
8. Zhao SG, Chang SL, Erho N, Yu M, Lehrer J, Alshalalfa M. et al. Associations of Luminal and Basal Subtyping of Prostate Cancer With Prognosis and Response to Androgen Deprivation Therapy. JAMA Oncol. 2017;3(12):1663-1672
9. Spratt DE, Zhang J, Santiago-Jiménez M, Dess RT, Davis JW, Den RB. et al. Development and Validation of a Novel Integrated Clinical-Genomic Risk Group Classification for Localized Prostate Cancer. J Clin Oncol. 2017;36:581-90
10. You S, Knudsen BS, Erho N, Alshalalfa M, Takhar M, Al-Deen Ashab H. et al. Integrated Classification of Prostate Cancer Reveals a Novel Luminal Subtype with Poor Outcome. Cancer Res. 2016;76:4948-58
11. Danila DC, Heller G, Gignac GA, Gonzalez-Espinoza R, Anand A, Tanaka E. et al. Circulating Tumor Cell Number and Prognosis in Progressive Castration-Resistant Prostate Cancer. Clin Cancer Res. 2007;13:7053
12. Heitzer E, Auer M, Ulz P, Geigl JB, Speicher MR. Circulating tumor cells and DNA as liquid biopsies. Genome Med. 2013;5(8):73
13. Kalinich M, Bhan I, Kwan TT, Miyamoto DT, Javaid S, LiCausi JA. et al. An RNA-based signature enables high specificity detection of circulating tumor cells in hepatocellular carcinoma. Proc Natl Acad Sci U S A. 2017;114:1123-8
14. Shen M-Y, Chen J-F, Luo C-H, Lee S, Li C-H, Yang Y-L. et al. Glycan Stimulation Enables Purification of Prostate Cancer Circulating Tumor Cells on PEDOT NanoVelcro Chips for RNA Biomarker Detection. Adv. Healthcare Mater. 2018;7:1700701
15. Miyamoto DT, Lee RJ, Kalinich M, LiCausi J, Zheng Y, Chen T. et al. An RNA-based digital circulating tumor cell signature is predictive of drug response and early dissemination in prostate cancer. Cancer Discov. 2018;8(3):288-303
16. Yu M, Ting DT, Stott SL, Wittner BS, Ozsolak F, Paul S. et al. RNA sequencing of pancreatic circulating tumour cells implicates WNT signalling in metastasis. Nature. 2012;487:510-3
17. Miyamoto DT, Zheng Y, Wittner BS, Lee RJ, Zhu H, Broderick KT. et al. RNA-Seq of single prostate CTCs implicates noncanonical Wnt signaling in antiandrogen resistance. Science. 2015;349:1351-6
18. Antonarakis ES, Lu C, Luber B, Wang H, Chen Y, Nakazawa M. et al. Androgen Receptor Splice Variant 7 and Efficacy of Taxane Chemotherapy in Patients With Metastatic Castration-Resistant Prostate Cancer. JAMA Oncol. 2015;1:582-91
19. Antonarakis ES, Lu C, Wang H, Luber B, Nakazawa M, Roeser JC. et al. AR-V7 and resistance to enzalutamide and abiraterone in prostate cancer. N Engl J Med. 2014;371:1028-38
20. Antonarakis ES, Lu C, Luber B, Wang H, Chen Y, Zhu Y. et al. Clinical Significance of Androgen Receptor Splice Variant-7 mRNA Detection in Circulating Tumor Cells of Men With Metastatic Castration-Resistant Prostate Cancer Treated With First- and Second-Line Abiraterone and Enzalutamide. J Clin Oncol. 2017;35:2149-56
21. Scher HI, Lu D, Schreiber NA. et al. Association of ar-v7 on circulating tumor cells as a treatment-specific biomarker with outcomes and survival in castration-resistant prostate cancer. JAMA Oncol. 2016;2:1441-9
22. Geiss GK, Bumgarner RE, Birditt B, Dahl T, Dowidar N, Dunaway DL. et al. Direct multiplexed measurement of gene expression with color-coded probe pairs. Nat Biotechnol. 2008;26:317-25
23. Hou S, Zhao H, Zhao L, Shen Q, Wei KS, Suh DY. et al. Capture and Stimulated Release of Circulating Tumor Cells on Polymer-Grafted Silicon Nanostructures. Adv Mater. 2013;25:1547-51
24. Ke Z, Lin M, Chen JF, Choi JS, Zhang Y, Fong A. et al. Programming thermoresponsiveness of NanoVelcro substrates enables effective purification of circulating tumor cells in lung cancer patients. ACS Nano. 2015;9:62-70
25. Lin M, Chen JF, Lu YT, Zhang Y, Song J, Hou S. et al. Nanostructure embedded microchips for detection, isolation, and characterization of circulating tumor cells. Acc Chem Res. 2014;47:2941-50
26. Chen J-F, Zhu Y, Lu Y-T, Hodara E, Hou S, Agopian VG. et al. Clinical Applications of NanoVelcro Rare-Cell Assays for Detection and Characterization of Circulating Tumor Cells. Theranostics. 2016;6:1425-39
27. Jan YJ, Chen J-F, Zhu Y, Lu Y-T, Chen SH, Chung H. et al. NanoVelcro rare-cell assays for detection and characterization of circulating tumor cells. Adv Drug Deliv Rev. 2018;125:78-93
28. Thalmann GN, Sikes RA, Wu TT, Degeorges A, Chang S-M, Ozen M. et al. LNCaP progression model of human prostate cancer: Androgen-independence and osseous metastasis. Prostate. 2000;44:91-103
29. Liu C, Armstrong C, Zhu Y, Lou W, Gao AC. Niclosamide enhances abiraterone treatment via inhibition of androgen receptor variants in castration resistant prostate cancer. Oncotarget. 2016;7:32210-20
30. Liu C, Lou W, Zhu Y, Nadiminty N, Schwartz CT, Evans CP. et al. Niclosamide inhibits androgen receptor variants expression and overcomes enzalutamide resistance in castration-resistant prostate cancer. Clin Cancer Res. 2014;20:3198-210
31. Liu C, Lou W, Zhu Y, Yang JC, Nadiminty N, Gaikwad NW. et al. Intracrine Androgens and AKR1C3 Activation Confer Resistance to Enzalutamide in Prostate Cancer. Cancer Res. 2015;75:1413-22
32. Chen JF, Ho H, Lichterman J, Lu YT, Zhang Y, Garcia MA. et al. Subclassification of prostate cancer circulating tumor cells by nuclear size reveals very small nuclear circulating tumor cells in patients with visceral metastases. Cancer. 2015;121(18):3240-51
33. Yao N, Jan Y-J, Cheng S, Chen J-F, Chung LWK, Tseng H-R. et al. Structure and function analysis in circulating tumor cells: using nanotechnology to study nuclear size in prostate cancer. Am J Clin Exp Urol. 2018;6:43-54
34. Lu YT, Zhao L, Shen Q, Garcia MA, Wu D, Hou S. et al. NanoVelcro Chip for CTC enumeration in prostate cancer patients. Methods. 2013;64:144-52
35. Scher HI, Morris MJ, Stadler WM, Higano C, Basch E, Fizazi K. et al. Trial Design and Objectives for Castration-Resistant Prostate Cancer: Updated Recommendations From the Prostate Cancer Clinical Trials Working Group 3. J Clin Oncol. 2016;34:1402-18
36. Eisenhauer EA, Therasse P, Bogaerts J, Schwartz LH, Sargent D, Ford R. et al. New response evaluation criteria in solid tumours: Revised RECIST guideline (version 1.1). Eur J Cancer. 2009;45:228-47
37. Levine DM, Haynor DR, Castle JC, Stepaniants SB, Pellegrini M, Mao M. et al. Pathway and gene-set activation measurement from mRNA expression data: the tissue distribution of human pathways. Genome Biol. 2006;7:R93
38. Novershtern N, Subramanian A, Lawton LN, Mak RH, Haining WN, McConkey ME. et al. Densely interconnected transcriptional circuits control cell states in human hematopoiesis. Cell. 2011;144:296-309
39. Barretina J, Caponigro G, Stransky N, Venkatesan K, Margolin AA, Kim S. et al. The Cancer Cell Line Encyclopedia enables predictive modelling of anticancer drug sensitivity. Nature. 2012;483:603-7
40. Uhlen M, Fagerberg L, Hallstrom BM, Lindskog C, Oksvold P, Mardinoglu A. et al. Proteomics. Tissue-based map of the human proteome. Science. 2015;347:1260419
41. Uhlen M, Oksvold P, Fagerberg L, Lundberg E, Jonasson K, Forsberg M. et al. Towards a knowledge-based Human Protein Atlas. Nat Biotechnol. 2010;28:1248
42. Zhao SG, Chang SL, Spratt DE, Erho N, Yu M, Ashab HA-D. et al. Development and validation of a 24-gene predictor of response to postoperative radiotherapy in prostate cancer: a matched, retrospective analysis. Lancet Oncol. 2016;17:1612-20
43. Bernemann C, Schnoeller TJ, Luedeke M, Steinestel K, Boegemann M, Schrader AJ. et al. Expression of AR-V7 in Circulating Tumour Cells Does Not Preclude Response to Next Generation Androgen Deprivation Therapy in Patients with Castration Resistant Prostate Cancer. Eur Urol. 2017;71:1-3
44. To SQ, Kwan EM, Fettke HC, Mant A, Docanto MM, Martelotto L. et al. Expression of Androgen Receptor Splice Variant 7 or 9 in Whole Blood Does Not Predict Response to Androgen-Axis-targeting Agents in Metastatic Castration-resistant Prostate Cancer. Eur Urol. 2018;73:818-21
Author contact
![]() Corresponding authors: Edwin M. Posadas, MD: edwin.posadasedu, +1-310-423-7600; Hsian-Rong Tseng, PhD: HRTsengucla.edu, +1-310-794-1977; Sungyong You, PhD: sungyong.youorg , +1-310-423-5725; Michael R. Freeman, PhD: michael.freemanorg , +1-310-423-7069.
Corresponding authors: Edwin M. Posadas, MD: edwin.posadasedu, +1-310-423-7600; Hsian-Rong Tseng, PhD: HRTsengucla.edu, +1-310-794-1977; Sungyong You, PhD: sungyong.youorg , +1-310-423-5725; Michael R. Freeman, PhD: michael.freemanorg , +1-310-423-7069.