Impact Factor
- Issue 14; 2026
- Issue 13; 2026
- Issue 12; 2026
- Issue 11; 2026
- Issue 10; 2026
- Volume 16; 2026
- Advance Articles
- Past Issues
- Cover Images
- Cover Suggestion
- Index & Coverage
- Special Issues
Introduction
Materials and Methods
Results
Discussion
Abbreviations
Supplementary Material
Acknowledgements
References
International Journal of Biological Sciences
International Journal of Medical Sciences
 Global reach, higher impact

Theranostics 2019; 9(9):2712-2726. doi:10.7150/thno.31424 This issue Cite
Research Paper
EGFR drives the progression of AKI to CKD through HIPK2 overexpression
Luyang Xu1,2,3*, Xiaozhou Li1,2*, Fei Zhang1,2,3, Lidong Wu3, Zheng Dong4,5, Dongshan Zhang1,2 ![]()
1. Department of Emergency Medicine, Second Xiangya Hospital, Central South University, Changsha, Hunan, People's Republic of China.
2. Emergency Medicine and Difficult Diseases Institute, Central South University, Changsha, Hunan, People's Republic of China.
3. Department of Emergency Medicine, The Second Affiliated Hospital of Nanchang University, Nanchang, Jiangxi, China, People's Republic of China.
4. Department of Nephrology, Second Xiangya Hospital, Central South University, Changsha, Hunan, People's Republic of China.
5. Department of cellular Biology and anatomy, Medical college of Georgia at Georgia Regents University and Charlie Norwood VA Medical Center, Augusta, GA, USA
* Co-first authors in this study
Received 2018-11-12; Accepted 2019-2-25; Published 2019-4-13
Abstract

The molecular mechanism underlying the transition of acute kidney injury (AKI) to chronic kidney disease (CKD) induced by vancomycin (VAN) remains largely unknown.
Methods: The mice model of VAN drives AKI to CKD was developed to investigate the role and molecular mechanism of epidermal growth factor receptor (EGFR). The EGF receptor mutant (Wa-2) mice and gefitinib were used to inactivation of EGFR. The homeodomain interacting protein kinase 2 (HIPK2) siRNA was applied to silence of HIPK2. Human proximal tubular epithelial cells (HK-2) were used to explore the molecular regulation methanism of EGFR. ChIp analysis was used to investigate if STAT3 interaction with the promoter of HIPK2.
Results: A novel VAN-induced AKI mouse model was established for the first time. Moreover, the expression levels collagen I&IV, α-SMA, p-EGFR and the expression of HIPK2 proteins were upregulated in this model. Interestingly, AKI caused by VAN was markedly attenuated in waved-2 mice at the early stage, as evidenced by the suppression of renal dysfunction, renal cell apoptosis and caspase3 activation. In the latter stage, renal fibrosis and inflammation were significantly ameliorated in Wa-2 mice, accompanied by the downregulation of profibrotic molecules and F4/80. Besides, the expression levels of HIPK2 and p-STAT3 were suppressed in Wa-2 mice during VAN-induced transition of AKI to CKD. In addition, renal fibrosis and inflammation, profibrotic molecules, and EGFR/STAT3/HIPK2 signaling were ameliorated by gefitinib treatment after VAN-induced AKI. These results were consistent with the findings of Wa-2 mice. EGFR/STAT3 signaling mediated VAN-induced HIPK2 expression in HK-2 cells. ChIp analysis revealed that STAT3 directly bound to the promoter region of HIPK2. Finally, inhibition of HIPK2 attenuated the VAN drove the progression of AKI to CKD.
Conclusion: These data suggest that EGFR plays an important role in VAN-driven progression of AKI to CKD.
Keywords: VAN, EGFR, fibrosis, STAT3, ERK, HIPK2
Introduction
AKI has been considered as one of the most important causes of morbidity and mortality in critically ill patients, which accounted for 50% of all death [1-3]. AKI is widely accepted as a reversible form of renal dysfunction, however, recent studies demonstrate that AKI may lead to CKD [2, 4-8]. Most studies have focused on the transition of AKI to CKD induced by ischemia-reperfusion, and repeated treatment of cisplatin, aristolochic acid, diphtheria toxin or folic acid [9]. Previous studies have reported that VAN, an antibiotic for treating gram-positive bacterial infection, can cause damage to the kidneys and lead to AKI [10-12]. Further clinical observations indicate that most cases of VAN-induced AKI are found to be reversible, and part of them may have a higher incidence of end-stage renal disease [13]. However, the rodent model of AKI to CKD induced by VAN is yet to be established, and its underlying molecular mechanism remains largely unknown.
Previous studies have shown that EGFR inhibition delayed the recovery of renal function following ischemia injury in Wa-2 mice and in mice with specific proximal tubule EGFR deletion [14-16]. Several other studies suggest that EGFR is responsible for the progression of renal fibrosis in subtotal renal ablation [17, 18], hypertension nephropathy [19], and unilateral ureteral obstruction [20]. However, these studies independently investigated the effects of EGFR on renal recovery and fibrosis. A recent study has focused on the role of EGFR in the progression of AKI to CKD, and the findings demonstrate that EGFR exerts a renoprotective role in the early phase of ischemia-reperfusion injury, and modulates the progression of renal fibrosis during its late phase [21]. In all, these findings strongly suggest a dual role of EGFR in different phases of ischemia-reperfusion injury. Nonetheless, it remains unclear whether EGFR can modulate the progression of AKI to CKD during VAN treatment.
Therefore, in the present study, VAN-induced AKI model was used to clarify the role of EGFR in the regulation of AKI to CKD. In addition, the molecular mechanisms underlying the effects of EGFR were explored. Our data demonstrated that VAN could induce a sustained activation of EGFR, resulting in the renal cell apoptosis at early stage and the progression of renal fibrosis at latter stage. Furthermore, EGFR/STAT3-mediated HIPK2 overexpression was identified as the key regulatory mechanism in VAN-induced transition of AKI to CKD.
Materials and Methods
Antibodies and reagents
Antibodies were purchased from the following sources: p-EGFR, EGFR, p-ERK1/2, ERK1/2, p-STAT3, STAT3, HIPK-2, total caspase3, cleaved caspase 3 and F4/80 were from Cell Signaling Technology (Dancers, MA); whereas collagen І&IV, fibronectin, GAPDH, α-SMA and β-actin were from Santa Cruz Biotechnology (Santa Cruz, CA, USA). HIPK2 siRNA and VAN were purchased from Sigma-Aldrich (St. Louis, MO, USA). Gefitinib and S3I-201 were purchased from AstraZeneca (Macclesfield, England). Ac-DEVD-AFC was purchased from Santa Cruz Biotechnology (Dallas, TX, USA).
Cell culture
HK-2 cells were cultured in DMEM (Sigma-Aldrich, St. Louis, MO) supplemented with 10% fetal bovine serum, 0.5% penicillin and streptomycin. The cells were maintained at 37°C in a humidified incubator in an atmosphere of 5% CO2 - 95% air. After incubation, 4 mM VAN with or without inhibitors of 5 nM gefitinib or 50 μM S3I-201 were used to treat the cells for 1 h at 37°C.
VAN induced AKI model
Eight to ten week-old male C57BL/6 mice were purchased from Sippr-BK Laboratory Animal Corporation (Shanghai, China). VAN-induced AKI model was established in Wa-2 mice (maintained on the C57BL/6 JeixC3H/HeSnJ inbred genetic background) and their male littermates aged 8-10 weeks as described previously [11, 12, 22]. All mice were housed and maintained under standard laboratory conditions (12-hour light/dark cycle), with access to food and water ad libitum. The designs of animal experiments were as follows:
Experimental protocol 1: Forty eight male mice were intraperitoneally injected with 600 mg/kg of VAN for 7 consecutive days, starting time of experiments was the first day of VAN injection, and then were euthanized on day 3 (n=8), day 7 (n=8), day 14 (n=8), day 21 (n=8) and day 28 (n=8). Intraperitoneal injection of saline into the mice was used as a control (n=8).
Experimental protocol 2: WT and Wa-2 littermate mice were divided into 4 groups: Group 1: Wild-type (WT) mice were intraperitoneally injected with saline for 7 consecutive days. Group 2: WT mice were intraperitoneally injected with 600 mg/kg of VAN for 7 consecutive days. Group 3: Wa-2 mice were intraperitoneally injected with saline. Group 4: Wa-2 mice were intraperitoneally injected with 600 mg/kg of VAN for 7 consecutive days. Mice were euthanized on day 0 (each group: n=8), day 3(each group: n=8), day 7(each group: n=8), day 14(each group: n=8), day 21(each group: n=8), and day 28(each group: n=8).
Experimental protocol 3: Thirty two animals were divided into 4 groups of 8 each. Group 1: Mice were intraperitoneally injected with saline for 28 consecutive days. Group 2: Mice were intraperitoneally injected with of 600 mg/kg VAN at a dose of for 7 consecutive days, and then received an intraperitoneal injection of saline for 21 consecutive days. Group 3: Mice were intraperitoneally injected with saline for 7 consecutive days, and then treated with 100 mg/kg gefitinib for 21 consecutive days. Group 4: Mice were intraperitoneally injected with 600 mg/kg VAN for 7 consecutive days, followed by gefitinib treatment (100 mg/kg) for 21 consecutive days. All mice were euthanized on day 28.
Experimental protocol 4: Sixty four animals were divided into 4 groups. Group 1: Mice were intraperitoneally injected with saline for 3 or 7 consecutive days. Group 2: Mice were intraperitoneally injected with of 600 mg/kg VAN at a dose of for 3 or 7 consecutive days, and then received an intraperitoneal injection of saline for 3 or 7 consecutive days. Group 3: Mice were intraperitoneally injected with 100 mg/kg gefitinib for 3 or 7 consecutive days. Group 4: Mice were intraperitoneally injected with of 600 mg/kg VAN at a dose of for 3 or 7 consecutive days, and then received an intraperitoneal injection of 100 mg/kg gefitinib for 3 or 7 consecutive days. Half of them were euthanized on day 3.The remains of them were euthanized on day 7.
Experimental protocol 5: C57/B6 mice were divided into four group. Group 1: Mice were injected with 15mg/kg Scramble via tail vein for 28 days. Group 2: Mice were intraperitoneally injected with of 600 mg/kg VAN at a dose of for 7 consecutive days, and received a tail vein injection of Scramble for 28 consecutive days. Group 3: Mice were injected with 15mg/kg HIPK2 siRNA via tail vein for 28 days. Group 4: Mice were intraperitoneally injected with of 600 mg/kg VAN at a dose of for 7 consecutive days, and received a tail vein injection of 15 mg/kg HIPK2 siRNA for 28 consecutive days. Mice were euthanized on day 0 (each group: n=8), day 3(each group: n=8), day 7(each group: n=8), day 14(each group: n=8), day 21(each group: n=8), and day 28(each group: n=8).
After 7 or 28 days of treatment, blood samples and renal tissues were collected for biochemical and histological analyses. All animal experiments were carried out in accordance with the guidelines formulated by the Care and Use of Laboratory Animals Institutional Committee from Second Xiangya Hospital, China.
Renal function, histology, and TUNEL assays
The levels of serum BUN and Cr were assessed using the commercial kits (Nanjing Jiancheng Bioengineering Institute, Jiangsu, China). The value was read at 510 nm (absorbance) and then calculated as mg/dL [11, 23-26]. Histological analysis was performed by hematoxylin and eosin (HE) staining. The histological variables were assessed by tubular damage score according to the method previously described [12, 23]. Renal cell apoptosis was examined using TUNEL kit, and quantified by counting the percentage of TUNEL-positive cells in 10-20 microscopic fields per tissue section [11].
Immunohistochemistry and immunoblot analysis
Immunoblotting was performed as previously described [21]. Briefly, HK-2 cells and mouse kidney tissues were lysed with RIPA lysis buffer (Sigma-Aldrich). Equal amounts of proteins in each lane were separated by SDS-PAGE prior to Western blotting. After transferring onto a nitrocellulose membrane (Amersham, Buckinghamshire, UK), the blots were probed with a mouse antibody to p-EGFR (1:500 dilution), EGFR (1:500 dilution), p-ERK1/2 (1:1000 dilution), ERK1/2 (dilution 1:1000), p-STAT3 (dilution 1:1000), STAT3 (dilution 1:1000), HIPK-2 (dilution 1:500), total caspase3 (dilution 1:1000), cleaved caspase 3 (dilution 1:1000), α-SMA (1:1000 dilution), collagen I (1:2000 dilution), collagen IV (1:2000 dilution) and FN (1:1000 dilution). Thereafter, a peroxidase conjugated goat anti-mouse IgG (1:20,000 dilution) was used as secondary antibody. Swine anti-rabbit IgG or rabbit anti-goat in PBS with 1% normal goat serum and 1% FCS, as well as β-actin or GAPDH were used as internal controls.
Immunohistochemistry
Immunohistochemical staining and image analysis of fibronectin, collagen IV& I and F4/80 were carried out according to previously described methods [27-30]. All the cell and tissues samples were incubated with anti-F4/80 (1:50 dilution), anti-α-SMA (1:100 dilution), anti-α-collagen I (1:100 dilution), collagen IV (1:100 dilution), FN (1:50 dilution) for 1 h. Subsequently, the samples were incubated with biotinylated secondary antibody, and treated with ABC reagent according to the manufacturer's instructions. IgG served as negative controls. Stained samples were visualized using an Olympus microscope equipped with UV epi-illumination. The fluorescence intensity of each sample was analyzed by image analysis software (Path QC, Logene Biological Medical Engineering Co. Ltd).
Real-Time PCR Analysis of HIPK2
Quantitative real-time RT-PCR (qRT-PCR) was performed using Bio-Rad (Hercules, CA) iQ SYBR Green Supermix with Opticon (MJ Research Inc., Waltham, MA, USA) according to the manufacturer's protocol. Total RNA (20 μg) was reverse-transcribed and subjected to qRT-PCR analysis. The thermal cycling conditions were as follows: an initial denaturation at 94°C for 2 min, followed by 30 cycles of 94°C for 15 s, 58°C for 30 s and 72°C for 30 s, and a final extension at 72°C for 10 min. The primers used are as follows: HIPK2: 5′-AGTTTTCTCCCCTCACAC-3′ (forward) and 5′-TAGGTTATGTGGTCCACC-3′ (reverse); GAPDH: 5'-GGTCTCCTCTGACTTCAACA-3' (forward) and 5'-GTGAGGGTCTCTCTCTTCCT-3' (reverse). The relative expression level of HIPK2 was calculated by 2-ΔΔCT method.
ChIP analysis
Chromatin immunoprecipitation (ChIP) analysis was carried out using commercial kit (Millipore, Boston, MA, USA) with primary antibodies against STAT3 [29]. Specific primers were used to detect the precipitated DNAs by qPCR as below: SBS1: 5′-AAATTCTGGAAATGGTGGTGAC-3′ and 5′- CTGCTGGGACTGGGGTTT-3′, SBS2: 5′-CAGAGGCACAGAAGACCGA-3′, and 5′-GCAGCTGTACCGTTTCACAT -3′.
Statistical analysis
All data were presented as mean ± SD. Differences between 2 groups were compared using two-tailed Student's t-test, while one-way ANOVA was performed for multiple group comparison. The level of statistical significance was set at P<0.05.
Results
VAN accelerates the transition of AKI to CKD in C57/B6 mice
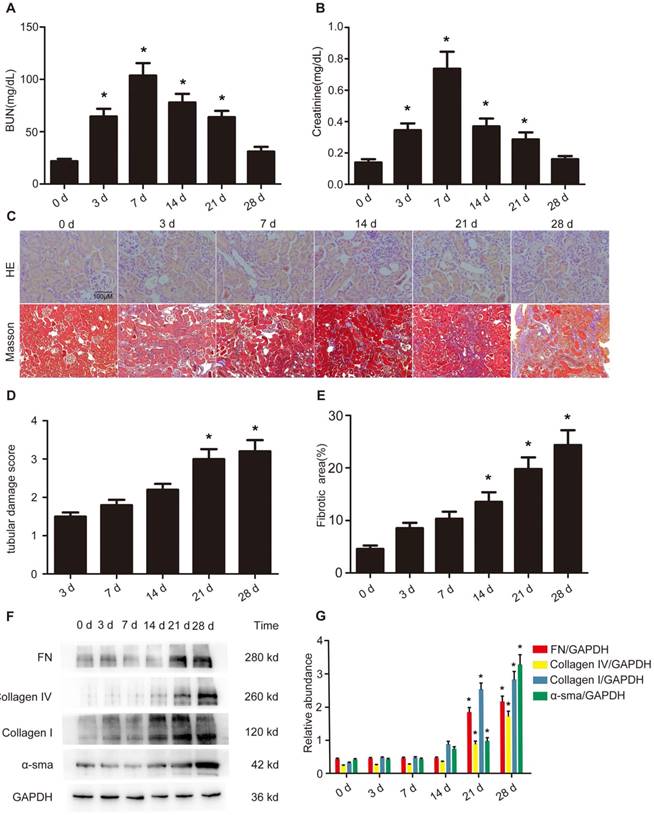
Although our previous findings have shown that AKI is induced by VAN [11, 12], it remains unclear whether VAN can drive the transition of AKI to CKD. After a intraperitoneal injection of VAN for 7 consecutive days, renal function assessment indicated that BUN and creatinine increased on day 3, reached to a peak level on day 7, and subsequently returned to normal on day 28 (Figure 1 A&B). Histopathological analysis revealed that VAN progressively increased renal tubular damage on day 3, and then gradually increased to a high level on day 28 (Figure 1C&E). Mason's trichrome staining demonstrated that interstitial expansion in collagen accumulation and deposition was higher on day 14, and then raised slowly to reach a peak level on day 28, as evidenced by an increase in fibrotic area (Figure 1D). In addition, these results were supported by the quantitative analysis of fibrotic area (Figure 1F). Furthermore, immunoblotting and densitometric analysis revealed that the expression levels of part of fibronectin, collagen I&IV and α-SMA were elevated on days 14, and then all of them increased gradually to a peak level on day 28 (Figure 1G&H). These results suggest that the progression of AKI to CKD is accelerated by VAN.
Accelerated progression of AKI to CKD by VAN treatment in C57/B6 mice. Male C57/B6 mice were injected with 600 mg/kg VAN for 7 consecutive days. The kidney tissue samples were collected from days 0-28. Detection of BUN (A) and creatinine (B) levels. (C) Histological examination by HE staining. (D) Renal fibrosis by Masson's trichrome staining. (E) Tubular damage score. (F) The results of tubulointerstitial fibrosis area in the kidney cortex. (G) Expression levels of fibronectin, collagen IV, collagen I, α-SMA and GAPDH detected by Western blot. (H) Densitometric ratios of fibronectin/GAPDH, collagen IV/GAPDH, collagen I/GAPDH, and α-SMA/GAPDH. Bar: 100 µM. Data are expressed as mean ± SD (n=8); * p<0.05 versus day 0. Original magnification, x400 in HE staining; x200 in Masson staining.
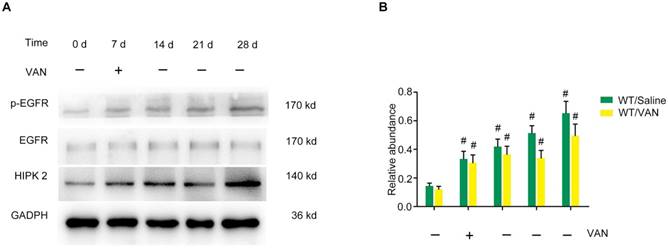
Overexpression of p-EGFR and HIPK2 during the VAN-induced progression of AKI to CKD in C57/B6 mice
Indeed, our previous study has demonstrated that EGFR can mediate AKI induced by lipopolysaccharide (LPS) [21]. Moreover, renal cell apoptosis and fibrosis are increased by homeo domain interacting protein kinase 2 (HIPK2) in Tg26 mice [31]. Hence, we hypothesized that the expression levels of p-EGFR (tyrosine 845 residue) and HIPK2 may be induced by VAN in C57/B6 mice. After a intraperitoneal injection of VAN for 7 consecutive days, immunoblot analysis revealed that p-EGFR/EGFR expression was increased on day 7, and reached its highest level on day 28 (Figure 2A). Similarly the expression level of HIPK2 was elevated on day 7, and then markedly increased to a peak level on day 28 (Figure 2A). These results were also verified by densitometric analysis (Figure 2B). Collectively, VAN induced the protein expression levels of p-EGFR and HIPK2 in C57/B6 mice.
Sustained activation of EGFR and overexpression of HIPK2 induced by VAN treatment in C57/B6 mice. Male C57/B6 mice were injected with 600 mg/kg VAN for 7 consecutive days. The kidney tissue samples were collected from day 0 to day 28. (A) Expression levels of p-EGFR, EGFR, HIPK2 and GAPDH detected by Western blot. (B) Densitometric ratios of p-EGFR/EGFR, EGFR/GAPDH and HIPK2/GAPDH. Data are expressed as mean ± SD (n=8); * p<0.05 versus day 0.
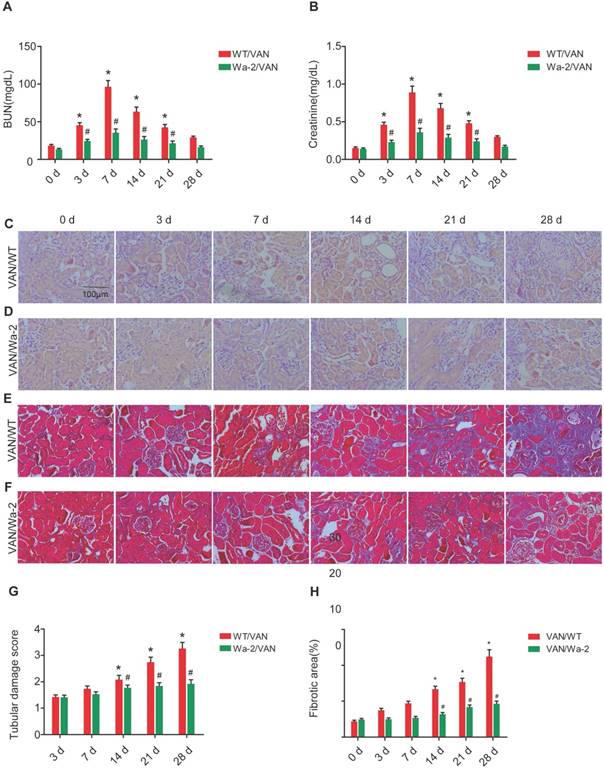
Reduced progression of AKI to CKD in Wa-2 mice
To investigate the inhibitory role of EGFR in the transition of AKI to CKD, WT and Wa-2 littermate mice were used in the present study. After days 3-21 of VAN treatment, the renal function was reduced in Wa-2 mice, as characterized by markedly degrade levels of BUN and creatinine (Figure 3A&B). The results of HE staining indicated that VAN caused tubular damage in WT mice, but was attenuated in Wa-2 mice (Figure 3C&D) at indicate time points. These histological findings were confirmed by tubular damage scores (Figure 3G). Masson's trichrome staining revealed that VAN enhanced the expansion of interstitial space and collagen accumulation in WT mice at day 14-28, but the increase was ameliorated in Wa-2 (Figure 3 E&F). Semiquantitative analysis of fibrotic area further supported the findings of Masson's trichrome staining (Figure 3H). These data indicate that EGFR mediates the progression of AKI to CKD during VAN treatment.
Attenuation of VAN-induced transition of AKI to CKD in Wa-2 mice. WT and Wa-2 littermate mice were injected with 600 mg/kg VAN or saline for 7 consecutive days. Kidney tissues and blood samples were collected on day 0-28. Evaluation of renal function via BUN (A) and serum creatinine (B) at different time points. (C&D) Tubular damage analyzed by HE staining. (E&F) Masson's trichrome staining. (G) The values of tubular damage score. (H) Histochemical analysis of tubulointerstitial fibrosis. Bar: 100 µM. Data are presented as mean ± SD (n=8); * P<0.05 versus WT/Saline group at day3 0; # P<0.05 versus VAN group. Original magnification, x400 in C-F.
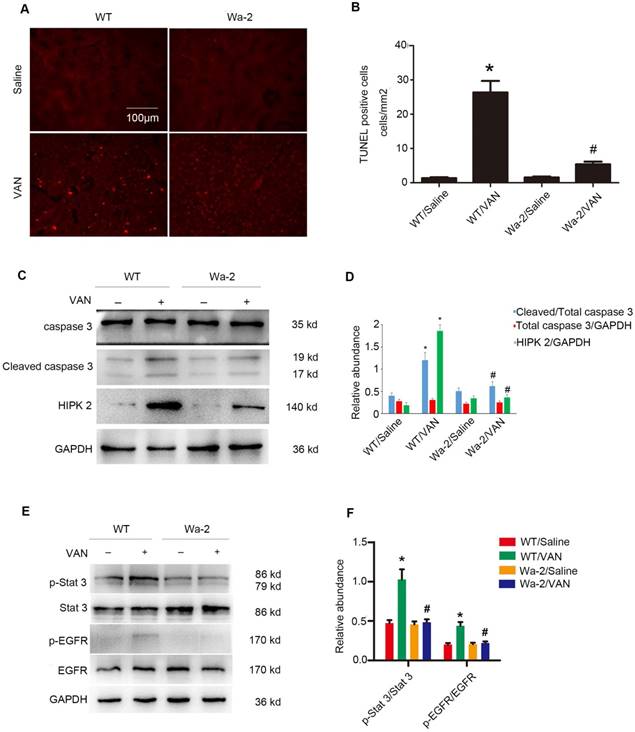
Suppression of VAN-induced renal cell apoptosis in Wa-2 mice by inactivation of STAT3 and downregulating HIPK2 expression
VAN-induced nephrotoxicity has been associated with renal cell apoptosis [11, 12]. In the present study, TUNEL staining demonstrated that VAN increased the amount of apoptotic cells in the cortical tissues of WT mice, but the opposite effect was observed in Wa-2 mice. These results were verified by the quantification of TUNEL-positive cells (Figure 4B). Besides, immunoblot analysis revealed that VAN enhanced the expression levels of cleaved caspase3, HIPK2, p-STAT3, and p-EGFR in WT mice, but were significantly suppressed in Wa-2 mice (Figure 4C&E). Additionally, the results of gray analysis were consistent with the expression patterns of these proteins (Figure 4D&F). These data suggest that HIPK2 overexpression can promote renal cell apoptosis during VAN treatment.
Inhibition of VAN-induced renal cell apoptosis by inactivating STAT3 and down regulation of HIPK2 in Wa-2 mice. WT and Wa-2 littermate mice were injected with 600 mg/kg VAN or saline for 7 consecutive days. (A) The kidney samples were subjected to TUNEL assay. (B) The percentage of TUNEL-positive cells (cells/mm2) were calculated. (C&E) Expression levels of total caspase3, cleaved caspase3, HIPK2, p-STAT3, STAT3, p-EGFR, EGFR and GAPDH detected by Western blot. (D&F) Densitometric ratios of cleaved caspase3/caspase3, caspase3/ GAPDH, HIPK2/GAPDH, p-STAT3/STAT3, p-EGFR/EGFR. Bar: 100µM. Data are shown as mean ± SD (n=8); * P<0.05 versus WT/Saline group; # P<0.05 versus VAN group. Original magnification, x200 in A and B.
EGFR drives the renal fibrosis progression of AKI to CKD via upregulation of STAT3 and HIPK2
To elucidate the mechanism underlying the role of EGFR in AKI to CKD transition, the expression levels of fibronectin, collagen IV, collagen I, α-SMA and HIPK2, as well as STAT3 signaling were investigated.
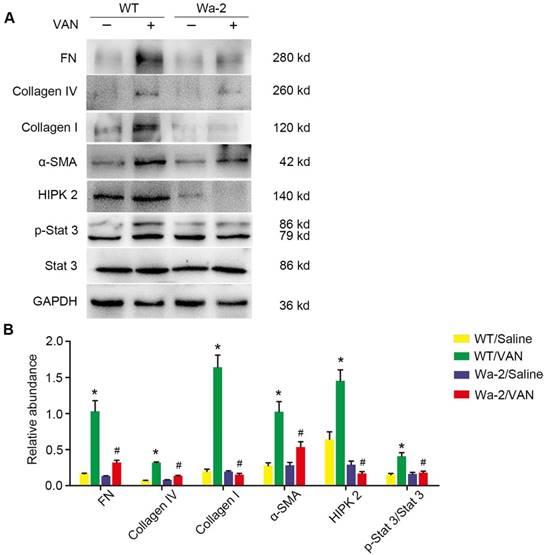
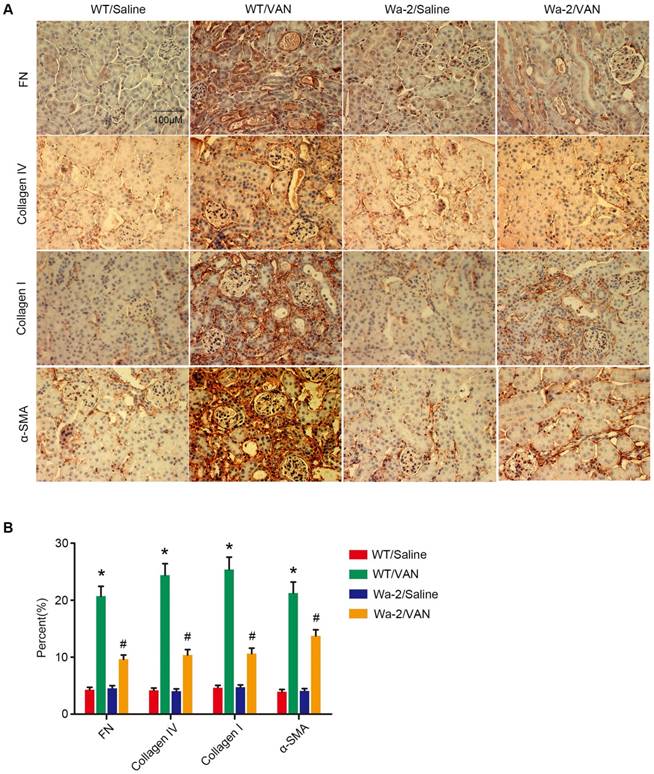
As shown in Figure 5A, elevated expression levels of fibronectin, collagen I, collagen IV, α-SMA and p-STAT3 were found in VAN-induced WT mice at day 28, but not STAT3 and HIPK2. In contrast, the high expression levels of fibronectin, collagen I, collagen IV, α-SMA and p-STAT3 were significantly inhibited in Wa-2 mice. Densitometric analysis further confirmed the expression patterns of these proteins (Figure 5B). Additionally, the changes in expression of these proteins were verified by the results of immunochemical staining (Figure 6A&B). These findings demonstrate that EGFR upregulates the expression levels of p-STAT3 and HIPK2 to drive VAN-induced renal fibrosis progression of AKI to CKD.
Amelioration of renal fibrosis in Wa-2 mice by inactivating STAT3 and downregulating HIPK2. WT and Wa-2 littermate mice were injected with 600 mg/kg VAN or saline for 7 consecutive days. The kidney tissue samples were collected on day 28. (A) Expression levels of fibronectin, collagen I, collagen IV, α-SMA, p-STAT3, STAT3, HIPK2 and GAPDH detected by Western blot. (B) Densitometric ratios of fibronectin/GAPDH, collagen I/GAPDH, collagen IV/GAPDH, p-STAT3/STAT3 and HIPK2/ GAPDH. Data are presented as mean ± SD. (n=8); * P<0.05 versus WT/Saline group; # P<0.05 versus VAN group.
Reduced expression of fibronectin, collagen IV, collagen I and ɑ-SMA in Wa-2 mice. WT and Wa-2 littermate mice were injected with 600 mg/kg VAN or saline for 7 consecutive days. After 28 days of treatment, the kidney tissue samples were collected and analyzed. Immunohistochemical staining (A) and quantitative image analysis (B-D) of fibronectin, collagen IV and collagen I and ɑ-SMA expression. Bar: 100 µM. Data are shown as mean ± SD (n=8); * P<0.05 versus WT/Saline group; # P<0.05 versus VAN group. Original magnification, x 400 in A.
Suppression of macrophage infiltration in Wa-2 mice
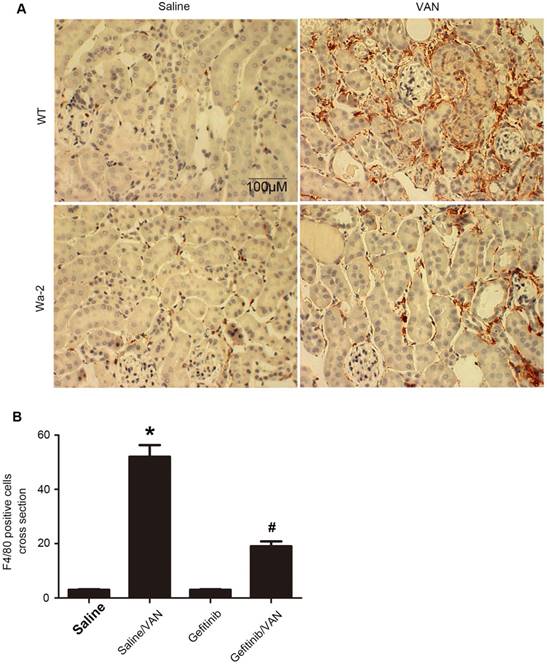
Macrophages play a pivotal role in renal fibrosis [29]. Hence, the association between EGFR and macrophage infiltration in VAN-induced transition of AKI to CKD was examined. The immunohistochemistry results showed a notable interstitial infiltration of macrophages at day 28 after VAN-induce AKI, but was markedly suppressed in Wa-2 mice (Figure 7A&B). Altogether, these data suggest that EGFR impedes macrophage infiltration and prevents VAN-induced progression of AKI to CKD.
Suppression of macrophage infiltration in Wa-2 mice. WT and Wa-2 littermate mice were injected with 600 mg/kg VAN or saline for 7 consecutive days. The kidney tissue samples were collected at day 28 after treatment. (A) Immunohistochemistry of macrophage in renal tissues. (B) Quantitation of macrophage infiltration in kidney tissues. Data are expressed as mean ± SD (n=8); * P<0.05 versus WT/Saline group; # P<0.05 versus VAN group. Bar: 100 µM. Original magnification, x 400 in A.
Gefitinib treatment ameliorated the VAN-induced AKI by downregulating HIPK2
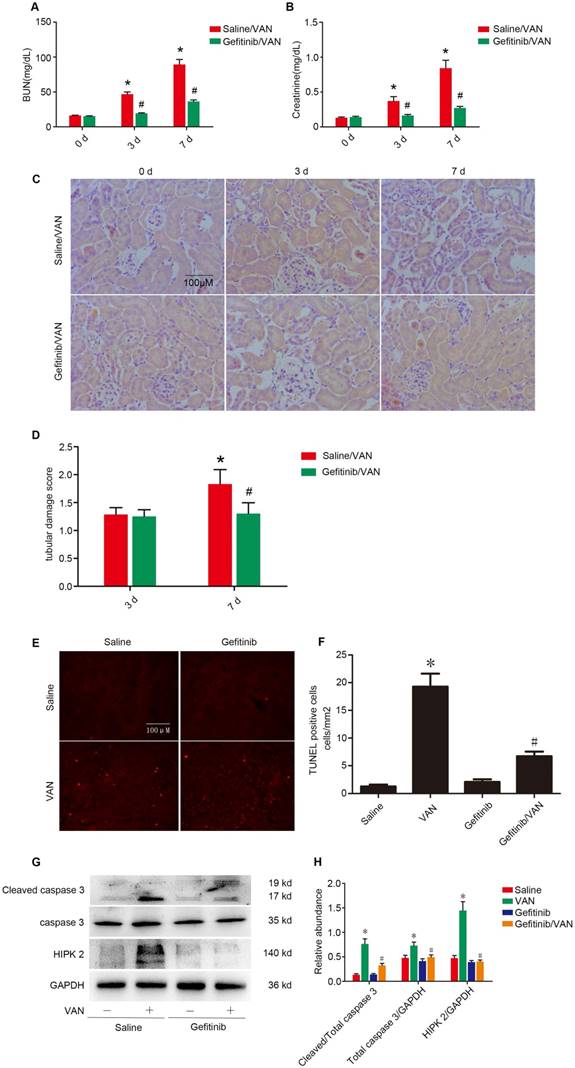
To further confirm the finding in Wa-2 mice, VAN was injected with gefitinib (a selective inhibitor of EGFR tyrosine kinase) for 3 and 7 days. As shown in Figure 8 A-C, VAN-induced the elevation of BUN and creatinine levels and tubular damage, which was markedly suppressed in Wa-2 mice. The tubular damage score further confirmed the finding of HE staining (Figure 8D). Furthermore, TUNEL staining indicated that gefitinib significantly reduced VAN-induced renal cell apoptosis, which were verified by the quantification of TUNEL-positive cells (Figure 8E&F). Finally, immunoblot analysis demonstrated that gefitinib markedly suppressed VAN-induced the expression levels of cleaved caspase3 and HIPK2 (Figure 8G&H).The results further suggested EGFR mediated VAN-indicated AKI by upregulation of HIPK2.
Gefitinib treatment attenuated the VAN-induced AKI via dowm regulation of HIPK2. Male C57/B6 mice were intraperitoneally injected with 600 mg/kg VAN plus with or without gefitinib at a daily dose of 100 mg/kg/d for 7 days. Kidney tissues and blood samples were collected on days 0-7. Evaluation of renal function via BUN (A) and serum creatinine (B) at different time points. (C) Tubular damage analyzed by HE staining. (D) The values of tubular damage score. (E) TUNEL assay of apoptosis in kidney sections. (F) Quantification of TUNEL positive cells. (G) Immunoblot analysis of HIPK2 and GAPDH expression. (H) Grayscale image analysis between them. Data are expressed as mean ± SD (n=8); * P<0.05 versus Saline group; # P<0.05 versus VAN group. Bar: 100 µM. Original magnification, x 200 in A.
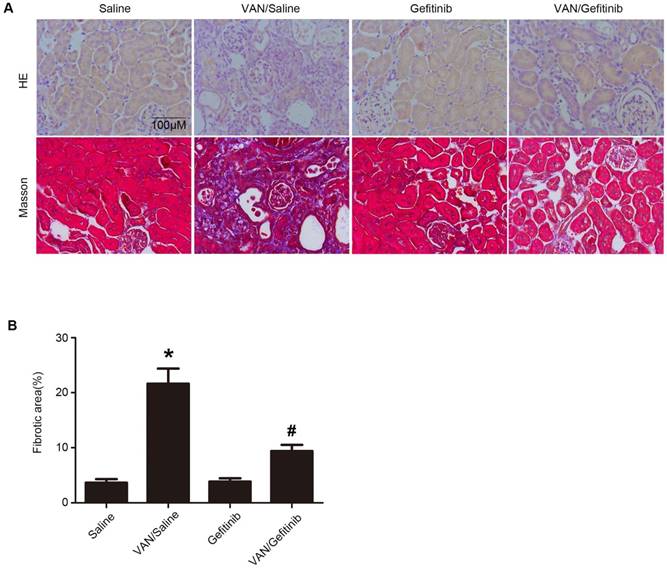
Amelioration of renal fibrosis by continued gefitinib treatment after VAN-induced AKI
To clarify whether EGFR inhibition can ameliorate renal fibrosis after AKI, gefitinib was injected daily for three weeks after 7-day continuous injection of VAN. As shown in Figure 9A&B, VAN-induced tubular damage and renal fibrosis were notably ameliorated by gefitinib treatment. Furthermore, semiquantitative analysis of fibrotic area confirmed the findings of Masson's trichrome staining (Figure 9C). These data suggest that EGFR inhibition ameliorates renal fibrosis, in addition to the attenuation of AKI.
Continued gefitinib treatment after VAN-induced AKI attenuated renal fibrosis. Male C57/B6 mice were intraperitoneally injected with gefitinib at a daily dose of 100 mg/kg/d for three weeks after 7-day continuous injection of 600 mg/kg VAN. The kidney tissue samples were collected for HE staining (A), Masson's trichrome staining (B), and histochemical analysis of tubulointerstitial fibrosis (C). Data are presented as mean ± SD (n=8); * P<0.05 versus Saline group; # P<0.05 versus VAN group. Bar: 100 µM. Original magnification, x400 in A and B.
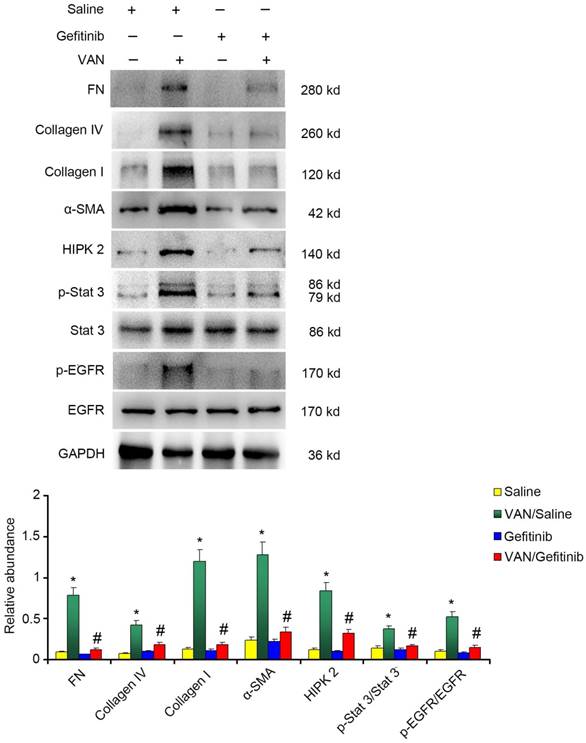
Continued gefitinib treatment after VAN-induced AKI ameliorates renal fibrosis and macrophage infiltration via STAT3 inactivation and HIPK2 downregulation
To explore the mechanism of EGFR underlying VAN-induced renal fibrosis, the expression levels of fibronectin, collagen IV, collagen I, α-SMA and HIPK2, as well as the activation of EGFR/STAT3 signaling were detected. As shown in Figure 10A&B, continued gefitinib treatment decreased VAN-induced high expression levels of fibronectin, collagen IV, collagen I, α-SMA and HIPK2, and activation of EGFR/STAT3 signaling. These findings were confirmed by immunohistochemical staining of the same proteins (Supplementary Figure 1). Furthermore, the infiltration of macrophages induced by VAN was markedly suppressed by gefitinib treatment (Supplementary Figure 2). The above-described mechanisms were found to be consistent with the experimental findings in Wa-2 mice.
Continued gefitinib treatment after VAN-induced AKI ameliorated renal fibrosis via STAT3 inactivation and HIPK2 downregulation. Male C57/B6 mice were intraperitoneally injected with gefitinib at a daily dose of 100 mg/kg/d for three weeks after 7-day continuous injection of 600 mg/kg VAN. The kidney tissue samples were collected for immunoblot analysis of fibronectin, collagen IV, collagen I, α-SMA, p-STAT3, STAT3, p-EGFR, EGFR, HIPK2 and GAPDH expression, followed by densitometric analysis of these proteins. Data are shown as mean ± SD (n=8); * P<0.05 versus Saline group; # P<0.05 versus VAN group.
The activation of EGFR/STAT3 pathways, but not ERK1/2, is promoted by VAN in HK-2 cells
In vivo study has demonstrated that the EGFR/STAT3 pathway is activated during VAN treatment. Therefore, we sought to determine if this pathway can be induced by VAN in HK-2 cells. Immunoblot analysis revealed that the expression of EGFR and STAT3 achieved their highest levels at 1 h in VAN-induced HK-2 cells, and then returned to baseline at 12 h (Supplementary Figure 3A). On the contrary, ERK1/2 expression was markedly suppressed by VAN treatment (Supplementary Figure 3A). Significant changes of protein expression were further confirmed by densitometric analysis (Supplementary Figure 3B&C). These data suggest that EGFR and STAT3 signaling pathways, but not ERK1/2, are activated by VAN in HK2 cells.
EGFR/STAT3 signaling mediates HIPK2 overexpression in VAN-induced HK-2 cells
To identify the signaling responsible for HIPK2 expression, HK-2 cells were treated with gefitinib. The results demonstrated that gefitinib significantly suppressed VAN-induced expression of p-STAT3 and HIPK2 in HK-2 cells via p-EGFR inhibition (Supplementary Figure 4A&B). In consideration of VAN-suppressed ERK1/2 signaling, we presumed that STAT3 might induce HIPK2 expression. Hence, S3I-201, a STAT3 inhibitor, was pretreated with VAN in HK-2 cells. As shown in Supplementary Figure 4C-E, S3I-201 markedly blocked the VAN-induced mRNA and protein expression of HIPK2 in HK-2 cells via STAT3 inactivation. Moreover, hypothesized that STAT3 could directly bind to HIPK2. In order to verify this hypothesis, ChIP assay was used for the subsequent experiments. As shown in Supplementary Figure 4F, the DNA fragments containing potential binding sites of SBS1 and SBS2 were immunoprecipitated by the antibody directed against STAT3, suggesting that STAT3 interacts with the promoter region of HIPK2. Taken together, these data indicate that EGFR/STAT3 is at least partly responsible for HIPK2 overexpression during VAN treatment.
Inhibition of HIPK2 suppresses VAN-induced apoptosis in HK-2 cells
To verify the role of HIPK2 inhibition in VAN-induced renal cell apoptosis, HK-2 cells were treated with HIPK2 siRNA. As shown in Supplementary Figure 5A, HIPK2 siRNA significantly reduced the apoptosis of HK-2 cells induced by VAN. These results were further supported by the analyses of apoptosis rate and caspase activity (Supplementary Figure 5B&C).
Inhibition of HIPK2 attenuated VAN drives the progression of AKI to CKD in in C57/B6 mice
To verify the role of HIPK2 in the transition of AKI to CKD, VAN was injected for 7 days, and also injected HIPK2 siRNA for 28 days. As shown in Supplementary Figure 6 A-F, VAN-induced the ascent of BUN and creatinine, tubular damage, and renal fibrosis, which was notably suppressed by HIPK2 siRNA treatment at indicated time points. The tubular damage scores and semiquantitative analysis of fibrotic area confirmed the staining of HE and Masson's trichrome (Supplementary Figure 6 G&H), respectively.The TUNEL assay demonstrated that HIPK2 siRNA markedly attenuated VAN-induced the renal cell apoptosis in the cortex of C57/B6 mice (Supplementary Figure 7 A&B). The immunoblot further demonstrated that HIPK2 siRNA significantly ameliorated the expression of fibronectin, collagen IV, collagen I, α-SMA, and HIPK2 (Supplementary Figure 8 A&B), which was further verified by the immunohistochemistry analysis (Supplementary Figure 9 A&B). These data indicate that HIPK2 mediates the progression of AKI to CKD during VAN treatment.
Discussion
The traditional view of AKI to CKD transition supported that AKI is reversible early in its course, while recent studies have indicated that an incomplete repair of AKI can lead to CKD progression [32]. Although the role of EGFR has been reported in ischemia-induced progression of AKI to CKD [33], it remains unclear whether EGFR is involved in the transition of AKI to CKD after VAN nephrotoxicity. To the best of our knowledge, ischemia-reperfusion injury is the most common disease model for studying the transition of AKI to CKD [31]. In the present study, for the first time, a novel VAN-induced AKI mice model was established, as verified by Masson's trichrome staining, immunohistochemistry, immunoblot analysis of fibronectin, collagen I&IV, and α-SMA at indicated time points (Figure 1). Intriguingly, a sustained activation of EGFR was found in the mice kidney tissues and human renal proximal tubule cells (HK-2 cells) during and after VAN treatment. These observations were consistent with the findings on ischemia-induced AKI [34, 35]. Additionally, the inhibition of EGFR and HIPK2 significantly ameliorated VAN-induced AKI and renal fibrosis. Furthermore, EGFR/STAT3/HIPK2 signaling axis could mediated the transition of AKI to CKD following VAN treatment.
Nevertheless, the role of EGFR in AKI may be controversial. For instance, some studies have supported that EGFR plays a renoprotective role in ischemia-reperfusion- and folic acid-induced AKI [33, 36]. In contrast, other studies have reported that EGFR exerts a detrimental role in cisplatin- and LPS-induced AKI [21, 37]. In this study, the inhibition of EGFR could ameliorate VAN-drive the progression of AKI, as evidenced by the inactivation of caspase3, reduced tubular damage, decreased cell apoptosis, and improved renal function (Figure 3, 4, and 8). The findings indicate that the role of EGFR in AKI is associated with injury factor. Another major finding of this study is that EGFR was involved in the transition of AKI to CKD. The inhibition of EGFR could ameliorate renal fibrosis, which was accompanied by the downregulation of FN, collagen I&IV and α-SMA in Wa-2 mice at day 28 (Figure 3-6). In addition, macrophage infiltration was markedly reduced in Wa-2 mice, suggesting that EGFR inhibition prevents the progression of AKI to CKD at least partly through anti-inflammation pathway (Figure 7). Furthermore, the present study also demonstrated that continuous gefitinib treatment attenuated renal fibrosis and inflammation, and inhibited the VAN-induced expression of profibrotic molecules (Figure 9&10, and Supplementary Figure 1&2). These data suggest that the amelioration of renal fibrosis by EGFR inhibition is not only dependent on the early suppression of renal damage.
To the best of our knowledge, this is the first study to elucidate the regulatory mechanism of EGFR underlying AKI to CKD transition. HIPK2, a member of an evolutionary conserved family of serine/threonine kinases, plays a key role in kidney fibrosis and cell apoptosis through the activation of profibrotic and proinflammatory pathways such as Smad, Notch, Wnt/β-catenin, NF-κB and p53 pathways [31, 38-40]. In this study, the expression levels of HIPK2 was constantly increased during and after VAN treatment both in vivo and in vitro (Figure 2 and Supplementary Figure 3). HIPK2 overexpression was significantly suppressed either genetically or pharmacologically in both in vivo and in vitro models (Figure 4, 6, 10, and Supplementary Figure 4). Silencing of HIPK2 ameliorated VAN-induced renal cell apoptosis (Supplementary Figure 5), suggesting that HIPK2 is involved in EGFR-induced apoptosis during the transition of AKI to CKD. Besides, it is well known that ERK1/2 and STAT3 signaling pathways are downstream targets of EGFR. To identify the corresponding transcription factors for HIPK2 expression, the expression patterns of these proteins were detected. The results showed that STAT3 was activated during VAN treatment, whereas the activation of ERK1/2 was completely inhibited at indicated time points. However, the reason remains unclear. Subsequently, the inhibition of STAT3 significantly suppressed HIPK2 overexpression, suggesting that STAT3 is correlated with HIPK2 expression. By using ChIp assay, we demonstrated for the first time that STAT3 could physically interact with the promoter region of HIPK2 (Supplementary Figure 4E). Finally, inhibition of HIPK2 significantly attenuated the VAN drove the progression of AKI to CKD, as evidenced by improved the renal function, reduced the tubular damage, and attenuated cell apoptosis, and prevented renal fibrosis (Supplementary Figure 6-9). Taken together, these data indicate that STAT3 is responsible for EGFR-mediated HIPK2 expression during VAN treatment.
In summary, our data indicate that VAN treatment induces AKI and subsequently renal fibrosis via sustained activation of EGFR. In addition, this study reveals that EGFR/STAT3/HIPK2 signaling axis mediates VAN-induced transition of AKI to CKD, which may provide new insight into not just treatments for AKI but also prevention strategies for renal fibrosis.
Abbreviations
AKI: acute kidney injury; HK-2: human proximal tubular epithelial cells; EGFR: epidermal growth factor receptor; STAT: signal transduction and activator of transcription; HIPK2: the expression of homeodomain interacting protein kinase 2.
Supplementary Material
Supplementary figures.
Acknowledgements
The study was supported by a grant from National Natural Science Foundation of China (81570646, 81870475, and 81770951), and excellent Youth Foundation of Hu'nan Scientific Committee (2017JJ1035), and the Jiangxi Province Science Foudation (20171BAB205027, 20161BAB205269, and 20151BBG70186).
Author Contributions
DZ designed this study; LX, XL, and FZ performed the experiments; FZ disposed the data; Statistics and reagents were carried by LX, LW, ZD; DZ wrote the manuscript.
Competing Interests
The authors have declared that no competing interest exists.
References
1. Levy EM, Viscoli CM, Horwitz RI. The effect of acute renal failure on mortality. A cohort analysis. JAMA. 1996;275:1489-94
2. Cosentino F, Chaff C, Piedmonte M. Risk factors influencing survival in ICU acute renal failure. Nephrol Dial Transplant. 1994;9(Suppl 4):179-82
3. Fu Y, Tang C, Cai J, Chen G, Zhang D, Dong Z. Rodent models of AKI-CKD transition. Am J Physiol Renal Physiol. 2018
4. Belayev LY, Palevsky PM. The link between acute kidney injury and chronic kidney disease. Curr Opin Nephrol Hypertens. 2014;23:149-54
5. He L, Wei Q, Liu J, Yi M, Liu Y, Liu H. et al. AKI on CKD: heightened injury, suppressed repair, and the underlying mechanisms. Kidney Int. 2017;92:1071-83
6. Sawhney S, Marks A, Fluck N, Levin A, McLernon D, Prescott G. et al. Post-discharge kidney function is associated with subsequent ten-year renal progression risk among survivors of acute kidney injury. Kidney Int. 2017;92:440-52
7. Succar L, Pianta TJ, Davidson T, Pickering JW, Endre ZH. Subclinical chronic kidney disease modifies the diagnosis of experimental acute kidney injury. Kidney Int. 2017;92:680-92
8. Hu MC, Shi M, Gillings N, Flores B, Takahashi M, Kuro OM. et al. Recombinant alpha-Klotho may be prophylactic and therapeutic for acute to chronic kidney disease progression and uremic cardiomyopathy. Kidney Int. 2017;91:1104-14
9. Fu Y, Tang C, Cai J, Chen G, Zhang D, Dong Z. Rodent models of AKI-CKD transition. Am J Physiol Renal Physiol. 2018;315:F1098-F106
10. Sinha Ray A, Haikal A, Hammoud KA, Yu AS. Vancomycin and the Risk of AKI: A Systematic Review and Meta-Analysis. Clin J Am Soc Nephrol. 2016;11:2132-40
11. Chen J, Wang J, Li H, Wang S, Xiang X, Zhang D. p53 activates miR-192-5p to mediate vancomycin induced AKI. Sci Rep. 2016;6:38868
12. Wang J, Li H, Qiu S, Dong Z, Xiang X, Zhang D. MBD2 upregulates miR-301a-5p to induce kidney cell apoptosis during vancomycin-induced AKI. Cell Death Dis. 2017;8:e3120
13. Prendecki M, Blacker E, Sadeghi-Alavijeh O, Edwards R, Montgomery H, Gillis S. et al. Improving outcomes in patients with Acute Kidney Injury: the impact of hospital based automated AKI alerts. Postgrad Med J. 2016;92:9-13
14. Chen J, Chen JK, Harris RC. Deletion of the epidermal growth factor receptor in renal proximal tubule epithelial cells delays recovery from acute kidney injury. Kidney Int. 2012;82:45-52
15. Wang Z, Chen JK, Wang SW, Moeckel G, Harris RC. Importance of functional EGF receptors in recovery from acute nephrotoxic injury. J Am Soc Nephrol. 2003;14:3147-54
16. Humes HD, Cieslinski DA, Coimbra TM, Messana JM, Galvao C. Epidermal growth factor enhances renal tubule cell regeneration and repair and accelerates the recovery of renal function in postischemic acute renal failure. J Clin Invest. 1989;84:1757-61
17. Lautrette A, Li S, Alili R, Sunnarborg SW, Burtin M, Lee DC. et al. Angiotensin II and EGF receptor cross-talk in chronic kidney diseases: a new therapeutic approach. Nat Med. 2005;11:867-74
18. Terzi F, Burtin M, Hekmati M, Federici P, Grimber G, Briand P. et al. Targeted expression of a dominant-negative EGF-R in the kidney reduces tubulo-interstitial lesions after renal injury. J Clin Invest. 2000;106:225-34
19. Francois H, Placier S, Flamant M, Tharaux PL, Chansel D, Dussaule JC. et al. Prevention of renal vascular and glomerular fibrosis by epidermal growth factor receptor inhibition. FASEB J. 2004;18:926-8
20. Liu N, Guo JK, Pang M, Tolbert E, Ponnusamy M, Gong R. et al. Genetic or pharmacologic blockade of EGFR inhibits renal fibrosis. J Am Soc Nephrol. 2012;23:854-67
21. Xu X, Wang J, Yang R, Dong Z, Zhang D. Genetic or pharmacologic inhibition of EGFR ameliorates sepsis-induced AKI. Oncotarget. 2017;8:91577-92
22. Xu X, Pan J, Li H, Li X, Fang F, Wu D. et al. Atg7 mediates renal tubular cell apoptosis in vancomycin nephrotoxicity through activation of PKC-delta. FASEB J. 2018 fj201801515R
23. Zhang D, Liu Y, Wei Q, Huo Y, Liu K, Liu F. et al. Tubular p53 regulates multiple genes to mediate AKI. J Am Soc Nephrol. 2014;25:2278-89
24. Zhang D, Pan J, Xiang X, Liu Y, Dong G, Livingston MJ. et al. Protein Kinase Cdelta Suppresses Autophagy to Induce Kidney Cell Apoptosis in Cisplatin Nephrotoxicity. J Am Soc Nephrol. 2016
25. Peng J, Li X, Zhang D, Chen JK, Su Y, Smith SB. et al. Hyperglycemia, p53, and mitochondrial pathway of apoptosis are involved in the susceptibility of diabetic models to ischemic acute kidney injury. Kidney Int. 2015;87:137-50
26. Zhang D, Li Y, Liu Y, Xiang X, Dong Z. Paclitaxel ameliorates lipopolysaccharide-induced kidney injury by binding myeloid differentiation protein-2 to block Toll-like receptor 4-mediated nuclear factor-kappaB activation and cytokine production. J Pharmacol Exp Ther. 2013;345:69-75
27. Sun L, Zhang D, Liu F, Xiang X, Ling G, Xiao L. et al. Low-dose paclitaxel ameliorates fibrosis in the remnant kidney model by down-regulating miR-192. J Pathol. 2011;225:364-77
28. Zhang L, Xu X, Yang R, Chen J, Wang S, Yang J. et al. Paclitaxel attenuates renal interstitial fibroblast activation and interstitial fibrosis by inhibiting STAT3 signaling. Drug Des Devel Ther. 2015;9:2139-48
29. Yang R, Xu X, Li H, Chen J, Xiang X, Dong Z. et al. p53 induces miR199a-3p to suppress SOCS7 for STAT3 activation and renal fibrosis in UUO. Sci Rep. 2017;7:43409
30. Wang J, Pang J, Li H, Long J, Fang F, Chen J. et al. lncRNA ZEB1-AS1 Was Suppressed by p53 for Renal Fibrosis in Diabetic Nephropathy. Mol Ther Nucleic Acids. 2018;12:741-50
31. Jin Y, Ratnam K, Chuang PY, Fan Y, Zhong Y, Dai Y. et al. A systems approach identifies HIPK2 as a key regulator of kidney fibrosis. Nat Med. 2012;18:580-8
32. Ferenbach DA, Bonventre JV. Mechanisms of maladaptive repair after AKI leading to accelerated kidney ageing and CKD. Nat Rev Nephrol. 2015;11:264-76
33. Tang J, Liu N, Tolbert E, Ponnusamy M, Ma L, Gong R. et al. Sustained activation of EGFR triggers renal fibrogenesis after acute kidney injury. Am J Pathol. 2013;183:160-72
34. Xiao L, Zhou D, Tan RJ, Fu H, Zhou L, Hou FF. et al. Sustained Activation of Wnt/beta-Catenin Signaling Drives AKI to CKD Progression. J Am Soc Nephrol. 2016;27:1727-40
35. Venkatachalam MA, Weinberg JM, Kriz W, Bidani AK. Failed Tubule Recovery, AKI-CKD Transition, and Kidney Disease Progression. J Am Soc Nephrol. 2015;26:1765-76
36. He S, Liu N, Bayliss G, Zhuang S. EGFR activity is required for renal tubular cell dedifferentiation and proliferation in a murine model of folic acid-induced acute kidney injury. Am J Physiol Renal Physiol. 2013;304:F356-66
37. Wada Y, Iyoda M, Matsumoto K, Shindo-Hirai Y, Kuno Y, Yamamoto Y. et al. Epidermal growth factor receptor inhibition with erlotinib partially prevents cisplatin-induced nephrotoxicity in rats. PloS one. 2014;9:e111728
38. Fan Y, Wang N, Chuang P, He JC. Role of HIPK2 in kidney fibrosis. Kidney Int Suppl (2011). 2014;4:97-101
39. Nugent MM, Lee K, He JC. HIPK2 is a new drug target for anti-fibrosis therapy in kidney disease. Front Physiol. 2015;6:132
40. Saul VV, Schmitz ML. Posttranslational modifications regulate HIPK2, a driver of proliferative diseases. J Mol Med (Berl). 2013;91:1051-8
Author contact
![]() Corresponding author: Dongshan Zhang, MD, Department of Emergency Medicine, Second Xiangya Hospital, and Emergency Medicine and Difficult Diseases Institute, Central South University, Changsha, Hunan, People's Republic of China. 410011, Email: 715653110com, or dongshanzhangedu.cn
Corresponding author: Dongshan Zhang, MD, Department of Emergency Medicine, Second Xiangya Hospital, and Emergency Medicine and Difficult Diseases Institute, Central South University, Changsha, Hunan, People's Republic of China. 410011, Email: 715653110com, or dongshanzhangedu.cn