Impact Factor
- Issue 14; 2026
- Issue 13; 2026
- Issue 12; 2026
- Issue 11; 2026
- Issue 10; 2026
- Volume 16; 2026
- Advance Articles
- Past Issues
- Cover Images
- Cover Suggestion
- Index & Coverage
- Special Issues
Introduction
Materials and Methods
Result and Discussion
Conclusions
Abbreviations
Supplementary Material
Acknowledgements
References
International Journal of Biological Sciences
International Journal of Medical Sciences
 Global reach, higher impact

Theranostics 2019; 9(8):2325-2345. doi:10.7150/thno.30030 This issue Cite
Research Paper
Biodistribution of gadolinium- and near infrared-labeled human umbilical cord mesenchymal stromal cell-derived exosomes in tumor bearing mice
Javier Abello1,2, Tuyen Duong Thanh Nguyen3,4, Ramesh Marasini3,4, Santosh Aryal3,4 ![]() , Mark Louis Weiss1,5
, Mark Louis Weiss1,5 ![]()
1. Department of Anatomy and Physiology, Kansas State University, Manhattan, KS 66506, USA
2. Department of Food, Nutrition, Dietetics and Health, Kansas State University, Manhattan, KS 66506, USA
3. Department of Chemistry, Kansas State University, Manhattan, KS 66506, USA
4. Nanotechnology Innovation Center of Kansas State (NICKS), Kansas State University, Manhattan, KS 66506, USA
5. Midwest Institute of Comparative Stem Cell Biology, Kansas State University, Manhattan, KS 66506, USA
Received 2018-9-17; Accepted 2019-2-11; Published 2019-4-12
Abstract

We speculate that exosomes derived from human umbilical cord mesenchymal stromal cells (HUC-MSCs) will accumulate within tumors and have the potential for both tumor location or drug delivery.
Methods: To determine proof of concept, HUC-MSC exosomes were labeled with an MRI contrast agent, gadolinium, or a near infrared dye. Exosome accumulation within ectopic osteosarcoma tumor-bearing mice was determined by 14.1 T MRI or bioimaging over 24-48 h after injection. In vitro studies examine the accumulation and physiological effect of exosomes on human and mouse osteosarcoma cell lines by MTT assay, confocal microscopy, and flow cytometry.
Results: Systemic HUC-MSC exosomes accumulated continuously in tumor over a 24-48 h post-injection period. In contrast, synthetic lipid nanoparticles accumulate in tumor only for the first 3 h post-injection.
Conclusion: These results suggest that HUC-MSCs exosomes accumulate within human or mouse osteosarcoma cells in vitro and in vivo over a 24 to 48 h after infusion.
Keywords: Extracellular vesicles, non-invasive imaging, ectopic osteosarcoma model, gadolinium nanoparticle.
Introduction
The constant and rapid development in the stem cell field provides new tools to advance the areas of regenerative medicine and therapeutics. However, there is a gap in our understanding of the biological process that underlies their beneficial effects, not only at the cellular level but also at the level of tissues, organs, and systems. Human umbilical cord (HUC) mesenchymal stromal cells (MSCs) are multipotent cells, which by definition must grow as attached cells that self-renew and exhibit chondrogenic, adipogenic and osteogenic differentiation capacity in vitro. Also, HUC-MSCs must express the mesenchymal surface markers CD73, CD90, CD105 and be negative for CD11b, CD19, CD34, CD45, and negative for the leukocyte antigen HLA-DR [1]. HUCs are one of the most studied MSCs because it is relatively easy to obtain the source material, without the need of invasive and painful surgical procedure; in fact, umbilical cords are usually treated as biological waste. Compare with other tissue sources, the HUC-MSCs have a higher percentage of proliferating cells that can be maintained for more passages prior to senescence. In respect to their potential application as therapeutic tools, HUCs, similar to other tissue-derived MSCs exhibit immunomodulatory properties [2, 3] and have the potential to control autoimmune diseases, such as Crohn's disease [4], multiple sclerosis [5, 6] and rheumatoid arthritis [7, 8]. Despite the evidence that MSCs provide therapeutic benefits, there are concerns for the potential of adverse effects, such as embolism, disease transmission, or cancer [9-11]. In previous work, we demonstrated that UC-MSCs had anticancer properties [12-14]. Furthermore, after intravenous MSC injection, the cells get trapped in lung and other organs with high capillarity for at least 24 h after infusion [15, 16].
Recently, the therapeutic effect of MSCs was shown to be, in part, due to the production and secretion of bioactive compounds and extracellular vesicles, rather than for the cellular differentiation and expansion after implantation [17-20]. Exosomes, naturally occurring microvesicles, are part of the MSCs secretome and appear to mediate some of their physiological effects [21, 22]. Exosomes are formed in the endosome, and their membrane shares similar attributes with the parental cell membrane including transmembrane (e.g., integrins and tetrasanins) and peripheral proteins (e.g., Lactadherin), lipids (e.g., phosphatidylserines), glycans (e.g., polylactosamine), among others, that play an important role in cell signaling and communication [23-27]. For the last decade, the cargo of exosomes has been an important subject of research because of its involvement in different metabolic process [28, 29], and variation of the cargo correlates to changes in the inter- and external cell environment [30, 31]. It has been demonstrated the important role of EVs, especially exosomes in cell to cell communication [32], antigen presentation [33, 34], cell adhesion [35], gene silencing [36], tissue remodeling [37] and cancer progression [38]. Furthermore, MSC exosomes have been shown to affect human osteosarcoma cell proliferation in vitro [38].
Cancer is the “emperor of all maladies”, e.g., worldwide human disease and one of the most prevalent causes of mortality [39, 40]. The battle against this disease has challenged researchers to find new and more efficient ways of controlling it. Advances in the field of nanotechnology have enhanced the efficacy of the existing drugs by extending their bioactivity through novel formulation. For example, novel synthetic nanoparticles, such as liposomes, have been used as a drug delivery system against cancer [41, 42]. Nevertheless, these approaches have limitations such as bio-incompatibility [43], development of allergic reactions [44] and lack of target specificity [45, 46]. In contrast to synthetic nanoparticles, MSC exosomes are biocompatible and may accumulate within tumors after intravenous injection [47-49]. Recently, exosomes isolated from TRAIL-transduced MSCs were shown to induce apoptosis in cancer cell lines in a dose-dependent manner [50]. These prior findings support the notion that MSCs exosomes might accumulate in tumors and have the potential to identify the site of tumors or metastasis [51, 52].
Here, in a proof of concept study, the biodistribution of HUC-MSCs-derived exosomes in osteosarcoma is explored using two non-invasive tracking methodologies in vivo. Specifically, MSCs exosomes were labeled with gadolinium (Exo-GdL) for 14.1 T magnetic resonance imaging (MRI) or with near infrared (NIR) fluorescent dyes for fluorescence imaging. Here, the biodistribution of MSC exosomes in osteosarcoma ectopic tumor-bearing mice was observed, to determine whether labeled exosomes accumulate in tumors at an enhanced rate compared to similarly labeled synthetic nanoparticles (liposomes). These data support the notion that MSC exosomes accumulate in osteosarcoma tumors and may have utility for metastasis detection.
Materials and Methods
Human umbilical cord mesenchymal stromal cells
All the protocols for obtaining and using human umbilical cords were reviewed and approved by Kansas State University human subject research committee. Human umbilical cord mesenchymal stromal cells (HUC-MSCs) were isolated, expanded and characterized following a previously described protocol [53, 54]. The cryopreserved MSCs were thawed and seeded at 1 × 10⁴ cells/cm2 for at least one passage before use. The maintenance of MSCs was similar to our previously described methods, the only substantial departure was that Dulbecco's Modified Eagle Medium low glucose (DMEM) was supplemented with 10% pooled human platelet lysate which was depleted of exosomes (dpHPL, method of depletion is described below). MSC number and viability were determined using acridine orange/propidium iodide (AO/PI) assay using a standard cell counter (Nexcelom Bioscience Auto 2000).
Cancer cell line culture
The cancer cell lines such as 143B (ATCC® CRL-8303) human osteosarcoma and K7M2 (ATCC® CRL-2836) murine osteosarcoma were gifted by Dr. Deryl Troyer (Department of Anatomy and Physiology, Kansas State University). Cells were seeded at a standard density of 1×10⁴ cells/cm2 and maintained at 80% confluency in DMEM supplemented with 10% dpHPL. Cells were incubated at 37 ºC, 90% humidity, and 5% CO2.
Pooled human platelet lysate depleted of exosomes (dpHPL)
HPL depleted of exosomes was prepared from a batch of pooled human platelet lysate that was prepared in-house, per the methods described in [53, 54]. To deplete exosomes, thawed HPL was centrifuged at 3184 g for 30 min at 4 ºC, sterile filtered (0.22 µm pore size) and centrifuged for 10 h at 120,000 g at 4 ºC (Beckman Counter, Inc., L-90K) using a SW-41-Ti rotor. The dpHPL samples were aliquoted and stored at -20 ºC until use.
Exosomes isolation by ultracentrifugation
Exosomes were isolated from the cell-conditioned medium (CM) by sequential ultracentrifugation using a modified protocol proposed by Momen-Heravi [55]. In order to ensure good quality of exosomes, the CM was obtained from cell cultures with 95% of viability [56]. After collection, the CM was centrifuged for 30 min at 3184 g in a benchtop centrifuge (Eppendorf, 5810R) using a swing bucket rotor A-4-62 (Eppendorf, Cat. #: FL08517291) to eliminate cell debris. The CM was then sterile filtered (0.22 µm pore size) and transferred to 13.2 mL Ultra-clear tubes (Beckman Counter) and centrifuged for 30 min at 20,000 g (Beckman Counter, Inc., L-90K) with a SW-41-Ti rotor at 4 ºC. Next, the CM was transferred into a fresh ultracentrifuge tube and centrifuged for 90 min at 120,000 g at 4 ºC. The resulting pellet was resuspended in 100 µL of DMEM, vortexed for 30 s and stored at -80 ºC until further analysis.
Exosomes characterization
The hydrodynamic size distribution and surface charge property of exosomes were determined by dynamic light scattering (DLS) and the zeta potential (ZP) to analyze the integrity and stability of exosomes. Both measurements were performed with a Zetasizer Nano ZS (Malvern Instruments, Ltd.), following the instructions of the manufacturer. The instrument was programmed to perform 11 runs of 10 s with 5 repetitions.
The exosomes population size and concentration were determined by Nanoparticle Tracking Analysis (NTA) using a NanoSight LM-10 (Malvern Instruments, Ltd.). Each measurement was performed at a constant temperature (25 ºC ± 1) to ensure the same viscosity of the fluid. The sample dilutions for this experiment was ranging 1:3500 to 1:5000 in sterile filtered (0.22 µm) Dulbecco's phosphate buffered saline (DPBS, Gibco). NanoSight software (NTA 3.2) was used to capture 60 s videos and 5 repetitions per sample.
To visualize exosome morphology, transmission electron microscopy (TEM) analysis was performed. The samples were prepared by probe-sonication for 3 min at an amplitude of 30% and 30 s pulses/cycle to disrupted exosomes aggregates. The exosomes were diluted 1:100 in 0.22 µm sterile-filtered DPBS. 10 μL of the exosome sample was mixed 1:1 with saturated uranyl acetate (Electron Microscopy Science) for negative staining. 10 μL of the mixture were placed on Formvar-coated 200 mesh copper grids (Electron Microscopy Science) and air dried. The exosomes images were captured using a Tecnai™ G2 Spirit BioTWIN (FEITM Company, USA) TEM at 6.8 × 10³ magnification and 80 kV accelerating voltage.
Western blot and Dot blots
To prepare the cell lysate, 1 × 10⁶ cells were resuspended in 100 µL RIPA buffer (Thermo Fisher Scientific, Inc.) supplemented with 1% (v/v) phosphatase inhibitor and 1% (v/v) protease inhibitor (Thermo Fisher Scientific, Inc.). The mix was incubated for 15 min at room temperature, then the cell debris was removed by centrifugation for 10 min at 17933 g at 4 ºC. The samples were mixed with 4X LDS Sample Buffer (Thermo Fisher Scientific, Inc.) in 3:1 ratio and incubated for 10 min at 70 ºC. The protein concentration was determined by BCA assay for both Dot blot and Western blot experiments. Dot blots were carried out by loading 2 µg of protein on a PVDF membrane (Merck Millipore Ltd.). Protein electrophoresis was carried out with 4-12% Tris-Glycine polyacrylamide gels (PAGE, Thermo Scientific, Inc. Novex™) following the manufacturer's recommendations. Proteins were transferred from the gel to a PVDF membrane with a wet system (Thermo Fisher Scientific, Inc.) at 30 V for 1 h. The membranes from both dot and Western blots were blotted with the primary antibodies: anti-CD9 (C-4, Cat. #: sc-13118), anti-CD63 (MX-49.129.5, Cat. #: sc-5275), anti-CD81 (5A6, Cat. #: sc-23962), anti-HSP70 (3A3, Cat. #: sc-32239) and anti-Na+/K+-ATPase 3 (46, Cat. #: sc-135998) and the secondary antibody m-IgG BP-HRP (Cat. #: sc-516102) (Santa Cruz Biotechnology, Inc.) following the manufacturer's recommendation. Chemiluminescence detection reactions were performed using SuperSignal West Femto substrate (Thermo Fisher Scientific, Inc.) and the images were captured using a Kodak Image Station 4000.
Synthesis of gadolinium lipid (GdL)
The synthesis of Gadolinium ion (Gd3+)-chelated DSPE-DOTA was performed using a two-step method as previously described with some modifications [41, 57, 58]. Briefly, 75 mg of DSPE was first dissolved in 10 mL chloroform containing 2% (v/v) triethylamine (TEA), then 86 mg DOTA-NHS ester was added, and the mixture was incubated 3 h at 40 ºC. The product was concentrated under vacuum. Purification of the conjugating DSPE-DOTA lipid was achieved by freeze-thaw cycles, followed by centrifugation at 4500 g for 10 min at room temperature to precipitate by-products. The supernatant was then sterile filtered (0.22 µm pore size) and lyophilized. DSPE-DOTA-Gadolinium (GdL) was prepared by adding 10 mL of acetate buffer (pH: 5.5) to 50 mg DSPE-DOTA (0.05 mmole). The suspension was then treated with 0.5 mmole of Gd(OAc)3 at 50 ºC for 12 h. After incubation, the Gd-DOTA-DSPE was purified by centrifugation at 4500 g for 10 min at room temperature. The obtained product was washed 3 times with acetate buffer (pH: 5.5) and 3 times with distilled water to remove non-chelated Gd3+ and then lyophilized.
Labeling of exosomes with gadolinium lipid (Exo-GdL)
Gadolinium-labeled exosomes were prepared by lipid insertion following membrane extrusion method [42, 58]. In brief, different amounts of DSPE-DOTA-Gd (500, 1000, and 2000 µg) were solubilized in DPBS at 65 ºC. The GdL suspension was cooled to room temperature and co-incubated with 1mg of exosome protein for 30 min. The protein concentration was determined by BCA assay (G-Biosciences). The exosome-GdL (Exo-GdL) mixture was bath sonicated for 2 min and probe sonicated for 3 min with an amplitude at 30% and 30 s pulses on/off cycles on ice. The mixture was extruded through 100 nm pore size polycarbonate membrane to unify the hydrodynamic size. The Exo-GdL product was purified with an Amicon Ultra-4 centrifugal filter (Millipore, MA) with a molecular weight cut-off of 10 kDa. Rhodamine dye-labeled exosomes were prepared in the same fashion by hydrating 20 µg of L-α-Phosphatidylethanolamine-N-(lissamine rhodamine B sulfonyl) (Ammonium Salt) (Egg Liss Rhod PE) film with 1 mg exosome protein. The amount of Gd on the exosomes was determined using inductively coupled plasma mass spectrometry (ICP-MS, PerkinElmer, NexION®350X). For ICP-MS, the Exo-GdL samples were digested with 2.0 mL of concentrated HNO3 for 5 h. After digestion, 100 μL of the sample was diluted with 10 mL of 2% HNO3 and analyzed using ICP-MS.
Gadolinium ion release assay
The cumulative gadolinium release from the Exo-GdL was assessed under physiological conditions at 37 ºC at pH 7.4. Briefly, 1 mL of Exo-GdL [1 mg/mL] was dialyzed (Mw. Cut-off = 500 kDa) in 250 mL of PBS (Gibco, pH: 7.4), while constantly stirring (100 rpm), and 200 µL samples were taken at predetermined time intervals. The amount of released Gd was quantified by ICP-MS. As an experimental control, the same dialysis procedure was carried out with 1 mg/mL of Magnevist® (Bayer) (Mw = 938.005 g/mol).
Magnetic properties of Exo-GdL
The magnetic resonance (MR) imaging was acquired on a Bruker 600 MHz Avance III. The longitudinal relaxation time of Exo-GdL in an aqueous solution at different Gd3+ concentration (0.03, 0.06, 0.14, and 0.28 mM) were obtained using a QTR 30 mm coil at 22 ºC with a Rapid Acquisition with Relaxation Enhancement (RARE) pulse, under these parameters: repetition time (TR) = 8000, 6000, 5000, 3000, 1500, 900, 700, 500, 300, 100 and 50 ms, echo time (TE) = 10.18 ms, slice thickness = 1 mm, flip angle (FA) = 80º, image size 256 × 256, FOV = 30 × 30, total acquisition time of 55 min 43 s. The representative T1 weighted magnetic resonance phantom images of Exo-GdL were taken at TR = 3000 ms, TE = 10.18 ms, and slice thickness = 1 mm. The longitudinal coefficient relaxivity value r1 was determined from the slope of the plot of 1/T1 versus the sample concentration. The magnetic property of Magnevist® solution with the same Gd3+ concentration was conducted under the same experimental condition.
Cellular uptake of exosomes
K7M2 cells were seeded at a density of 1 × 10⁴ cells/cm2 per well in DMEM supplemented with 10% dpHPL in an 8-well chambered coverglass (Cellvis, Cat. #: C8-1.5-H-N). Cells were incubated for 24 h at 37 ºC, 90% humidity, and 5% CO2. After the initial incubation, the cells were treated with 25 µg of rhodamine B labeled nanoparticles as positive control (RhB-control), or RhB-labeled exosomes (Exo-RhB) suspended in 10 µL of DPBS, or 10 µL DPBS alone (negative control). The cells were incubated for an additional 24 h, and then the cells were fixed with fixative solution (4% paraformaldehyde + 0.1% Glutaraldehyde prepared in ddH2O). Subsequently, cells were stained with 100 µL of 10µg/ mL 4',6-diamidino-2-phenylindole (DAPI) (Sigma-Aldrich) solution for 10 min in the dark at room temperature. Cells images were captured with laser scanning confocal microscopy (CLSM, Carl Zeiss, LSM-700) and analyzed with the modular image-processing, analysis software ZEN 2, blue edition (Zeiss) and ImageJ. The cellular uptake was further confirmed by flow cytometry. For flow cytometry, K7M2 cells were treated with Exo-RhB or unlabeled exosomes for 6 h, 12 h, 24 h, and 48 h. The accumulation of exosomes in the cells was determined by the fluorescence emission of RhB. 1 × 10⁴ events were captured using a flow cytometer (LSR Fortessa X20, BD Bioscience).
Apoptosis assay
K7M2 cells apoptosis was evaluated using the FITC Annexin-V Apoptosis Detection Kit I (BD Pharmingen™), following the manufacturer's instructions. Briefly, K7M2 cells were seeded in T-25 flasks at a cell density of 1 × 10⁴ cells/cm2. Cells were incubated for 24 h under standard conditions. At the end of the incubation time, cell cultures were treated with naive exosomes (94 ng/cm2) or Exo-GdL (94 ng/cm2, 940 ng/cm2 or 9400 ng/cm2) and incubated an additional 24 h. Treatment with 500 µM H2O2 was used as positive control. After that, cells were collected and rinsed 3 timed in the 1X binding buffer and subsequently stained with FITC-conjugated Annexin-V (Annexin V-FITC) and propidium iodide (PI). The cells were analyzed by flow cytometry using an LSR Fortessa X20 (BD Bioscience) equipped with the FACSDiva v8.0 acquisition software.
Cell proliferation assay
Cells were seeded in 96 well plates (CytoOne) at a cell concentration of 1 × 10⁴ cell/cm2 per well in 150 µL of DMEM containing 10% dpHPL. Cells for the standard curve were seeded in triplicate at densities between 200 to 2 × 10⁴ cells/cm2. The plates were incubated for 24 h at 37 ºC, 90% humidity and 5% CO2. After 24 h of incubation, 10 µL of the 10 ng, 20 ng or 30 ng of exosome or control (DPBS) were added to each well. After an additional 24 h of incubation, 10 µL of 5 mg/ mL MTT (3-(4,5-Dimethylthiazol-2-yl)-2,5-Diphenyltetrazolium Bromide) (Thermo Fisher Scientific Inc.) solution in DPBS was added to each well. The reaction was incubated for an additional 4 h and then the reaction was stopped by adding 100 µL of 10% SDS solution in 0.01M HCl. After 16 h, the absorbance was read at 570 nm using a SpectraMax®i3 microplate reader (Molecular Devices).
In vivo assay
Following the approved of the animal protocol by the KSU IACUC, in vivo studies were conducted using the immunodeficient NU/NU nude mice (Charles River, 088/NU/NU homozygous). To develop mouse osteosarcoma tumor, 1 × 10⁶ K7M2 cells were suspended in 100 µL of PBS and were injected subcutaneously in the lower flank of the mice. 10 days post-implantation or when the tumor size was approximately 6 mm, in vivo MRI images and the biodistribution of Exo-GdL in major organs were acquired.
Biodistribution
To determine biodistribution, 0.015 mmol/ kg of Exo-GdL was injected into the lateral tail vein of 3 tumor bearing mice (088/NU/NU homozygous). After 24 h post-injection, the mice were euthanized and the heart, liver, kidney, lung, spleen, and tumor were collected to determine the accumulated Exo-GdL content by measuring the elemental Gd concentration using ICP-MS. For the ICP-MS experiment, the individual organs were digested in 30% H2O2 and 70% HNO3 alternatively for three successive digestions to ensure complete tissue digestion. Digested content was dissolved in 2% HNO3, filtered through a 200 nm syringe filter, and subjected to ICP-MS analysis for Gd.
In vivo imaging
A pilot MRI study was conducted using a single mouse bearing subcutaneous osteosarcoma. Briefly, Exo-GdL with Gd equivalent to 0.015 mmol/ kg was injected into the lateral tail vein. MR images were acquired with a pre- and post-contrast 30 min and 90 min using Bruker WB 600 MHz NMR-MRI (14.1 Tesla). The images were obtained using a QTR 30 mm coil at 37 ºC with a Fast slow angle shot (FLASH) protocol. The T1 weighted imaging with fat suppression parameters were TE/TR = 1.6/600 ms, slice thickness = 0.5 mm, flip angle = 80, image size 256 × 256, FOV = 30 × 30, the total acquisition time of 5 min and 10 s. To further confirm the tumor homing property of MSC exosomes, fluorescent bioimaging and biodistribution of profile of fluorescent probe-labeled exosomes was investigated using six-week-old immunodeficient female NU/NU nude mice (n = 3). Briefly, 1 mg of HUC-MSC exosomes or PEGylated nanoparticles (PEGNP) were labeled with 10 µg of DiIC18(7) (1,1'-Dioctadecyl-3,3,3',3'-Tetramethylindotricarbocyanine Iodide (DiR) (Thermo Fisher Scientific, Inc.) to obtain Exo-DiR exosomes or PEGNP-DiR nanoparticles, respectively. Then 5 mg/kg DiR-labelled exosomes or PEGylated nanoparticles were administered via lateral tail vein injections (volume 100 μL). To non-invasively image the exosomes or control particles, mice were anesthetized (2-3% isoflurane in 100% oxygen) and placed within a Pearl® Trilogy imaging system (LI-COR®). The 750 nm channel was used to excite DiR, and emission was observed at 800 nm. Fluorescent background images were acquired prior to exosome or particle administration. When imaging animals, a fluorescent phantom was included in the image for calibration of the fluorescent intensity. After 48 h post-injection, animals were euthanized, and their liver, kidney, spleen, lung, heart and tumor were collected and imaged. The organs were weighed and imaged under the same imaging system to quantify the amount of DiR dye using the Image Studio™ Software.
Statistics
When the assumptions were met analysis of variance was used to evaluate main effects and interactions. Following finding significant main effects or interactions, post-hoc pre-planned comparisons were made using Bonferroni test using SAS studio university edition. Significance was set at p < 0.05. In graphs, mean and standard deviations are presented. Graphics were prepared using Sigma Plot v12.5 and saved as EMF files. The graphic files were edited using ACD Canvas v15 and saved as Tif.
Result and Discussion
Physicochemical characterization of exosomes
Exosomes were isolated from CM by sequential ultracentrifugation using previously described methods [55]. This technique has some advantages compared to others because it is simple and inexpensive, and it separates exosomes from other microvesicles and soluble proteins. As shown in Figure 1, the exosomes were characterized by dynamic light scattering (DLS), Nanoparticles Tracking Analysis (NTA), surface charge (Z-potential) and Transmission Electron Microscopy (TEM). To begin to estimate biological variation, exosomes obtained from two different cell lines were independently processed and compared. As shown in Figure 1A, naive exosomes exhibit a hydrodynamic size of 171 ± 42 nm with a relatively large polydispersity index (PDI) of 0.43 ± 0.03. Similarly, in Figure 1B, NTA revealed a mode diameter of 66 ± 2 nm. Both DLS and NTA data showed a multimodal distribution, indicating heterogeneity in the size of the particles, which is in accordance with previous publications [59, 60]. In Figure 1C, the Z-potential of the isolated exosomes was found to be -16.03 ± 0.72 mV, which was similar to Z-potential of exosomes obtained from HEK293T [61]. In order to confirm the quality of the exosomes, TEM was used to evaluate exosomes. As shown in Figure 1D in a negative stained TEM micrograph, the exosomes appear as roughly spherical entities with a diameter of 50-70 nm. The physicochemical properties of the control PEGlyated nanoparticle is provided in supplemental Figure S1.
Physicochemical characterization of exosomes. (A) Dynamic light scattering (DLS) of unlabeled human mesenchymal stromal cell-derived exosomes (Naive-Exo, blue line) and gadolinium-labeled exosomes after extrusion through polycarbonate membrane (Exo-GdL, red line). Note that after extrusion, a more homogenous size distribution was observed. (B) Nanoparticle tracking analysis (NTA) of Naive-Exo (blue line) and Exo-GdL (red line). No size differences were found when Naïve-Exo were compared with Exo-GdL, but there was a trend for Exo-GdL to be larger than Naive-Exo (66 nm vs. 70 nm). (C) Z-potential (ZP) of Naïve-Exo (blue line) and Exo-GdL (red line). No change in surface charge was seen due to gadolinium labeling, although a trend was noted for increased negative surface charge (-16.0 mV vs. -19.7 mV). (D) Transmission electron microscopy (TEM): Negative staining of Naive-Exo. Note that most particles are less than 100 nm. (E) TEM: Positive staining of Exo-GdL particles. Note that the size of Naive-Exo and Exo-GdL particles are similar. Calibration bar in panels D and E is 100 nm. In the table, data is presented as averages ± one standard deviation.
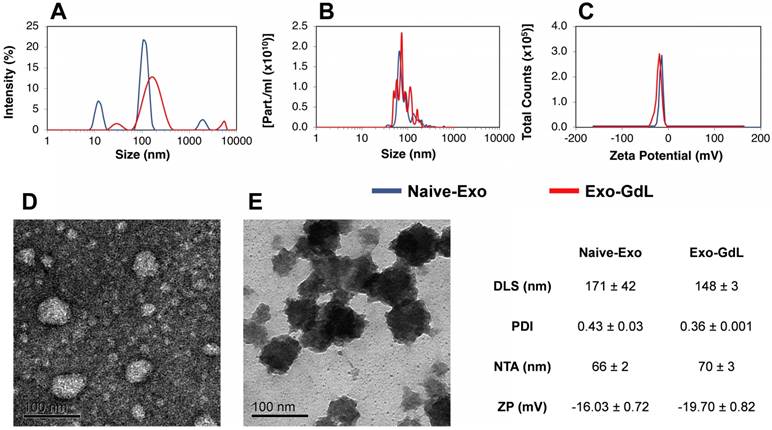
After characterizing naive exosomes, they were labeled with GdL using the lipid insertion technique followed by extrusion through the 200 nm membrane. The resulting Exo-GdL exhibit unimodal distribution as demonstrated in Figure 1A with the hydrodynamic size of 148 ± 3 nm, NTA mode of 70 ± 3 and a PDI of 0.36 ± 0.001. The distribution changes seen when compared with unlabeled exosomes are likely do to the homogenizing effect of extrusion. In addition, the measurement of Exo-GdL Z-potential revealed a net charge of -19.70 ± 0.82 mV. The reduction in charge properties of Exo-GdL indicates the successful insertion of GdL into the membrane lipid bilayer. Nevertheless, as shown in Figure 1E after positive staining and TEM, the morphology and size of Exo-GdL remains grossly unchanged.
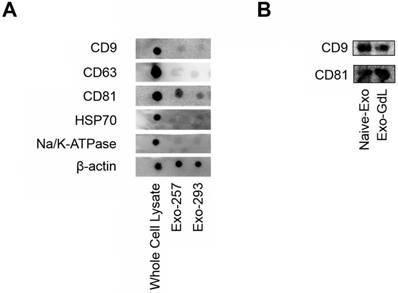
Exosomes are considering to be a product of cell membrane internalization and compartmentalization. Therefore, besides its unique membrane properties, exosomes also preserve the lipid and protein composition of the parent cells. Among the different protein markers present in exosomes, CD9, CD63, and CD81 are considered as exosome-specific proteins [62, 63]. Thus, to confirm the presence of these exosome markers, dot and western blot analysis was conducted. As depicted in Figure 2A, the tetraspanins CD9, CD63 and CD81 were detected in exosomes derived from two different MSC lines and the whole cell lysate. After the insertion of GdL into exosome membrane, there were no differences in the expression of CD9 and CD81 between the naive exosomes and the GdL labeled exosomes (Figure 2B), implying that the labeling process does not alter exosome protein composition.
Dot blots and western blots of mesenchymal stromal cell (MSC) exosomes. A) Dot blots showing the expression of tetraspanins: clusters of differentiation (CD) 9, CD63 and CD81, heat shock protein 70 (HSP70), sodium/ potassium ATPase (Na/K-ATPase) and a protein loading control, beta actin (β-actin) in whole cell lysate obtained from umbilical cord-derived MSCs, and exosomes derived from the conditioned medium from UC-MSC lines HUC-257 (Exo-257) and line HUC-293 (Exo-293). Note that exosomes from two MSC lines had similar exosome protein expression. B) western blots showing the expression of CD9 and CD81 in exosomes from UC-MSC line HUC-257 (Naive-Exo) and gadolinium labeled exosomes from HUC-257 (Exo-GdL). Notice that gadolinium labeling did not change CD9 or CD81 protein expression. Note, in each case, equal amounts of protein were loaded.
Gadolinium loading and release studies
To optimize the gadolinium labelling capability onto exosome membrane, the GdL insertion of several w/w ratios of Exo protein and GdL were evaluated (Figure 3A). The labelling efficiency peaked at 25% GdL per 1 mg exosome protein, and 90% GdL inserted into exosome lipid bilayer compared to the initial GdL input. Even though formulation with Exo protein/GdL ratio of 1:2 showed the highest labelling efficiency, the formulation became unstable and aggregated owing to the disruption in the structural integrity of exosome during GdL insertion. Therefore, the Exo/GdL ratio of 1:1 was used in the remaining experiments.
Gadolinium loading and release studies. (A) Gadolinium (Gd) loading efficiency with different initial input concentrations of Gadolinium lipid (GdL) that correspond to 500 (2:1), 1000 (1:1) and 2000 μg/mL (1:2). Note that maximum GdL labeling occurred at 1:1 ratio. (B) The time-dependent release of Gd from Magnevist® (triangles at top) or GdL-labeled exosomes (Exo-GdL, diamonds at bottom) in physiological conditions (pH: 7.4, 37 ºC). Note that Exo-GdL was more stable and released less than 3% of Gd over 72 h, compared to Magnevist, which released 20% of Gd by 8 h. Gd concentration was quantified by ICP-MS. Data presented are averages ± one standard deviation, n = 3.
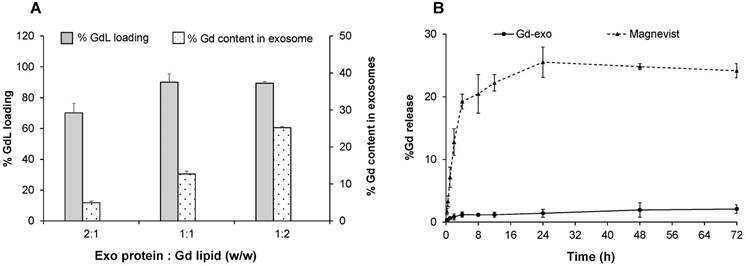
Similar to other heavy metals, one of the major limitations of using gadolinium as a contrast agent in the clinic is the toxicity associated with its free ion form. In fact, there are reported cases of nephrogenic systemic fibrosis (NSF) related to the use of gadolinium in patients with renal dysfunction [64]. In order to avoid potential toxic effects, gadolinium was stabilized with a cyclic macromolecule DOTA, which has been demonstrated to be more stable than other linear macromolecules such as DTPA [65]. To confirm the stability of the contrast agent after labeling exosomes, a GdL release study was conducted (Figure 3B). The selected formulation of Exo-GdL released less than 2% in a period of 72 h under dialysis conditions, whereas Magnevist® display a burst release in the first 4 h. The gadolinium ion released from Magnevist® was 5 times higher than that of Exo-GdL at the end of experimental time. This result suggested that the selected Exo-GdL formulation was safe for use in vitro and in vivo studies (Figure 3B).
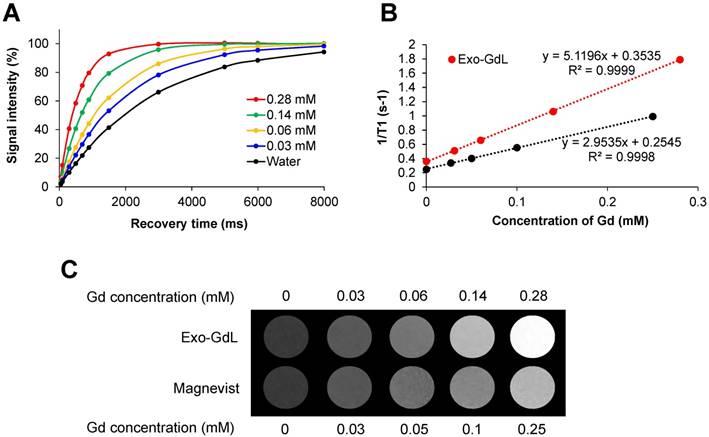
To further investigate the effect of GdL-Exo on MR relaxivity, a serial dilution of Exo-GdL was carried out to obtain different Gd concentration and Magnevist® with similar Gd concentration was used as control (Figure 4). The resulting diluted samples were subjected to T1 measurement using a Bruker 600 MHz (14.1 T) Advance III with microimaging capability. The magnetic properties of Exo-GdL and Magnevist® were first investigated by measuring the signal intensity of water protons with recovery time (TR) varying from 0 to 8000 ms at a constant echo time (TE) of 6.5 ms to obtain T1 relaxation time (Figure 4A). These T1 relaxation times were converted to s-1 (1/T1) and plotted against Gd concentration in mM. The longitudinal relaxation rates of both Exo-GdL and Magnevist® exhibited a linear relationship with respect to gadolinium concentration with the coefficient factor (R2) greater than 0.999. The slope of obtained linear equation depicted the r1 relaxivity (mM-1s-1) of gadolinium in each formulation. These results show that the Exo-GdL exhibit a r1 of 5.1 mM-1s-1 while the Magnevist® control show a r1 of 2.9 mM-1s-1. The higher r1 relaxivity of Exo-GdL is probably due to the reduction in tumbling rate upon GdL insertion into exosomal membrane leading to the increasing of relaxivity [66]. The brighter effect in MRI contrast was also depicted by T1-weighted images of different Exo-GdL and Magnevist® concentration; water was used as a control. These results demonstrated that Exo-GdL always showed a brighter contrast than Magnevist® samples at the same gadolinium concentration as presented in Figure 4C.
Magnetic properties of gadolinium-labeled exosomes. (A) T1 recovery curve of gadolium-labeled exosomes (Exo-GdL, top) at different concentrations of gadolinium (Gd). (B) A plot of 1/T1 vs. the concentration of the contrast agent in aqueous solution measured using a 14.1 T MRI system at 37 ºC. Longitudinal relaxivity (r1) of gadolium-labeled exosomes (Exo-GdL, slope of the red line) or Magnevist® (slope of the black line) is 5.1 and 2.9 mM-1s-1, respectively. (C) T1-weight imaging Exo-GdL and Magnevist® at different concentrations in aqueous solution measured in a 14.1 T MRI system. Note that Exo-GdL have enhanced contrast compared to Magnevist®.
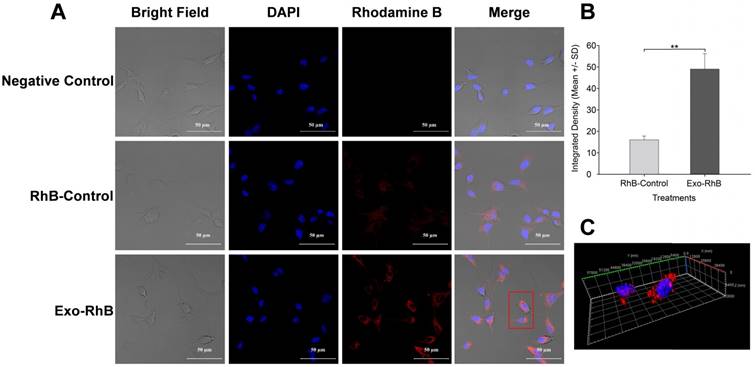
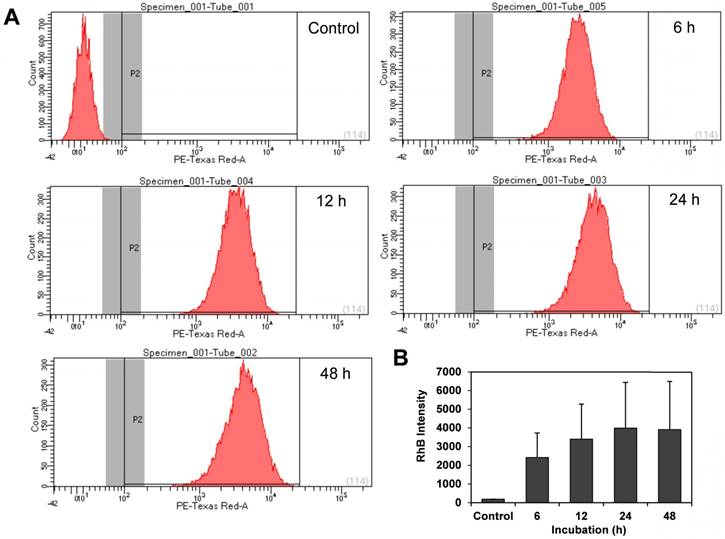
Exosomes derived from HUC-MSCs have been studied as a therapeutic agent due to their anti-proliferative and pro-apoptotic effect [67]. Lee et al. reported that MSC-derived exosomes reduce the expression of vascular endothelial growth factor (VEGF) through the release of miR-16, leading to the reduction of angiogenesis in breast cancer model in vivo and in vitro [68]. To investigate the interaction of HUC-MSC exosomes with cancer cells, the cellular uptake of exosomes in osteosarcoma cells (K7M2) was investigated using exosomes labeled with rhodamine B (Exo-RhB) using lipid insertion protocol. Thereafter, the Exo-RhB was incubated with cells for 24 h, and the internalization of exosomes was analyzed by confocal microscopy (Figure 5). The RhB-labeled liposomes were used as a control particle (control-RhB). As shown in Figure 5B, the fluorescence intensity of the Exo-RhB (48.85 ± 6.97) was significantly higher than that of control-RhB nanoparticle (16.05 ± 1.48, p < 0.05). The 3D image of the cells revealed that the exosomes were internalized into the cell and located in the cytoplasm and not non-specifically distributed on the cell surface or within the nucleus. This observation indicates that Exo-RhB were taken up by K7M2 cells (Figure 5C). To further evaluate the effect of time on the exosomes uptake, flow cytometry was used to assess their uptake in K7M2 cells at 6 h, 12 h, 24 h, and 48 h of incubation with Exo-RhB under standard conditions. After the incubation time, cells were rinsed three times in DPBS and then evaluated by flow cytometry (Figure 6A). The result show that exosome uptake by K7M2 cells is time-dependent over the 6 h to 24 h observation period (data summarized in Figure 6B). The maximum uptake (40%) was reached after 24 h of incubation; there were not additional labeling after 24 h.
Exosome uptake by murine K7M2 osteosarcoma cells. Exosomes derived from human umbilical cord-derived mesenchymal stromal cells were labeled with Rhodamine B (Exo-RhB) were added to K7M2 mouse osteosarcoma cells and imaged by confocal microscopy. K7M2 murine osteosarcoma cells (104/cm2) were seeded in 8-well chambered coverglass and incubated for 24 h at 37 ºC and 5% CO2. Next, K7M2 cells were exposed to 25 μg of Exo-RhB in a 50:1 ratio (Exo:RhB) and incubated for an additional 24 h. Rhodamine B lipid alone (RhB-Control) or Dulbecco's phosphate buffered saline (Negative Control) were used as controls. Next, the cells fixed and their DNA was stained with 4′,6-diamidino-2-phenylindole (DAPI) prior to confocal microscopy. (A) Exosome uptake shown by confocal images. (B) Integrated density of Exo-RhB and RhB-control shows that significantly more RhB fluorescence is found within K7M2 cells after exposure to Exo-RhB compared to RhB-Control. (C) A stack of confocal images generated a 3D visualization of exosome location within the cytoplasm of K7M2 cells. The red rectangle in panel A indicates the cells imaged in panel C. Graph shows average ± one standard deviation, n = 3. Two-tailed t-test, ** p < 0.01.
Exosome uptake quantified by flow cytometry. Murine osteosarcoma K7M2 cells were incubated with unlabeled mesenchymal stromal cell-derived exosomes (Control) or Rhodamine B (RhB)- labeled exosomes (Exo-RhB) and the time-dependent uptake was measured by flow cytometry (10000 events per histogram). (A) Flow cytometry histograms indicate RhB-positive events (P2) for unlabeled exosomes (Control), or after 6 h, 12 h, 24 h, and 48 h of incubation with Exo-RhB. (B) Integrated fluorescence intensity (RhB intensity) of Exo-RhB within K7M2 cells. Note that RhB intensity with K7M2 cells increases over the first 24 h. Data shown is median area under the curve ± 1 standard deviation.
The effect of exosomes and of Exo-GdL on cancer cell proliferation was evaluated using the MTT assay. As was mention before, there is a concern about the implementation of GdL as contrast medium because of its potential toxicity, even if the metal is chelated. For that reason, in this assay, the effect of GdL or RhB labeling into exosomes on cell proliferation was investigated. K7M2 and 143B cells were seeded in 96-well plate format in five independent replicates. The cells culture were treated for 24 h with 10 ng, 20 ng, and 30 ng per well of naive exosomes, Exo-GdL or exosomes double-labeled with both GdL and RhB (Exo-GdL-RhB). As shown in Figure 7, both K7M2 and 143B cell lines exhibit higher proliferation when exposed to naive exosomes at 10 ng, compared with the controls. As the concentration of naive exosome increases, a dose-dependent reduction on the proliferation was observed for both cancer cell lines. Specifically, in K7M2 cells, naive exosomes showed a significantly enhanced proliferative effect at 10 ng (3103.90 ± 175.41 cell/well) and 20 ng (3136.27 ± 168.18). However, when the concentration of exosome increased up to 30 ng, the number of cells dropped from 3136.27 ± 175.41 to 2879.64 ± 93.75 cells/well. Similar results were found in 143B cells, where the number of naive exosomes at 10 ng (3710.93 ± 212.72 cells/well) was higher than the control (3513.36 ± 89.75 cells/well), but the number of cells significantly fell and became lower than the number of control cells as the treatment concentration reached to 20 ng (3294.92 ± 113.74 cells/well) and 30 ng (3254.60 ± 176.95 cells/well), showing the dose-dependent inhibition of proliferation.
Effect of exosomes on osteosarcoma cell proliferation. A, B and C. K7M2 mouse osteosarcoma cells were exposed to 10 ng, 20 ng or 30 ng of unlabeled (naive)-exosomes or gadolinium-labeled exosomes (Exo-GdL) and their proliferation was assayed using a colorimetric assay for measuring cell metabolic activity based on the ability of nicotinamide adenine dinucleotide phosphate (NADPH)-dependent cellular oxidoreductase enzymes to reduce the tetrazolium dye, 3-(4,5-dimethylthiazol-2-yl)-2,5-diphenyltetrazolium bromide (MTT), to insoluble formazan. Dulbecco's modified eagle medium (DMEM) without exosomes was added as the Control. Note that naïve exosomes produced a dose-dependent decrease in K7M2 cell proliferation, but Exo-GdL did not. D, E and F. 143B human osteosarcoma cells were exposed to 10 ng, 20 ng or 30 ng of naïve-exosomes, Exo-GdL, or exosomes labeled with both GdL and Rhodamine B (Exo-GdL-RhB) and assayed using MTT. Note that, similar to the response of K7M2 cells (A-C), naive exosomes produced a dose-dependent decrease in 143B cell proliferation, but Exo-GdL did not. In contrast, Exo-GdL-RhB produced a dose-dependent increase in 143B cell proliferation. To compare the effect of exosomes isolated from different human mesenchymal stromal cell (MSC) lines, line HUC-257 was used in C and exosomes from line HUC-293 was used in F. Note that the exosomes produced from different MSC lines had similar effects on osteosarcoma cell proliferation. Data are averages of technical triplicates from five independent cell lines (n=5) ± one standard deviation. Statistical analysis by ANOVA followed by post hoc planned comparisons. * p < 0.05).
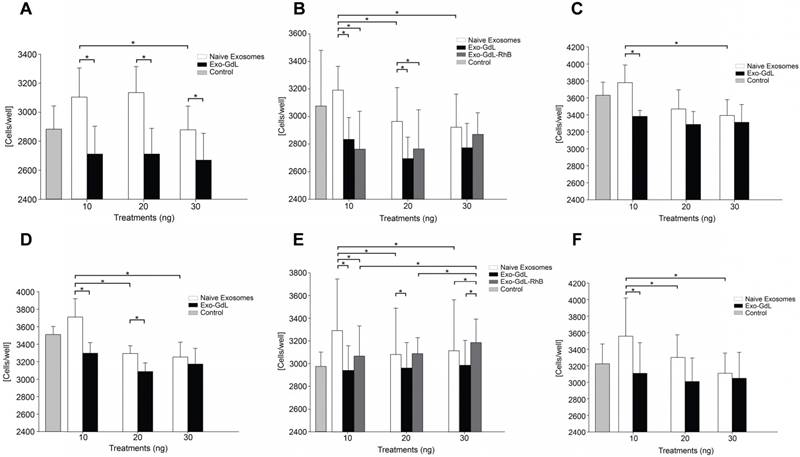
On the other hand, cells treated with Exo-GdL exhibited an inhibitory effect on proliferation (2967.98 ± 213.46 cells/well) compared with the control, regardless of the Exo-GdL concentration (Figure 7A). In addition, the effect of double-labeled (GdL and RhB) exosomes was investigated on both cell lines. These results showed that K7M2 exhibited the same response obtained from the single labeling (Exo-GdL). However, in the case of 143B, there was a proliferative effect at 10 ng (3071.16 ± 260.58 cells/well), 20 ng (3086.97 ± 138.48 cells/well), and 30ng (3184.30 ± 206.02 cells/well) compared with the control (2975.41 ± 121.42 cells/well). Interestedly, the double-labeled exosomes show a proliferative effect in a dose-dependent manner (Figure 7E). Finally, the effects of exosomes prepared from different HUC lines mediated similar responses in both human and mouse osteosarcoma cells. For this purpose, exosomes from HUC-257 and HUC-293 were isolated under the identical experimental conditions. As expected, the proliferation of cancer cell lines exhibit the same trend in response to Exos derived two different HUC cell lines (Figure 7C and 7F). Similar results were found by Alarifi et al. in SH-SY5Y human neuroblastoma cells with gadolinium oxide nanoparticles (GNPs) where the cell viability was significantly reduced in a time and dose dependent manner after 24 h and 48 h [69].
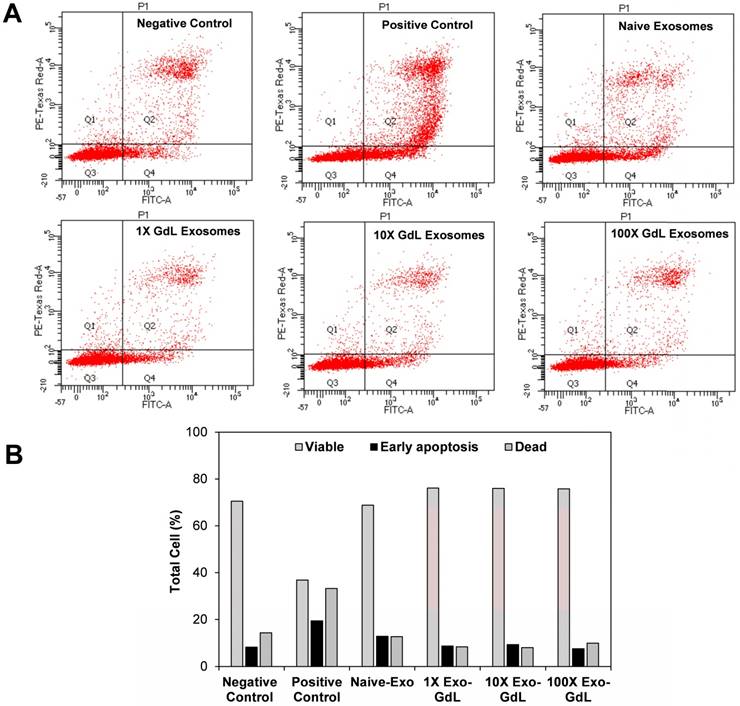
Since exosome exposure decreased the proliferation of cancer cells, we investigated whether that reduction was accompanied by activation of apoptosis, as indicated by Annexin V staining. To assess apoptosis, K7M2 osteosarcoma cells were treated with 30 ng/cm2 (1X) of naive-Ex or 10X and 100X of Exo-GdL. The cells were incubated for 24 h with the treatments and then stained with Annexin V and PI. The results of this assay can be interpreted depending on the intensity of the Annexin V and PI. Cells with the negative signal of Annexin V and PI are healthy “normal” cells. Cells with positive signal of Annexin V are considered to be in early apoptosis. Cells that are positive for both markers Annexin V and PI are considered to be necrotic. The kit implemented in this experiment does not discriminate cells that are only positive for PI. Figure 8A shows the representative dot plot of the forward and side scatter for K7M2 cells after 24 h of incubation with the treatments. There were no appreciable differences in the percentage of apoptotic cells between the 1X naive exosomes (12.8%), 10X Exo-GdL (9.3%), 100X Exo-GdL and the negative control (8.2%), whereas the 500 µM H2O2 positive control treatment reaches a maximum of 19.4% of apoptotic cells (and more necrotic cells, too).
Effect of exosomes on murine K7M2 cell apoptosis. K7M2 cells were exposed to exosomes derived from human umbilical cord mesenchymal stromal cells (Naive-Exo) or exsomes labeled with gadolinium (Exo-GdL) at three different concentrations (30 ng/cm2 = 1X, 300 ng/cm2 = 10X, or 3000 ng/cm2 = 100X). Exosomes were suspended in 1 mL of Dulbecco's modified eagle medium (DMEM) supplemented with 10% pooled human platelet lysate (HPL) depleted of exosomes. 1 mL of the same culture media was used as negative control (Negative Control) and DMEM with 500 µM of hydrogen peroxide (H2O2) was used as a positive control (Positive Control). (A) Representative dot plots of PI vs. Annexin-V stained cells. Cells in quadrant 2 (Q2) correspond to dead cells. Viable cells are found in Q1 and Q3, and cells in early apoptosis are found in Q4. (B) Percent distribution of live (Viable, gray bars), early apoptosis (black bars) or dead cells (hashed bar) after exposure to different treatments for 24 h. Note that the positive control (peroxide treatment) tended to increase cell death and early apoptosis in K7M2 cells, as expected. In contrast, neither K7M2 cell death nor early apoptosis were not affected by exposure to either naive-Exo or GdL-Exo, even up to 100X concentration.
Additionally, apoptosis was investigated using confocal microscopy to gain a better understanding of the cell's status. Cells were seeded under the same conditions in 1 cm2 8-well chambered cover glass and underwent the same treatment protocol. After the incubation time, cells were fixed with paraformaldehyde /glutaraldehyde solution and observed. Annexin V/FITC was excited with a wavelength of 530 nm and PI with 630 nm. As shown in Figure 9 and supplemental Figure S2, Annexin V signal (depicted by the green fluorescence) in the cell membrane and PI signal exhibits (bright red fluorescence) in the nucleus. In principle, this assay relies on the binding ability of Annexin V to Phosphatidylinositol and intercalation of PI into DNA molecules. When cells become apoptotic, the cell membrane become destabilized, thereby, exposing the phosphatidylinositol to the outer leaflet of the cell membrane, which in normal conditions is facing the cytoplasm.
Exosomes effect apoptosis of osteosarcoma cells. Murine K7M2 osteosarcoma cells were exposed to 30 ng/cm2 (1X) of unlabeled human mesenchymal stromal cell derived exosomes (Naive Exo) or 3000 ng/cm2 (100X) or 30,000 ng/cm2 (1000X) gadolinium-labeled exosomes (Exo-GdL) suspended in Dulbecco's modified eagle medium (DMEM) supplemented with 10% pooled human platelet lysate depleted of exosomes (dpHPL). K7M2 cells were incubated for 24 h and observed under confocal microscopy (the calibration bar is 20 μm). DMEM with 10% dpHPL media was used as negative control and DMEM with 10% dpHPL with 500 µM of H2O2 was the positive control. K7M2 cells were stained with Annexin-V FITC (green) and propidium iodide (PI, red). Double-negative (no staining) were healthy cells, Annexin V-positive stained cells were in early apoptosis (green), cells Annexin V-positive and PI-positive were dead or necrotic cells (green/red). Note that in the Naive Exo panels, one cell in the lower right part of the panel is undergoing cytokinesis and is staining with Annexin V and PI.
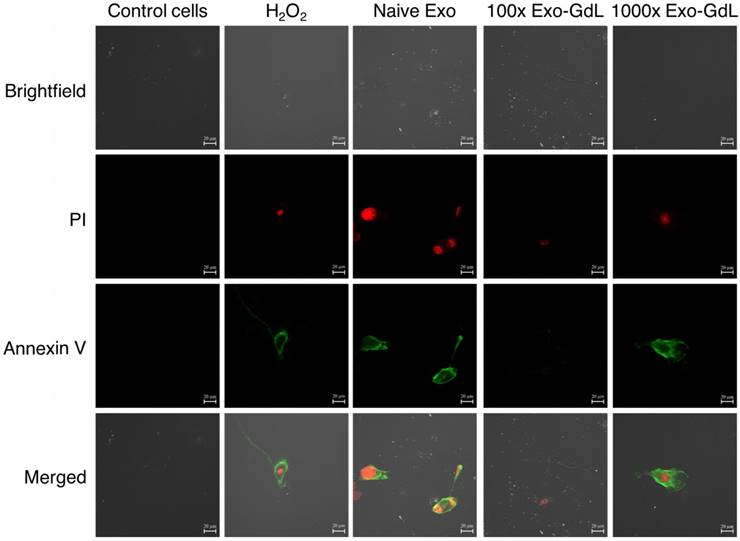
On the other hand, PI is a fluorescent dye that intercalates into DNA, but it's not permeable to the plasma membrane [70]. This method of apoptosis detection responds more to the mechanic properties of the membrane rather than determine the activation of apoptotic pathways. In summary of our observations, exosomes reduce cell proliferation in human and mouse osteosarcoma cell lines without an effect on apoptosis. Experiments targeting the metabolic pathways of apoptosis such as caspases should be considered in the future to better delineate the mechanism of exosome's action on cancer cells.
In vivo detection of Exo-GdL by MRI
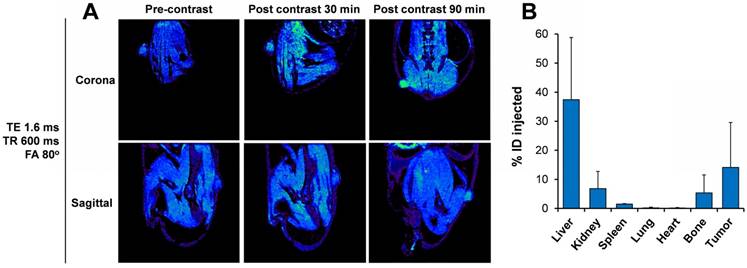
To prove the applicability of the Exo-GdL for imaging purposes, K7M2 cells were implanted into NU/NU nude mice. After 15 days to permit tumor development, Exo-GdL were intravenously injected into the mice. Images were acquired under the established protocol with pre- and post-contrast at 30 min and 90 min. Figure 10A shows representative sagittal and coronal views taken through the tumor level at TE = 1.6 ms, TR = 600 ms and FA = 80º. The signal intensity in the tumor increased in a time-dependent manner. After 90 min post-injection, the tumor became brighter and clearly distinguishable from the surrounding tissue due to the accumulation of Exo-GdL. To further evaluate in vivo behavior of Exo-GdL, the biodistribution of Exo-GdL was evaluated 24 h after injection. For this experiment, liver, kidney, spleen, lung, heart, bone and tumor were individually collected, digested and subjected to Inductively Coupled Plasma Mass Spectrometry (ICP-MS) to quantify their Gd content. As shown in Figure 10B, Exo-GdL accumulated in liver (38%), kidney (8%) and spleen (2%), the main excretion organs responsible for elimination of small molecules and nanosized material [49, 71].
Distribution of gadolinium-labeled exosomes in tumor-bearing mice using magnetic resonance imaging (MRI). (A) Representative MR images of mouse K7M2 osteosarcoma ectopic tumor-bearing mouse demonstrating the enhancement of positive contrast at tumor site after 30 min and 90 min post injection of gadolinium-labeled exosomes (Exo-GdL). The images were taken at echo time (TE) of 1.6 ms, repetition time (TR) of 600 ms, and flip angle (FA) of 80º using a 14.1 T MRI. (B) 24 h after Exo-GdL injection, the mice were sacrificed, the organs and tumor were disrupted with concentrated HNO3 and gadolinium concentration was measured using inductively coupled plasma mass spectroscopy (ICP-MS). Note that the liver had approximately 37% of the gadolinium and the tumor had approximately 16%. Graph data is the average ± one standard deviation, n=3.
Interestingly, the accumulation of Exo-GdL was higher in tumor, reaching 18%, as compared to that of commercial agent Magnevist® [72, 73]. Magnevist® is a standard MRI contrast agent that the FDA approved in 1988 to facilitate the visualization of lesion and abnormal vascularity in the body. We choose Magnevist® as a control in our study since it provides a clinical reference point to compare MRI tumor contrast. Previous work demonstrated that unconjugated Magnevist® was not very effective for imaging osteosarcoma [74, 75]. It is noteworthy that Magnevist® is small molecule magnet whereas Exo-GdL is a nanoparticulate system. When the synthetic material is introduced into a biological environment, it has to overcome multiple barriers in order to produce a response [46]. As a consequence, the majority of the synthetic nanoparticles will be eliminated before reaching the site of action, thereby the nanoparticle accumulation in tumors is low. In the case of exosomes, owing to their biological origin, they can circulate throughout the system without signs of adverse effects and then traffic to the tumor [76]. In addition, the accumulation of exosomes in tumors, as occurs with other nanomaterials, can be explained by the enhanced permeability and retention (EPR) effect where the lack of lymphatic drainage as well as the disorganized architecture of the tumor vascular system, which promote the accumulation of macromolecules and nanosize material at the tumor [77]. All of these factors presumably are contributing to the accumulation of exosomes in this present study.
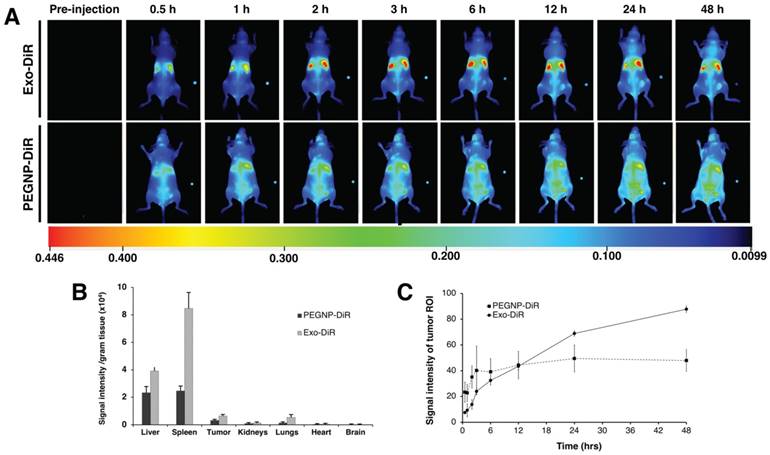
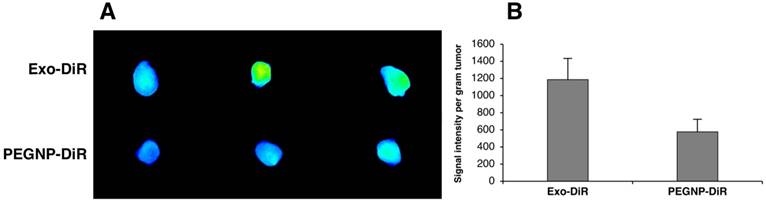
To further examine the versatility in surface modification and confirm the accumulation in tumor exhibited by exosomes labeled with GdL, we compared exosomes labeled with a near infra-red dye (DiR), or PEGylated NPs labeled with DiR, (PEGNP-DiR) and tracked their distribution in 3 NU/NU K7M2-tumor bearing mice following intravenous injection. As shown in Figure 11A, Exo-DiR and PEGNP-DiR predominantly accumulated in liver, which is similar to the observation obtained following Exo-GdL distribution. However, the distributed signal intensity of Exo-DiR in liver and spleen was two-fold higher than that of PEGNP-DiR even after 48 h of injection, presumably due to the longer circulation time of exosome (Figure 11B). We further evaluated the accumulation of particles in the tumor over the time by extracting signal intensity from a region of interest (ROI) in the tumor. The result shows that even though the fluorescence intensity in the tumors of the Exo-DiR mice increases slower than PEGNP-DiR mice in the first 3-12 h post injection, the accumulation of exosomes dramatically increased over the next 12 h after injection. In the case of PEGNP-DiR injected mice, the signal intensity within the tumor did not increase after the first 3 h following injection. On the other hand, fluorescent intensity in tumors of Exo-DiR injected mice increased in intensity throughout the 48 h observation period following injection (Figure 11C), indicating the accumulation of exosomes. At the 48 h time point after injection, the signal intensity of tumors from both Exo-DiR-injected mice and PEGNP-DiR- injected mice was compared, and the intensity of tumors injected with Exo-DiR (1185.84 ± 247) was twice that obtained with PEGNP-DiR (576.70 ± 146), which strongly supports the dynamic signal intensity data (Figure 12).
Distribution of near infrared dye-labelled exosomes in mice with ectopic osteosarcoma tumors. (A) Time-dependent distribution of near infrared dye-labeled exosomes (Exo-DiR) (Exosome) or synthetic nanoparticles labeled with DiR (PEGNP-DiR) within tumor-bearing mice. Note that the DiR labeling of the tumor had a more rapid onset in the PEGNP-DiR injected mice and then waned over time. In contrast, after injection with Exo-DiR, DiR labeling within tumor increased in intensity throughout the 48 h survival period. Note that each image contains a small fluorescent phantom for calibration on the right part of the panel. (B) After the 48 h survival period, the organs were collected and the fluorescent intensity was individually assessed. Graph shows the signal intensity per gram of tissue in organs and tumor (average ± one standard deviation). (C) After injection, the tumor region of interest (ROI) was selected and the fluorescent signal measured at eight time points over the 48 h period after intravenous injection. Data are presented as the average ± one standard deviation (n = 3).
Near infrared dye (DiR) fluorescence within mouse K7M2 osteosarcoma tumors. (A) Fluorescent bioimaging of mouse osteosarcoma tumors after sacrifice, 48 h after intravenous injection of either by DiR-labeled exosomes (Exo-DiR) or the synthetic control nanoparticle labeled with DiR (PEGNP-DiR). Note that the tumor size was consistent between the two groups. (B) Quantitative signal intensity per gram tumor demonstrates the tumor accumulation of exosomes compared with the control nanoparticles. Data is shown as averages ± one standard deviation, n = 3.
When comparing the two exosome labeling methods, GdL-labeled exosomes were quantified using ICP MS, compared to the fluorescence method used for exosomes labeled with DiR. ICP MS provide much higher specificity and accuracy for measuring tissue content than fluorescent imaging. Both methods indicated high levels of accumulation in liver or liver and spleen, followed by accumulation in tumor. To summarize the present work, HUC-MSC exosomes accumulate in mouse osteosarcoma tumors for 24-48 h after intravenous injection.
Qi et al. showed that exosomes isolated from blood accumulate in the tumors of H22-tumor bearing mice [74]. Similar results were reported in a C57Bl/6 mice model of metastatic lung cancer, where paclitaxel-loaded exosomes from RAW 264.7 macrophages not only promote the accumulation of the drug at the tumor site but also increase the particles uptake by the cancer cells compared with liposomes or polystyrene nanoparticles [78]. In recent studies, extracellular membrane isolated from natural killer cells fused with liposomes were used to deliver doxorubicin to MCF-7 tumor bearing mice; this demonstrated more effective tumor inhibition compared to the free doxorubicin injection [42]. In another study, exosomes derived from transfected siRNA/HEK-293T cells reduced the tumor weight and size of a SGC-7901-tumor mouse model [79], indicating that exosomes, in addition of their targeting properties, also conserve the characteristics of the parental cell, which opens the possibility of engineering exosomes with potential therapeutic applications. The results here indicate that HUC-MSCs exosomes can accumulate at the tumor site in vivo and may reduce proliferation of cancer cells in vitro in a dose-dependent fashion.
The mechanisms involved in the exosome uptake or proliferation effects were not evaluated here. However, there is evidence that the osteosarcoma tumor niche contains a population of non-malignant MSCs with normal karyotype and without tumor-related abnormalities [80], which could explain the affinity of HUC-MSC exosomes for this particular kind of tumor. Additionally, the bidirectional interaction between osteosarcoma cells and MSCs in metabolic reprograming, has been suggested [81, 82]. Hoshino et al. demonstrated the involvement of exosomal integrins in the targeting of metastatic niches by exosomes derived from breast and pancreatic cancer [51]. This evidence suggests that the cell membrane composition of exosomes maybe provide them with specific targeting properties.
Homing of exosomes versus extravasation
We cannot claim that MSC exosomes “home” to tumors because certain key elements are missing. Our in vivo studies support the notion that MSC exosomes accumulate within tumor for 24-48 h after intravenous infusion. First, conditioned medium from umbilical cord-derived MSCs was used to isolated exosomes. These exosomes were characterized by TEM, western blot and size and charge characterization standard to the field. The exosomes expressed tetraspanins CD9, CD63, and CD81, and Na/K ATPase and Hsp70, showed a size of 50-100 nm (DLS, NTA and TEM) and a ZP of -16 to -19 mV, suggesting that they have similar physicochemical characteristics to MSC exosomes previously reported [4, 76, 83-90]. We prepared several batches of exosomes from MSC condition medium and they shared similar physicochemical and physiological properties. Based upon this data, we conclude that MSC exosomes were employed here. Please note that new methods may isolate subsets of extracellular vesicles (EVs) [91-95], and different EV subsets may produce different distribution within tissues or physiological properties on osteosarcoma cells. Second, the MSC exosomes were labeled using several methods: fusion with Rhodamine-B labeled liposomes, gadolinium incorporation, and NIR dye incorporation, or labeled with both Rhodamine B and GdL followed by extrusion. Of these methods, GdL labeling by extrusion was characterized more fully than the other methods. The GdL labeled exosomes had similar physicochemical properties, surface markers, and accumulation in osteosarcoma cells in vitro. Note that extrusion through polycarbonate membrane produced a more homogenous size distribution compared to naïve exosomes (notice the change in standard deviation in the DLS data in Figure 1: 171 ± 42 nm of naive Exosomes before extrusion vs 148 ± 3 nm GdL-labeled exosomes after extrusion). The labeled exosomes demonstrated good GdL-stability. In summary, when taken together, these data indicate that the major components of the exosome remain unchanged after extrusion. When the labeled exosomes were added to cancer cell lines in vitro, their incorporation was found to be time-dependent by confocal microscopy and by flow cytometry. Confocal microscopy showed that exosomes were located in the cytoplasm, and not attached to the cell surface or inside the nucleus of cancer cells. The flow cytometry indicated that exosome accumulation in cancer cells increases over 24 h after introduction. Next, we found that exposure to MSC exosomes reduce proliferation of mouse and human osteosarcoma cell lines using an MTT assay. The specificity was indicated by a dose-response relationship, but exosomes did not change Annexin V staining. This suggests that the exosomes reduces proliferation by increasing cancer cell population doubling time and not by increasing apoptosis.
Other have shown that MSC exosomes are taken up by cancer cell lines or affect the physiology cancer cell lines in vitro [4, 38, 68, 96]. For example, Altanerova U et al. reported that iron oxide labeled MSC exosomes accumulate within prostate cancer cells in vitro, and those cancer cells can be killed by magnetic hyperthermia [96]. Similarly, Lee JK et al. found that mouse bone marrow-derived MSC exosomes accumulate in mouse breast cancer cell line 4T1 (mouse) over 24 h in vitro [68]. Note that Lee JK et al. reported that MSC exosomes did not affect the proliferation of breast cancer cells in vitro, but did inhibit tumor progression and angiogenesis in vivo. Qi J et al. reported that human bone marrow-derived MSCs accumulate in human osteosarcoma cell line MG3 and gastric cancer cell line SGC7901 over 24 h in vitro [38]. In contrast to our observations, Qi J et al. reported that MSC derived exosomes increased the proliferation of human osteosarcoma MG63 cells and gastric cancer SGC7901 cell lines in a dose-response fashion. Please note that in their work, 200-800 µg/mL exosomes were used in the dose-response study. This represents approximately 3 orders of magnitude more exosomes than used here (67-200 ng/mL). Therefore, one possibility of the difference in the present study and Qi J et al.'s is the “dose” of exosomes. Another possibility is that different cancer cell lines were used. Here, GdL or fluorescent dye labeled exosomes had grossly similar effects on osteosarcoma cells in terms of uptake and proliferation compared with unlabeled or naïve exosomes. This suggests that labeling exosomes with gadolinium was relatively non-toxic. In summary, our in vitro work shows that MSC exosomes accumulate within human and mouse osteosarcoma cells over 24 h and affect cancer cell proliferation at 67-200 ng/mL concentration. Together with previous work, it is clear that MSC exosomes accumulate within the cytoplasm of various cancer cell lines in vitro and may affect proliferation of these cell lines in a dose-dependent fashion.
Fourth, we examined the biodistribution of labeled MSC exosomes in ectopic tumor bearing mice after intravenous injection of 5 µg/g bodyweight. In two different experiments, one using 14.1 T MRI and the other using bioimaging of near infrared dye labeled exosomes, we tracked biodistribution to within the bounds of the ectopic tumor. To our knowledge, this proof of concept study is the first report of biodistribution of GdL labeled MSC exosomes in tumor bearing mice. Strikingly, we found that 18% of the GdL labeled exosomes were within the tumor 24 h after intravenous injection, and liver having the highest accumulation of GdL labeled exosomes. This suggests that the GdL labeling method may confer higher sensitivity than DiR labeling to identify tumor cells since we found the highest accumulation of DiR labeled exosomes in spleen followed by the liver (with the spleen having about twice the fluorescent intensity as the liver). Next most accumulation was in the tumor and lungs. Notably, the control DiR-labeled liposomes had about equal fluorescent intensity in liver and spleen, followed by tumor and lungs. The control particles, DiR-labeled liposomes, reached a peak fluorescence intensity within the tumor sooner than the DiR-labeled exosomes (at 3 h), however, the intensity did not change after the 3h observation point (Figure 11C). In contrast, the DiR signal intensity from labeled exosomes increased over the 48 h observation window (Figure 11C), and at the 48 h observation period, the fluorescent signal observed using the labeled exosomes was about double the intensity of the fluorescent liposome control nanoparticle.
There is limited information about the biodistribution of MSC exosomes after intravenous injection. For example, distribution to the brain was reported after MSC exosomes labeled with gold nanoparticles were injected into stroke-damaged mice [97, 98]. More biodistribution information was reported with near-infrared dye labeled MSC exosomes in healthy mice [49], or in mice following acute kidney injury [71]. These reports indicated that MSC exosomes accumulate in most in liver and spleen after intravenous injection in healthy animals [49, 71], and that exosomes may accumulate in tissues that are injured [71] or in a tumor [49].
The study by Wilklander OP et al. compared several different sources of exosomes, and compared the dose effect, the effect of route of injection, the changes in exosome accumulation over time on biodistribution [49]. They found that DiR labeled exosomes regardless of tissue source tend to accumulate most in liver, spleen, gastrointestinal track and heart and lungs. Second, they showed that HEK293T exosomes accumulate in tumor tissue in tumor bearing mice, and while HEK293T exosomes accumulate in tumor, they accumulate at higher levels in liver, spleen, heart and lungs, and the gastrointestinal track at 24 h, than in tumor. Thus, their observations generally agree with the observations reported here: DiR labeled exosomes accumulate in tumor, but at a lower level than liver and spleen. The Wiklander OP et al. paper suggests that tissue that exosomes originate from may influence exosome accumulation or distribution. This observation agrees with a hypothesis posed by Rana S et al. regarding exosomal tetraspanins contributing to target selection [99, 100]. The tissue specificity for exosome accumulation indicated by Rana S et al. was not observed either by Wilklander OP et al. or in the present paper. This difference may be due to differences in the exosome populations used. Here, we show DiR labeled exosome accumulation in tumor increased continuously over the 48 h observation period, which was supported by our observations of exosomes over 24-48 h in vitro. Our observation of GdL labeled exosomes indicate 18% of the signal in tumor at 24 h after injection suggests that the labeling or tracking method may affect the biodistribution of exosomes. In the future, pharmacokinetic analysis should be performed to determine kinetics of exosome plasma residence time and bioactivity in healthy and disease models.
The present report is the first to show that MSC exosomes continuously accumulate within ectopic osteosarcoma tumors over 24-48 h in vivo. While the ectopic model used here demonstrated proof of concept, the orthotopic model should be considered for follow-up studies since it mimics the natural tumor environment and because it increases the likelihood of metastatic cancer [101-105]. While exosome accumulated within tumor in vivo, a limitation of our experiments is that we did not demonstrate whether the labeled exosomes entered cancer cells, tumor stromal cells (MSCs) or infiltrating immune cells. Similarly, our experiments suggest that labeling exosomes with GdL may confer greater tumor specificity that labeling with DiR. Finally, while labeled liposomes did not continue to accumulate within the tumor past 3 h after intravenous injection, we did not test whether exosomes derived from other cells, such as the HEK293T cells, or GdL labeled liposomes would show a different rate of accumulation within tumor. These critical questions will need to be answered in the future. From this proof of concept study, it is obvious that MRI is better for whole body imaging as we can visualize deep in tissues non-invasively and with enhanced contrast. However, if the purpose is to visualize tumor intraoperatively [102], MRI is impractical and fluorescent imaging may be easier to implement. In our future work, we propose to make a dually labeled exosome which can be visualized by both MRI and NiR.
In summary, naive and labeled MSC exosomes entered cancer cells, reside in their cytoplasm, and modestly inhibit human and mouse osteosarcoma cell line proliferation in vitro in a dose-dependent fashion. These observations are in agreement with previous work that shows that MSC exosomes enter a variety of tumor cell lines in vitro and affect their proliferation. Second, in the first study of its kind, we showed that GdL- or DiR- labeled MSC exosomes introduced into tumor bearing mice accumulate in the tumor over a 24-48 h period. The accumulation within tumor by DiR labeled exosomes resulted in about double the fluorescence in tumor compared to labeled liposomes used as controls at the 48 h observation point; similarly, about 18% of the GdL was found within the tumor 24 h after injection. Since DiR labeled liposomes did not continue to accumulate within tumor beyond 3h after injection, this difference suggests that exosomes continue to leave the vasculature and enter tumor and get sequestered over 24-48 h. Third, DiR labeled exosomes have a biodistribution that is grossly similar to that seen by other DiR labeled nanoparticles including exosomes derived from other tissues after intravenous injection, with the majority being located in major organs such as liver and spleen. When GdL exosomes were tracked, the highest accumulation was found in liver (38%) followed by tumor (18%). Finally, the accumulation of DiR- or GdL labeled exosomes in tumor cells in vitro and in vivo over 24-48 h, does not provide strong evidence of special tumor specificity of MSC exosomes. The demonstration of tumor-specific “homing” remains open. Simple extravasation in the tumor bed due to leaky epithelium enables intravenously administered chemotherapeutics to enter (and leave) the tumor. That MSC exosomes accumulate within tumors over 24-48 h suggests that they are taken up by some cell within the tumor, however, the target specificity previously suggested has yet to be demonstrated conclusively [100].
Conclusions
We adapted an efficient protocol for exosomes from HUC-MSCs isolation by sequential ultracentrifugation, obtaining high-quality exosomes that exhibit the characteristic membrane markers CD9 and CD81, while retaining high isolation yields. The isolated exosomes were further labeled with GdL and DiR using the newly developed lipid insertion technique. These labeled exosomes exhibited tumor targeting properties in an in vivo osteosarcoma mouse model, with longer residence time and biological activity for trafficking when compared with PEGylated nanoparticles as demonstrated by time-dependent biodistribution.
Abbreviations
AO: acridine orange; BCA: bicinchoninic acid protein assay; CM: cell-conditioned medium; DAPI: 4',6-diamidino-2-phenylindole; DiR: diIC18(7) (1,1'-dioctadecyl-3,3,3',3'-tetramethylindotricarbocyanine iodide; DLS: dynamic light scattering; DOTA: 1,4,7,10-tetraazacyclododecane-1,4,7,10-tetraacetic acid; DPBS: dulbecco's phosphate-buffered saline; dpHPL: pooled human platelet lysate depleted of exosomes; DSPE: 1,2-distearoylphosphatidylethanolamine; Exo: exosome; FA: flip angle; FLASH: flash slow angle shot; Gd: gadolinium; GdL: gadolinium lipid; GNPs: gadolinium oxide nanoparticles; HUC-MSCs: human umbilical cord mesenchymal stromal cells; ICP-MS: inductively coupled plasma mass spectrometry; LDS: sample loading buffer; m-IgG BP-HRP: mouse IgG kappa binding protein conjugated to horseradish peroxidase; MRI: magnetic resonance imaging; MSCs: mesenchymal stromal cells; MTT: (3-(4,5-dimethylthiazol-2-yl)-2,5-diphenyltetrazolium bromide); NIR: near infrared; DMEM: dulbecco's modified eagle medium; NSF: nephrogenic systemic fibrosis; NTA: nanoparticle tracking analysis; PBS: phosphate-buffered salin; PDI: polydispersity index; PEGNP: pegylated nanoparticles; PI: propidium iodide; PVDF: polyvinylidene difluoride; RARE: acquisition with relaxation enhancement; RhB: rhodamine b; RIPA: radioimmunoprecipitation assay buffer; TE: echo time; TEM: transmission electron microscopy; TR: repetition time; VEGF: vascular endothelial growth factor; ZP: zeta potential.
Supplementary Material
Supplementary figures.
Acknowledgements
We thank the members of the Weiss and Aryal laboratories for their assistance and for productive conversations. We thank Adrienne Wright for providing characterized human umbilical cord mesenchymal stromal cells for this work. We thank Dr. Deryl Troyer for providing cancer cell lines used here. We thank Dr. Mark Haub of the Department of Food, Nutrition, Dietetics and Health for financial support. We thank the Midwest Institute for Comparative Stem Cell Biology, the Confocal Core facility supported by CVM-KSU and the Department of Anatomy and Physiology at Kansas State University for their support and resources. We thank the Johnson Cancer Research Center (JCRC) at Kansas State University for their support and resources. Publication of this article was funded in part by the Kansas State University Open Access Publishing Fund.
Competing Interests
The authors have declared that no competing interest exists.
References
1. Dominici M, Le Blanc K, Mueller I, Slaper-Cortenbach I, Marini F, Krause D. et al. Minimal criteria for defining multipotent mesenchymal stromal cells. The International Society for Cellular Therapy position statement. Cytotherapy. 2006;8:315-7
2. Rasmusson I, Ringden O, Sundberg B, Le Blanc K. Mesenchymal stem cells inhibit lymphocyte proliferation by mitogens and alloantigens by different mechanisms. Exp Cell Res. 2005;305:33-41
3. Wang M, Yang Y, Yang D, Luo F, Liang W, Guo S. et al. The immunomodulatory activity of human umbilical cord blood-derived mesenchymal stem cells in vitro. Immunology. 2009;126:220-32
4. Zhao X, Wu X, Qian M, Song Y, Wu D, Zhang W. Knockdown of TGF-beta1 expression in human umbilical cord mesenchymal stem cells reverts their exosome-mediated EMT promoting effect on lung cancer cells. Cancer Lett. 2018;428:34-44
5. Riordan NH, Morales I, Fernandez G, Allen N, Fearnot NE, Leckrone ME. et al. Clinical feasibility of umbilical cord tissue-derived mesenchymal stem cells in the treatment of multiple sclerosis. J Transl Med. 2018;16:57-69
6. Wang YL, Xue P, Xu CY, Wang Z, Liu XS, Hua LL. et al. SPK1-transfected UCMSC has better therapeutic activity than UCMSC in the treatment of experimental autoimmune encephalomyelitis model of Multiple sclerosis. Sci Rep-Uk. 2018;8:1756-67
7. Wang LM, Wang LH, Cong XL, Liu GY, Zhou JJ, Bai B. et al. Human Umbilical Cord Mesenchymal Stem Cell Therapy for Patients with Active Rheumatoid Arthritis: Safety and Efficacy. Stem Cells Dev. 2013;22:3192-202
8. Zhao C, Zhang L, Kong W, Liang J, Xu XY, Wu HY. et al. Umbilical Cord-Derived Mesenchymal Stem Cells Inhibit Cadherin-11 Expression by Fibroblast-Like Synoviocytes in Rheumatoid Arthritis. J Immunol Res. 2015;2015:137695-705
9. Herberts CA, Kwa MSG, Hermsen HPH. Risk factors in the development of stem cell therapy. J Transl Med. 2011;9:29-43
10. Cui LL, Kerkela E, Bakreen A, Nitzsche F, Andrzejewska A, Nowakowski A. et al. The cerebral embolism evoked by intra-arterial delivery of allogeneic bone marrow mesenchymal stem cells in rats is related to cell dose and infusion velocity. Stem Cell Res Ther. 2015;6:11-20
11. Ridge SM, Sullivan FJ, Glynn SA. Mesenchymal stem cells: key players in cancer progression. Mol Cancer. 2017;16:31-41
12. Ganta C, Chiyo D, Ayuzawa R, Rachakatla R, Pyle M, Andrews G. et al. Rat umbilical cord stem cells completely abolish rat mammary carcinomas with no evidence of metastasis or recurrence 100 days post-tumor cell inoculation. Cancer Res. 2009;69:1815-20
13. Rachakatla RS, Pyle MM, Ayuzawa R, Edwards SM, Marini FC, Weiss ML. et al. Combination treatment of human umbilical cord matrix stem cell-based interferon-beta gene therapy and 5-fluorouracil significantly reduces growth of metastatic human breast cancer in SCID mouse lungs. Cancer Invest. 2008;26:662-70
14. Rachakatla RS, Marini F, Weiss ML, Tamura M, Troyer D. Development of human umbilical cord matrix stem cell-based gene therapy for experimental lung tumors. Cancer Gene Ther. 2007;14:828-35
15. Lee RH, Pulin AA, Seo MJ, Kota DJ, Ylostalo J, Larson BL. et al. Intravenous hMSCs Improve Myocardial Infarction in Mice because Cells Embolized in Lung Are Activated to Secrete the Anti-inflammatory Protein TSG-6. Cell Stem Cell. 2009;5:54-63
16. Ge JF, Guo L, Wang S, Zhang YL, Cai T, Zhao RCH. et al. The Size of Mesenchymal Stem Cells is a Significant Cause of Vascular Obstructions and Stroke. Stem Cell Rev Rep. 2014;10:295-303
17. Assuncao-Silva RC, Mendes-Pinheiro B, Patricio P, Behie L, Teixeira FG, Pinto L. et al. Exploiting the impact of the secretome of MSCs isolated from different tissue sources on neuronal differentiation and axonal growth. Biochimie. 2018;155:83-91
18. Damania A, Jaiman D, Teotia AK, Kumar A. Mesenchymal stromal cell-derived exosome-rich fractionated secretome confers a hepatoprotective effect in liver injury. Stem Cell Res Ther. 2018;9:31-43
19. Sarkar P, Redondo J, Kemp K, Ginty M, Wilkins A, Scolding NJ. et al. Reduced neuroprotective potential of the mesenchymal stromal cell secretome with ex vivo expansion, age and progressive multiple sclerosis. Cytotherapy. 2018;20:21-8
20. Sevivas N, Teixeira FG, Portugal R, Direito-Santos B, Espregueira-Mendes J, Oliveira FJ. et al. Mesenchymal Stem Cell Secretome Improves Tendon Cell Viability In Vitro and Tendon-Bone Healing In Vivo When a Tissue Engineering Strategy Is Used in a Rat Model of Chronic Massive Rotator Cuff Tear. Am J Sport Med. 2018;46:449-59
21. Lai RC, Arslan F, Lee MM, Sze NSK, Choo A, Chen TS. et al. Exosome secreted by MSC reduces myocardial ischemia/reperfusion injury. Stem Cell Res. 2010;4:214-22
22. Willis GR, Fernandez-Gonzalez A, Anastas J, Vitali SH, Liu XL, Ericsson M. et al. Mesenchymal Stromal Cell Exosomes Ameliorate Experimental Bronchopulmonary Dysplasia and Restore Lung Function through Macrophage Immunomodulation. Am J Resp Crit Care. 2018;197:104-16
23. Oshima K, Aoki N, Kato T, Kitajima K, Matsuda T. Secretion of a peripheral membrane protein, MFG-E8, as a complex with membrane vesicles - A possible role in membrane secretion. Eur J Biochem. 2002;269:1209-18
24. Fedele C, Singh A, Zerlanko BJ, Iozzo RV, Languino LR. The alpha(v)beta(6) Integrin Is Transferred Intercellularly via Exosomes. J Biol Chem. 2015;290:4545-51
25. Cui X, He Z, Liang Z, Chen Z, Wang H, Zhang J. Exosomes From Adipose-derived Mesenchymal Stem Cells Protect the Myocardium Against Ischemia/Reperfusion Injury Through Wnt/beta-Catenin Signaling Pathway. J Cardiovasc Pharmacol. 2017;70:225-31
26. Shimoda A, Tahara Y, Sawada S, Sasaki Y, Akiyoshi K. Glycan profiling analysis using evanescent-field fluorescence-assisted lectin array: Importance of sugar recognition for cellular uptake of exosomes from mesenchymal stem cells. Biochem Bioph Res Co. 2017;491:701-7
27. McAtee CO, Booth C, Elowsky C, Zhao L, Payne J, Fangman T. et al. Prostate tumor cell exosomes containing hyaluronidase Hyal1 stimulate prostate stromal cell motility by engagement of FAK-mediated integrin signaling. Matrix Biol. 2018 xx: xxx-xxx, in press
28. Iraci N, Gaude E, Leonardi T, Costa ASH, Cossetti C, Peruzzotti-Jametti L. et al. Extracellular vesicles are independent metabolic units with asparaginase activity. Nat Chem Biol. 2017;13:951-55
29. Meng F, Li Z, Zhang Z, Yang Z, Kang Y, Zhao X. et al. MicroRNA-193b-3p regulates chondrogenesis and chondrocyte metabolism by targeting HDAC3. Theranostics. 2018;8:2862-83
30. Kim J, Kim TY, Lee MS, Mun JY, Ihm C, Kim SA. Exosome cargo reflects TGF-beta1-mediated epithelial-to-mesenchymal transition (EMT) status in A549 human lung adenocarcinoma cells. Biochem Biophys Res Commun. 2016;478:643-8
31. Sharma A. Transgenerational epigenetics: Integrating soma to germline communication with gametic inheritance. Mech Ageing Dev. 2017;163:15-22
32. Shah N, Ishii M, Brandon C, Ablonczy Z, Cai J, Liu Y. et al. Extracellular vesicle-mediated long-range communication in stressed retinal pigment epithelial cell monolayers. Biochim Biophys Acta. 2018;1864:2610-22
33. Smith VL, Cheng Y, Bryant BR, Schorey JS. Exosomes function in antigen presentation during an in vivo Mycobacterium tuberculosis infection. Sci Rep-Uk. 2017;7:43578-90
34. Zhang B, Yeo RWY, Lai RC, Sim EWK, Chin KC, Lim SK. Mesenchymal stromal cell exosome-enhanced regulatory T-cell production through an antigen-presenting cell-mediated pathway. Cytotherapy. 2018;20:687-96
35. Sung BH, Ketova T, Hoshino D, Zijlstra A, Weaver AM. Directional cell movement through tissues is controlled by exosome secretion. Nat Commun. 2015;6:7164-78
36. Huang BX, Lu J, Ding C, Zou Q, Wang W, Li H. Exosomes derived from human adipose mesenchymal stem cells improve ovary function of premature ovarian insufficiency by targeting SMAD. Stem Cell Res Ther. 2018;9:216-28
37. Yuan FL, Wu QY, Miao ZN, Xu MH, Xu RS, Jiang DL. et al. Osteoclast-Derived Extracellular Vesicles: Novel Regulators of Osteoclastogenesis and Osteoclast-Osteoblasts Communication in Bone Remodeling. Front Physiol. 2018;9:628-34
38. Qi J, Zhou Y, Jiao Z, Wang X, Zhao Y, Li Y. et al. Exosomes Derived from Human Bone Marrow Mesenchymal Stem Cells Promote Tumor Growth Through Hedgehog Signaling Pathway. Cell Physiol Biochem. 2017;42:2242-54
39. Mukherjee S. The Emperor of All Maladies: A Biography of Cancer. 1st Scribner hardcover ed. New York: Scribner. 2010
40. Stewart BW, Wild C, International Agency for Research on Cancer, World Health Organization. World Cancer Report 2014. Lyon, France Geneva, Switzerland: International Agency for Research on Cancer WHO Press. 2014
41. Pitchaimani A, Nguyen TDT, Wang HW, Bossmann SH, Aryal S. Design and characterization of gadolinium infused theranostic liposomes. Rsc Adv. 2016;6:36898-905
42. Pitchaimani A, Nguyen TDT, Aryal S. Natural killer cell membrane infused biomimetic liposomes for targeted tumor therapy. Biomaterials. 2018;160:124-37
43. Lopez-Chaves C, Soto-Alvaredo J, Montes-Bayon M, Bettmer J, Llopis J, Sanchez-Gonzalez C. Gold nanoparticles: Distribution, bioaccumulation and toxicity. In vitro and in vivo studies. Nanomed-Nanotechnol. 2018;14:1-12
44. Mishra V, Baranwal V, Mishra RK, Sharma S, Paul B, Pandey AC. Titanium dioxide nanoparticles augment allergic airway inflammation and Socs3 expression via NF-kappaB pathway in murine model of asthma. Biomaterials. 2016;92:90-102
45. Blanco E, Shen H, Ferrari M. Principles of nanoparticle design for overcoming biological barriers to drug delivery. Nat Biotechnol. 2015;33:941-51
46. Wilhelm S, Tavares AJ, Dai Q, Ohta S, Audet J, Dvorak HF. et al. Analysis of nanoparticle delivery to tumours. Nat Rev Mater. 2016;1:16014-30
47. Kamerkar S, LeBleu VS, Sugimoto H, Yang S, Ruivo CF, Melo SA. et al. Exosomes facilitate therapeutic targeting of oncogenic KRAS in pancreatic cancer. Nature. 2017;546:498-503
48. Hong Y, Nam GH, Koh E, Jeon S, Kim GB, Jeong C. et al. Exosome as a Vehicle for Delivery of Membrane Protein Therapeutics, PH20, for Enhanced Tumor Penetration and Antitumor Efficacy. Adv Funct Mater. 2018;28:1703074-83
49. Wiklander OP, Nordin JZ, O'Loughlin A, Gustafsson Y, Corso G, Mager I. et al. Extracellular vesicle in vivo biodistribution is determined by cell source, route of administration and targeting. J Extracell Vesicles. 2015;4:26316-29
50. Yuan ZQ, Kolluri KK, Gowers KHC, Janes SM. TRAIL delivery by MSC-derived extracellular vesicles is an effective anticancer therapy. Journal of Extracellular Vesicles. 2017;6:1265291-304
51. Hoshino A, Costa-Silva B, Shen TL, Rodrigues G, Hashimoto A, Mark MT. et al. Tumour exosome integrins determine organotropic metastasis. Nature. 2015;527:329-35
52. Mendt M, Kamerkar S, Sugimoto H, McAndrews KM, Wu CC, Gagea M. et al. Generation and testing of clinical-grade exosomes for pancreatic cancer. Jci Insight. 2018;3:99263-85
53. Smith JR, Pfeifer K, Petry F, Powell N, Delzeit J, Weiss ML. Standardizing Umbilical Cord Mesenchymal Stromal Cells for Translation to Clinical Use: Selection of GMP-Compliant Medium and a Simplified Isolation Method. Stem Cells Int. 2016;2016:4834616-28
54. Smith JR, Cromer A, Weiss ML. Human Umbilical Cord Mesenchymal Stromal Cell Isolation, Expansion, Cryopreservation, and Characterization. Curr Protoc Stem Cell Biol. 2017;41:1F. 18.1-1F.23
55. Momen-Heravi F. Isolation of Extracellular Vesicles by Ultracentrifugation. Methods Mol Biol. 2017;1660:25-32
56. Pachler K, Lener T, Streif D, Dunai ZA, Desgeorges A, Feichtner M. et al. A Good Manufacturing Practice-grade standard protocol for exclusively human mesenchymal stromal cell-derived extracellular vesicles. Cytotherapy. 2017;19:458-72
57. Aryal S, Key J, Stigliano C, Ananta JS, Zhong M, Decuzzi P. Engineered magnetic hybrid nanoparticles with enhanced relaxivity for tumor imaging. Biomaterials. 2013;34:7725-32
58. Aryal S, Stigliano C, Key J, Ramirez M, Anderson J, Karmonik C. et al. Paramagnetic Gd(3+) labeled red blood cells for magnetic resonance angiography. Biomaterials. 2016;98:163-70
59. Gercel-Taylor C, Atay S, Tullis RH, Kesimer M, Taylor DD. Nanoparticle analysis of circulating cell-derived vesicles in ovarian cancer patients. Anal Biochem. 2012;428:44-53
60. Chernyshev VS, Rachamadugu R, Tseng YH, Belnap DM, Jia YL, Branch KJ. et al. Size and shape characterization of hydrated and desiccated exosomes. Anal Bioanal Chem. 2015;407:3285-301
61. Pi FM, Binzel DW, Lee TJ, Li ZF, Sun MY, Rychahou P. et al. Nanoparticle orientation to control RNA loading and ligand display on extracellular vesicles for cancer regression. Nat Nanotechnol. 2018;13:82-9
62. Kim DK, Kang B, Kim OY, Choi DS, Lee J, Kim SR. et al. EVpedia: an integrated database of high-throughput data for systemic analyses of extracellular vesicles. J Extracell Vesicles. 2013;2:20384-91
63. Keerthikumar S, Chisanga D, Ariyaratne D, Saffar H, Anand S, Zhao KN. et al. ExoCarta: A Web-Based Compendium of Exosomal Cargo. J Mol Biol. 2016;428:688-92
64. Beam AS, Moore KG, Gillis SN, Ford KF, Gray T, Steinwinder AH. et al. GBCAs and Risk for Nephrogenic Systemic Fibrosis: A Literature Review. Radiol Technol. 2017;88:583-9
65. Knoepp F, Bettmer J, Fronius M. Gadolinium released by the linear gadolinium-based contrast-agent Gd-DTPA decreases the activity of human epithelial Na(+) channels (ENaCs). Biochim Biophys Acta. 2017;1859:1040-8
66. Mulder WJ, Strijkers GJ, van Tilborg GA, Griffioen AW, Nicolay K. Lipid-based nanoparticles for contrast-enhanced MRI and molecular imaging. NMR Biomed. 2006;19:142-64
67. Wu S, Ju GQ, Du T, Zhu YJ, Liu GH. Microvesicles Derived from Human Umbilical Cord Wharton's Jelly Mesenchymal Stem Cells Attenuate Bladder Tumor Cell Growth In Vitro and In Vivo. Plos One. 2013;8:e61366-78
68. Lee JK, Park SR, Jung BK, Jeon YK, Lee YS, Kim MK. et al. Exosomes Derived from Mesenchymal Stem Cells Suppress Angiogenesis by Down-Regulating VEGF Expression in Breast Cancer Cells. Plos One. 2013;8:e84256-67
69. Alarifi S, Ali H, Alkahtani S, Alessia MS. Regulation of apoptosis through bcl-2/bax proteins expression and DNA damage by nano-sized gadolinium oxide. Int J Nanomed. 2017;12:4541-51
70. Ormerod MG, Sun XM, Brown D, Snowden RT, Cohen GM. Quantification of apoptosis and necrosis by flow cytometry. Acta Oncol. 1993;32:417-24
71. Grange C, Tapparo M, Bruno S, Chatterjee D, Quesenberry PJ, Tetta C. et al. Biodistribution of mesenchymal stem cell-derived extracellular vesicles in a model of acute kidney injury monitored by optical imaging. Int J Mol Med. 2014;33:1055-63
72. Tokumitsu H, Hiratsuka J, Sakurai Y, Kobayashi T, Ichikawa H, Fukumori Y. Gadolinium neutron-capture therapy using novel gadopentetic acid-chitosan complex nanoparticles: in vivo growth suppression of experimental melanoma solid tumor. Cancer Lett. 2000;150:177-82
73. Laurent S, Burtea C, Elst LV, Muller RN. Synthesis and characterization of new low-molecular-weight lysine-conjugated Gd-DTPA contrast agents. Contrast Media Mol I. 2011;6:229-35
74. Ge P, Sheng F, Jin Y, Tong L, Du L, Zhang L. et al. Magnetic resonance imaging of osteosarcoma using a bis(alendronate)-based bone-targeted contrast agent. Biomed Pharmacother. 2016;84:423-9
75. Kobayashi H, Sato N, Kawamoto S, Saga T, Hiraga A, Ishimori T. et al. 3D MR angiography of intratumoral vasculature using a novel macromolecular MR contrast agent. Magn Reson Med. 2001;46:579-85
76. Wang L, Gu Z, Zhao X, Yang N, Wang F, Deng A. et al. Extracellular Vesicles Released from Human Umbilical Cord-Derived Mesenchymal Stromal Cells Prevent Life-Threatening Acute Graft-Versus-Host Disease in a Mouse Model of Allogeneic Hematopoietic Stem Cell Transplantation. Stem Cells Dev. 2016;25:1874-83
77. Golombek SK, May JN, Theek B, Appold L, Drude N, Kiessling F. et al. Tumor targeting via EPR: Strategies to enhance patient responses. Adv Drug Deliv Rev. 2018:130
78. Kim MS, Haney MJ, Zhao Y, Mahajan V, Deygen I, Klyachko NL. et al. Development of exosome-encapsulated paclitaxel to overcome MDR in cancer cells. Nanomed-Nanotechnol. 2016;12:655-64
79. Zhang HY, Wang Y, Bai M, Wang JY, Zhu KG, Liu R. et al. Exosomes serve as nanoparticles to suppress tumor growth and angiogenesis in gastric cancer by delivering hepatocyte growth factor siRNA. Cancer Sci. 2018;109:629-41
80. Brune JC, Tormin A, Johansson MC, Rissler P, Brosjo O, Lofvenberg R. et al. Mesenchymal stromal cells from primary osteosarcoma are non-malignant and strikingly similar to their bone marrow counterparts. Int J Cancer. 2011;129:319-30
81. Bonuccelli G, Avnet S, Grisendi G, Salerno M, Granchi D, Dominici M. et al. Role of mesenchymal stem cells in osteosarcoma and metabolic reprogramming of tumor cells. Oncotarget. 2014;5:7575-88
82. Cortini M, Massa A, Avnet S, Bonuccelli G, Baldini N. Tumor-Activated Mesenchymal Stromal Cells Promote Osteosarcoma Stemness and Migratory Potential via IL-6 Secretion. Plos One. 2016;11:e0166500-522
83. Fang S, Xu C, Zhang Y, Xue C, Yang C, Bi H. et al. Umbilical Cord-Derived Mesenchymal Stem Cell-Derived Exosomal MicroRNAs Suppress Myofibroblast Differentiation by Inhibiting the Transforming Growth Factor-beta/SMAD2 Pathway During Wound Healing. Stem Cells Transl Med. 2016;5:1425-39
84. Jiang W, Tan Y, Cai M, Zhao T, Mao F, Zhang X. et al. Human Umbilical Cord MSC-Derived Exosomes Suppress the Development of CCl4-Induced Liver Injury through Antioxidant Effect. Stem Cells Int. 2018;2018:6079642-53
85. Li T, Yan Y, Wang B, Qian H, Zhang X, Shen L. et al. Exosomes derived from human umbilical cord mesenchymal stem cells alleviate liver fibrosis. Stem Cells Dev. 2013;22:845-54
86. Li X, Liu L, Yang J, Yu Y, Chai J, Wang L. et al. Exosome Derived From Human Umbilical Cord Mesenchymal Stem Cell Mediates MiR-181c Attenuating Burn-induced Excessive Inflammation. EBioMedicine. 2016;8:72-82
87. Loy H, Kuok DIT, Hui KPY, Choi MHL, Yuen W, Nicholls JM. et al. Therapeutic implications of human umbilical cord mesenchymal stromal cells in attenuating influenza A/H5N1-associated acute lung injury. J Infect Dis. 2018;219:186-96
88. Sun L, Xu R, Sun X, Duan Y, Han Y, Zhao Y. et al. Safety evaluation of exosomes derived from human umbilical cord mesenchymal stromal cell. Cytotherapy. 2016;18:413-22
89. Xiong ZH, Wei J, Lu MQ, Jin MY, Geng HL. Protective effect of human umbilical cord mesenchymal stem cell exosomes on preserving the morphology and angiogenesis of placenta in rats with preeclampsia. Biomed Pharmacother. 2018;105:1240-7
90. Zou XY, Yu Y, Lin S, Zhong L, Sun J, Zhang G. et al. Comprehensive miRNA Analysis of Human Umbilical Cord-Derived Mesenchymal Stromal Cells and Extracellular Vesicles. Kidney Blood Press Res. 2018;43:152-61
91. Mutlu BR, Edd JF, Toner M. Oscillatory inertial focusing in infinite microchannels. Proc Natl Acad Sci U S A. 2018;115:7682-7
92. Oeyen E, Van Mol K, Baggerman G, Willems H, Boonen K, Rolfo C. et al. Ultrafiltration and size exclusion chromatography combined with asymmetrical-flow field-flow fractionation for the isolation and characterisation of extracellular vesicles from urine. J Extracell Vesicles. 2018;7:1490143-55
93. Gupta S, Rawat S, Arora V, Kottarath SK, Dinda AK, Vaishnav PK. et al. An improvised one-step sucrose cushion ultracentrifugation method for exosome isolation from culture supernatants of mesenchymal stem cells. Stem Cell Res Ther. 2018;9:180-91
94. Diaz G, Bridges C, Lucas M, Cheng Y, Schorey JS, Dobos KM. et al. Protein Digestion, Ultrafiltration, and Size Exclusion Chromatography to Optimize the Isolation of Exosomes from Human Blood Plasma and Serum. J Vis Exp. 2018 e57467
95. Konoshenko MY, Lekchnov EA, Vlassov AV, Laktionov PP. Isolation of Extracellular Vesicles: General Methodologies and Latest Trends. Biomed Res Int. 2018;2018:8545347-64
96. Altanerova U, Babincova M, Babinec P, Benejova K, Jakubechova J, Altanerova V. et al. Human mesenchymal stem cell-derived iron oxide exosomes allow targeted ablation of tumor cells via magnetic hyperthermia. Int J Nanomedicine. 2017;12:7923-36
97. Betzer O, Perets N, Angel A, Motiei M, Sadan T, Yadid G. et al. In Vivo Neuroimaging of Exosomes Using Gold Nanoparticles. ACS Nano. 2017;11:10883-93
98. Otero-Ortega L, Gomez de Frutos MC, Laso-Garcia F, Rodriguez-Frutos B, Medina-Gutierrez E, Lopez JA. et al. Exosomes promote restoration after an experimental animal model of intracerebral hemorrhage. J Cereb Blood Flow Metab. 2018;38:767-79
99. Rana S, Yue S, Stadel D, Zoller M. Toward tailored exosomes: the exosomal tetraspanin web contributes to target cell selection. Int J Biochem Cell Biol. 2012;44:1574-84
100. Rana S, Zoller M. Exosome target cell selection and the importance of exosomal tetraspanins: a hypothesis. Biochem Soc Trans. 2011;39:559-62
101. Lagerweij T, Perez-Lanzon M, Baglio SR. A Preclinical Mouse Model of Osteosarcoma to Define the Extracellular Vesicle-mediated Communication Between Tumor and Mesenchymal Stem Cells. J Vis Exp. 2018 e56932
102. Dutour A, Josserand V, Jury D, Guillermet S, Decouvelaere AV, Chotel F. et al. Targeted imaging of alpha(v)beta(3) expressing sarcoma tumor cells in vivo in pre-operative setting using near infrared: a potential tool to reduce incomplete surgical resection. Bone. 2014;62:71-8
103. Jaroensong T, Endo Y, Lee SJ, Kamida A, Mochizuki M, Nishimura R. et al. Effects of transplantation sites on tumour growth, pulmonary metastasis and ezrin expression of canine osteosarcoma cell lines in nude mice. Vet Comp Oncol. 2012;10:274-82
104. Dass CR, Ek ET, Choong PF. Human xenograft osteosarcoma models with spontaneous metastasis in mice: clinical relevance and applicability for drug testing. J Cancer Res Clin Oncol. 2007;133:193-8
105. Luu HH, Kang Q, Park JK, Si W, Luo Q, Jiang W. et al. An orthotopic model of human osteosarcoma growth and spontaneous pulmonary metastasis. Clin Exp Metastasis. 2005;22:319-29
Author contact
![]() Corresponding authors: M.L. Weiss, Ph. D., Email: weissk-state.edu. S. Aryal, Ph. D., Email: saryaledu
Corresponding authors: M.L. Weiss, Ph. D., Email: weissk-state.edu. S. Aryal, Ph. D., Email: saryaledu