Impact Factor
- Issue 14; 2026
- Issue 13; 2026
- Issue 12; 2026
- Issue 11; 2026
- Issue 10; 2026
- Volume 16; 2026
- Advance Articles
- Past Issues
- Cover Images
- Cover Suggestion
- Index & Coverage
- Special Issues
Introduction
Methods
Results
Discussion
Abbreviations
Supplementary Material
Acknowledgements
References
International Journal of Biological Sciences
International Journal of Medical Sciences
 Global reach, higher impact

Theranostics 2019; 9(7):2056-2070. doi:10.7150/thno.28119 This issue Cite
Research Paper
Non-invasive diagnosis of early-stage lung cancer using high-throughput targeted DNA methylation sequencing of circulating tumor DNA (ctDNA)
Wenhua Liang1*, Yue Zhao2*, Weizhe Huang1*, Yangbin Gao2, Weihong Xu2, Jinsheng Tao2, Meng Yang2, Lequn Li3, Wei Ping 3, Hui Shen4, Xiangning Fu3, Zhiwei Chen2, Peter W. Laird4, Xuyu Cai2 ![]() , Jian-Bing Fan5,2
, Jian-Bing Fan5,2 ![]() , Jianxing He1
, Jianxing He1 ![]()
1. First Affiliated Hospital of Guangzhou Department of Thoracic Surgery/Oncology, the First Affiliated Hospital of Guangzhou Medical University; Guangzhou Institute of Respiratory Disease & Health; China State Key Laboratory and National Clinical Research Center for Respiratory Disease, Guangzhou, China;
2. AnchorDx Medical Co., Ltd., Guangzhou, China;
3. Tongji Hospital, Tongji Medical College Huazhong University of Science & Technology, Wuhan, China;
4. Van Andel Research Institute (VARI), Grand Rapids, MI, USA;
5. Department of Pathology, School of Basic Medical Science, Southern Medical University, Guangzhou, China.
*These authors contributed equally to the paper.
Received 2018-6-26; Accepted 2019-2-16; Published 2019-4-6
Abstract

Rational: LDCT screening can identify early-stage lung cancers yet introduces excessive false positives and it remains a great challenge to differentiate malignant tumors from benign solitary pulmonary nodules, which calls for better non-invasive diagnostic tools.
Methods: We performed DNA methylation profiling by high throughput DNA bisulfite sequencing in tissue samples (nodule size < 3 cm in diameter) to learn methylation patterns that differentiate cancerous tumors from benign lesions. Then we filtered out methylation patterns exhibiting high background in circulating tumor DNA (ctDNA) and built an assay for plasma sample classification.
Results: We first performed methylation profiling of 230 tissue samples to learn cancer-specific methylation patterns which achieved a sensitivity of 92.7% (88.3% - 97.1%) and a specificity of 92.8% (89.3% - 96.3%). These tissue-derived DNA methylation markers were further filtered using a training set of 66 plasma samples and 9 markers were selected to build a diagnostic prediction model. From an independent validation set of additional 66 plasma samples, this model obtained a sensitivity of 79.5% (63.5% - 90.7%) and a specificity of 85.2% (66.3% - 95.8%) for differentiating patients with malignant tumor (n = 39) from patients with benign lesions (n = 27). Additionally, when tested on gender and age matched asymptomatic normal individuals (n = 118), our model achieved a specificity of 93.2% (89.0% - 98.3%). Specifically, our assay is highly sensitive towards early‐stage lung cancer, with a sensitivity of 75.0% (55.0%-90.0%) in 20 stage Ia lung cancer patients and 85.7% (57.1%-100.0%) in 7 stage Ib lung cancer patients.
Conclusions: We have developed a novel sensitive blood based non‐invasive diagnostic assay for detecting early stage lung cancer as well as differentiating lung cancers from benign pulmonary nodules.
Keywords: Early-stage lung cancer, circulating tumor DNA, high-throughput targeted DNA methylation sequencing
Introduction
Lung cancer, now ranking as the leading cause of death among malignant tumors, is a severe global public health problem [1]. Although the combined use of surgery, chemotherapy, radiotherapy, and targeted therapy has significantly improved the survival of patients with lung cancer, the prognosis remains poor. One important reason is the difficulty of detection of early-stage lung cancer, and most patients have already developed into advanced stage upon diagnosis. Low-dose CT (LDCT) screening is currently the most effective approach for early diagnosis of lung cancer. The US National Lung Cancer Screening Test (NLST) reported a sensitivity of 93.7% for LDCT screening for high-risk people (55-75 years old, smoking over 30 pack-years) [2]. Compared with chest radiography, LDCT reduced lung cancer mortality by 20%. Among lung cancers detected by LDCT screening, 63% are stage I, which usually present as solitary pulmonary nodules (SPNs).
However, due to the high sensitivity of LDCT screening, a lot of non-tumorous SPNs are also detected. These people are usually subjected to long-term follow-up by repeated CT examination, and even some invasive procedures such as aspiration biopsy or surgery to confirm their pathological results. In NLST study, the false positive rate in the LDCT screening group is as high as 96.4% [3], which is likely to cause excessive medical care and unnecessary psychological burden for those who undertook the screening. Incorporating image features can help rule out some benign SPNs; however, there are still 30-50% of patients who undergo surgeries but turn out to have benign nodules. For the past decades, investigators have tried to combine LDCT with PET-CT, tumor biomarkers, circulating tumor cells (CTC), or some tests to reduce the false positive rate [4-6]. However, none of such techniques succeeded in balancing sensitivity and specificity.
DNA methylation is one of the best studied epigenetic modifications that adds a methyl group to the carbon-5 position of a cytosine, which predominantly happens in CpG dinucleotides. This is a tightly regulated dynamic process in normal physiological conditions, balanced by DNA methyltransferases and DNA demethylases, which plays a critical role in the maintenance of heterochromatin structure and regulation of gene expression during development [7]. A large number of studies have shown that abnormal DNA methylation contributes to tumorigenesis, mainly through global hypomethylation, focal hypermethylation at multiple genomic regions (mostly CpG islands), and direct mutagenesis at methylated cytosines [8-12]. Moreover, it has been found that, during the development of lung adenocarcinoma, DNA methylation alterations occur even before the formation of atypical adenomatoid hyperplasia (AAH) [13]. All this emerging evidence suggests that DNA methylation can serve as a biomarker for early detection of lung cancers.
Circulating tumor DNA (ctDNA), shed by apoptotic or necrotic tumor cells, has gained more attention as liquid biopsy by examining cell free DNA (cfDNA) isolated from the bloodstream for tumor early detection and tumor genome assessment. Compared to traditional tissue biopsy, the use of cfDNA is non-invasive causing no complications usually associated with surgeries, limits sampling bias or information missing due to tumor heterogeneity, can be applied to patients who are not physically eligible for tissue biopsy, and allows multiple sampling for longitudinal monitoring. However, the portion of ctDNA within cfDNA is usually very limited, and can sometimes be lower than 0.01%, which calls for a highly sensitive approach for ctDNA detection [14-16].
In this study, we reported an ultra-sensitive high-throughput targeted DNA methylation sequencing method for ctDNA identification. We learned DNA methylation features from tissues by comparing lung malignant tumors to benign pulmonary lesions, and finally established a diagnostic model for distinguishing malignant from benign nodules. We further applied this model to identify tumor-specific ctDNA from plasma of patients with pulmonary nodules, and demonstrated satisfactory sensitivity and specificity towards early-stage lung cancer. This approach holds great promise for a revolutionary screening or diagnostic test to non-invasively identify lung cancer at its early and curable stage, in complement with LDCT screening.
Methods
Patients and sample collection
This is a study including cancer-free individuals and formalin-fixed paraffin embedded (FFPE) tissue samples and plasma samples from patients screened positive for pulmonary nodules (PNs, < 3 cm in diameter) by CT/LDCT scan and subsequently underwent surgical resections. Since the study is aimed for non-invasive diagnosis of early-stage lung cancer, enrolled patients were required to be free of previous cancer history and diagnosed with only 1 or 2 PNs. Both genders were included and smoking history was recorded. Pathological information of all samples was determined based on surgically resected tissue sections according to 2015 WHO Histological Classification of Lung Cancer. The collection of all samples was approved by Ethical Committees at each site, and all participants provided written informed consent.
309 malignant and benign lung tissue samples (nodule size < 3 cm in diameter) were collected in FFPE format; 320 plasma samples from patients with nodules less than 3 cm in diameter or healthy controls were collected. 79 samples were excluded due to insufficient extracted DNA amount, low library yield, or poor sequencing quality. In total, 288 malignant and benign lung tissue samples and 250 plasma samples were enrolled in the current study, including 132 samples from individuals diagnosed with positive PNs and 118 samples from asymptomatic normal individuals (Figure S4 and Table S4). Enrolled samples include 33 paired tissue-plasma samples that were used to evaluate methylation concordance between tissue and plasma within the same individual. 8 mL of blood was drawn 1-3 days prior to surgery and stored in Cell-Free DNA BCT® blood collection tubes (Streck, Inc. Cat# 218962) at room temperature. Plasma was separated from blood (no apparent hemolysis) within 48 h after blood draw, and stored at -80 °C until DNA isolation. For asymptomatic normal participants, 8 mL of blood was drawn using BD Vacutainer® EDTA Tubes (Becton, Dickinson and Company, Cat# 367525) and plasma was immediately separated within 2 h after blood draw and stored at -80 °C.
The isolation of tissue genomic DNA and plasma cell-free DNA (cfDNA)
Tissue genomic DNA (gDNA) was isolated from FFPE tissue samples using the Qiagen QIAamp DNA FFPE Tissue Kit (Qiagen, Cat# 56404) according to the manufacture's protocol. gDNA was fragmented to 200 bp using the M220 Focused-ultrasonicator™ (Covaris, Inc.) following the manufacturer's protocol and 100 ng of fragmented DNA was used for library construction.
For plasma collected using Streck BCT, cfDNA was isolated using the Qiagen QIAamp Circulating Nucleic Acid Kit (Qiagen, Cat# 55114) according to the manufacturer's protocol, while cfDNA was isolated using the Bioo NextPrep-Mag™ cfDNA Isolation Kit (Bioo Scientific, Cat# NOVA-3825-01/3) for plasma collected using EDTA-K2 tubes. Repeated freezing and thawing of plasma was avoided to prevent cfDNA degradation and gDNA contamination from white blood cells (WBC). The concentration of cfDNA was measured using the Qubit™ dsDNA HS Assay Kit (Thermo Fisher Scientific, Cat# Q32854) and quality was examined using the Agilent High Sensitivity DNA Kit (Cat# 5067-4626). cfDNA with yield greater than 3 ng without overly genomic DNA contamination was proceeded to library construction.
Bisulfite conversion and the AnchorIRISTM targeted methylation sequencing
Bisulfite conversion
Bisulfite conversion was performed using the Zymo Lightning Conversion Reagent (Cat# D5031, Zymo Research) according to the manufacturer's protocol. Briefly, 130 μL of Lightning Conversion Reagent was added to 20 μL DNA sample, which was incubated in a thermocycler with the following program: 98 °C for 8 min, 54 °C for 60 min, and 4 °C for up to 20 h. Then bisulfite-converted DNA was mixed with M-Binding buffer, run through a Zymo-SpinTM IC Column, desulphonated, washed, and eluted in 17 μL M-Elution buffer.
AnchorIRISTM pre-library construction
AnchorIRISTM pre-library construction was performed using AnchorDx EpiVisioTM Methylation Library Prep Kit (AnchorDx, Cat# A0UX00019) and AnchorDx EpiVisioTM Indexing PCR Kit (AnchorDx, Cat# A2DX00025). End repair of bisulfite-converted DNA was performed using the MEE1 enzyme at 37 °C for 30 min. DNA was then denatured at 95 °C for 5 min and snap cooled on ice. 3' end adaptor was ligated using the MLE1 and MLE5 enzymes at 37 °C for 30 min. First amplification was immediately performed to generate reverse complemented DNA molecules using the MAE3 enzyme with the following PCR program: 1 cycle of 95 °C for 3min, 4 cycles of 95 °C for 30 s + 60 °C for 30 s + 68 °C for 1 min, and 1 cycle of 68 °C for 5 min. Amplified DNA was purified using the AMB1 Magnetic Beads and eluted in a 20 μL volume. 3' end adaptor ligation of reverse complemented DNAs was next performed using the MSE1 and MSE5 enzymes at 37 °C for 30 min. Indexing PCR (i5 and i7) was immediately performed using the MIB1 PCR master mix with the following PCR program: 1 cycle of 98 °C for 45 s, 14 cycles of 98 °C for 15 s + 60 °C for 30 s + 72 °C for 30 s, and 1 cycle of 72 °C for 5 min. The amplified pre-libraries were subsequently purified using the IPB1 Magnetic Beads and the concentration was determined using the Qubit™ dsDNA HS Assay Kit. Pre-libraries containing more than 400 ng DNA were considered qualified for target enrichment.
AnchorIRISTM target enrichment
Target Enrichment was performed using AnchorDx EpiVisioTM Target Enrichment Kit (AnchorDx, Cat# A0UX00031). A total of 1,000 ng DNA containing up to 4 pre-libraries was pooled for target enrichment using our custom made 10K methylation panel, which includes 9921 pre-selected regions enriched for cancer-specific methylation. Briefly, HE, HBA and HBB blocking reagents were added to the 1,000 ng pooled pre-libraries and completely dried using a heated vacuum, which was subsequently reconstituted in 7.5 μL MHB1 hybridization buffer plus 3 µL MHE1 hybridization enhancer. Reconstituted pre-library pools were next denatured at 95 °C for 10 min and immediately transferred to a 47 °C hybridization oven. Then probes were added to each pre-library pool, which was quickly transferred to a thermocycler for hybridization incubation following the manufacturer's protocol.
After hybridization, DNA pre-libraries bound with biotinylated probes were pulled down using the Dynabeads M270 streptavidin beads (Thermo Fisher Scientific, Cat# 65306). Briefly, 30 μL streptavidin beads were used for each pre-library pool, washed twice with 1X Binding Wash Buffer, and re-suspended in 60 μL Binding Wash Buffer. Pre-library pools were added and mixed well with beads by repeated pipetting, and the mixture was incubated on a rotator at 47 °C for 45 min. After beads binding, 100 μL pre-warmed 1X Transfer Buffer was added to the mixture. The supernatant was quickly removed as soon as it turned clear and beads were washed twice using pre-warmed 1X Stringent Wash Buffer. Next, beads were re-suspended with 200 μL room temperature 1X Wash Buffer I and mixed thoroughly. Supernatant was then removed and beads were subsequently washed with 1X Wash Buffer II and 1X Wash Buffer III following the same steps, and finally eluted in 23 μL H2O.
These enriched libraries were further amplified with P5 and P7 primers using the KAPA HiFi HotStart Ready Mix (KAPA Biosystems, Cat# KK2602) with the following PCR program: 1 cycle of 98 °C for 45 s, 12 cycles of 98 °C for 15 s + 60 °C for 30 s + 72 °C for 30 s, and 1 cycle of 72 °C for 1 min. PCR product was then purified with Agencourt AMPure XP Magnetic Beads (Beckman Coulter, Cat# A63882) and eluted in 40 μL EB buffer. The concentration of this final library was determined using Qubit dsDNA HS Assay.
Evaluation of Library Preparation on methylation detection
Bake-off experiments with comparison to the SWIFT® Accel-NGS Methyl-SeqTM Assay
Analytical performance of the AnchorIRISTM assay was tested by using a series of cfDNA input ranging from 1 ng to 10 ng. cfDNA was isolated from the plasma collected from 3 patients with ovarian cancer. DNA concentration was measured using Qubit HS DNA Assay and then cfDNA was pooled. The concentration of the pooled cfDNA was calculated based on the total DNA amount and total volume. Next, bisulfite conversion was performed according to the manufacturer's protocol and DNA was eluted at the final concentration of 0.667 ng/μL.
Bisulfite-converted cfDNA was then aliquoted for different input titrations in duplicate, including 10 ng, 5 ng, 3 ng, and 1 ng. By doing this, assay variation between samples introduced at the step of bisulfite conversion was avoided.
IRIS libraries were constructed according to the methods described above, while SWIFT libraries were constructed according to the manufacturer's protocol (Cat# DL-ILMMS-12/48). Briefly, bisulfite converted DNA was denatured at 95 °C for 2 min and snap cooled on ice. 3' end adaptor-1 ligation was immediately performed using the Adaptase Reaction Mix with the incubation program: 37 °C for 1 min, 62 °C for 2 min, and 65 °C for 5 min. Next, reverse complemented sequence of each ssDNA was synthesized using the Extension Reaction with the enzyme Y2 with the incubation program: 98 °C for 1 min, 62 °C for 2 min, and 65 °C for 5 min, resulting in dsDNA molecules. Next, dsDNA was purified using the SPRIselect beads and eluted in 15 μL low EDTA TE. The ligation of adaptor-2 was performed using the Enzyme B3 at 25 °C for 15 min. Ligation products were purified with SPRIselect beads and carried to subsequent Indexing PCR for amplification with the PCR program: 1 cycle of 98 °C for 30 s and repeated cycles of 98 °C for 10 s + 60 °C for 30 s + 68 °C for 1 min. PCR cycle numbers were adjusted according to input DNA amount for both IRIS and SWIFT assays. PCR products were bead purified, eluted in 40 μL EB buffer, and quantified using Qubit.
Target enrichment was performed using the same 10K panel for both assays according to the methods described above.
Sensitivity assessment and detection limit of the AnchorIRISTM targeted methylation sequencing
To assess assay sensitivity and detection limit of the IRIS assay, different amounts of lung cancer tumor tissue gDNA were spiked into WBC gDNA to create serial dilutions of tumor fraction, including 1:10, 1:30, 1:100, 1:300, and 1:1,000. Undiluted and WBC samples were also included. A total amount of 900 ng gDNA per 50 μL volume for each dilution was sheared to 200 bp, successful shearing was confirmed by running 1% agarose gel. Concentrations of sheared DNA were measured using Qubit and bisulfite conversion was performed using 250 ng DNA. Next, 100 ng of bisulfite-converted DNA was aliquoted from each dilution in duplicate for library construction and target enrichment according to the methods described above.
Targeted methylation sequencing data analysis pipeline development
Read mapping
Sequencing adapters and 3'-low quality bases were trimmed from raw sequencing reads using Trim Galore version 0.4.1 (https://github.com/FelixKrueger/TrimGalore), and then aligned to C->T converted hg19 genome, as well as G->A converted hg19 genome using Bismark version 0.15.0 (Bowtie2 is the default aligner behind Bismark) [17]. Reads having at least 3 methylated CpGs within a sliding window of 3-5 CpGs were designated as co-methylated reads and used for subsequent analysis of methylation patterns and predictive modeling of malignant/benign states of patient samples.
Assay performance evaluation
Aligned reads were evaluated by Picard version 2.5.0 for metrics that measures the performance of target-capture based bisulfide sequencing assays (http://broadinstitute.github.io/picard). Specifically, the library conversion efficiency is calculated as the ratio of estimated molecule number incorporated in a library divided by the theoretical molecule number equivalent to the input DNA amount. The estimated molecule number is derived from sequencing depth (pre-deduplication mean bait coverage) and observed sequencing diversity (observed molecule number, post-deduplication mean bait coverage) based on the Poisson distribution. Detailed method is provided in Figure S5.
Differential methylation signature identification
Differential methylation (DM) analysis was performed on the training cohort of lung cancer patients using R package DSS version 2.14.0 [18]. Differentially methylated CpGs were identified comparing invasive adenocarcinoma (IA) to benign samples (p < 0.2, delta > 0.01), and further assembled into differentially methylated regions (DMRs). Targeted regions of our capture panel covered by DMRs (requires > 50% bases of a target region to be covered) were selected as candidate features for building classification models of malignant/benign state. The differential signal was visually confirmed by heatmap using Gitools version 2.3.0 [19].
Predictive modeling of malignant/benign state
To validate the collective prediction power of candidate features, we built a random forest model for tissue samples in the training cohort of lung cancer patients. We repeated 2-fold cross-validation 10 times and selected top 1,000 markers by their importance scores in the random forest model. We evaluated the performance of this model on an independent test set using receiving operation curve (ROC) method. For a chosen threshold, the sensitivity and specificity were calculated as follows,


After confirming the collective prediction power in tissue samples, we further examined the signal distribution of these candidate markers in plasma samples, and identified a total of 71 markers that preferentially discriminated malignant samples from benign samples in the training set. Next, we applied the Least Absolute Shringkage and Selection Operator (Lasso) [20] method to select top 9 markers that appeared most frequently among 500 subsampling of the original dataset at 75% sampling rate without replacement. The Lasso model was determined according to the expected generalization error estimated from 10-fold cross-validation. Finally, we trained a logistic regression model with these 9 markers to discriminate the same malignant samples from benign samples in the training set. The performance of this classification model was evaluated in an independent test set using the ROC method.
We evaluated the performance of the most extensively used prediction model for malignancy in our pulmonary nodule positive plasma samples. The Mayo Clinic model for malignancy in pulmonary nodules expresses the malignancy probability as a function of 3 clinical and 3 radiographic variables:
(1) Probability of malignancy = ex/(1+ex)
(2) x = -6.8272 + (0.0391 × age) + (0.7917 × smoking) + (1.3388 × cancer) + (0.1274 × Nodule diameter) + (1.0407 × spiculation) + (0.7838 × upper lobe)
Before applying Mayo model to pulmonary nodule samples, we eliminated those samples with one or more model-building variables not available.
Limit of detection based on serial dilution experiment
Two replicates of serial dilutions were created by mixing lung cancer tissue gDNA and WBC gDNA according to dilutions of 1:10, 1:30, 1:100, 1:300, 1:1000, and 1:3,000. To achieve optimum quantitation, a set of 887 informative co-methylated CpG regions were selected from our 10K methylation panel, meeting the following criteria, (1) the percentage of co-methylated reads (co-methylated reads / all mapped reads with at least 3 CpGs) is required to be greater than 7.5% from the undiluted tumor gDNA sample; (2) the percentage of co-methylated reads at dilution 1:100 is required to be greater than the percentage of co-methylation at background using WBC gDNA; (3) the ranking of the percentage of co-methylation for undiluted, 1:10, 1:30, and 1:100 dilution samples fully agrees with the titration order in at least one dilution replicate. For a given dilution, whether significantly more regions with informative co-methylation signals can be detected above background is determined by Z-test to assign a p-value. p-value < 0.05 is considered statistically significant.
Results
The AnchorIRISTM assay and performance assessment
The AnchorIRISTM (IRIS) assay employs a technology that directly ligates adaptors to the 3' end of single stranded DNA molecules after bisulfite conversion (Figure 1A). This significantly reduces DNA loss due to bisulfite conversion of constructed libraries. Another improvement included in the IRIS assay is the linear amplification after the first adaptor ligation. This increases the availability of molecules for the second adaptor ligation rendering a much higher chance for the original molecule to be incorporated into a sequencing library. These two improvements are particularly important for ctDNA recovery for subsequent sequencing considering the limited amount of ctDNA. ctDNA usually comprises 0.1% ~ 50% of total cfDNA, which can be even down to 0.01% or lower at early stages of tumorigenesis [14-16, 21]. In the end, we introduced a final target enrichment step, and thus sequencing cost can be significantly reduced by pre-selecting a set of targets of interest.
The AnchorIRISTM assay and performance assessment. (A) Workflow of the ultra-sensitive AnchorIRISTM library preparation method. (B-C) A bake-off experiment comparing assay performance between the AnchorIRISTM assay and the SWIFT® accel-NGS Methyl-seqTM assay. The IRIS assay presents superior molecule conversion efficiency (C) with much higher average unique coverage for each input amount tested (B). (D and E) The sensitivity of the AnchorIRISTM assay was evaluated by diluting tumor gDNA into WBC gDNA, showing that significantly more informative co-methylated CpG regions above WBC background can be detected at dilutions ≥ 0.033% by Z-test (D). Dilutions higher than 10% (gray box) preserve a linear response of average co-methylation signal to the tumor fractions of input DNA (E).
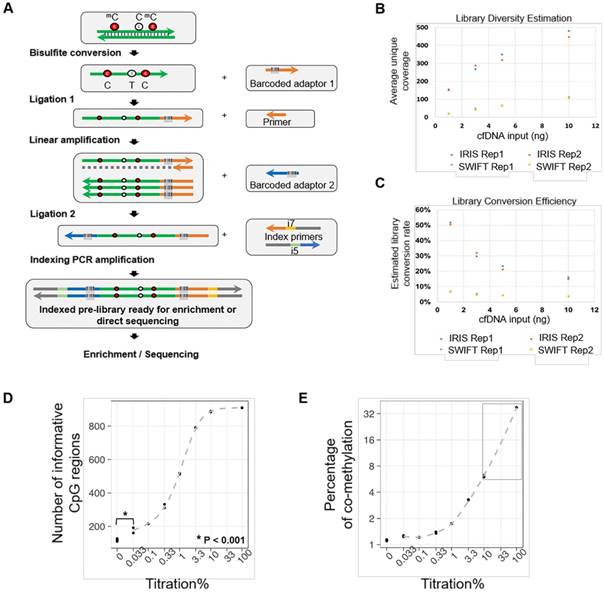
Given the limited amount of ctDNA recovered from one typical blood draw, the detection limit and data quality of the IRIS assay highly rely on multiple factors, including bisulfite conversion efficiency, conversion efficiency of cfDNA molecules into sequencing libraries, sequencing coverage, and sequencing uniformity. To address these fundamental challenges, we first performed a bake-off study comparing our IRIS assay to a commercially available DNA methylation library construction kit SWIFT® Accel-NGS Methyl-SeqTM (SWIFT) using variable amounts of input cfDNA (1 ng to 10 ng), representing the typical range of cfDNA yield that we could isolate from a typical blood draw. We sequenced all tested libraries to achieve similar amounts of uniquely mapped total reads (> 10 million) with about 65% ~ 70% mapping rate. Overall performance improves with higher cfDNA input for both techniques as shown by proportionally increased post-deduplication mean bait coverages (Figure 1B). However, at each cfDNA input level, our IRIS libraries produced 4-8 times higher post-deduplication mean target coverage than SWIFT libraries, with uniformity (percentage of target bases with greater than 0.2X mean target coverage) at all conditions greater than 90% (Table S1). Even the libraries with 1 ng cfDNA input using the IRIS assay displayed greater performance metrics than the libraries constructed with 10 ng input cfDNA using the SWIFT assay.
We next estimated library conversion efficiencies as described in the Methods section, and compared them between IRIS and SWIFT (Figure 1C, Table 1 and Table S1). The IRIS assay conferred at least 20% conversion rate with at least 5-fold greater efficiency than SWIFT. We also observed an unexpected high library conversion efficiency with 1 ng cfDNA input, which was likely due to the higher efficiency of library construction with much abundant enzymes and reagents at each step relative to the limited starting material.
Comparison of molecule conversion efficiency between the AnchorIRISTM assay and the SWIFT®accel-NGS Methyl-seqTM assay.
| Input DNA | AnchorDx IRIS | SWIFT-Accel-NGS Methyl-Seq | |||||
|---|---|---|---|---|---|---|---|
| Input DNA | Input molecule number | Observed molecule number | Estimated molecule number in library | Estimated library conversion rate | Observed molecule number | Estimated molecule number in library | Estimated library conversion rate |
| 1 ng | 300 | 153 | 156 | 52% | 21 | 21 | 7% |
| 3 ng | 900 | 278 | 314 | 35% | 44 | 44 | 5% |
| 5 ng | 1500 | 334 | 420 | 28% | 64 | 64 | 4% |
| 10 ng | 3000 | 464 | 636 | 21% | 110 | 110 | 4% |
To assess assay sensitivity and limit of detection (LoD) of the IRIS assay, a serial dilution experiment was performed with different amounts of sheared lung cancer tumor genomic DNA (gDNA) spiked into sheared WBC gDNA to create serial dilutions of tumor fractions. All dilution samples displayed very similar library construction and sequencing performance (Table S2). The overall sequencing performance of tissue gDNA is generally better than cfDNA with higher diversity and uniformity at the same sequencing depth due to the substantially higher DNA input amount (Table S1 and S2). Technical replicates of each dilution were highly correlated across all target regions (Figure S1). All these suggest that the IRIS assay is highly stable and reproducible.
DNA methylation is more biologically meaningful when multiple neighboring CpGs are co-methylated; therefore, we only considered co-methylated reads defined as reads having at least 3 methylated CpGs within a sliding window containing 3 to 5 CpGs. In order to assess assay sensitivity, we first selected informative CpG regions based on the following criteria: (1) the percentage of co-methylated reads (co-methylated reads / all mapped reads with at least 3 CpGs) is required to be greater than 7.5% from the undiluted tumor gDNA sample; (2) the percentage of co-methylated reads at dilution 1% is required to be greater than the percentage of co-methylation at background using WBC gDNA; (3) at least one replicate of dilutions from 1% to 100% conform to an increasing trend. By doing this, we selected 887 informative CpG regions for subsequent calculations.
DNA methylation alteration has been shown as an early event during tumorigenesis, and multiple genomic regions are affected simultaneously [13, 22, 23]. While whether it plays a causal role still needs to be determined, it renders a great advantage for DNA methylation being used as biomarkers for cancer early detection, by which much more genomic markers can be acquired in parallel from a tiny amount of starting material, especially in the case of ctDNA. Due to this special feature of DNA methylation, two factors need to be considered for evaluating the LoD: (1) whether a set of regions with informative co-methylation signals can be detected above background at a given dilution; (2) define a linear quantitative range for input dilutions. As shown in Figure 1D and 1E, at higher dilutions (> 10%) when tumor DNA was still adequate, almost all pre-selected informative CpG regions could be detected (Figure 1D), and only at this range, the percentage of co-methylation presents a linear relationship according to dilution factors (gray box, Figure 1E). This is because the percentage of co-methylation varies among different genomic regions, and the average percentage is subjected to change when the detected region set becomes smaller as tumor DNA is more diluted. Moreover, we could still detect a number of informative CpG regions even at the dilution of 0.033%, which was significantly greater than the number of regions detected at background using WBC gDNA. Considering that the cancer cell content of the starting material was estimated to be approximately 30% of the perspective FFPE tissue block, our assay can achieve a detection limit of 0.0033%.
Characterization of hypermethylation signatures specific to lung cancer
To characterize methylation signatures specific to early-stage lung cancer, we enrolled 230 FFPE tissue samples for training comprising 129 malignant tumor samples of invasive adenocarcinoma (IA), minimally invasive adenocarcinoma (MIA), adenocarcinoma in situ (AIS), squamous cell (SC), large cell (LC), small cell (SCLC), and other rare case lung cancers, and 101 benign lesion samples of hamartoma (HAM), tuberculosis (TB), inflammatory granuloma (GRAN), fungal infection (FUN), inflammation (INF), sclerosing hemangioma (SH), and other rare cases (Table 2). Considering that adenocarcinoma is the major subtype of lung cancer in this cohort, among which IA is considered a later stage during cancer development beginning from AIS and MIA and should have accumulated more methylation markers, we started with the identification of hypermethylated CpG sites by comparing 33 IA samples to 78 benign samples (Figure S2) [24]. By doing so, differentially methylated CpG loci (DML) were first identified, and neighboring associated CpG loci were further grouped into differentially methylated regions (DMR). 3886 DMRs were selected by this approach. While these regions were hypermethylated in almost all IA samples, this pattern of hypermethylation was only detected in half MIA samples and the other half MIA samples presented no difference compared to the benign samples (Figure 2A). Similarly, AIS samples also revealed lack of hypermethylation signals. This gradual gain of hypermethylation (from right to left in the heatmap in Figure 2A) is consistent with the sequential events of adenocarcinoma development progressing from AIS, MIA, to IA. These hypermethylated CpG sites were further confirmed using the TCGA methylation microarray data generated from lung adenocarcinoma and normal lung tissues (Figure S3).
Patient characteristics for the tissue cohort.
| Benign (101) | Malignant (129) | Total (230) | ||
|---|---|---|---|---|
| Age | ||||
| ≤40 | 27 (27%) | 11 (9%) | 38 (17%) | |
| 41-55 | 37 (37%) | 48 (37%) | 85 (37%) | |
| 56-70 | 32 (32%) | 50 (39%) | 82 (36%) | |
| ≥71 | 5 (5%) | 20 (16%) | 25 (11%) | |
| Gender | ||||
| Male | 49 (49%) | 66 (51%) | 115 (50%) | |
| Female | 52 (52%) | 63 (49%) | 115 (50%) | |
| Smoking history | ||||
| Smokers | 25 (25%) | 34 (26%) | 59 (26%) | |
| Non-smokers | 67 (66%) | 77 (60%) | 144 (63%) | |
| unknown | 9 (9%) | 18 (14%) | 27 (12%) | |
| Pathology | ||||
| Invasive adenocarcinoma (IA) | 65 (50%) | |||
| Minimal invasive adenocarcinoma (MIA) | 35 (27%) | |||
| Adenocarcinoma in situ (AIS) | 14 (11%) | |||
| Squamous cell (SC) | 7 (5%) | |||
| Large cell (LC) | 2 (2%) | |||
| Small cell lung cancer (SCLC) | 1 (1%) | |||
| Others | 5 (4%) | |||
| Tuberculosis (TB) | 34 (34%) | |||
| Hamartoma (HAM) | 21 (21%) | |||
| Fungal infection (FUN) | 19 (19%) | |||
| Inflammation (INF) | 11 (11%) | |||
| Granuloma (GRAN) | 8 (8%) | |||
| Sclerosing hemangiomas (SH) | 6 (6%) | |||
| Others | 2 (2%) |
Characterization of tissue level hypermethylation signatures of lung cancer. (A) Heatmap showing randomly selected 1000 hypermethylation regions for representative lung cancer and benign tissue samples. Methylation level of each region was calculated as co-methylated reads fraction. Samples are ordered from left to right by malignant/benign status (top color bar) and corresponding subtypes (second color bar). Subtypes from left to right are IA (n=33), MIA (n=19), AIS (n=8), FUN (n=11), INF (n=9), GRAN (n=4), TB (n=25), and HAM (n=21). Signal is shown in linear scale of color, with red indicating high methylation signal and green indicating low methylation signal. (B) A representative receiver operating curve (ROC) displays the tissue classification performance for distinguishing IA samples (n=65) against benign lesions (n=101) based on 10 bootstraps of 2-fold cross-validation of a regularized logistic regression. 95% confidence interval (CI) is shown in blue shade.
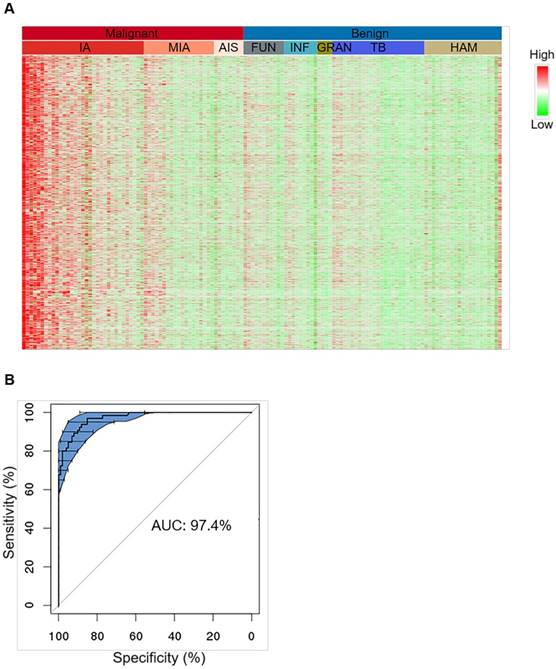
Tissue level classification was tested by 10 bootstraps of 2-fold cross-validation each time randomizing all IA and benign samples into training and test groups and classifier was modeled based on these hypermethylated CpG markers using regularized logistic regression (Figure 2B, upper panel). The prediction performance achieved an overall sensitivity of 92.7% ± 4.4% and an overall specificity of 92.8% ± 3.5% for separating IA (n = 65) from benign lesions (n = 101), giving rise to an overall AUC of 97.4% ± 1.0% (Figure 2B, low panel). When this model was applied to other malignant subtypes, sensitivities for MIA and AIS significantly dropped compared to IA, which was very likely due to an intrinsic lack of signal in the tissue specimens (Table S3). The sensitivity for SC lung cancers (n = 7) could achieve 100%, but was also lower in other rare subtypes (n = 8) than IA, which was due to the lack of subtype-specific markers in the classifier, suggesting that our marker set is more selective for IA compared to other subtypes.
Moreover, we enrolled an independent cohort of additional 58 patients from an independent cancer center, and achieved a sensitivity of 89.2% (74.6%-97.0%) and a specificity of 81.0% (58.1%-94.6%). As expected, our model yielded the highest sensitivity towards IA specimens (100%), while sensitivities towards other lung cancer subtypes are slightly lower (Table 3).
Independent validation of the malignancy classifier performance for tissue samples using a separate cohort (Cohort 2) of patients. NLCTL, lung normal control tissue; EM, emphysema.
| Tissue Samples | Negative | Positive | Total | Sensitivity | Specificity | |
|---|---|---|---|---|---|---|
| Malignant | IA | 12 | 12 | 100.0% | ||
| SC | 1 | 7 | 8 | 87.5% | ||
| SCLC | 3 | 10 | 13 | 76.9% | ||
| others | 4 | 4 | 100.0% | |||
| Sum of Malignant | 4 | 33 | 37 | 89.2% | ||
| Benign | GRAN | 8 | 2 | 10 | ||
| INF | 3 | 3 | ||||
| TB | 3 | 3 | ||||
| SH | 1 | 1 | ||||
| EM | 1 | 1 | ||||
| NLCTL | 2 | 1 | 3 | |||
| Sum of Benign | 17 | 4 | 21 | 81.0% | ||
Cancer classification using plasma DNA
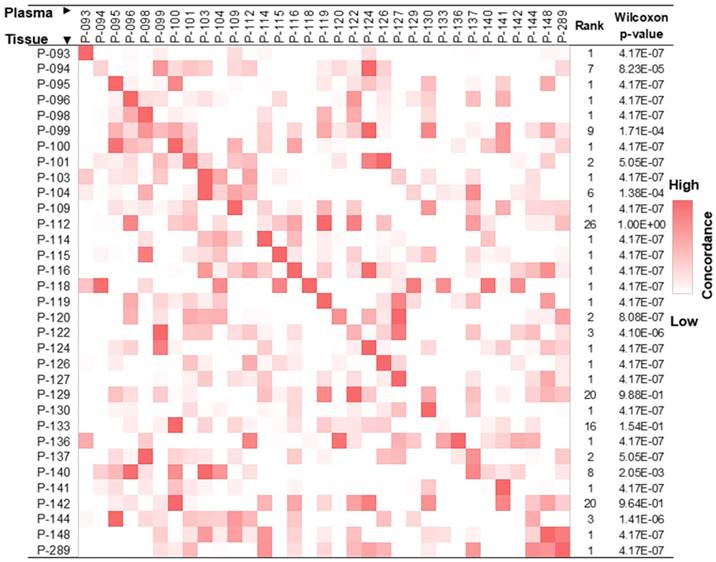
The release of gDNA from apoptotic/necrotic tumor cells into blood provides an opportunity to use ctDNA for the detection of cancer. To confirm that we were able to identify tumor tissue-derived DNA in the cfDNA pool using DNA hypermethylation patterns, we studied 33 pairs of tissue and plasma samples, each pair of which was derived from the same patient. As described in the Methods section, we only focused on co-methylated reads, and each co-methylation pattern was recorded. These pre-defined co-methylation patterns were next used to evaluate concordance between paired tissue and plasma samples, revealing an enrichment of tumor tissue-derived co-methylation patterns in the respective paired cfDNA pool (Figure 3).
Lung cancer tissue co-methylation patterns can be captured in the cfDNA pool. Concordance of co-methylation between paired tissue (row) and plasma (column) samples is calculated using the percentage of reads sharing pre-defined co-methylation patterns and displayed in the heatmap. The highest similarity of a tissue sample to its matched plasma is shown in the diagonal of the heatmap, with ranking and Wilcoxon test p-values of each self-pair compared to the rest tissue-plasma pairs shown on the right. The smaller the rank (and p-value), the better the match of self-pair.
To explore the clinical application of using DNA methylation signatures carried in ctDNA for early-stage lung cancer detection, we enrolled 192 patients and 10 ml of plasma was collected from each patient before surgery. 13 samples were excluded due to hemolysis, insufficient cfDNA yield (< 3 ng), or leukocyte DNA contamination; 9 samples were excluded due to low pre-library yield (< 400 ng); 18 samples were excluded due to failed sequencing quality control (QC); and another 20 samples were excluded due to the lack of pathological results; all of which resulted in a total of 132 samples qualifying for subsequent analyses. We also included 118 asymptomatic normal participants who have never been diagnosed with any tumor type.
We first randomly chose 50% of plasma samples (40 malignant, 26 benign) for training (Figure 4A and Table S4). The methylation status of the 3886 tissue-derived hypermethylated regions were compared between malignant and benign plasma samples using the Wilcoxon rank sum test and 71 regions were found hypermethylated in plasma. These 71 hypermethylated regions were next analyzed by the Least Absolute Shrinkage and Selection Operator (LASSO) and 9 hypermethylated markers were selected by modeling the 40 malignant and26 benign training samples. We further built a diagnostic prediction model based on these 9 markers using logistic regression, which generated an AUC of 83.9% (74.5%-93.4%) in separating malignant from benign plasma samples in the training set (Figure 4B and 4C).
Cancer classification using plasma DNA. (A) Workflow chart of building a plasma level diagnostic prediction model. (B) Heatmap of the 9 hypermethylated markers used for the diagnostic prediction model in the training and independent test data sets. Methylation level of each marker was calculated as co-methylated reads fraction. (C and D) ROC curves plot the performance of plasma level classification with the 95% confidence interval (CI) of sensitivity in the training (C) and test (D) data sets. (E) Performance of Mayo model in our plasma cohort. P, partial solid nodule; S, solid nodule; G, ground-glass nodule.
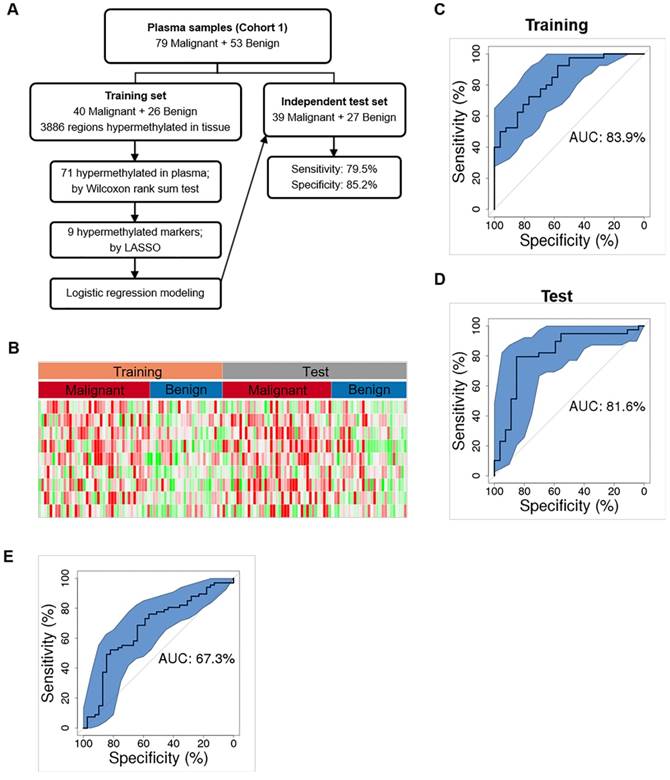
As an independent test, we applied this 9-marker model to the rest 50% of our enrolled plasma samples (39 malignant, 27 benign) (Figure 4A and Table S4), and achieved a sensitivity of 79.5% (63.5%-90.7%) and a specificity of 85.2% (66.3%-95.8%) with an AUC of 81.6% (70.3%-92.9%) in separating malignant from benign samples (Figure 4D and Table 4). Our assay is highly sensitive against early-stage lung cancers showing sensitivities of 75.0% and 85.7% for stage Ia and Ib lung cancers (Table 4). Consistent with a recent report that adenocarcinoma lung cancers shed less amount of ctDNA into the blood, sensitivity is 73.9% for IA. However, our assay achieved a sensitivity of 100% for squamous cell lung cancers and other types of lung cancers that are associated with higher cell growth turnover rate [25]. We are surprised at the higher sensitivity (77.8%) in MIA samples and reasoned that to a low sample size (n = 9). Next, we asked whether our model could assess the risk of cancer in general population. When applied to the 118 age and gender matched normal plasma samples, our model obtained a specificity of 93.2% (89.0%-98.3%). Though our model shows promise results distinguishing early stage lung cancers from benign nodules and normal controls, additional clinical studies with larger sample size are needed to establish the robustness of our models.
Clinical information and performance of the malignancy classifier of plasma samples among various lung cancer subtypes and stages against benign and normal conditions in two independent validation groups.
| Clinical features | Pulmonary nodule positive | Pulmonary nodule negative | P value | ||
| Gender (male %) | 78 (59%) | 61 (52%) | 0.25 | ||
| Age (years) | 57 (12) | 57 (10) | 0.98 | ||
| Malignant subtypes | Negative | Positive | Total | Sensitivity | Specificity |
| IA | 6 | 17 | 23 | 73.9% | |
| MIA | 2 | 7 | 9 | 77.8% | |
| SC | 6 | 6 | 100.0% | ||
| others | 1 | 1 | 100.0% | ||
| Sum | 8 | 31 | 39 | 79.5% | |
| Benign subtypes | Negative | Positive | Total | Sensitivity | Specificity |
| INF | 1 | 1 | |||
| GRAN | 2 | 1 | 3 | ||
| HAM | 6 | 1 | 7 | ||
| TB | 12 | 1 | 13 | ||
| FUN | 2 | 1 | 3 | ||
| Sum | 23 | 4 | 27 | 85.2% | |
| Non-malignant plasma subtypes | Negative | Positive | Total | Sensitivity | Specificity |
| pulmonary nodule positive | 23 | 4 | 27 | 85.2% | |
| pulmonary nodule negative | 110 | 8 | 118 | 93.2% | |
| Sum | 133 | 12 | 145 | 91.7% | |
| Malignant stages | Negative | Positive | Total | Sensitivity | Specificity |
| Ia | 5 | 15 | 20 | 75.0% | |
| Ib | 1 | 6 | 7 | 85.7% | |
| IIa | 1 | ||||
| Later stages | 1 | 9 | 10 | 90% | |
| Unknown | 1 | 1 | |||
| Sum | 8 | 31 | 39 | 79.5% | |
Smoking history and age have been shown to affect DNA methylation status and have been reported as risk factors for lung cancer development [26-29]. We therefore performed univariate and multivariate analyses to determine which clinical risk factors may associate with pathological outcomes in the current setting and may provide better prediction power in combination with DNA methylation information. Univariate analyses showed that smoking history, and nodule size facilitated ctDNA detection, among which nodule size is the strongest risk factor other than DNA methylation in predicting malignancy (Table S5 and Table S6). However, multivariate analysis showed that only DNA methylation served as an independent predictor, while other risk factors provided little additional effect. It suggests that the utilization of methylation signatures carried by cfDNA may serve as a standalone diagnostic approach, independent of other clinical factors, distinguishing malignant lung cancers from benign nodules. Guidelines from the American College of Chest Physicians recommend that doctors use a validated prediction model, such as the Mayo Clinic to evaluate the probability that lung nodules detected on low-dose CT scans are malignant (30). Therefore, we evaluated the performance of Mayo Clinic model in our plasma cohort whose AUC is 67.3% (56.4%-78.2%) (Figure 4E). Compared to Mayo Clinic model of our cohort, our methylation model has better performance in our independent validation set. Additionally, we didn't gain additional prediction performance when combining our model with Mayo Clinic model (Figure S6).
Discussion
Cancer early detection is by far the most economical and effective mean to reduce cancer-specific mortality. As the largest cancer type in the world, lung cancer early screening has long been challenging due to the high false positive rate of LDCT screening and the difficulty to perform diagnostic biopsies. Therefore, a non-invasive yet sensitive diagnostic assay that can distinguish malignant pulmonary nodules from benign diseases will be particularly valuable for patients with positive LDCT results. Liquid biopsy of ctDNA has become one of the most attractive approaches for such clinical applications. However, a number of recent studies that attempted to detect ctDNA from early-stage lung cancer patients via PCR or NGS-based somatic mutation profiling all concluded with limited sensitivities [25, 31, 32].
We reason that ctDNA detection via methylation profiling can achieve higher sensitivity and specificity compared to somatic mutation profiling in early-stage patients because, 1) a greater magnitude of markers can be simultaneously accessed to increase sensitivity, and 2) multiple CpG loci within each selected region can be interrogated together to derive “cancer-specific methylation patterns” for increased specificity. Furthermore, methylation profiling can be used to differentiate tissue-of-origin and cancer subtypes [33, 34]. Several recent studies have demonstrated the feasibility of performing bisulfite sequencing on plasma DNA to identify patients with malignant diseases, but all focused on rather late-stage cancer patients except the one that reported on hepatocellular carcinoma [34-36].
One recent study by Ooki et al. focusing on early-stage lung cancers, used methylation-specific PCR on bisulfite-treated serum DNA for 6 genes selected based on TCGA dataset, and reported a sensitivity of 72.1% in stage Ia adenocarcinoma, 60% in stage Ia squamous cell lung cancer, and a specificity of 71.4% in normal control subjects [37]. Another study by Hulbert et al. using PCR on another 6 genes identified from TCGA dataset reported a sensitivity of 65-76% and a specificity of 74-84% in plasma [38]. The above studies selected markers from TCGA database in which the control group were para-tumor normal tissues and data were generated using microarrays. Therefore, these panels might not be directly transformed to next-generation sequencing platforms or necessarily applicable to differentiating malignant from benign lesions. We generated the candidate markers by differentiating malignant lesions from benign lesions rather than para-tumor normal tissue. There were only four markers shared by both Ooki's study and our test panel, but none of these markers was selected into our diagnostic model. We calculated the performance of each of these markers using our data set and found that they all presented significantly lower AUCs compared to the nine markers in our diagnostic model (Table S7 & S8). In the plasma validation test, we included both benign nodular lesions and healthy controls, while the two previous studies included only healthy controls. Our design could further reduce false positive probability, which is crucial in aiding diagnostic decision after nodule detection by CT scan.
Here we present the first study with a lung nodule specific cohort, primarily focusing on early-stage lung adenocarcinomas, in combination with a novel targeted methylation profiling assay that exhibits superior library conversion efficiency and assay sensitivity (Figure 1 and Table 1). The two major technical hurdles for bisulfite sequencing are 1) the low library conversion efficiency, which limits the use of low input samples such as plasma DNA, and 2) limited means for targeted enrichment. The IRIS assay combines high library conversion efficiency with a streamlined targeted enrichment workflow, which enables deep sequencing of pre-selected highly informative regions from clinical samples. The average unique target coverage from our clinical cohort is >180X (Table S9), which greatly facilitates the power of detecting low frequency ctDNA compared to the shallow sequencing approach used in previous studies [34, 35].
The abundance of ctDNA out of total cfDNA is largely associated with the tumor volume. A tumor with 1 cm3 volume is predicted to have a ctDNA fraction between 0.001-0.03%; therefore, the limit of detection of a diagnostic assay is critical for detection of early-stage lung cancer [25]. The IRIS assay demonstrates a limit of detection of 0.0033% by combining several hundreds of pre-selected markers, which allows sensitive detection of malignancy from patients with tumor as small as 0.5 cm in diameter (Table S6 and S8). Using the IRIS assay, we archived a sensitivity of 79.5% (63.5% - 90.7%) in detecting malignancy from plasma DNA of patients with pulmonary nodules. Particularly, the sensitivity for stage- Ia and Ib patients remain at 75.0% (55.0%-90.0%) and 85.7% (57.1%-100.0%), respectively, superior to other ctDNA-based liquid biopsy performance via somatic mutation or DNA methylation profiling (Table 4) [32, 34, 37]. Furthermore, in agreement with Abbosh et al., we also observed a drop in sensitivity in adenocarcinoma patients compared to other lung cancer subtypes (i.e. squamous, small cell, large cell), supports the argument that adenocarcinoma, especially at its early localized stage, undergoes less apoptosis and necrosis compared to other subtypes such as squamous cell carcinoma, and therefore shed less ctDNA into the bloodstream [25]. This observation poses further challenge for lung cancer early detection via ctDNA as >90% of sub-centimeter early-stage lung cancers identified by CT scan are adenocarcinomas [39].
As a proof-of-principle study, we demonstrated the feasibility of using high-throughput targeted DNA methylation sequencing of ctDNA to detect sub-centimeter tumor non-invasively. All patients involved in this study should have primary lesions less than 3 cm in diameter, which restrict the differential markers and performance data to be specific to low-burden disease. This approach can be potentially applied to various aspects of cancer management including cancer early screening, LDCT confirmatory diagnosis, minimal residual disease surveillance, recurrence and treatment response monitoring. While the positive detection rate in early-stage lung cancers is quite promising, a fully independent validation study is still lacking. To confirm the performance of this model, we are conducting a nationwide multicenter validation study in China (NCT03181490, https://www.clinicaltrials.gov/) which has been launched since June 2017. Notably, only 9 methylation biomarkers were included in our current diagnostic prediction model, which poses a limitation on assay sensitivity and specificity. Further studies with more patient samples from a variety of disease subtypes and a more comprehensive panel design are needed to improve marker selection. The high-throughput methylation sequencing methods in this study provided room for further evolution of lung cancer specific epigenetic markers or diagnostic assays. We also observed a slight drop in test specificity in patients with benign pulmonary nodules compared to asymptomatic normal individuals (Table 4). We hypothesize that patients undergoing active inflammatory response (i.e. TB and infections) may share some common methylation changes in patients with malignant tumors, originated from activated lymphocytes. Therefore, methylation profiling of various lymphocyte subtypes at various activation states may help further improve the specificity for patients with benign diseases. Last but not least, deep data mining of methylation profiles can be further extended to many other types of cancers for better diagnostic and prognostic outcomes.
Abbreviations
ctDNA: circulating tumor DNA; cfDNA: cell free DNA; CTC: circulating tumor cells; LDCT: low-dose computed tomography; PET-CT: Positron emission tomography; FFPE: formalin-fixed paraffin embedded; gDNA: genomic DNA; WBC: while blood cell; DML: differentially methylated CpG loci; DMR: differentially methylated regions; ROC: receiving operation curve; AUC: area under curve; Lasso: least absolute shrinkage and selection operator; IA: invasive adenocarcinoma; MIA: minimally invasive adenocarcinoma; AIS: adenocarcinoma in situ; SC: squamous cell; LC: large cell; SC: small cell; HAM: hamartoma; TB: tuberculosis; GRAN: inflammatory granuloma; FUN: fungal infection; INF: inflammation; SH: sclerosing hemangioma.
Supplementary Material
Supplementary figures and tables.
Acknowledgements
We deeply thank Prof. Leung Lai Han from Macau Technology University and Prof. David Ward from Yale University School of Medicine for the suggestions on this manuscript.
Funding
Guangdong Doctoral Launching Program (Grant No. 2014A030310460); Doctoral Launching Program of Guangzhou Medical University (Grant No.2014C27); Chinese National Natural Science Foundation (Grant No. 81871893); Science and Technology Planning Project of Guangdong Province, China (Grant numbers: 2007B031515017; 2008A030201024); Science and Technology Planning Project of Guangzhou, China (Grant numbers: 2007Z1-E0111; 2007Z3-E0261); and Key Projects of Guangzhou Scientific Research Program (Grant No. 201804020030).
Statement of Translational Significance
We developed a sensitive non‐invasive diagnostic assay for early-stage lung cancer, which can aid clinical decisions for patients with a LDCT scan positive for pulmonary nodules. This is one of the first studies to examine the diagnostic value of targeted DNA methylation sequencing for early-stage lung cancer. In addition, we presented several technical and analytical achievements which might impact the clinical application of ctDNA for cancer early detection.
Competing Interests
The authors JBF, XC, YG, MY, WX, YZ, JT, and ZC are employees of AnchorDx Medical Co., Ltd., a company that focuses on the development of next generation sequencing diagnostic products for early cancer detection using liquid biopsy. The author PWL is a member of AnchorDx's Scientific Advisory Board. All other authors declare no competing financial interest.
References
1. Chen W, Zheng R, Baade PD, Zhang S, Zeng H, Bray F. et al. Cancer statistics in China, 2015. CA Cancer J Clin. 2016;66:115-32
2. National Lung Screening Trial Research T, Aberle DR, Adams AM, Berg CD, Black WC, Clapp JD. et al. Reduced lung-cancer mortality with low-dose computed tomographic screening. N Engl J Med. 2011;365:395-409
3. de Koning HJ, Meza R, Plevritis SK, ten Haaf K, Munshi VN, Jeon J. et al. Benefits and harms of computed tomography lung cancer screening strategies: a comparative modeling study for the U.S. Preventive Services Task Force. Ann Intern Med. 2014;160:311-20
4. Plaks V, Koopman CD, Werb Z. Cancer. Circulating tumor cells. Science. 2013;341:1186-8
5. Li S, Zhao B, Wang X, Yu J, Yan S, Lv C. et al. Overestimated value of (18)F-FDG PET/CT to diagnose pulmonary nodules: Analysis of 298 patients. Clin Radiol. 2014;69:e352-7
6. Seemann MD, Beinert T, Furst H, Fink U. An evaluation of the tumour markers, carcinoembryonic antigen (CEA), cytokeratin marker (CYFRA 21-1) and neuron-specific enolase (NSE) in the differentiation of malignant from benign solitary pulmonary lesions. Lung Cancer. 1999;26:149-55
7. Jones PA. Functions of DNA methylation: islands, start sites, gene bodies and beyond. Nat Rev Genet. 2012;13:484-92
8. Hansen KD, Timp W, Bravo HC, Sabunciyan S, Langmead B, McDonald OG. et al. Increased methylation variation in epigenetic domains across cancer types. Nat Genet. 2011;43:768-75
9. Berman BP, Weisenberger DJ, Aman JF, Hinoue T, Ramjan Z, Liu Y. et al. Regions of focal DNA hypermethylation and long-range hypomethylation in colorectal cancer coincide with nuclear lamina-associated domains. Nat Genet. 2011;44:40-6
10. Bert SA, Robinson MD, Strbenac D, Statham AL, Song JZ, Hulf T. et al. Regional activation of the cancer genome by long-range epigenetic remodeling. Cancer Cell. 2013;23:9-22
11. Pfeifer GP, Tang M, Denissenko MF. Mutation hotspots and DNA methylation. Curr Top Microbiol Immunol. 2000;249:1-19
12. Greenblatt MS, Bennett WP, Hollstein M, Harris CC. Mutations in the p53 tumor suppressor gene: clues to cancer etiology and molecular pathogenesis. Cancer Res. 1994;54:4855-78
13. Kerr KM, Galler JS, Hagen JA, Laird PW, Laird-Offringa IA. The role of DNA methylation in the development and progression of lung adenocarcinoma. Dis Markers. 2007;23:5-30
14. Cai X, Janku F, Zhan Q, Fan JB. Accessing Genetic Information with Liquid Biopsies. Trends Genet. 2015;31:564-75
15. Diehl F, Li M, Dressman D, He Y, Shen D, Szabo S. et al. Detection and quantification of mutations in the plasma of patients with colorectal tumors. Proc Natl Acad Sci U S A. 2005;102:16368-73
16. Diehl F, Schmidt K, Choti MA, Romans K, Goodman S, Li M. et al. Circulating mutant DNA to assess tumor dynamics. Nat Med. 2008;14:985-90
17. Krueger F, Andrews SR. Bismark: a flexible aligner and methylation caller for Bisulfite-Seq applications. Bioinformatics. 2011;27:1571-2
18. Park Y, Wu H. Differential methylation analysis for BS-seq data under general experimental design. Bioinformatics. 2016;32:1446-53
19. Perez-Llamas C, Lopez-Bigas N. Gitools: analysis and visualisation of genomic data using interactive heat-maps. PLoS One. 2011;6:e19541
20. Tibshirani R. The lasso method for variable selection in the Cox model. statistics in medicine. 1997;16:385-95
21. Diaz LA Jr, Bardelli A. Liquid biopsies: genotyping circulating tumor DNA. J Clin Oncol. 2014;32:579-86
22. Lissa D, Robles AI. Methylation analyses in liquid biopsy. Transl Lung Cancer Res. 2016;5:492-504
23. Baylin SB, Jones PA. Epigenetic Determinants of Cancer. Cold Spring Harb Perspect Biol. 2016;8:a019505
24. Friedman J, Hastie T, Tibshirani R. Regularization Paths for Generalized Linear Models via Coordinate Descent. J Stat Softw. 2010;33:1-22
25. Abbosh C, Birkbak NJ, Wilson GA, Jamal-Hanjani M, Constantin T, Salari R. et al. Phylogenetic ctDNA analysis depicts early-stage lung cancer evolution. Nature. 2017;545:446-51
26. Joehanes R, Just AC, Marioni RE, Pilling LC, Reynolds LM, Mandaviya PR. et al. Epigenetic Signatures of Cigarette Smoking. Circ Cardiovasc Genet. 2016;9:436-47
27. Zeilinger S, Kuhnel B, Klopp N, Baurecht H, Kleinschmidt A, Gieger C. et al. Tobacco smoking leads to extensive genome-wide changes in DNA methylation. PLoS One. 2013;8:e63812
28. Pal S, Tyler JK. Epigenetics and aging. Sci Adv. 2016;2:e1600584
29. Gautrey HE, van Otterdijk SD, Cordell HJ, Newcastle 85+ Study Core T, Mathers JC, Strathdee G. DNA methylation abnormalities at gene promoters are extensive and variable in the elderly and phenocopy cancer cells. FASEB J. 2014;28:3261-72
30. Swensen SJ, Silverstein MD, Ilstrup DM, Schleck CD, Edell ES. The Probability of Malignancy in Solitary Pulmonary Nodules. Arch Intern Med. 1997;157:849-55
31. Newman AM, Bratman SV, To J, Wynne JF, Eclov NC, Modlin LA. et al. An ultrasensitive method for quantitating circulating tumor DNA with broad patient coverage. Nat Med. 2014;20:548-54
32. Phallen J, Sausen M, Adleff V, Leal A, Hruban C, White J. et al. Direct detection of early-stage cancers using circulating tumor DNA. Sci Transl Med. 2017;9:eaan2415
33. Moran S, Martinez-Cardus A, Sayols S, Musulen E, Balana C, Estival-Gonzalez A. et al. Epigenetic profiling to classify cancer of unknown primary: a multicentre, retrospective analysis. Lancet Oncol. 2016;17:1386-95
34. Guo S, Diep D, Plongthongkum N, Fung HL, Zhang K, Zhang K. Identification of methylation haplotype blocks aids in deconvolution of heterogeneous tissue samples and tumor tissue-of-origin mapping from plasma DNA. Nat Genet. 2017;49:635-42
35. Sun K, Jiang P, Chan KC, Wong J, Cheng YK, Liang RH. et al. Plasma DNA tissue mapping by genome-wide methylation sequencing for noninvasive prenatal, cancer, and transplantation assessments. Proc Natl Acad Sci U S A. 2015;112:E5503-12
36. Xu RH, Wei W, Krawczyk M, Wang W, Luo H, Flagg K. et al. Circulating tumour DNA methylation markers for diagnosis and prognosis of hepatocellular carcinoma. Nat Mater. 2017;16:1155-61
37. Ooki A, Maleki Z, Tsay JJ, Goparaju C, Brait M, Turaga N. et al. A Panel of Novel Detection and Prognostic Methylated DNA Markers in Primary Non-Small Cell Lung Cancer and Serum DNA. Clin Cancer Res. 2017;23:7141-52
38. Hulbert A, Jusue-Torres I, Stark A, Chen C, Rodgers K, Lee B. et al. Early Detection of Lung Cancer Using DNA Promoter Hypermethylation in Plasma and Sputum. Clin Cancer Res. 2017;23:1998-2005
39. Sakurai H, Nakagawa K, Watanabe S, Asamura H. Clinicopathologic features of resected subcentimeter lung cancer. Ann Thorac Surg. 2015;99:1731-8
Author contact
![]() Corresponding author: xuyu_caicom (X. Cai); jianbingfan1115edu.cn (J.B. Fan); jianxingcn (J. He).
Corresponding author: xuyu_caicom (X. Cai); jianbingfan1115edu.cn (J.B. Fan); jianxingcn (J. He).