Impact Factor
 Global reach, higher impact
Theranostics 2019; 9(7):1837-1850. doi:10.7150/thno.27051 This issue Cite
Research Paper
An Optogenetic Controllable T Cell System for Hepatocellular Carcinoma Immunotherapy
Bixing Zhao1,3*, Yingchao Wang1,3*, Xionghong Tan1,4, Xiaoyuan Zheng1,3, Fei Wang1,3, Kun Ke1,2,3, Cuilin Zhang1,3, Naishun Liao1,3, Yuan Dang5, Yingjun Shi1,3, Youshi Zheng1,3, Yunzhen Gao1,3, Qin Li1, Xiaolong Liu1,3 ![]() , Jingfeng Liu1,2,3
, Jingfeng Liu1,2,3 ![]()
1. The United Innovation of Mengchao Hepatobiliary Technology Key Laboratory of Fujian Province, Mengchao Hepatobiliary Hospital of Fujian Medical University, Fuzhou 350025, P. R. China
2. Liver Disease Center, The First Affiliated Hospital of Fujian Medical University, Fuzhou 350005, P. R. China
3. The Liver Center of Fujian Province, Fujian Medical University, Fuzhou 350025, P. R. China
4. College of Life Science, Fujian Agriculture and Forestry University, Fuzhou, 350002, P.R. China
5. Department of Comparative, Fuzhou General Hospital, Xiamen University Medical College, 156 Road Xi'erhuanbei, Fuzhou 350025, Fujian, P.R. China
*These authors contributed equally to this work.
Received 2018-5-3; Accepted 2019-1-8; Published 2019-3-6
Abstract

Rationale: T-cell based immunotherapy increasingly shows broad application prospects in cancer treatment, but its performance in solid tumors is far from our expectation, partly due to the re-inhibition of infiltrated T cells by immunosuppressive tumor microenvironment. Here we presented an artificial synthetic optogenetic circuit to control the immune responses of engineered T cells on demand for promoting and enhancing the therapeutic efficiency of cancer immunotherapy.
Methods: We designed and synthesized blue-light inducible artificial immune signaling circuit and transgene expression system. The blue light triggered transgene expression was investigated by luciferase activity assay, qPCR and ELISA. The in vitro cytotoxicity and proliferation assays were carried out on engineered T cells. The in vivo anti-tumor activity of engineered T cells was investigated on xenograft model of human hepatocellular carcinoma.
Results: Blue light stimulation could spatiotemporally control gene expression of specific cytokines (IL2, IL15, and TNF-α) in both engineered 293T cells and human primary T cells. This optogenetic engineering strategy significantly enhanced the expansion ability and cytolytic activity of primary T cells upon light irradiation, and the light activated T cells showed high-efficiency of elimination against xenograft of hepatocellular carcinoma cells.
Conclusions: The current study represented an engineered remotely control T cell system for solid tumor treatment, and provided a potential strategy to partially overcome the intrinsic shortages of current immune cell therapy.
Keywords: optogenetics, engineered T cells, hepatocellular carcinoma, immune cell therapy
Introduction
T cell-based cancer immunotherapy has made significant progress in treatment of several cancers in recent years [1]. However, the clinical translation of engineered T cell-based cancer therapies still remains big concerns regarding the safety and off-target toxicity, as well as the development of resistance. In particular, the engineered-T cell therapy remains the biggest challenge for solid tumor treatment, partially due to the immunosuppressive tumor microenvironment, which protects the malignant cells from elimination by cytotoxic T lymphocytes (CTLs) in solid tumor [2, 3].
To further extend T cell's tumor cell killing ability beyond traditional antigen-activated T cell killing pathways, T cells could be engineered to secrete or carry additional molecules that could either directly or indirectly lead to T cell activation and tumor cell death. For example, T cells that release the stimulatory cytokine IL-12 upon T cell receptor activation have been successfully developed and have worked extremely well in animal models [4]. But unfortunately, a recent clinical trial showed that the IL-12 gene expression in adoptively transferred tumor-infiltrating lymphocytes (TILs) resulted in unacceptable toxicity [5]. Apparently, both T cell dysfunction and serious systematic toxicity caused by off-target killing would limit the clinical translation and application of such engineered T cells in solid tumor treatment. However, a molecular switch system, which can precisely force switch on and switch off the T cell functions on demand, could overcome above mentioned disadvantages by simultaneously enhancing the T cell killing to target tissue but decrease the off-target toxicity, then could further promote the clinical translation of engineered T-cell based therapies.
The emerging field of synthetic biology is providing a systematic framework for safely and predictably altering and regulating cellular behavior [6], including the possibility of precisely control the activation of T cells by synthetic signal circuits or molecular switches. Optogenetic transcriptional control systems can be very promising candidates for such applications due to its high spatiotemporal control ability and resolution. In recent years, significant progress has been made in optogenetic techniques and several optogenetic transcriptional control systems have been developed for dynamically regulating gene expression on demand by light irradiation [7-9]. Melanopsin, which is able to induce calcium influx under blue light illumination then calcium-dependent activate of calcineurin followed by calcineurin-mediated mobilization of NFAT, is an ideal light-input component for design of mammalian synthetic light-controlled transcription devices and has been applied as an optogenetic tool in neuroscience over the past years [10-12]. Inspired by the success of optogenetic strategies in neuroscience, scientists also designed channelrhodopsin-based optogenetic tools to regulate immune cell functions for cancer treatment [13-15]. However, these studies only utilized the light induced Ca2+ signaling to activate endogenous NFAT downstream gene expression to stimulate innate immune responses. While by further design genes of interest under the NFAT promoter, the artificial immune signal and response of demand can be then regulated by light illumination, therefore to promote and enhance the therapeutic efficiency.
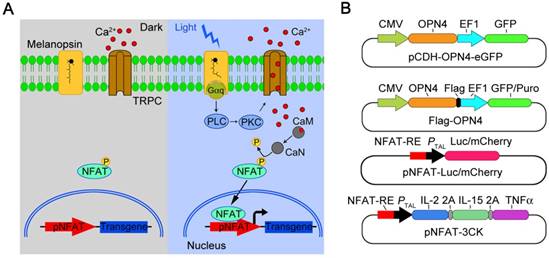
By using such a strategy, T cells can be well engineered to achieve the goal of precisely force activation and expression of cytotoxic factors mostly in tumor tissue with blue light stimulation, to decrease none-specific toxicity and overcome the T cell inactivation by immunosuppressive tumor microenvironment. Here we present a light inducible optogenetic strategy based on melanopsin to precisely switch the T cell functions via calcium-NFAT pathway (Figure 1A). Since light illumination in our platform could induce Ca2+ influx, followed by NFAT nuclear translocation and NFAT-dependent gene expression, we further designed a NFAT-driven specific cytokine expression construct (pNFAT-IL2-IL15-TNFα) to proactively force activate and enhance the tumor killing activity of engineered T cells (Figure 1B). In the engineered T cells, blue light irradiation could induce T cells to secrete large quantities of IL-2, IL-15 and TNFα; then, the IL-2 and IL-15 could induce sustained activation and expansion of T cells, and the TNFα could directly enhance the tumor killing effects of T cells. Therefore, the here reported T cell optogenetic control system might provide a novel strategy to overcome the disadvantages of immune cell therapy for solid tumor treatment.
Melanopsin mediated optogenetic-transduction cascade. A) Scheme of the photoactivatable gene expression system. In dark, melanopsin keeps inactive; upon blue light illumination, retinal undergoes an all-trans to 13-cis photoisomerization, and changes the conformation of melanopsin; then, melanopsin triggers calcium influx via activation of transient receptor potential channels (TRPCs). Calcium influx further triggers the NFAT pathway via the calcium sensor protein calmodulin. Calmodulin subsequently activates calcineurin, which dephosphorylates NFAT, then results in nuclear translocation of NFAT and enables its binding to specific promoters (pNFAT), finally cooperates with resident transcription factors to induce transgene expression. B) Schematic vectors for optogenetic triggered gene expression.
Results
Melanopsin-mediated photoactivatable Ca2+ influx and nuclear translocation of NFAT in mammalian cells
To establish an optogenetic transcriptional control system based on melanopsin, we first constructed a melanopsin lentivirus vector (Figure 1B; pCDH-OPN4-eGFP and Flag-OPN4) and a NFAT response element driven transgene expression vector (pNFAT-Luc, pNFAT-mCherry and pNFAT-3CK). Then, the expression and subcellular localization of melanopsin were verified by western blot and immunofluorescence staining, respectively (Figure S1 and 2A). The results showed that the Flag-Tagged melanopsin was nicely expressed in HEK293T cells and an obvious membrane localization was clearly observed. To further confirm whether blue light stimulation could induce calcium influx in engineered 293T cells, the melanopsin-expressing 293T cells were transfected with a genetically-encoded Ca2+ indicator GCaMP6s; upon blue light illumination, the fluorescence signal of GCaMP6s was dramatically increased within a few seconds corresponding to the rise of intracellular calcium concentration (Figure 2B and Movie 1). Meanwhile, the Ca2+ indicator fluo-4 was also used to monitor intracellular calcium concentration change (Figure S3); as expected, when the engineered 293T cells were exposed to blue-light pulses (the blue light device was shown in supplementary figure S2A and detaily described in the Experimental Section) for 24 hours, the intracellular calcium levels of these cells were significantly increased.
Melonopsin-mediated photoactivatable Ca2+ infux, dephosphorylation and nuclear translocation of NFAT. A) Subcellular localization of Flag-OPN4 in 293T cells. Flag-OPN4 or pCDH control vectors were transfected into 293T cells. Cells were immune-stained for detecting OPN4 by Flag antibody followed by Alexa fluor 546 conjugated secondary antibody. Stained cells were visualized with by confocal microscope. B) Blue light induced Ca2+ influx monitored by Ca2+ indicator GCaMP6s. Engineered 293T cells with constitutive melanopsin expression were transfected with GCaMP6s vector. After transfection, intracellular Ca2+ concentration change was monitored by confocal microscope following blue light stimulation. The fluorescence intensity change was plotted on the right and quantified as post-stimulus change in fluorescence intensity divided by the baseline intensity (ΔF/F0); n=6 cells, and the Error bars denote SEM. C) Blue-light induce dephosphorylation of NFAT. The engineered 293T cells were analyzed by western blot for NFAT1 dephosphorylation after blue light stimulation. Ionomycin and PMA stimulation was shown as a positive control. D) Light-induced translocation of mCherry-NFAT1. OPN4 stable expression HeLa cells were transient transfected with mCherry-NFAT1. After transfection, the cells were exposed to repeated light-dark cycles (60 s ON and 60 s OFF). Representative snapshots of cells during mCherry-NFAT1 nuclear translocation were imaged by confocal microscope. The corresponding time courses of NFAT nuclear translocation were plotted on the right. n = 5 cells from three independent experiments. The data were analyzed using two-tailed Student's T-test in (B,D).
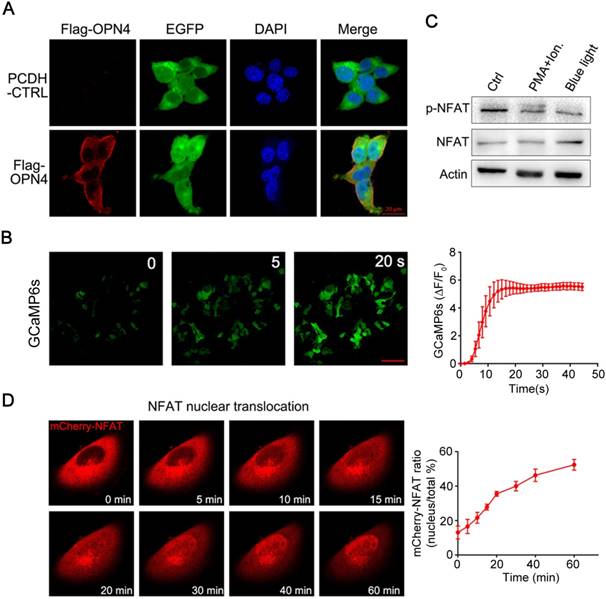
Ca2+ influx was able to activate calcineurin, a downstream of Ca2+-dependent phosphatase which dephosphorylates transcriptional regulator NFAT and subsequently induce NFAT nuclear translocation [16]. Thus, we next examined whether Ca2+ influx induced by light illumination in the engineered mammalian cells could trigger dephosphorylation and nuclear translocation of NFAT. As shown in figure 2C, light stimulation led to a significant dephosphorylation of NFAT; in the meantime, PMA and ionomycin treatment also induced the dephosphorylation of NFAT as a positive control. To further analyze the NFAT subcellular localization, the HeLa cells expressing OPN4 were transfected with mCherry-NFAT expression vector, and then the cells were subjected to light pulse stimulation; as shown in figure 2D and Movie 2-4, the mCherry-NFAT signal distributes in cytoplasm before blue light illumination, while a clear nuclear accumulation of NFAT was gradually observed after light illumination; after 1 hours of light exposure, most of the NFAT was located in the nucleus. HeLa cells transfected with mCherry-NFAT alone were used as the negative control, and PMA/ionomycin treatment was used as the positive control. The data showed that NFAT alone did not show nuclear translocation upon light illumination while ionomycin/PMA treatment dramatically induced the nuclear translocation of NFAT (supplementary figure S4). These data clearly indicated that light stimulation could induce the translocation of NFAT from cytoplasm to nucleus.
Optogenetic stimulation of specific gene expression in engineered 293T cells
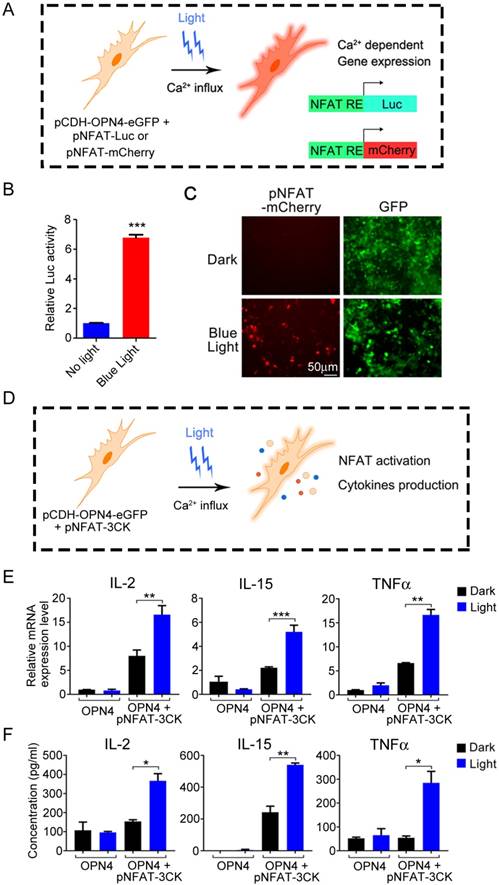
The above data have shown that melanopsin was able to mediate the photoactivation of Ca2+-NFAT signaling pathway. Then, we further investigated the NFAT-dependent specific gene expression in 293T cells which transfected with an NFAT-driven luciferase or mCherry reporter construct (Figure 3A). As shown in Figure 3B, the luciferase activity of NFAT-driven luciferase reporter (pNFAT-Luc) transfected 293T-OPN4 stable cells was exclusively induced when the cells were exposed to blue-light pulses for 24 hours. Similar light-stimulated gene expression phenomenon could also be visualized by fluorescence microscopy when using pNFAT-mCherry instead of the pNFAT-Luc (Figure 3C). In order to investigate how long the blue light induced gene expression may last, we further examined the NFAT-driven luciferase activity after turning off the blue light at different time points. As shown in supplementary Figure S5, the data indicated that the expression of transgenes could remain at least for 24 hours with the highest activity during 1 to 12 hours after turning off the blue light.
Light-triggered Ca2+-dependent specific gene expression. A) Scheme of light activated Ca2+-dependent gene expression. B) Light-triggered Ca2+-dependent luciferase activity. OPN4+ 293T Cells were transfected with pNFAT-Luc, and the cells were either kept in the dark or exposed to pulsed blue light (0.5 mW/cm2, 60 s on with 60 s interval) for 24 h prior to cell lysis to quantify luciferase activity. C) Light induced expression of mCherry. OPN4+/GFP+ 293T cells were transfected with pNFAT-mCherry, and illuminated with blue light for 24 h, the expression of mCherry and GFP were monitored by fluorescence microscope. D) Schematic view of experimental design of light induced cytokines production. E-F) Light triggered cytokine expression both in mRNA (E) and protein (F) levels. The engineered 293T cells were exposed to blue light stimulation for 24 h, then lysed for qPCR analysis (E) or the culture supernatant was collected for ELISA analysis (F). All data were shown as mean ± s.d. from three independent experiments. *P<0.05; **P<0.01; ***P<0.001. The data were analyzed using two-tailed Student's T-test in (B, E, F).
Ca2+-NFAT signaling transmits signals from immunoreceptors to the nucleus, and the nucleus NFAT can cooperate with multiple transcriptional partners to activate NFAT-dependent transcription and then to regulate T cell activation and differentiation [17] . In order to integrate this light activatable optogenetic platform in cancer immunotherapy, we further designed the NFAT-driven multi-cytokine expression vector pNFAT-IL2-IL15-TNFα (pNFAT- 3CK), using the 2A self-cleavage peptide (Figure 1B), to force activate T cells on demand.
IL-2 has essential roles in the key functions of immune system, and the ability of IL-2 to expand T cells with maintenance of functional activity has been translated into the first reproducible effective human cancer immunotherapy[18]. IL-15, which is a cytokine with structural similarity to IL-2 and also regulates the activation and proliferation of T cells, has emerged as a promising immunomodulation candidate for cancer treatment [19]. Tumor necrosis factor (TNF, also known as TNFα) is a central player within a complicated network of cytokines, and the TNF has been clinically used in treatment of various unresectable tumors due to its antitumor properties [20]. Inspired by the clinical efficacy of these three cytokines, we established an engineered T cell system, which could simultaneously express IL-2, IL-15 and TNFα under optical signal stimulation. By combining these three vital cytokines within the optogenetic control system, we could precisely control T cell force activation and tumor killing with blue light illumination to overcome T cell dysfunction and off-target toxicity in T-cell based immunotherapies.
Therefore, it is necessary to confirm that optical signal stimulation could induce the expression and secretion of these cytokines in mammalian cells (Figure 3D). We thus transduced the pCDH-OPN4- eGFP and the pNFAT-3CK constructs into 293T cells, then compared the expression levels of three target cytokines (IL-2, IL-15 and TNFα) in the presence or absence of light illumination. As expected, light stimulation faithfully up-regulated the mRNA levels of these three cytokines and boosted the cytokine production. By contrast, cells transduced with pCDH-OPN4-eGFP alone failed to exhibit light- dependent production of cytokines (Figure 3E and 3F).
Optogenetic control engineered T cell activation and tumor killing activity
To explore the application of this light induced gene expression system in immune cells, we further examined the optogenetic control of immune cell functions in pan-T cells (Human Peripheral Blood CD3+ T Cells, Figure 4A), which was isolated from human peripheral blood mononuclear cells (PBMCs) and transduced with pCDH-OPN4-eGFP construct. The expression of OPN4 in the transduced primary T cells was demonstrated through eGFP expression by flow cytometry; the results showed that the infection efficiency of T cells were about 63% (supplementary Figure S6). In addition, immunofluorescence staining also showed that OPN4 was indeed expressed in primary T cells and nicely localized in the plasma membrane (Figure 4B).
Light-triggered engineered T cell activation, expansion and tumor killing. A) Schematic view of the experimental design. B) Subcellular localization of Flag-OPN4 in PAN T cells. Flag-OPN4 or pCDH control vectors were transduced into PAN T cells. Cells were immuno-stained for detecting OPN4 by Flag antibody followed by Alexa fluor 546 conjugated secondary antibody. Stained cells were visualized by confocal microscope. C) Light triggered cytokine expression at mRNA level. OPN4+ PAN T Cells were transfected with pNFAT-3CK, and the cells were either kept in the dark or exposed to pulsed blue light (0.5 mW/cm2, 60 s on with 60 s interval) for 24 h prior to cell lysis to quantify the cytokine expression at mRNA level. D) Light triggered cytokine expression at protein level. The operation is similar to (C), while the difference is that both light stimulated and dark cells were supplemented with Golgi Stop TM Protein Transport Inhibitor after pulsed blue light illumination for 24 h; afterwards, continue incubating the cells for another 10 h in the presence of pulsed blue light illumination prior to cell fixation and permeabilization. The cells were stained by anti-IL2 (APC conjugated), anti-IL15 (PerCP conjugated) and anti-TNF-α (Alexa 488 conjugated). E) Evaluation of the expansion ability of engineered T cells. The cellular expansion was assessed by flow cytometry of CFSE-stained engineering PAN T cells. F) Cytolytic activity assay of engineered T cells activated by blue light. Engineered T cells and nano-luciferase modified target cells were co-cultured at ratio of 10:1 for 24 h, then either kept in dark or exposed to pulsed blue light; the cells transduced with empty vector were used as negative control. All data were shown as mean ± s.d. from three independent experiments. *P<0.05; **P<0.01; ***P<0.001. The data were analyzed using two-tailed Student's T-test in (C, F).
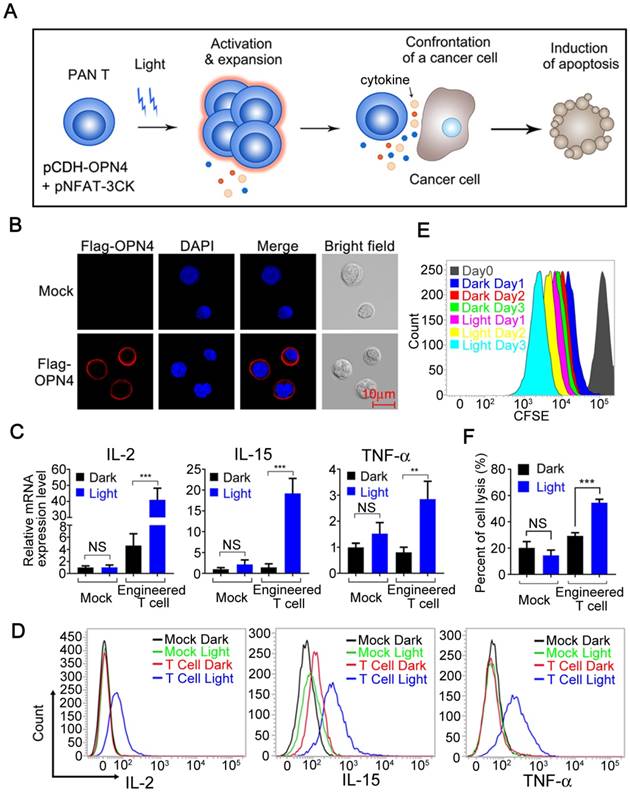
In order to further confirm whether this optogenetic control system can be used in T cells to optically regulate the secretion of specific cytokines, the pan-T Cells (Human Peripheral Blood CD3+ T Cells) were co-infected with the pCDH-OPN4-eGFP and the pNFAT-3CK (IL-2, IL-15 and TNFα) expressing lentivirus, then exposed to blue light illumination. As shown in Figure 4C, a significant up-regulation of IL-2, IL-15 and TNFα mRNA was clearly detected after light stimulation; while in mock-transduced Pan T cells, blue light stimulation was unable to upregulate the expression of these cytokines. To further confirm that blue light illumination also could remarkably boost the production of these cytokines, an intracellular cytokine staining (ICS) assay was established and applied to following studies. As shown in figure 4D, the IL-2, IL-15 and TNFα positive T cell numbers were significantly increased after blue light illumination, which were consistent with the qPCR assay results. Taken together, these data indicated that blue light illumination could remotely control the cytokine expression both in mRNA and protein levels in our engineered T cells.
Since both IL-2 and IL-15 could enhance the proliferation of T cells [19, 21], we then stimulated the carboxyfluorescein diacetate succinimidylester (CFSE) labelled engineered T cells with blue light for 3 days to analyze the proliferation of our engineered T cells by flow cytometry. As shown in Figure 4E, the blue light illumination indeed significantly enhanced the proliferation of our engineered T cells comparing with the cells cultured in dark.
To demonstrate the possible clinical values of this optogenetic control system for boosting immune responses, we examined the ability of this system to enhance the cytotoxicity of engineered T cells. Then, we first setup an in vitro cytotoxicity assay, where the nano-Luciferase [22] overexpressed hepatocellular carcinoma HepG2 cells were co-cultured with our engineered pan-T cells at a ratio of 1:10 in the presence or absence of blue light illumination. As shown in Figure 4F, the killing activity of mock-infected (pCDH control vector) T cells towards HepG2 cells was less than 20% no matter whether stimulated with blue light or not; while the killing activity of our engineered T cells, slightly increased to around 30%, more importantly, the blue light stimulation further elevated the cytotoxicity of our engineered T cells to more than 55% towards target cells. Taken together, the above results clearly showed that our engineered T cells can be activated, expanded, release specific cytokines and ultimately promote tumor cell killing upon optical signal stimulation.
Photoactivatable engineered T cells suppressing tumor growth in hepatocellular carcinoma subcutaneous xenografts
For in vivo study of the tumor inhibition effects of our photoactivatable engineered T cells, we applied a subcutaneous xenograft model in which the transplanted tumors were established in NOD/SCID mice through using SK-HEP-1 nano-Luciferase+ cell line (Figure 5A).
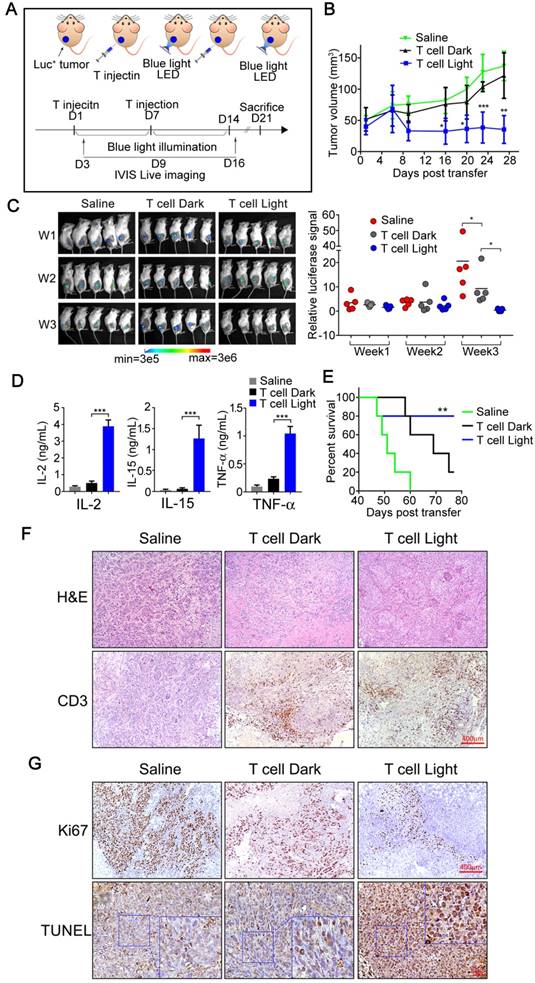
In vivo antitumor responses of Light-triggered engineered T cells to subcutaneous HCC tumor xenografts. A) The experimental design and therapeutic schedule. B) B-NDG mice (8 weeks, n=5) bearing Sk-HEP-1 (nano-Luc+) orthotopic tumor were intra-tumorally injected with 5×10⁶ engineered T cells on the day 1 and 7, respectively. After the first treatment, mice received pulsed blue light illumination (0.5 mW/cm2, 12 h everyday) in the experimental group (from day 1 to day 14). Mice in the other two groups were feed normally. Growth curves of SK-HEP-1 (nano-Luc+) xenograft mice treated either with PBS or engineered T cells in the presence or absence of pulsed blue light illumination. C) Bioluminescent imaging of mice was photographed (upper panel) and the bioluminescent intensities of mice in three groups were assessed (under panel) per week (day 3, day 9 and day 16). D) Cytokines produced by light-triggered engineered T cells were measured in mouse sera post the second T-cell transfer therapy. Data was shown as mean sd. E) Kaplan-Meier survival curve of tumor bearing mice treat with saline (green line), engineered T cells without blue light illumination (black line), and engineered T cells plus blue light illumination (blue line). F) Representative photographs of H&E staining and CD3-positive cells (T cells) in tumor tissues. G) Analysis of cell proliferation (Ki-67) and apoptosis (TUNEL) in tumor tissues. The data were analyzed using two-tailed Student's T-test in (B, C, D).
Considering the limited penetration depth of blue light, we have firstly performed experiments to assess the penetration depth of blue light in tissue before the study of in vivo T cell treatment. As shown in supplementary Figure S7A, the blue light (4mW/cm2) retained weak light intensity (0.3mW/ cm2) after passing through a 5 mm chicken tissue, and the thickness of this chicken tissue is similar with the diameter of our xenograft tumor. To confirm the possible activation of optogenetic system under such low power intensity, the blue light with power intensity of 0.3mW/cm2 was further used to illuminate the engineered 293T cells transfected with pNFAT-mCherry vector. After 24 hours of illumination, the mCherry expression could be nicely induced as speculated (supplementary figure S7B). To further confirm blue light could effectively activate the optogenetic system under mice skin, an ex vivo study was performed. The engineered 293T cells were encapsulated into alginate/poly-L-lysine/alginate beads (APA), and then subcutaneously implanted into mice; afterwards, the implantation area was irradiated by blue light for 24 hours, and then the beads were harvested from mice and visualized under the microscope. As shown in supplementary figure S8A, the transgenic cells were successfully encapsulated; meanwhile, the mCherry expression of transgenic cells inside the subcutaneously implanted beads could be successfully activated by blue light irradiation (supplementary figure S8B). It seems that the blue light could easily penetrate mouse skin (less than 1mm in thickness) and remain sufficient power to trigger the optogenetic system (supplementary figure S8C).
Next, the tumor bearing mice were treated with our engineered T cells or Saline as control (n=5). A total dose of 1×10⁷ engineered T cells were introduced into tumor tissue by intra-tumoral injection, and then the tumor sites of treated animals were illuminated for 7 days with blue light (continuous blue light illumination for 12 hours every day, while the control group was similarly treated but without exposure to blue light). The battery-powered blue light LED device was shown in supplementary figure S2B, and detailly described in the Experimental Section. After 7 days of light illumination, another dose of 1×10⁷ engineered T cells were injected and follow by 7 days of light treatment again (Figure 5A). The tumor size and body weight were measured every 4 days and the body temperature was measured every 2 days. As shown in Figure 5B, tumor growth was efficiently suppressed in mice treated with engineered T cells with light illumination when compared with the saline treated mice or engineered T cells treated mice without light illumination. Meanwhile, the bioluminescence imaging also confirmed the tumor growth inhibition of our photoactivatable engineered T cells with light illumination; as shown in Figure 5C, the bioluminescence signals were gradually declined or even undetectable in some mice after twice injection of engineered T cells with light illumination; meanwhile, all of these treated mice had no obvious weight loss or other visible adverse events except that the body temperature of blue light illuminated group is slightly elevated (supplementary figure S9), which might due to certain side effects caused by cytokine secretion. Thus, these data suggested that our engineered T cells had minimal off-target effects in mice. Furthermore, the engineered T cell treatment with blue light activation could significantly prolong the survival of tumor bearing mice (Figure 5E).
Since the blue light-activated engineered T cells significantly suppress tumor growth in vivo, does these engineered T cells secrete specific cytokines as designed during this process? To further clarify this issue, blood was collected from tail vein at the end of treatment (Day 14) and the levels of specific cytokines were measured by ELISA. The results showed that the levels of IL-2, IL-15 and TNFα were significantly increased in mice treated with engineered T cells with blue light irradiation when compared with Saline treated control mice or treated with engineered T cells but without light irradiation (Figure 5D), indicating that the engineered T cells might be equally activated and could secrete the designed cofactors and cytotoxic factors by light stimulation in vivo.
The clinical therapeutic efficacy of engineered T cell therapy was closely related with T cell proliferation and persistence, especially in solid tumors. T cells need to expand to achieve the required effector/target ratio to eliminate tumor cells in vivo, meanwhile T cell persistence for weeks or more time was also required to eliminate the entire tumor [23]. The above results have demonstrated the anti-tumor effects of our optogenetic engineered T-cells as well as their enhancement of proliferation and cytotoxic effects in mice, while the persistence of T cells was also need to be further investigated. Therefore, the mice after indicated treatment were sacrificed (Day 21) and the tumor tissues were collected and fixed for further investigation. As shown in Figure 5F, the IHC staining indicated obvious CD3+ T cell persistence in tumor tissues in mice injected with engineered T cells but not in mice injected with control saline, therefore clearly proved that the engineered T cells might persist in the tumor site for at least two weeks or more. Meanwhile, the H & E staining showed that the apoptosis was clearly seen in mice treated with engineered T cells with light illumination. To further prove that the tumor cell killing was indeed result from the engineered T cells, TUNEL assay was performed on the tissue slides that were collected after indicated treatment. As shown in figure 5G, the TUNEL-positive cell numbers were dramatically increased in the mice treated with engineered T cells with blue light illumination. Consistently, a reduced number of Ki-67-positive cells was clearly observed in tumors treated with engineered T cells comparing with the tumors treated with saline as control, and blue light irradiation could further reduce the number of Ki-67 positive cells comparing with tumors without light irradiation (Figure 5G). To further distinguish the proliferative Ki67 signal of tumor cells and T cells, a co-staining of CD8 and Ki-67 was performed. The fluorescent IHC images show that most of Ki67 signals are from tumor cells but not CD8+ T cells (supplementary figure S10). The H&E staining of mouse skin demonstrated that no obvious skin damages were observed under the long-term exposure to blue light (supplementary figure S11), suggesting the bio-safety of blue light conditions used in our study.
Taken together, these data clearly demonstrated that our optogenetic engineered T cells could effectively remotely control the inhibition of tumor growth by inducing tumor cell apoptosis and reducing cell proliferation.
In conclusion, we described an engineered remotely control T cell system for solid tumor treatment based on light-sensitive retinal protein melonopsin and pNFAT driven specific cytokine expression. In the optogenetic engineered mammalian cells, blue light illumination could effectively induce intracellular calcium influx then result in dephosphorylation and nuclear translocation of NFAT. Most strikingly, the light-activated CA2+-NFAT signal could further lead to activation, expansion and secretion of specific proliferative and cytotoxic cytokines in immune cells in our design, and finally improve the tumor killing activity and decrease the off-target toxicity of engineered T cells. Taken together, the here presented optogenetic strategy might provide a possible novel way to overcome the intrinsic disadvantages of current T cell therapy.
Discussion
T cell-based immunotherapy has emerged as a powerful treatment strategy for several types of cancer [1], but such success is still not yet explored to the solid tumor treatment. The immunosuppressive microenvironment inside solid tumor which induces T cell dysfunctional is considered to be one of the biggest barriers for immune cell therapy of solid tumors. To overcome such adversity, many strategies have been attempted to promote T cell tumor infiltration [24], to protect T cells from apoptosis [25], or to enhance cytolytic activity of T cells [26]; but the outcomes are still far from satisfactory.
At the meantime, cytokine therapy has been widely accepted and considered as an important treatment approach for solid tumors. For example, IL-2 has already been approved for the treatment of advanced melanoma and metastatic renal cancer [27]; IL-15 has been evaluated in clinical trials [28] and the result showed that IL-15 administration markedly altered homeostasis of lymphocyte subsets in blood and could be safely administered to patients with metastatic malignancy. TNF-α was also used in the regional treatment of advanced local soft tissue sarcomas and metastatic melanomas as well as other irresectable tumors [20]. However, such cytokine therapies have not fulfilled their early promise, since cytokine administration always could not achieve the sufficient therapeutic concentration at the tumor sites but often associated with systematic severe toxicities [29]. Here, we designed an engineered T cell with a transgenic 'payload', to reshape the tumor environment by remotely controllable modulate of the concentrations of transgenic cytokines (IL-2, IL-15 and TNFα) mostly at the tumor sites; by this strategy, we are able to decrease the systematic toxicity of traditional cytokine therapies.
Our results also showed that controllable regulation the release of these cytokines not only promoted the expansion and persistence of T cells inside tumor, but also enhanced the cytolytic activity of the engineered T cells. Although the elevations of IL-2, IL-15 and TNF-α in tumor exhibited effective tumor-killing ability by light control, but meanwhile, such an increase of these cytokines in systematic blood also could cause some side effects such as fever, fatigue, nausea, vomiting and even grade III GVHD[30, 31], which should be closely monitored in clinical transformation in the future. A persistent input signal in our design could effectively maintain the force activation status of engineered T cells and at least partially reverse the dysfunction of T cells; therefore, we might provide a feasible strategy for engineered T cell therapy in solid tumors. Fortunately, our results indeed showed that highly selective optogenetic control of T cell functions at tumor sites was sufficient to overcome the immunosuppressive micro-environment to dramatically improve the therapeutic efficacy of adoptive T cell transfer.
One significant advantage of our optogenetic control system is that it partially achieves the remotely control of this treatment. Comparing with other molecular switch systems, such as small molecules or antibodies, which required secondary injection to deliver them to the site of treatment but with less spatial controllability and stronger toxicity, our optogenetic control system is more convenient and more noninvasive with higher spatial controllability due to the high resolution of light and less toxicity. Moreover, comparing with traditional immunotherapies, the therapy of our engineered cells could specifically happen at tumor site since the light could be merely delivered to the tumor area, which then could reduce damages or side effects of engineered T cells to other normal organs. Thus, our therapeutic strategy may be safer and less suffering. While, the low penetration depth of blue light might limit further clinical translation of our approach. Therefore, development of other optogenetic molecular switches with deeper penetration light in near/far infrared range, or use the latest up-conversion nanotechnology to convert red light into blue light to activate the system, can partially overcome the penetration depth problem and promote clinical translation of such strategies. Recently, novel optogenetic tools that consisted of power receiving coil, circuit and LED and could be fully implanted into deep tissues, have been reported and might also resolve the penetration problem of light [32, 33]. With the improvement of such cutting edge bioengineering technologies, and combination with our engineered T-cells, it might significantly promote immune cell therapies and their clinical translation for solid tumors.
Methods
Cell culture
Human hepatocellular carcinoma cell lines (HepG2, SK-HEP-1) and Human Embryonic Kidney cell line (HEK-293T) were purchased from the American Type Culture Collection. Human hepatocellular carcinoma cell line, HeLa cell was purchased from the Cell Bank of Type Culture Collection of the Chinese Academy of Sciences. The HEK-293T and HeLa cells were cultured in Dulbecco's modified Eagle medium (DMEM, Invitrogen) supplemented with 10% fetal bovine serum (Invitrogen), 100 U/ml penicillin (Invitrogen) and 100 μg/ml streptomycin (Invitrogen). HepG2 and SK-HEP-1 cells were cultured in minimal essential medium (MEM; Invitrogen) supplemented with 10% fetal bovine serum (Invitrogen), 100 U/ml penicillin (Invitrogen) and 100 µg/ml streptomycin (Invitrogen). All cell lines were maintained at 37°C in a humidified incubator containing 5% CO2. All Cells were tested every three months for potential mycoplasma contamination. From transfection until recording, the cultured cells were supplemented with 100μM all trans-Retinal (Sigma, cat.no.2500), and kept in darkness except for exposure to blue light.
Plasmids
DNA sequences encoding human melanopsin (GenBank accession number NM_033282) with or without a 3×Flag tag sequence at C-terminal was synthesized by Genewiz (Suzhou, China) and subcloned into pCDH-CMV-MCS-EF1-Puro (System Biosciences) and pCDH-CMV-MCS-EF1-copGFP-T2A-Puro (System Biosciences) lentivectors using EcoRI-BamHI restriction sites. pNFAT-Luc was purchased from Clontech Laboratories, Inc. To generate the pNFAT-mCherry plasmid, the sequence encoding mCherry was amplified by PCR from pmCherry-N1 Vector (Clontech), then the luciferase cassette was removed from pNFAT-Luc by Hind III-Xba I digestion followed by plasmid backbone purification and re-ligation with mCherry fragment. To generate the pNFAT-IL2-IL15-TNFα lentivectors, each gene's ORF (IL-2: NM_000586; IL-15: NM_172175; TNFα: NM_000594) was synthesized and interval by 2A peptide nucleotide sequence flanked by ClaI and BamHI sites, with four repeating NFAT response element sequences and TATA-like promoter sequence at the upstream of the initiation codon; the pCDH- CMV-MCS-EF1-copGFP-T2A-Puro (System Biosciences) lentivector was digested with ClaI and BamHI to remove the CMV promoter; the synthetic pNFAT- IL2-IL15-TNFα sequence was then inserted into the ClaI and BamHI digested pCDH vector. To generate the mCherry-NFAT plasmid, the DNA sequence encoding NFAT (1-460) (NM_001136021) was synthesized by Genewiz (Suzhou, China) and subcloned into pmCherry-N1 (Clontech) using XhoI-EcoRI restriction sites. The GCaMP6s plasmid was purchased from Addgene (#40753).
Lentivirus production and infection
Lentivirus was prepared according to the manufacturer's instructions (System Bioscience). Briefly, HEK-293T cells were seeded at 5×10⁶ per 10cm petri-dish 24 h before transfection. Cells were transfected using lipofectamine 3000 (Thermo Fisher Scientific) with 5μg of RRE, 1.25μg of REV, 1.25μg of VSV/G, and 7.5μg of lentiviral vector. After 20 hours of transfection, the supernatant was replaced by fresh culture medium. Afterwards, the cell culture medium was collected at 48 and 72 hours of post-transfection and stored at 4℃ until the virus supernatant to be concentrated. Then, the viral particles were concentrated 200-folds by ultracentrifugation (Beckman Optima XPN-100, Beckman) for 90 min at 30,000 rpm, 4°C. Finally, the lentiviral titration was detected by QuickTiter™ Lentivirus Titer Kit (Cell Biolabs, USA). To infect target cells, media were replaced with fresh media supplemented with 8 μg/ml polybrene (Santa Cruz Biotechnology) and lentiviruses were added directly into the media. Media were replaced after 2 days and puromycin (Sangon Biotech, Shanghai, China) selection began at a concentration of 0.5 μg/ml for 5 days.
Immunofluorescence staining
The HEK-293T cells or PAN T cells were infected with pCDH-Flag-OPN4 lentivirus. After 48 hours of infection, the cells were fixed in 4% paraformaldehyde, then blocked and incubated with anti-Flag antibody (Origene, diluted 1:1000, for OPN4 staining) followed by Alexa Fluor 546-conjugated secondary antibody (Thermo Fisher, diluted 1:200) incubation. Cells were further incubated with 4',6-diamidino-2-phenylindole (Sigma, 50 μg/ml) to stain the nuclei. Finally, the stained cells were visualized by confocal microscope (Zeiss LSM780).
Calcium imaging
The HEK293T-OPN4 stable cells were transfected with green calcium indicator GCaMP6s plasmid using lipofectamine 3000 (Thermo Fisher Scientific) on a Glass Bottom petri-Dish (NEST Biotechnology, Wuxi, China). Briefly, the cells were incubated with transfection reagents for 6 h, then returned to fresh cell culture medium and allowed for further growth of 18 h. For calcium imaging analysis, the glass-bottom petri-dish was mounted on a LSM 780 confocal microscope (Zeiss) and a 488-nm laser was used to excite the green calcium indicator GCaMP6s, and the corresponding calcium signals were detected after additional blue light LED illumination. The calcium imaging with Fluo-4 AM (Molecular Probes) were performed according to the manufacturer's instructions. Briefly, the engineered 293T cells were seeded on a glass bottom-dish one day before imaging; then the cells were incubated with fluo-4 AM (4 μm) for 30 minutes at 37℃, followed by washing with HBSS buffer (Gibco) for 3 times, and then further incubated with HBSS buffer for another 30 minutes before imaging under confocal microscope.
NFAT-dependent luciferase reporter assay
The HEK293T-OPN4 stable cells were seeded in 24-well plates and co-transfected with the firefly luciferase reporter gene (pNFAT-Luc) and β-galactosidase (β-gal). After transfection, the cell lysates were prepared and luciferase activity was assayed by using the Bright-Glo Luciferase Assay System (Promega) according to manufacturer's instructions, and the β-galactosidase activity was determined using the β-galactosidase enzyme assay system (Promega) according to manufacturer's instructions. Finally, the luciferase activity was normalized to the transfection efficiency by using the corresponding β-gal activity as control. The ratio of luciferase/β-gal activity was used as the indicator of NFAT transcriptional activity.
Real-time PCR analysis
Total RNA was isolated from transduced 293T cells or PAN-T cells using the TRIzol reagent (Invitrogen) and the first-strand cDNA was synthesized using the Transcriptor First Strand cDNA Synthesis Kit (Roche, Germany) according to manufacturer's instructions. Real-time PCR was performed using the SYBR Green ER qPCR Super Mix Universal kit (Invitrogen) with specific primers listed below by using ABI StepOnePlus Real-Time PCR System (Applied Biosystems). The primer sequences are as follows, GAPDH-F: AGCCACATCGCTCAGACAC, GAPDH-R: GCCCAATACGACCAAATCC; IL2-F: ATTACAAGAATCCCAAACTCACCAGG, IL2-R: TGTTGTTTCAGATCCCTTTAGTTCCA; IL15-F: TTGGGAACCATAGATTTGTGCAG, IL15-R: GGGTGAACATCACTTTCCGTAT; TNF-F: CGCTCTTCTGCCTGCTGCACTTTGGA, TNF-R: TAGGAGACGGCGATGCGGCTGATGGT.
Isolation, activation, transduction, and expansion of primary human T cells
Peripheral blood mononuclear cells (PBMCs) were obtained from healthy volunteer donors, and cryopreserved in 90% FBS plus 10% DMSO until to be used. Before activation, the T cells were isolated from PBMCs by negative selection using Pan T Cell Isolation Kit (Miltenyi Biotec, Bergisch-Gladbach, Germany) following the manufacturer's instructions. Then, primary T cell were cultured in complete medium (AIM-V supplemented with 10% heat-inactivated FBS, 100 U/mL penicillin, 100 μg/mL streptomycin) and stimulated for 24 hours with anti-CD3/anti-CD28 mAbs-coated beads (Thermo, USA) at a ratio of cell:bead =1:1 in accordance with the manufacturer's instructions. Afterwards, the T cells were suspended at a concentration of 1×10⁶ cell/ mL and then transduced with the lentiviral vector at a multiplicity of infection of 5~10 pfu/cell supplemented with 1μg/mL of polybrene (Santa Cruz, USA). After 24 hours, the cell culture medium was changed to fresh medium. The transduced T cells were cultured in complete medium supplemented with10% FBS and 500 U/mL recombinant human IL-2 (Shanghai Huaxin High Biotech) and maintained the cell density at a range of 5 105 to 2
 106 cells/mL. The study was approved by the Medical Ethics Committee of Mengchao Hepatobiliary Hospital of Fujian Medical University. The written consents were received from all volunteers at the time of blood collection.
Cytotoxicity and proliferation assays in vitro
Cytotoxicity assay was performed as described [34] with slight modifications. Firstly, the target cells (HepG2) were infected with Nano-luciferase (Nano-Luc) lentivirus to establish a stable tumor cell line expressing Nano-luciferase as previously mentioned in this study. For cell-based bioluminescence assay, 1X10⁵ engineered T cells and 1X10⁴ of Nano-luciferase expressing (Nano-Luc) Target cells (HepG2) were cultured at a ratio of E:T=10:1 in T cell culture medium (AIM-V supplemented with 10% FBS and 100μM all trans-retinal) in a 96-well microplate (Corning, USA), and cultured for 24 hours with blue light illumination or in dark, then the luciferase activity of the cultured supernatant was assessed using the Nano-Glo ® Live Cell Reagent kit (Promega, USA), according to manufacturer's instructions with a luminometer as relative light units (RLU). Target cells were treated with lysis buffer (provided by the Nano-Glo ® Live Cell Reagent kit) as a measure of maximal killing. Target cells incubated without effector cells were used to measure spontaneous death RLU. Values from four wells were averaged and the lysis percent was calculated from the data with following equation: % specific lysis = 100 X (spontaneous death RLU - test RLU) / (spontaneous death RLU - maximal killing RLU).
For the proliferation assay, the engineered T cells were labeled with Carboxy Fluorescein Succinimidyl Ester (CFSE; Molecular Probes, Thermo, USA) at a concentration of 1 μM according to the manufacture's instructions. Then, the labeled T cells were cultured in T cell culture medium (AIM-V supplemented with 10% FBS and 100μM all trans-retinal) without IL2, and subsequently exposed to blue light pulses for different time as indicated. At each time point, the T cells were harvested and analyzed by a flow cytometry (BD FACSVerse, BD Biosciences).
Cytokine release assay
The IL-2, IL-15 and TNF-α that were expressed by the engineered 293T and T cells were analyzed by using RT-qPCR, ELISA or intracellular staining. ELISA was performed using the Quantikine ELISA Kit (R&D) according to the manufacture's instructions. Intracellular cytokine staining was performed as described previously [35]. Briefly, 1X10⁶ of engineered T cells were cultured in T cell culture medium (AIM-V supplemented with 10% FBS and 100μM all trans-retinal, IL-2 free) in 24-well plates with or without blue light illumination for 14 h. Then the cells were treated with 1 μl/ml Golgi Stop TM Protein Transport Inhibitor (BD Pharmingen, USA) and illuminated by blue light or not for another 10 h. The cells were washed with PBS, follow by fixed and permeabilized using the Cytofix/Cytoperm plus Fixation/Permeabilization kit (BD Pharmingen, USA), according to the manufacturer's instructions, and stained for intracellular cytokines: IL-2 (APC conjugated, eBioscience, San Diego, CA), IL-15 (percp conjugate, Thermo, San Diego, CA), and TNF-a (Alexa 488 conjugate, Thermo, San Diego, CA), respectively. After two washes in 1×BD Perm/Wash buffer (provided by the Cytofix/ Cytoperm plus Fixation/Permeabilization kit), the stained cells were analyzed by flow cytometry (BD FACSVerse).
Xenograft models of human hepatocellular carcinoma
The animal experiments were approved by Fuzhou Medical Experimental Animal Care Commission. All mice were housed and maintained under pathogen-free conditions in accordance with the institutional guidelines of the Experimental Animal Center of Fuzhou General Hospital. For all animal experiments, mice in a NOD/SCID/IL2rg-/-(NSG) background were used [36] (Jiangsu Biocytogen. Co. Ltd, Nantong, China). The establishment of SK-HEP-1 xenograft models were performed as previous described [37], 5- to 6-week-old female mice were inoculated subcutaneously with 5 106 Sk-HEP-1 cells on the right flank. Growth of the established tumor xenografts was monitored through measurement of the length (a) and width (b) of the tumor. The tumor volume was calculated as (a × b2)/2. When the tumor volume was approximately 60-100 mm3, mice were randomly allocated into three groups (n=5) and the mice were given intratumor injection of engineered T cells (6
 106 in 200-μl saline) or 200 μl saline as indicated. Mice in the experimental group were illuminated with blue light pulse for 12 hours daily. In this process, the back of the tumor bearing mice was molted by depilatory agent to improve light exposure.
Light stimulation
For in vitro light stimulation, a blue light tube as shown in supplementary figure 8 was used. The peak light output of the LED tube was 460 nm. The cells were cultured in 24-well or 6 well plate (corning) with a 10-15 cm distance from the LED tube. The blue light output power at the position of the culture plate was measured with an optical power meter (Thorlabs PM200) equipped with a thermal power sensor (S120VC) and the light power was 0.4-0.8 mW/cm2. The blue light pulses were adjusted to 60 s ON and 60 s OFF using a Smart Mini Wifi Plug (Konke).
For long-term in vivo light exposure in freely moving mice, a battery-powered blue light LED (460 nm) was glued to the mouse back (supplementary figure 9). The blue light output power during light stimulation was measured with an optical power meter (Thorlabs PM200) equipped with a thermal power sensor (S120VC) and the light power was 4mW/cm2 (460nm) at the surface of LED. The mice were illuminated with blue light 12 h everyday and last for 14 days.
Bioluminescence imaging
Pentobarbital sodium-anesthetized animals were imaged using the IVIS system (IVIS) after the intraperitoneal injection of 100 folds diluted Nano-Glo Substrate and incubate for 5min according to the manufacturer's instructions. The data were quantified using Living Image software (SI Imaging AmiX).
Histology and staining
Tumor tissues were collected and fixed for 24 h in formalin, then paraffin embedded and sectioned into slices. Tissue sections were stained with hematoxylin and eosin, or were immune-stained using anti human ki-67 antibody (Abcam, USA), anti human CD3 antibody (Abcam USA) with an immunohistochemical staining kit (Maixin Bio, China), according to the manufacturer's instructions. For TUNEL assay, DeadEnd™ Colorimetric TUNEL System kit (Promega, Madison, WI) was used in accordance with the manufacturer's instructions.
Statistical analysis
All results are expressed as the mean ± s.d. or the mean ± s.e.m. as indicated. Biological replicates were used in all experiments unless otherwise stated. The statistical analysis of different groups is realized using the two-tailed Student's T-test. Survival benefit was determined using a log-rank test. All statistical analysis was performed using the Prism software package (GraphPad_Prism_7.0 Software, USA, 2007).
Acknowledgements
This work was supported by the National Natural Science Foundation of China (81672376), Natural Science Foundation of Fujian Province of China (2016J01417), Science and Technology Foundation of Fuzhou City (2015-S-143-19), Science and Technology Foundation of Fuzhou Health and Family Planning System (2017-S-wt2, 2016-S-wt6), Fujian Provincial Health and Family Planning Commission medical innovation project (2016-CX-48).
Author contributions
B.Z., Y.W., X.L. and J.L conceived, developed and mentored the project. B.Z., Y.W., X.Z., F.W., X.T. and K.K. performed the experiments. C.Z., Y.G., N.L., Y.D., Y.S., Y.Z. and Q.L provided technical and material support. B.Z., Y.W. and X.L. analyzed the data. B.Z. and X.L. wrote the manuscript.
Supplementary Material
Supplementary figures and tables.
Movie 1.
Movie 2.
Movie 3.
Movie 4.
Movie 5.
Movie 6.
Competing Interests
The authors have declared that no competing interest exists.
References
1. Lizee G, Overwijk WW, Radvanyi L, Gao J, Sharma P, Hwu P. Harnessing the power of the immune system to target cancer. Annu Rev Med. 2013;64:71-90
2. Khalil DN, Smith EL, Brentjens RJ, Wolchok JD. The future of cancer treatment: immunomodulation, CARs and combination immunotherapy. Nat Rev Clin Oncol. 2016;13:273-90
3. Restifo NP, Smyth MJ, Snyder A. Acquired resistance to immunotherapy and future challenges. Nat Rev Cancer. 2016;16:121-6
4. Chmielewski M, Hombach AA, Abken H. Of CARs and TRUCKs: chimeric antigen receptor (CAR) T cells engineered with an inducible cytokine to modulate the tumor stroma. Immunol Rev. 2014;257:83-90
5. Zhang L, Morgan RA, Beane JD, Zheng Z, Dudley ME, Kassim SH. et al. Tumor-infiltrating lymphocytes genetically engineered with an inducible gene encoding interleukin-12 for the immunotherapy of metastatic melanoma. Clin Cancer Res. 2015;21:2278-88
6. Fischbach MA, Bluestone JA, Lim WA. Cell-based therapeutics: the next pillar of medicine. Sci Transl Med. 2013;5:179ps7
7. Muller K, Weber W. Optogenetic tools for mammalian systems. Mol Biosyst. 2013;9:596-608
8. Takayama K, Mizuguchi H. Generation of Optogenetically Modified Adenovirus Vector for Spatiotemporally Controllable Gene Therapy. ACS Chem Biol. 2018;13:449-54
9. Ma G, Wen S, He L, Huang Y, Wang Y, Zhou Y. Optogenetic toolkit for precise control of calcium signaling. Cell Calcium. 2017;64:36-46
10. Ye H, Daoud-El Baba M, Peng RW, Fussenegger M. A synthetic optogenetic transcription device enhances blood-glucose homeostasis in mice. Science. 2011;332:1565-8
11. Hannanta-anan P, Chow BY. Optogenetic control of calcium oscillation waveform defines NFAT as an integrator of calcium load. Cell systems. 2016;2:283-8
12. Fenno L, Yizhar O, Deisseroth K. The development and application of optogenetics. Annu Rev Neurosci. 2011;34:389-412
13. He L, Zhang Y, Ma G, Tan P, Li Z, Zang S. et al. Near-infrared photoactivatable control of Ca(2+) signaling and optogenetic immunomodulation. Elife. 2015:4
14. Kim KD, Bae S, Capece T, Nedelkovska H, de Rubio RG, Smrcka AV. et al. Targeted calcium influx boosts cytotoxic T lymphocyte function in the tumour microenvironment. Nat Commun. 2017;8:15365
15. Tan P, He L, Han G, Zhou Y. Optogenetic Immunomodulation: Shedding Light on Antitumor Immunity. Trends Biotechnol. 2017;35:215-26
16. Muller MR, Rao A. NFAT, immunity and cancer: a transcription factor comes of age. Nat Rev Immunol. 2010;10:645-56
17. Macian F. NFAT proteins: key regulators of T-cell development and function. Nat Rev Immunol. 2005;5:472-84
18. Rosenberg SA. IL-2: the first effective immunotherapy for human cancer. J Immunol. 2014;192:5451-8
19. Steel JC, Waldmann TA, Morris JC. Interleukin-15 biology and its therapeutic implications in cancer. Trends Pharmacol Sci. 2012;33:35-41
20. van Horssen R, Ten Hagen TL, Eggermont AM. TNF-alpha in cancer treatment: molecular insights, antitumor effects, and clinical utility. Oncologist. 2006;11:397-408
21. Boyman O, Sprent J. The role of interleukin-2 during homeostasis and activation of the immune system. Nat Rev Immunol. 2012;12:180-90
22. Hall MP, Unch J, Binkowski BF, Valley MP, Butler BL, Wood MG. et al. Engineered luciferase reporter from a deep sea shrimp utilizing a novel imidazopyrazinone substrate. ACS Chem Biol. 2012;7:1848-57
23. Lim WA, June CH. The Principles of Engineering Immune Cells to Treat Cancer. Cell. 2017;168:724-40
24. Caruana I, Savoldo B, Hoyos V, Weber G, Liu H, Kim ES. et al. Heparanase promotes tumor infiltration and antitumor activity of CAR-redirected T lymphocytes. Nat Med. 2015;21:524-9
25. Hu ZI, Ho AY, McArthur HL. Combined Radiation Therapy and Immune Checkpoint Blockade Therapy for Breast Cancer. Int J Radiat Oncol Biol Phys. 2017;99:153-64
26. Ishiguro T, Sano Y, Komatsu SI, Kamata-Sakurai M, Kaneko A, Kinoshita Y. et al. An anti-glypican 3/CD3 bispecific T cell-redirecting antibody for treatment of solid tumors. Sci Transl Med. 2017:9
27. Pili R, Quinn DI, Hammers HJ, Monk P, George S, Dorff TB. et al. Immunomodulation by Entinostat in Renal Cell Carcinoma Patients Receiving High-Dose Interleukin 2: A Multicenter, Single-Arm, Phase I/II Trial (NCI-CTEP#7870). Clin Cancer Res. 2017
28. Conlon KC, Lugli E, Welles HC, Rosenberg SA, Fojo AT, Morris JC. et al. Redistribution, hyperproliferation, activation of natural killer cells and CD8 T cells, and cytokine production during first-in-human clinical trial of recombinant human interleukin-15 in patients with cancer. J Clin Oncol. 2015;33:74-82
29. Waldmann TA. Cytokines in Cancer Immunotherapy. Cold Spring Harb Perspect Biol. 2017
30. Higuchi CM, Thompson JA, Petersen FB, Buckner CD, Fefer A. Toxicity and immunomodulatory effects of interleukin-2 after autologous bone marrow transplantation for hematologic malignancies. Blood. 1991;77:2561-8
31. Di Scala M, Gil-Farina I, Olague C, Vales A, Sobrevals L, Fortes P. et al. Identification of IFN-gamma-producing T cells as the main mediators of the side effects associated to mouse interleukin-15 sustained exposure. Oncotarget. 2016;7:49008-26
32. Kim TI, McCall JG, Jung YH, Huang X, Siuda ER, Li Y. et al. Injectable, cellular-scale optoelectronics with applications for wireless optogenetics. Science. 2013;340:211-6
33. Montgomery KL, Yeh AJ, Ho JS, Tsao V, Mohan Iyer S, Grosenick L. et al. Wirelessly powered, fully internal optogenetics for brain, spinal and peripheral circuits in mice. Nat Methods. 2015;12:969-74
34. Karimi MA, Lee E, Bachmann MH, Salicioni AM, Behrens EM, Kambayashi T. et al. Measuring cytotoxicity by bioluminescence imaging outperforms the standard chromium-51 release assay. PLoS One. 2014;9:e89357
35. Becker TC, Wherry EJ, Boone D, Murali-Krishna K, Antia R, Ma A. et al. Interleukin 15 is required for proliferative renewal of virus-specific memory CD8 T cells. J Exp Med. 2002;195:1541-8
36. Xiao X, Li H, Jin H, Jin J, Yu M, Ma C. et al. Identification of 11(13)-dehydroivaxillin as a potent therapeutic agent against non-Hodgkin's lymphoma. Cell Death Dis. 2017;8:e3050
37. Gao H, Li K, Tu H, Pan X, Jiang H, Shi B. et al. Development of T cells redirected to glypican-3 for the treatment of hepatocellular carcinoma. Clin Cancer Res. 2014;20:6418-28
Author contact
![]() Corresponding authors: xiaoloong.liucom and drjingfengcom
Corresponding authors: xiaoloong.liucom and drjingfengcom