Impact Factor
- Issue 13; 2026
- Issue 12; 2026
- Issue 11; 2026
- Issue 10; 2026
- Issue 9; 2026
- Volume 16; 2026
- Advance Articles
- Past Issues
- Cover Images
- Cover Suggestion
- Index & Coverage
- Special Issues
Introduction
Materials and Methods
Results and Discussion
Conclusions
Abbreviations
Supplementary Material
Acknowledgements
References
International Journal of Biological Sciences
International Journal of Medical Sciences
 Global reach, higher impact

Theranostics 2019; 9(6):1764-1776. doi:10.7150/thno.31233 This issue Cite
Research Paper
Composition-Tunable Ultrasmall Manganese Ferrite Nanoparticles: Insights into their In Vivo T1 Contrast Efficacy
Yuqing Miao1*, Qian Xie2*, Huan Zhang1, Jing Cai3, Xiaoli Liu1, Ju Jiao4, Shanshuang Hu5, Anujit Ghosal1, Yu Yang5, Haiming Fan1 ![]()
1. Key Laboratory of Synthetic and Natural Functional Molecule Chemistry of the Ministry of Education, College of Chemistry and Materials Science, Northwest University, Xi'an, Shaanxi 710069, China.
2. Division of nephrology, Peking University Third Hospital, Beijing, China.
3. State Key Laboratory of Oncology in South China, Sun Yat-sen University Cancer Center, Collaborative Innovation Center for Cancer Medicine, Guangzhou 510060, China.
4. Department of Nuclear Medicine, The Third Affiliated Hospital of Sun Yat-sen University, 600 Tianhe Road, Guangzhou, Guangdong 510630, China.
5. School of Life Sciences, National Engineering Research Center for Miniaturized Detection Systems, Northwest University, Xi'an, Shaanxi, China.
*Yuqing Miao and Qian Xie have equal contribution.
Received 2018-11-4; Accepted 2019-1-22; Published 2019-2-28
Abstract

The development of a highly efficient, low-toxicity, ultrasmall ferrite nanoparticle-based T1 contrast agent for high-resolution magnetic resonance imaging (MRI) is highly desirable. However, the correlations between the chemical compositions, in vitro T1 relaxivities, in vivo nano-bio interactions and toxicities remain unclear, which has been a challenge in optimizing the in vivo T1 contrast efficacy.
Methods: Ultrasmall (3 nm) manganese ferrite nanoparticles (MnxFe3-xO4) with different doping concentrations of the manganese ions (x = 0.32, 0.37, 0.75, 1, 1.23 and 1.57) were used as a model system to investigate the composition-dependence of the in vivo T1 contrast efficacy. The efficacy of liver-specific contrast-enhanced MRI was assessed through systematic multiple factor analysis, which included the in vitro T1 relaxivity, in vivo MRI contrast enhancement, pharmacokinetic profiles (blood half-life time, biodistribution) and biosafety evaluations (in vitro cytotoxicity testing, in vivo blood routine examination, in vivo blood biochemistry testing and H&E staining to examine the liver).
Results: With increasing Mn doping, the T1 relaxivities initially increased to their highest value of 10.35 mM-1s-1, which was obtained for Mn0.75Fe2.25O4, and then the values decreased to 7.64 m M-1s-1, which was obtained for the Mn1.57Fe1.43O4 nanoparticles. Nearly linear increases in the in vivo MRI signals (ΔSNR) and biodistributions (accumulation in the liver) of the MnxFe3-xO4 nanoparticles were observed for increasing levels of Mn doping. However, both the in vitro and in vivo biosafety evaluations suggested that MnxFe3-xO4 nanoparticles with high Mn-doping levels (x > 1) can induce significant toxicity.
Conclusion: The systematic multiple factor assessment indicated that the MnxFe3-xO4 (x = 0.75-1) nanoparticles were the optimal T1 contrast agents with higher in vivo efficacies for liver-specific MRI than those of the other compositions of the MnxFe3-xO4 nanoparticles. Our work provides insight into the optimization of ultrasmall ferrite nanoparticle-based T1 contrast agents by tuning their compositions and promotes the translation of these ultrasmall ferrite nanoparticles for clinical use of high-performance contrast-enhanced MRI.
Keywords: ultrasmall ferrite nanoparticles, composition effect, MRI, in vivo T1 contrast efficacy
Introduction
There has been increasing interest in the application of ultrasmall ferrite nanoparticles (UFNPs) in nanomedicine due to their uniquely appealing magnetic resonance (MR) T1 contrast effects [1-8]. In comparison with commercial Gd-based T1 contrast agents, UFNPs with sizes smaller than 5 nm have exhibited enhanced r1 relaxivities [8] and improved biosafety [9]. Previous studies have indicated that the in vitro T1 contrast ability of the UFNPs is closely correlated with their material parameters, such as size [1, 5, 10], composition [7, 11, 12] and surface chemistry [10, 13]. To achieve efficient MR T1 contrast agents, efforts have been devoted to chemically tailoring the material parameters of UFNPs to maximizing the r1 relaxivity. However, enhancement of the in vitro r1 relaxivity alone is inadequate for generating high- performance UFNP-based MR T1 contrast agents. Multiple biological steps are involved in the systemic delivery of contrast agents to biological targets, and the biosafety of the agents can influence their in vivo T1 contrast efficacies [9, 14-18]. In fact, both experimental results and clinical data have verified that the in vivo efficacies of contrast agents are determined by a complex interplay of the in vitro T1 relaxivity, the in vivo nano-bio interactions and their toxicity. As a result, their blood circulation, biodistribution and toxicity effects are important factors to consider along with their r1 relaxivity [19-21]. Significantly, a variation in any material parameter can alter all related factors, resulting in an unpredictable in vivo T1 contrast efficacy [16]. For example, in addition to the T1 relaxivity dependence, the proper size selection of UFNPs can prolong their blood circulation times, which in turn leads to high accumulation in targeting tissue and greater in vivo contrast efficacy [1, 7]. Therefore, understanding the correlations between the material parameters of UFNPs and their in vitro T1 relaxivities, in vivo nano-bio interactions and biosafety is of importance for translating UFNPs into clinical applications.
Among the various chemically tunable material parameters of UFNPs, the UFNP composition has been shown to have a significant impact on the T1 relaxivities [22]. In particular, ultrasmall manganese ferrite nanoparticles (UMFNPs) can possess a larger r1 relaxivity (up to 1.7 times greater) than that of maghemite nanoparticles of the same size. A similar composition dependence of the T2 relaxivity has also been reported for large-sized manganese ferrite nanoparticles [23]. Moreover, higher particle accumulation in the liver has been found for UMFNPs due to Mn2+ doping [7], which suggests that the UMFNPs have a unique compositional effect on the in vivo nano-bio interactions. In addition, the release of Mn2+ may potentially increase the toxicity, which should be optimized [24]. However, the interplay of the Mn2+ composition and the in vitro T1 relaxivity, in vivo nano-bio interactions and toxicity remains unclear, despite UMFNPs being considered potential MRI T1 contrast agents for liver-specific MRI.
In this study, we investigated in vivo T1 contrast efficacy of composition-tunable UMFNPs to address the concerns of the tunability of in vitro T1 relaxivities, in vivo nano-bio interactions and toxicities of UFNPs. MnxFe3-xO4 nanoparticles (3 nm, x = 0.32, 0.37, 0.75, 1, 1.23 and 1.57) were used as a model system to assess the in vivo liver-specific contrast efficacy of UMFNPs in mice. The surface functionalization was optimized in terms of the colloidal stability and T1 enhancement ability using phosphorylated mPEG with different molecular weights. The compositional dependence of their in vitro T1 relaxivities, pharmacokinetic behaveiors and biosafety characteristics were systematically evaluated. While Mn0.75Fe2.25O4 exhibited the largest r1 relaxivity value of 10.35 mM-1s-1, the greatest MRI signal enhancement (ΔSNR) of the liver has been obtained by using Mn1.57Fe1.43O4 due to its high liver accumulation. However, high Mn doping concentrations (x = 1.23 and 1.57) simultaneously induced significant cytotoxicity. The comprehensive results indicated that MnxFe3-xO4 nanoparticles with Mn-doping concentrations between 0.75 and 1 can exhibit high in vivo liver-specific contrast efficacy. This work aims to provide a clear relationship between the compositional characteristics and the in vivo T1 contrast efficacy of UMFNPs. The results obtained from the current work may provide guidance for the chemical design and preclinical assessment of UFNP-based MR T1 contrast agents and facilitate their clinical translation.
Materials and Methods
Materials
Absolute ethanol, methanol, hexane, ferric chloride hexahydrate (> 99.0%), manganese chloride tetrahydrate (> 99.0%), sodium hydroxide (> 96%), tetrahydrofuran (> 99.0%), chloroform (> 99.0%) were used as received. Benzyl ether (98%), oleic acid (90%), oleyl alcohol (65.0%) and Poly (ethylene glycol) methyl ether (flakes, average Mn ~1,000, ~2,000 and ~5,000) were purchased from Aldrich Chemical Co. Erucic acid was purchased from Aladdin Industrial Corporation.
Synthesis of 3 nm MnxFe3-xO4 Nanoparticles
The iron-eruciate and manganese-oleate precursors were synthesized using previously reported procedures [7]. MnxFe3-xO4 nanoparticles (3 nm) were prepared by a general method for the dynamic simultaneous thermal decomposition (DSTD) of the precursors. A typical synthesis of the Mn0.75Fe2.25O4 nanoparticles is briefly described as follows: 1.4 g (1.3 mmol) of the iron-eruciate complex, 0.57 g (2 mmol) of oleic acid, 0.62 g (1 mmol) of the Mn-oleate complex, and 1.61 g (6 mmol) of oleyl alcohol were dissolved in 10 g of benzyl ether. The reaction mixture magnetically stirred under a flow of argon. The reaction mixture was heated to 265 °C with a constant rate of 5 °C/min, and the kept that temperature for 30 min. The resulting solution containing the nanoparticles was then rapidly cooled to room temperature. A black powder was precipitated by the addition of ethanol to the reaction mixture and was then isolated by centrifugation. The isolated UMFNPs were dispersed in hexane for further use. UMFNPs with different Mn doping levels were prepared by mixing different ratios of the precursor under identical conditions. Detailed reaction parameters are summarized in Table 1.
Detailed Synthetic Parameters for Ultrasmall MnxFe3-xO4 Nanoparticles
| Samples | Fe- eruciate (g) | Mn- oleate (g) | Oleyl alcohol (g) | Oleic acid (g) | Benzyl Ether (g) | Heating rate (℃/min) | Aging temperature (℃) |
|---|---|---|---|---|---|---|---|
| Mn0.32Fe2.68O4 | 2.14 | 0.62 | 1.61 | 0.57 | 10 | 5 | 260 |
| Mn0.37Fe2.63O4 | 1.82 | 0.62 | 1.61 | 0.57 | 10 | 5 | 260 |
| Mn0.75Fe2.25O4 | 1.40 | 0.62 | 1.61 | 0.57 | 10 | 5 | 260 |
| MnFe2O4 | 1.07 | 0.62 | 1.61 | 0.57 | 10 | 5 | 260 |
| Mn1.23Fe1.77O4 | 1.07 | 0.93 | 1.61 | 0.57 | 10 | 5 | 260 |
| Mn1.57Fe1.43O4 | 1.07 | 1.24 | 1.61 | 0.57 | 10 | 5 | 260 |
Preparation of phosphorylated mPEG coated MnxFe3-xO4 nanoparticles
Phosphorylated mPEG was synthesized by reacting POCl3 with mPEG as previously reported [25]. In a typical process, 10 mg of MnxFe3-xO4 nanoparticles and 50 mg of phosphorylated mPEG were transferred into 10 mL of chloroform. Next, the mixture was shaken continuously over a period of 5 h to remove the chloroform and obtain functionalized UMFNPs. Finally, 5 ml of water was added to redisperse the nanoparticles, and passed through a 0.22 µm syringe filter and stored at 4 °C until use.
Characterization
X-ray powder diffraction studies patterns were obtained with a Bruker D8 Advanced Diffractometer System equipped with Cu/Kα radiation (λ = 1.5418 Å). Transmission electron microscopy (TEM) images were obtained on a field-emission transmission electron microscope (Tecnia G2 F20 S-Twin, FEI, operated at 200 kV). The mean particle sizes were obtained from digital TEM images by counting more than 200 particles. Magnetic properties studies were carried out using a superconducting quantum interference device (SQUID) magnetometer (MPMS- XL-7) with the magnetic field up to 3 T. The hydrodynamic diameters of the UMFNPs were measured by Malvern Zetasizer nano-ZS dynamic light scatting (DLS) instrument. The metal elemental analyses of the samples were performed on inductively coupled plasma atomic emission spectroscopy (ICP-AES) and ICP-MS (PerkinElmer SCIEX, ELAN DRC-e).
Relaxivity Measurements
MR relaxivities of UMFNPs were carried out on an MRI scanner with a head coil at 3 T (Siemens Medical Solutions, Germany). The parameters for T1 measurement were set as: echo time (TE) = 19 ms, repetition time (TR) = 4000 ms, and TI = 25, 50, 100, 200, 300, 400, 500, 700, 1000, 1500, 2500, 3500 ms, respectively. For T2 relaxivity measurements, the parameters were set as: repetition time (TR) = 5000 ms and echo time (TE) = 13, 30, 92, 113, 141, 170, 198, 210, 240, 278, 322 ms.
MR imaging of liver in vivo
The MR images were acquired on a 3.0 T clinical MRI instrument (Siemens Trio). UMFNPs (3 mg [Fe+Mn]/kg) were injected into the mice for liver imaging. T1-weighted MR images of their livers were obtained at designed time points. The detailed parameters for T1 imaging were set as follows: field of view (FOV) = 40 × 80 mm2; flip angle (FA) = 120; slice thickness = 3.0 mm; TR = 485 ms; TE = 10 ms; number of excitations (NEX) = 12. In vivo experiments were carried out according to protocol approved by the Institutional Animal Care and Use Committee of Sun Yat-sen University.
Biodistribution and Pharmacokinetics Studies
Balb/c mice were injected intravenously with the MnxFe3-xO4 nanoparticles at a dose of 3 mg [Fe+Mn]/kg mouse body weight to evaluate the biodistribution of the nanoparticles. The mice were sacrificed at 3 h and 24 h post injection (p.i.). The organs of interest (brain, lung, heart, kidney, spleen and liver) were harvested, weighed and quantified using ICP-MS. To determine the pharmacokinetic parameters, mice were injected with MnxFe3-xO4 nanoparticles and blood samples were collected at 2 min, 5 min, 10 min, 30 min, 1 h, 3 h, 5 h, 8 h, 12 h, and 24 h p.i. and quantified using ICP-MS. The pharmacokinetic parameters were calculated based on a two-compartment open model.
Results and Discussion
Synthesis of composition tunable UMFNPs
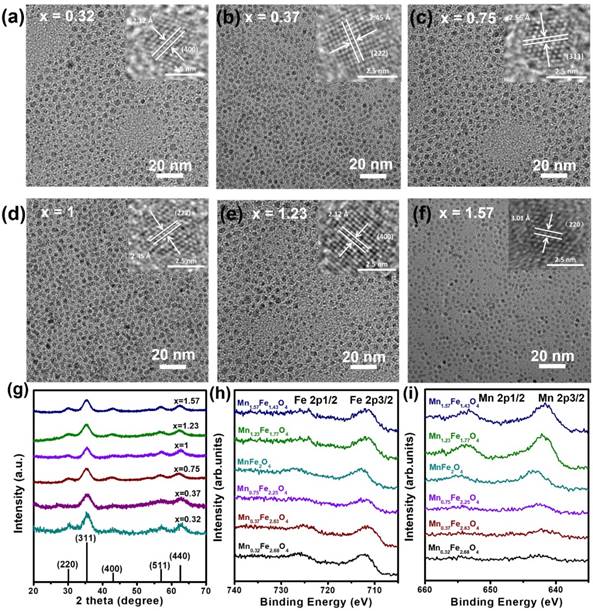
The MnxFe3-xO4 nanoparticles were synthesized via a DSTD method [7]. The Mn content (x = 0.32, 0.37, 0.75, 1, 1.23 and 1.57) in the UMFNPs could be controlled by changing the ratios of the precursors. Figure 1a-f shows the TEM images of as-prepared MnxFe3-xO4 nanoparticles with different Mn content. All samples show a uniform particle size of 3 nm with narrow size distributions (< 4%) (Figure S1). The corresponding high-resolution TEM (HRTEM) images are shown in the inset of Figure 1a-f, revealing the high crystallinities of these particles. The lattice spacing distances are found to be 2.12 Å, 2.45 Å, 2.56 Å, 2.45 Å, 2.12 Å and 3.01 Å, which correspond to the (400), (222), (311), (222), (400) and (220) planes, respectively, of the inverse spinel phase of manganese ferrite. Figure 1g shows the powder X-ray diffraction (XRD) patterns of the as-synthesized ultrasmall MnxFe3-xO4 nanoparticles. The position of all diffraction peaks matches well with the standard manganese ferrite power diffraction data (JCPDS card no. 10-0319). The ICP-AES elemental analysis revealed the tunable-ratios of Mn:Fe in MnxFe3-xO4 can to be 0.32:2.68, 0.37:2.63, 0.75:2.25, 1:2, 1.23:1.77 and 1.57:1.43, which are consistent with the results measured by using energy dispersive X-ray spectroscopy (EDS; Figure S2 and Table S1 in the Supporting Information). The as-prepared MnxFe3-xO4 nanoparticles were further analyzed by X-ray photoelectron spectroscopy (XPS) (Figure 1h and 1i). The binding energies at 711.9 and 725.8 eV for Mn0.32Fe2.68O4, 711.0 and 724.3 eV for Mn0.37Fe2.63O4, 711.8 and 724.7 eV for Mn0.75Fe2.25O4, 711.8 and 725.5 eV for MnFe2O4, 710.9 and 725.1 eV for Mn1.23Fe1.77O4, and 711.2 and 724.8 eV for Mn1.57Fe1.43O4 are attributed to Fe 2p3/2 and Fe 2p1/2 referred to Fe3+, respectively. The photoelectron peaks at binding energies of Mn 2p3/2 and Mn 2p1/2 were 642.6 and 654.4 eV for Mn0.32Fe2.68O4, 642.0 and 653.9 eV for Mn0.37Fe2.63O4, 642.4 and 654.5 eV for Mn0.75Fe2.25O4, 642.1 and 653.9 eV for MnFe2O4, 641.8 and 653.7 eV for Mn1.23Fe1.77O4, and 641.6 and 653.2 eV for Mn1.57Fe1.43O4, respectively (Table S2). The peak positions of Fe 2p and Mn 2p are consistent with previously reported values for Fe3+ and Mn2+ [7, 23, 26]. With increasing Mn2+, the intensities of the Fe 2p peaks decrease, and those of the Mn 2p peaks increase, which is consistent with the literature results [27]. These data suggest that 3 nm MnxFe3-xO4 nanoparticles, where x = 0.32, 0.37, 0.75, 1, 1.23 and 1.57, were successfully synthesized by the DSTD method.
(a-f) TEM images of ultrasmall MnxFe3-xO4 nanoparticles. The insets are the high-resolution TEM images. (g) XRD patterns of ultrasmall MnxFe3-xO4 nanoparticles. XPS spectra of ultrasmall MnxFe3-xO4 nanoparticles, (h) Fe 2p and (i) Mn 2p.
Magnetic characterization
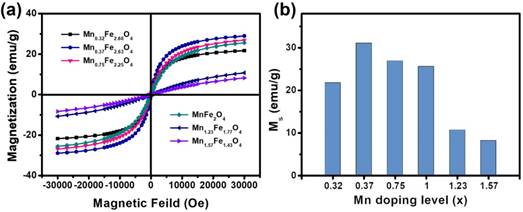
The magnetic properties of UMFNPs are strongly associated with their MR relaxivity properties. The magnetic properties of these MnxFe3-xO4 nanoparticles were measured using a superconducting quantum interference device (SQUID) with the field up to 3 T. Figure 2a shows the field-dependent magnetization (M-H) curves of the ultrasmall MnxFe3-xO4 nanoparticles at 300 K. The coercivity and remanence are negligible at room temperature for all these samples, indicating superparamagnetic behavior. The variations in magnetization as a function of the Mn-doping concentration are presented in Figure 2b. The magnetizations at 3 T are 21.78, 31.07, 26.92, 25.59, 10.69, and 8.20 emu/g for the Mn0.32Fe2.68O4, Mn0.37Fe2.63O4, Mn0.75Fe2.25O4, MnFe2O4, Mn1.23Fe1.77O4 and Mn1.57Fe1.43O4 nanoparticles, respectively. The magnetization was found to initially increase by up to 42% with the increase of x up to 0.37. Metal ferrite nanoparticles has a spinel structure constructed by face-centered cubic packed lattice of oxygen atoms with the tetrahedral sites and octahedral sites [28, 29]. It is well known that MnFe2O4 has a mixed spinel structure with the manganese ions predominantly occupying tetrahedral sites. Mn2+ has five unpaired electrons, which is the same number as in Fe3+, and one more than in Fe2+. When an external magnetic field is applied, the magnetic spins of the Oh sites align parallel to the direction of the external magnetic field, but those of the Td sites align antiparallel to the field. For MnxFe3-xO4 nanoparticles with small x values, the Mn2+ dopant can replace Fe2+ to give a magnetic moment of (4+x) μB (Bohr magneton) per formula unit, resulting in an enhanced magnetic moment in comparison with [Fe3+]Td[Fe2+Fe3+]OhO4. However, as the doping level further increases, the magnetization gradually decreases to 8.20 emu/g (x = 1.57) due to the weakening of the Td-Oh interaction when Fe3+ is replaced by Mn2+ in the Td site [30-32]. Similar results have been observed in large-sized manganese ferrite nanoparticles [23, 31].
Magnetic characterization of 3 nm MnxFe3-xO4 nanoparticles. (a) Field-dependent magnetization curves (M-H) of ultrasmall MnxFe3-xO4 nanoparticles at 300 K. (b) The magnetizations at 3 T of the ultrasmall MnxFe3-xO4 samples.
Surface modification of the MnxFe3-xO4 nanoparticles
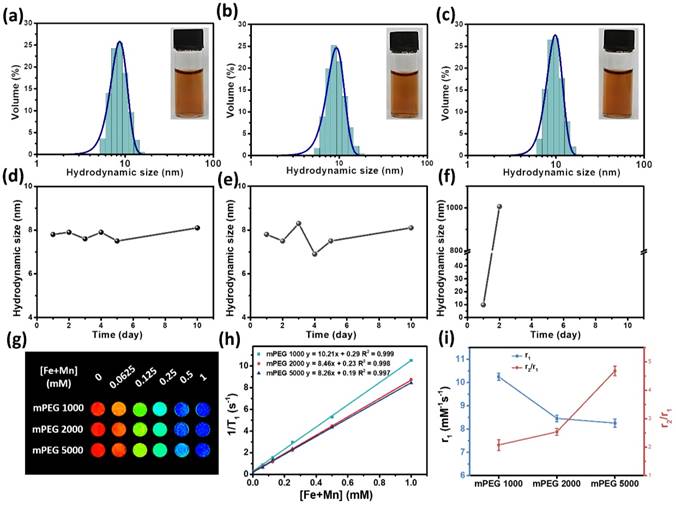
Appropriate surface coatings for MnxFe3-xO4 nanoparticle-based contrast agents are necessary for improved dispersibilities and T1 contrast abilities. Stoichiometric MnFe2O4 nanoparticles were modified by various mPEG with molecular weights of 1000, 2000 and 5000 g/mol followed by evaluation of their colloidal stabilities and in vitro T1 relaxivities. Figure 3a-c shows the hydrodynamic sizes of the MnFe2O4 nanoparticles modified with mPEG1000, mPEG2000 and mPEG5000, respectively. The hydrodynamic sizes in deionized water are seen to be 8.74 nm for MnFe2O4@mPEG1000, 9.36 nm for MnFe2O4@mPEG2000 and 9.87 nm for MnFe2O4@mPEG5000. No observable aggregation could be seen under the optical microscope as shown in the insets of Figure 3a-c. Figure 3d-f shows the time-dependent curves for the hydrodynamic sizes of the mPEG-modified MnFe2O4 nanoparticles. It can be seen that MnFe2O4@mPEG1000 and MnFe2O4@mPEG2000 do not show any significant changes in their hydrodynamic sizes after 10 days of incubation in aqueous media at room temperature, while the hydrodynamic size of MnFe2O4@mPEG5000 exhibits a significant increase after the 2nd day. The thermogravimetric analysis (TGA) results (Figure S3 and Table S3) indicate that the surface density of MnFe2O4@mPEG5000 was much less than those of MnFe2O4@mPEG1000 and MnFe2O4@mPEG2000 for the same preparation procedures. This may result in the mPEG5000-coated nanoparticles having poor aqueous stability and dispersibility. The results imply that the MnFe2O4 nanoparticles modified by mPEG1000 and mPEG2000 can achieve excellent colloidal stabilities compared to MnFe2O4@mPEG5000. The effects of the surface ligands of the MnFe2O4 nanoparticles on their MR relaxivities was further evaluated on a clinical 3 T MRI scanner at room temperature. A series of aqueous solutions of the nanoparticles with different [Fe+Mn] concentrations were prepared. Figure 3g shows the T1-weighted MR images of MnFe2O4@mPEG1000, MnFe2O4@m PEG2000 and MnFe2O4@mPEG5000 at different [Fe+ Mn] concentration. All of the samples with higher concentration produce brighter images, indicating that the MnFe2O4@mPEG1000, MnFe2O4@mPEG2000 and MnFe2O4@mPEG5000 samples can effectively shorten T1 relaxation time of the water protons. However, MnFe2O4@mPEG 1000 exhibits brighter images at all designated [Fe+Mn] concentrations in comparison with MnFe2O4@mPEG2000 and MnFe2O4@mPEG5000. The r1 relaxivities of the MnFe2O4@mPEG1000, MnFe2O4@mPEG2000 and MnFe2O4@mPEG5000 samples were 10.21, 8.46, and 8.26 mM-1s-1, respectively (Figure 3h). The r2 relaxivities of MnFe2O4@mPEG1000, MnFe2O4@mPEG2000 and MnFe2O4@mPEG5000 were 21.27, 21.52, and 38.64 mM-1s-1, respectively (Figure S4b). Figure 3i shows the r1 and the r2/r1 curves of the MnFe2O4 samples with different mPEG coatings. The MnFe2O4@mPEG1000 sample exhibits the highest r1 relaxivity and the lowest r2/r1 value of the three samples, indicating that mPEG1000 is the optimal coating for the MnxFe3-xO4 nanoparticles. Thus, mPEG1000 was used to modify the MnxFe3-xO4 nanoparticles to further investigate their in vivo T1 contrast efficacy.
Hydrodynamic size of (a) MnFe2O4@mPEG1000, (b) MnFe2O4@mPEG2000, and (c) MnFe2O4@mPEG5000 in water. The insets are digital photographs of the aqueous MnFe2O4 nanoparticles dispersions. (d)-(f) Time-dependent hydrodynamic size of ultrasmall MnFe2O4 nanoparticles modified with (d) mPEG1000, (e) mPEG2000 and (f) mPEG5000, respectively. (g) T1-weighted phantom imaging of ultrasmall MnFe2O4 nanoparticles with different phosphorylated mPEG. (h) T1 relaxation rate of the MnFe2O4 nanoparticles different PEG chain lengths at various [Fe+Mn] concentrations. (i) r1 value and r2/r1 ratio of MnFe2O4 nanoparticles as a function of the mPEG molecular weight.
The in vitro T1 contrast ability of the ultrasmall MnxFe3-xO4 nanoparticles
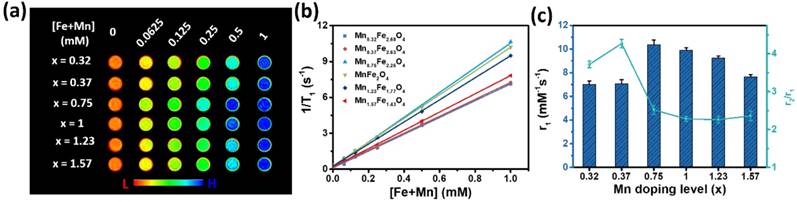
In vitro T1 contrast ability refers to the r1 relaxivity, which is the efficiency of a millimole of MnxFe3-xO4 nanoparticles for enhancing the relaxation rate of water protons [33]. To determine the influence of the Mn-doping concentration on the r1 relaxivity, the relaxometric properties of the MnxFe3-xO4 nanoparticles were measured. 3 nm MnxFe3-xO4 nanoparticles with different Mn-doping levels (x = 0.32, 0.37, 0.75, 1, 1.23, 1.57) were modified with mPEG 1000 and dispersed in deionized water. As shown in Figure 4a, the MR images enhanced by higher concentrations of UMFNPs appeared brighter than these of lower concentration. Furthermore, the T1-weighted MR images reveal that the Mn0.75Fe2.25O4 nanoparticles produce the highest signal intensity among the different MnxFe3-xO4 nanoparticles. Figure 4b shows the linear fit of the T1 relaxation times versus the [Fe+Mn] concentrations, the slope of which is the r1 relaxivity. The r1 relaxivity values and r2/r1 ratios for the different MnxFe3-xO4 nanoparticles are presented in Figure 4c and Table S4. The in vitro T1 contrast abilities of the 3 nm MnxFe3-xO4 nanoparticles improve with increasing Mn-doping levels up to x = 0.75 and then decline as the Mn doping level is further increased. The maximum r1 relaxivity is 10.35 mM-1s-1 and was obtained with the Mn0.75Fe2.25O4 nanoparticles, while the Mn1.23Fe1.77O4 nanoparticles exhibit the smallest r2/r1 ratio of 2.29 at 3 T. The results obtained from the relaxometric measurements demonstrating that ultrasmall MnxFe3-xO4 nanoparticles (x = 0.75- 1.23) are good candidates as T1 MRI contrast agents.
MR contrast effects of ultrasmall MnxFe3-xO4 nanoparticles upon changes in the Mn doping level. (a) T1-weighted images of MnxFe3-xO4 nanoparticles. (b) T1 relaxation rate of the MnxFe3-xO4 nanoparticles and (c) r1 relaxivities and r2/r1 ratio of ultrasmall MnxFe3-xO4 nanoparticles.
The mechanism of varied T1 relaxometric properties involved in the MnxFe3-xO4 nanoparticles is attributed to a combination of the inner-sphere and outer-sphere contributions [34]. While water molecules directly coordinated to the surface ions of the nanoparticles are responsible for the inner-sphere relaxation contribution, the spin-spin interactions between the nanoparticles and the water molecules in the nearby environment affect the outer-sphere relaxation. The contrast enhancement of individual contrast agents is thus determined by both their chemical composition and magnetic properties. For T1 contrast agents, in accordance with the classical Solomon-Bloembergen-Morgan (SBM) theory [33], the T1 relaxivity can be given by [13]:
(1)
(2)
(3)
Where ρ is the density of the MnxFe3-xO4 nanoparticles; γI is the gyromagnetic constant for proton; Mn is the molar mass; L refers to the thickness of surface impermeable molecule layer; Ms is the saturation magnetization of the UMFNPs; a is the particles core radius; D is the water diffusion coefficient; The translational diffusion time τD can be expressed as τD = r2/D; r equal to the a plus L; JA is the Ayant's spectral density function; PM is the molar fraction of the metal ions on the surface; q is the number of water molecules bound per metal ion; and τM is the residence lifetime of the bound water.
MnxFe3-xO4 nanoparticles possessing higher saturation magnetizations (Ms) result in larger r1 relaxivities due to the increased outer-sphere contribution. The inner-sphere contribution increases with the increasing Mn2+-doping level in the MnxFe3-xO4 nanoparticles due to the small τM of Mn(H2O)62+, which is 100 times smaller than that of Fe(H2O)63+ [33]. The overall T1 relaxivity of a MnxFe3-xO4 nanoparticle with a certain Mn-doping level is the sum of its inner-sphere and outer-sphere contributions.
In Vivo MR Imaging
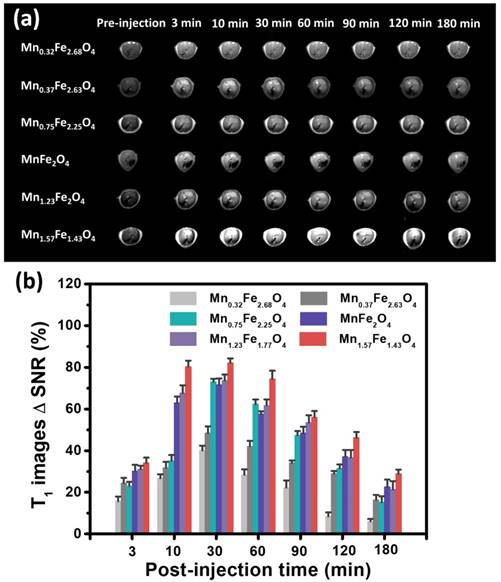
To evaluate the MRI imaging efficiency of ultrasmall MnxFe3-xO4 nanoparticles in vivo, Balb/c mice were used for liver-specific contrast-enhanced MRI. The samples were intravenously administrated. The experimental dose was set as 3 mg [Fe+Mn] per kilogram mouse body weight. T1 images at transverse of the liver was acquired at 0, 3, 10, 30, 60, 90, 120, and 180 min post-injection of the MnxFe3-xO4 nanoparticles (Figure 5a). Significant signal enhancement in the T1-weighted MR images can be observed, demonstrating that these MnxFe3-xO4 nanoparticles can effectively accumulate in the liver. Figure 5b shows the MR signal changes in the T1-weighted MR images of the liver at different time points. The MR signal intensity changes were quantified using ΔSNR as calculated from the following equations:
In vivo MR imaging of UMFNPs. (a)T1-weighted MR images of liver at 0, 3, 10, 30, 60, 90, 120, and 180 min after intravenous injection of 3 nm MnxFe3-xO4 nanoparticles and (b) quantification analysis of MR T1 signals changes.
SNR = SImean / SDnoise (4)
ΔSNR = (SNRpost - SNRpre) / SNRpre × 100% (5)
where SI stands for the signal intensity and SD stands for the standard deviation [35].
The highestΔSNR values of the contrast-enhanced MR images of the liver are 40.1 ± 2.3%, 48.4 ± 3.2%, 73.1 ± 1.4%, 71.6 ± 3.2%, 73.8 ± 2.7%, and 82.2 ± 2.1%, which occurred at 30 min post-injection of the Mn0.32Fe2.68O4, Mn0.37Fe2.63O4, Mn0.75Fe2.25O4, MnFe2O4, Mn1.23Fe1.77O4 and Mn1.57Fe1.43O4 nanoparticles, respectively. The ΔSNRs increase linearly with the increasing Mn-doping levels, revealing that the in vivo contrast abilities in the liver of these MnxFe3-xO4 nanoparticles strongly depend on their Mn-doping level. In addition, the Mn0.75Fe2.25O4 nanoparticles, which were expected to show a relatively large ΔSNR due to their high r1 relaxivity of 10.36 mM-1s-1, show a relatively small ΔSNR of 73.1%. The maximum ΔSNR of 82.2% was obtained using the Mn1.57Fe1.43O4 nanoparticles, which have a relatively low r1 relaxivity of 7.66 mM-1s-1, which suggests that the in vivo contrast ability can be affected by both the T1 relaxivities and the nano-bio interactions of MnxFe3-xO4 nanoparticles.
Pharmacokinetics and biodistribution of the MnxFe3-xO4 nanoparticles
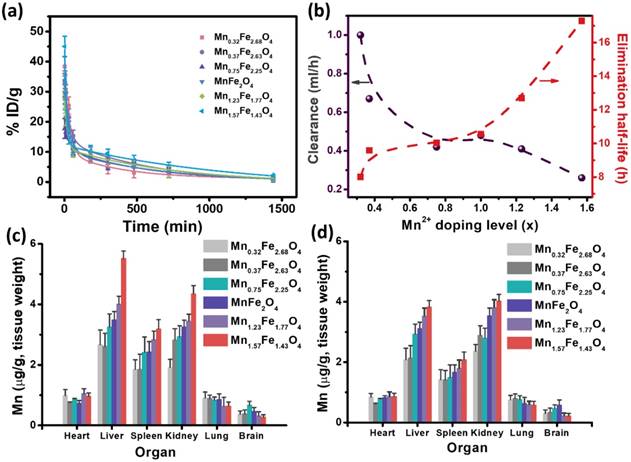
The pharmacokinetics and biodistribution of the MnxFe3-xO4 nanoparticles were then carried out to understand the effects of their in vivo behavior on the contrast efficacy. Figure 6a presents the concentration of the [Fe+Mn] levels in the blood after injection of the MnxFe3-xO4 nanoparticles via tail vein. All the curves showed biexponential characteristics [36]. Several of the key pharmacokinetic parameters, including the distribution half-life (t1/2α), elimination half-life (t1/2β), and clearance (CL), are summarized in Table S5. The distribution half-life (t1/2α) are 0.64, 0.62, 0.53, 0.50, 0.34 and 0.17 h for the Mn0.32Fe2.68O4, Mn0.37Fe2.63O4, Mn0.75Fe2.25O4, MnFe2O4, Mn1.23Fe1.77O4 and Mn1.57Fe1.43O4 nanoparticles, respectively. The elimination half-life (t1/2β) are 8.01, 9.59, 10.03, 10.56, 12.7 and 17.29 h for the Mn0.32Fe2.68O4, Mn0.37Fe2.63O4, Mn0.75Fe2.25O4, MnFe2O4, Mn1.23Fe1.77O4 and Mn1.57Fe1.43O4 nanoparticles, respectively. Increasing the Mn-doping concentration reduces the distribution half-life time and improves the elimination half-life time. Clearance (CL) [37-39] is a parameter used to measure the efficiency of the body toward eliminating particles through excretory or metabolic pathways. CL for Mn0.32Fe2.68O4, Mn0.37Fe2.63O4, Mn0.75Fe2.25O4, MnFe2O4, Mn1.23Fe1.77O4 and Mn1.57Fe1.43O4 nanoparticles were found to be 1, 0.67, 0.42, 0.48, 0.41 and 0.26 mL/h, respectively. As shown in Figure 6b, the CL declined with the increase of the Mn-doping concentration. This decrease in CL rate is consistent with the increase in the elimination half-life, indicating a reduced efficiency of the body toward eliminating the particles. These results explicitly suggest a dependence of half-life time and elimination on the Mn-doping level for the MnxFe3-xO4 nanoparticles. Figure 6c and d shows the biodistributions of the MnxFe3-xO4 nanoparticles at 3 h and 24 h postinjection. The results indicate that the MnxFe3-xO4 nanoparticles mainly accumulate in the liver, spleen and kidney after 3 h, while the accumulation of MnxFe3-xO4 nanoparticles in the liver is reduced after 24 h. The accumulation of Mn1.57Fe1.43O4 nanoparticles in the liver is much higher than that of the other MnxFe3-xO4 nanoparticles, suggesting that MnxFe3-x O4 nanoparticles with high-Mn doping concentrations can efficiently accumulate in the liver. Early studies have revealed that hepatocytes can uptake the Mn2+ via vitamin B6 transporters selectively [40]. Our previous work [7] has also proven that the accumulation of ultrasmall MnxFe3-xO4 nanoparticles in the liver can be attributed to hepatocyte-specific uptake, while traditional superparamagnetic iron oxide nanoparticles were mostly localized in Kupffer cells. Therefore, it is reasonable to believe that the Mn2+ concentration on the surface of ultrasmall MnxFe3-xO4 nanoparticles plays a significant role in its accumulation in the liver due to hepatocyte-specific uptake, although the detailed molecular mechanism still needs to be revealed. The accumulation amounts of the MnxFe3-xO4 nanoparticles in the liver correspond well to their respective ΔSNRs in the liver, indicating that the in vivo contrast ability is determined by the in vivo accumulation of the nanoparticles rather than their in vitro r1 relaxivity in this case.
In vivo behaviors of ultrasmall MnxFe3-xO4 nanoparticles as determined by measuring Mn levels with ICP-MS. (a) Blood circulation of ultrasmall MnxFe3-xO4 nanoparticles. The pharmacokinetics of ultrasmall MnxFe3-xO4 nanoparticles followed the two-compartment model. (b) Correlation of elimination half-life and clearance of ultrasmall MnxFe3-xO4 nanoparticles. (c, d) Biodistribution of ultrasmall MnxFe3-xO4 nanoparticles in Balb/c mice at (c) 3 h and (d) 24 h post injection.
In Vitro and In Vivo Biosafety Evaluation
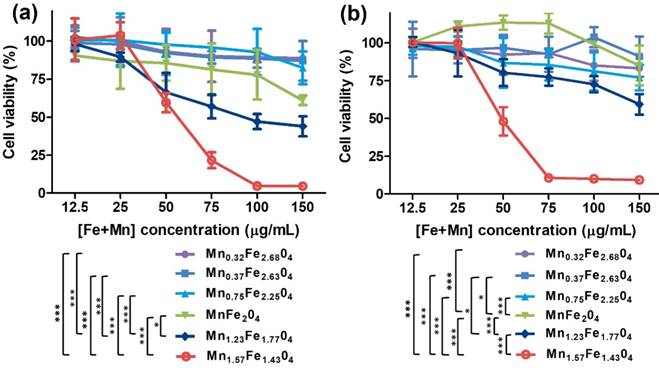
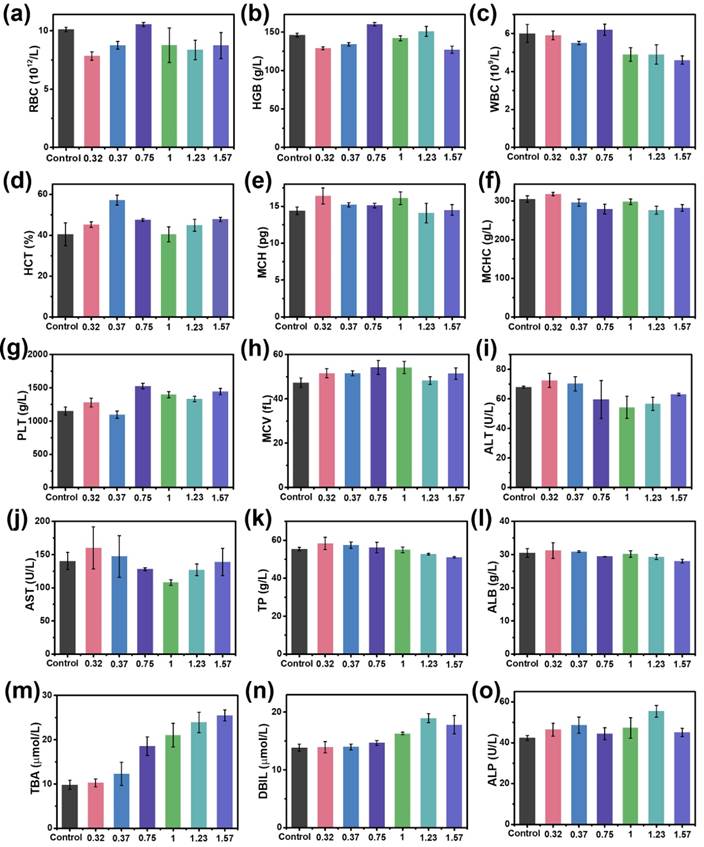
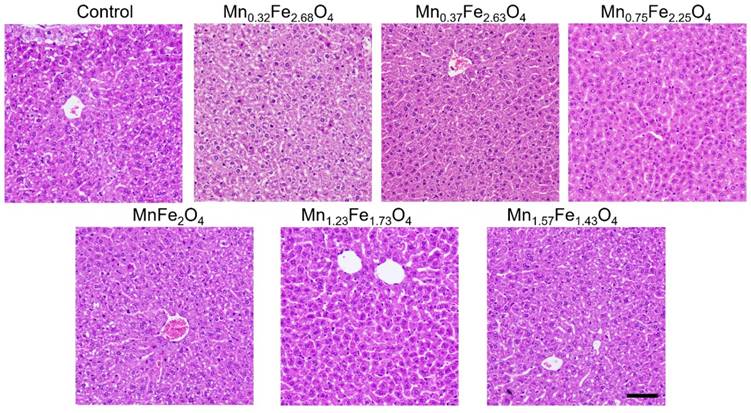
To assess the biosafety of the MnxFe3-xO4 nanoparticles, in vitro cell cytotoxicity assays, in vivo blood routine examination, blood biochemistry test and H&E staining examination were conducted using Balb/c mice. A cck-8 colorimetric assay using Chang liver cells and HepG2 cells were performed to evaluate the cytotoxicity of the UMFNPs (Figure 7). The viabilities of the Chang liver cells exceed 80% at a high [Fe+Mn] concentration of 150 µg/mL for the Mn0.32Fe2.68O4, Mn0.37Fe2.63O4 and Mn0.75Fe2.25O4 nanoparticles after incubating for 24 h. In contrast, the viabilities of the Chang liver cells are less than 70% at [Fe+Mn] concentrations higher than 50 µg/mL for the Mn1.23Fe1.77O4 and Mn1.57Fe1.43O4 nanoparticles after incubating for 24 h. These results indicate that ultrasmall MnxFe3-xO4 nanoparticles with high Mn-doping levels (x = 1.23 and 1.57) can induce significant cytotoxicity in Chang liver cells. Similar results were observed in HepG2 cells. The viabilities of HepG2 cells are higher than 80% at a high [Fe+Mn] concentration of 150 µg/mL for the Mn0.32Fe2.68O4, Mn0.37Fe2.63O4 and Mn0.75Fe2.25O4 nanoparticles, while the viabilities of HepG2 cells decreased to 50% at a [Fe+Mn] concentration of only 50 µg/mL for the Mn1.57Fe1.43O4 nanoparticles. For the in vivo biosafety investigation, mice were intravenously injected with MnxFe3-xO4 nanoparticles at a dosage of 3 mg [Fe+Mn]/kg. After a 24 h circulation time, the whole blood, serum and liver were obtained for the blood routine examination, blood biochemistry tests and H&E staining examinations, respectively. Figure 8a-h shows the blood routine examination results of the MnxFe3-xO4 nanoparticles, including values for the red blood cells (RBC), hemoglobin (HGB), white blood cells (WBC), hematocrit (HCT), mean corpuscular hemoglobin (MCH), mean corpuscular hemoglobin concentration (MCHC), platelets (PLT) and mean corpuscular volume (MCV). These markers are within the normal range without any observable difference from those of the mice in the control group, suggesting good hemocompatibility for the MnxFe3-xO4 nanoparticles. For the blood biochemistry tests, important hepatic function indicators, such as the alanine transferase (ALT), aspartate transferase (AST), total protein (TP), albumin (ALB), total biliary acid (TBA), direct bilirubin (DBIL) and alkaline phosphatase (ALP) values, were investigated. As shown in Figure 8i-o, no significant difference in the levels of these markers compared to the control are observed for the Mn0.32Fe2.68O4, Mn0.37Fe2.63O4, Mn0.75Fe2.25O4 and MnFe2O4 nanoparticles, indicating a good hepatic safety profile for these nanoparticles. However, the TBA and DBIL values of the Mn1.23Fe1.77O4 and Mn1.57Fe1.43O4 nanoparticles treated groups were much higher than those of the other MnxFe3-xO4 nanoparticles treated groups and the control group. Nanoparticles can be cleared through the liver into the bile, and the levels of TBA and DBIL reflect the liver functions of excretion, secretion and detoxification [41, 42]. The increased TBA and DBIL values imply a potential toxicity towards the functions of the liver caused by the increasing manganese content. The cellular internalization of MnxFe3-xO4 may trigger the partial dissolution of the nanoparticles, leading to the release of Mn ions. The toxicity of Mn ions results from the variable valence states of Mn and its disruption of the homeostasis of pro-oxidant and antioxidant factors, which leads to toxic damage [43, 44]. To further evaluate the potential tissue damage, inflammation or lesions in the liver that MnxFe3-xO4 nanoparticles may cause, H&E staining examinations were conducted. As shown in Figure 9, compared with those of the control group, the tissue structures of the livers from mice treated with MnxFe3-xO4 nanoparticles remain intact, and no abnormal changes in the pathological histology or cellular structures are observed in the livers after 1 day, indicating no obvious risks of the MnxFe3-xO4 nanoparticles toward the liver. These results suggest that Mn0.32Fe2.68O4, Mn0.37Fe2.63O4, Mn0.75Fe2.25O4 and MnFe2O4, which have insignificant toxicities, are suitable for in vivo MRI.
Relative viabilities of (a) Chang liver cells and (b) HepG2 cells incubated with ultrasmall MnxFe3-xO4 nanoparticles at various concentrations using standard cck-8 colorimetric assays. Error bars = SEM; * p < 0.05; ** p < 0.01; *** p < 0.001. p value is used to statistically analyze difference among groups at the [Fe+Mn] concentration of 50 µg/mL.
In vivo biosafety assessment of ultrasmall MnxFe3-xO4 nanoparticles. (a-h) Routine blood analysis: (a) red blood cells (RBC), (b) hemoglobin (HGB), (c) white blood cell (WBC), (d) hematocrit (HCT), (e) mean corpuscular hemoglobin (MCH), (f) mean corpuscular hemoglobin concentration (MCHC), (g) platelets (PLT) and (h) mean corpuscular volume (MCV); (i-o) Blood biochemistry test: (i) alanine transferase (ALT), (j) aspartate transferase (AST), (k) total protein (TP), (l) albumin (ALB), (m) total biliary acid (TBA), (n) direct bilirubin (DBIL) and (o) alkaline phosphatase (ALP).
H&E stained images of the liver of the mice harvested from control group and treated groups at 1 days after intravenous injection of ultrasmall MnxFe3-xO4 nanoparticles. Scale bar = 100 nm.
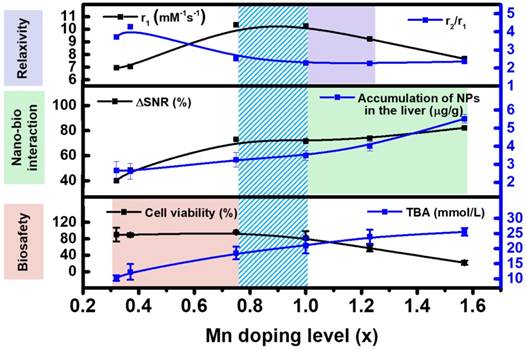
The chemical design of nanoparticle-based contrast agents is typically highly concentrated to maximize the relaxivity. However, the optimization of a single factor is insufficient to predict the in vivo contrast efficacy. The nano-bio interactions and in vivo safety should also be taken into account for maximizing the in vivo contrast efficacy. Based on the above experimental results, the Mn-doping level of MnxFe3-xO4 nanoparticles can simultaneously impact the in vitro T1 relaxivity, the accumulation of nanoparticles in the liver and the biosafety. The key correlations between the chemical composition and the in vitro T1 relaxivity, in vivo nano-bio interactions, and toxicity should be considered together. As shown in Figure 10, as the Mn-doping level increases, the T1 relaxivity initially increases to 10.36 mM-1s-1 (x = 0.75) and then gradually decreases to 7.66 mM-1s-1 (x = 1.57), and both the ∆SNR and the particle accumulation in the liver increased. However, the in vitro cell viability and the liver functions of excretion, secretion and detoxification are adversely impacted by an increase in the Mn-doping level. The comparison and correlation analysis suggest that MnxFe3-xO4 nanoparticles with Mn contents ranging from 0.75 to 1, have significantly improved in vivo contrast efficacies, and can be potential contrast agents for clinical liver-specific MRI.
The comparison and correlation analysis of Mn concentration with in vitro T1 relaxivity, in vivo nano-bio interactions and biosafety.
Conclusions
In summary, 3 nm MnxFe3-xO4 nanoparticles with tunable Mn-doping levels (x = 0.32, 0.37, 0.75, 1, 1.23 and 1.57) have been successfully synthesized via a DSTD method. These MnxFe3-xO4 nanoparticles were used as a model system to systematically investigate the correlation between chemical composition and in vivo T1 contrast efficacy. The results suggest that variations in the Mn contents of MnxFe3-xO4 nanoparticles can effectively impact in vitro T1 relaxivities, in vivo nano-bio interactions and toxicities simultaneously. The relationships between the chemical composition and each individual factor have been revealed. It was found that with increasing Mn-doping levels in the MnxFe3-xO4 nanoparticles, the T1 relaxivities initially increased and then declined, while the in vivo MR signals increased linearly, along with an adverse increase in their toxicities. A comparison analysis of these given relationships indicated that the MnxFe3-xO4 (x = 0.75-1) nanoparticles, as UFNP-based contrast agents, exhibited the optimal in vivo contrast efficacy for liver-specific MRI. The principles identified in this work and multiple factor assessment used herein can be applied to optimize other UFNPs for high- performance contrast-enhanced MRI. We believe this work represents an essential step towards the development of high-efficiency and low-toxicity UFNP-based contrast agents for both fundamental research and clinical translation.
Abbreviations
ALT: alanine transferase; ALP: alkaline phosphatase; ALB: albumin; AST: aspartate transferase; CL: clearance; DSTD: dynamic simultaneous thermal decomposition; DLS: dynamic light scattering; DBIL: direct bilirubin; HCT: hematocrit; HGB: hemoglobin; MRI: magnetic resonance imaging; MCH: mean corpuscular hemoglobin; MCHC: mean corpuscular hemoglobin concentration; MCV: mean corpuscular volume; PLT: platelets; RBC: red blood cells; SQUID: superconducting quantum interference device; TBA: total biliary acid; TEM: transmission electron microscopy; TP: total protein; UFNPs: ultrasmall ferrite nanoparticles; UMFNPs: ultrasmall manganese ferrite nanoparticles; WBC: white blood cell; XRD: X-ray powder diffraction; XPS: X-ray photoelectron spectroscopy.
Supplementary Material
Supplementary figures and tables.
Acknowledgements
The authors thank the financial support provided by National Natural Science Foundation of China (Grant Nos. 81571809, 81771981, and 81300199).
Competing Interests
The authors have declared that no competing interest exists.
References
1. Kim BH, Lee N, Kim H, An K, Park YI, Choi Y. et al. Large-scale synthesis of uniform and extremely small-sized iron oxide nanoparticles for high-resolution T1 magnetic resonance imaging contrast agents. J Am Chem Soc. 2011;133:12624-31
2. Li Z, Yi PW, Sun Q, Lei H, Li Zhao H, Zhu ZH. et al. Ultrasmall water-soluble and biocompatible magnetic iron oxide nanoparticles as positive and negative dual contrast agents. Adv Funct Mater. 2012;22:2387-93
3. Lu Y, Xu YJ, Zhang GB, Ling D, Wang MQ, Zhou Y. et al. Iron oxide nanoclusters for T1 magnetic resonance imaging of non-human primates. Nat Biomed Eng. 2017;1:637-43
4. Taboada E, Rodrı´guez E, Roig A, Oro´ J, Roch A, Muller RN. Relaxometric and magnetic characterization of ultrasmall iron oxide nanoparticles with high magnetization evaluation as potential T1 magnetic resonance imaging contrast agents for molecular imaging. Langmuir. 2007;23:4583-8
5. Tromsdorf UI, Bruns OT, Salmen SC, Beisiegel U, Weller H. A highly effective, nontoxic T1 MR contrast agent based on ultrasmall PEGylated iron oxide nanoparticles. Nano Lett. 2009;9:4434-40
6. Wei H, Bruns OT, Kaul MG, Hansen EC, Barch M, Wisniowska A. et al. Exceedingly small iron oxide nanoparticles as positive MRI contrast agents. Proc Natl Acad Sci U S A. 2017;114:2325-30
7. Zhang H, Li L, Liu XL, Jiao J, Ng CT, Yi JB. et al. Ultrasmall ferrite nanoparticles synthesized via dynamic simultaneous thermal decomposition for high-performance and multifunctional T1 magnetic resonance imaging contrast agent. ACS Nano. 2017;11:3614-31
8. Li Z, Wang SX, Sun Q, Zhao HL, Lei H, Lan MB. et al. Ultrasmall manganese ferrite nanoparticles as positive contrast agent for magnetic resonance imaging. Adv Healthc Mater. 2013;2:958-64
9. Chen R, Ling D, Zhao L, Wang S, Liu Y, Bai R. et al. Parallel comparative studies on mouse toxicity of oxide nanoparticle- and gadolinium-based T1 MRI contrast agents. ACS Nano. 2015;9:12425-35
10. Shen Z, Chen T, Ma X, Ren W, Zhou Z, Zhu G. et al. Multifunctional theranostic nanoparticles based on exceedingly small magnetic iron oxide nanoparticles for T1-weighted magnetic resonance imaging and chemotherapy. ACS Nano. 2017;11:10992-1004
11. Wang L, Wu Q, Tang S, Zeng J, Qiao R, Zhao P. et al. Ultrasmall PEGylated MnxFe3-xO4 (x = 0-0.34) nanoparticles: effects of Mn(Ⅱ) doping on T1- and T2-weighted magnetic resonance imaging. RSC Advances. 2013;3:23454-60
12. Shen Z, Song J, Zhou Z, Yung BC, Aronova MA, Li Y. et al. Dotted core-shell nanoparticles for T1-weighted MRI of tumors. Adv Mater. 2018;30:1803163-73
13. Zeng J, Jing L, Hou Y, Jiao M, Qiao R, Jia Q. et al. Anchoring group effects of surface ligands on magnetic properties of Fe3O4 nanoparticles: towards high performance MRI contrast agents. Adv Mater. 2014;26:2694-8
14. Boselli L, Polo E, Castagnola V, Dawson KA. Regimes of biomolecular ultrasmall nanoparticle interactions. Angew Chem Int Ed Engl. 2017;56:4215-8
15. Polo E, Collado M, Pelaz B, Del Pino P. Advances toward more efficient targeted delivery of nanoparticles in vivo: understanding interactions between nanoparticles and cells. ACS Nano. 2017;11:2397-402
16. Shi J, Kantoff PW, Wooster R, Farokhzad OC. Cancer nanomedicine: progress, challenges and opportunities. Nat Rev Cancer. 2017;17:20-37
17. Stark WJ. Nanoparticles in biological systems. Angew Chem Int Ed Engl. 2011;50:1242-58
18. Wilhelm S, Tavares AJ, Dai Q, Ohta S, Audet J, Dvorak HF. et al. Analysis of nanoparticle delivery to tumours. Nat Rev Mater. 2016:1
19. Arami H, Khandhar A, Liggitt D, Krishnan KM. In vivo delivery, pharmacokinetics, biodistribution and toxicity of iron oxide nanoparticles. Chem Soc Rev. 2015;44:8576-607
20. Kang H, Gravier J, Bao K, Wada H, Lee JH, Baek Y. et al. Renal clearable organic nanocarriers for bioimaging and drug delivery. Adv Mater. 2016;28:8162-8
21. Yang Y, Liu J, Liang C, Feng L, Fu T, Dong Z. et al. Nanoscale metal-organic particles with rapid clearance for magnetic resonance imaging-guided photothermal therapy. ACS Nano. 2016;10:2774-81
22. Zhou Z, Wang L, Chi X, Bao J, Yang L, Zhao W. et al. Engineered iron-oxide-based nanoparticles as enhanced T1 contrast agents for efficient tumor imaging. ACS Nano. 2013;7:3287-96
23. Yang L, Ma L, Xin J, Li A, Sun C, Wei R. et al. Composition tunable manganese ferrite nanoparticles for optimized T2 contrast ability. Chem Mater. 2017;29:3038-47
24. Chabanova E, Logager VB, Moller JM, Thomsen HS. Manganese based MR contrast agents: formulation and clinical applications. The Open Drug Safety Journal. 2011;2:29-38
25. Liu XL, Fan HM, Yi JB, Yang Y, Choo ESG, Xue JM. et al. Optimization of surface coating on Fe3O4 nanoparticles for high performance magnetic hyperthermia agents. J Mater Chem. 2012;22:8235-44
26. Xu Y, Sherwood J, Qin Y, Holler RA, Bao Y. A general approach to the synthesis and detailed characterization of magnetic ferrite nanocubes. Nanoscale. 2015;7:12641-9
27. Wu T, Zhao Y, Li Y, Wu W, Tong G. Controllable synthesis of CuxFe3-xO4@Cu core-shell hollow spherical chains for broadband, lightweight microwave absorption. ChemCatChem. 2017;9:3486-96
28. Carta D, Casula MF, Falqui A, Loche D, Mountjoy G, Sangregorio C. et al. A structural and magnetic investigation of the inversion degree in ferrite nanocrystals MFe2O4 (M = Mn, Co, Ni). J Phys Chem C. 2009;113:8606-15
29. J W, Yejun W, Yuejin Z. Cation distribution of MnFe2O4 nanoparticls synthesized under an induced magnetic field. Int J Mod Phys B. 2007;21:723-9
30. Giri J, Pradhan P, Somani V, Chelawat H, Chhatre S, Banerjee R. et al. Synthesis and characterizations of water-based ferrofluids of substituted ferrites [Fe1-xBxFe2O4, B = Mn, Co (x = 0-1)] for biomedical applications. J Magn Magn Mater. 2008;320:724-30
31. Giri J, Pradhan P, Sriharsha T, Bahadur D. Preparation and investigation of potentiality of different soft ferrites for hyperthermia applications. J App Phys. 2005:97
32. van der Zaag PJ, Noordermeer A, Johnson MT, Bongers PF. Comment on "Size-dependent Curie temperature in nanoscale MnFe2O4 particles". Phys Rev Lett. 1992;68:3112
33. Lauffer RE. Paramagnetic metal complexes as water proton relaxation agents for NMR imaging: theory and design. Chem Rev. 1987;87:901-27
34. Ni D, Bu W, Ehlerding EB, Cai W, Shi J. Engineering of inorganic nanoparticles as magnetic resonance imaging contrast agents. Chem Soc Rev. 2017;46:7438-68
35. Huang J, Bu L, Xie J, Chen K, Cheng Z, Li X. et al. Effects of nanoparticle size on cellular uptake and liver MRI with polyvinylpyrrolidone-coated iron oxide nanoparticles. ACS Nano. 2010;4:7151-60
36. Yu M, Zheng J. Clearance pathways and tumor targeting of imaging nanoparticles. ACS Nano. 2015;9:6655-74
37. Du B, Jiang X, Das A, Zhou Q, Yu M, Jin R. et al. Glomerular barrier behaves as an atomically precise bandpass filter in a sub-nanometre regime. Nat Nanotechnol. 2017;12:1096-102
38. Greenblatt DJ. Elimination half-life of drugs: value and limitations. Annu Rev Med. 1985;36:421
39. Xu J, Yu M, Peng C, Carter P, Tian J, Ning X. et al. Dose dependencies and biocompatibility of renal clearable gold nanoparticles: from mice to non-human primates. Angew Chem Int Ed. 2018;57:266-71
40. Semelka RC, Helmberger TKG. Contrast agents for MR imaging of the liver. Radiology. 2001;218:27-38
41. Wang L, Wu G, Wu F, Jiang N, Lin Y. Geniposide attenuates ANIT-induced cholestasis through regulation of transporters and enzymes involved in bile acids homeostasis in rats. J Ethnopharmacol. 2017;196:178-85
42. Yan JY, Ai G, Zhang XJ, Xu HJ, Huang ZM. Investigations of the total flavonoids extracted from flowers of Abelmoschus manihot (L.) Medic against alpha-naphthylisothiocyanate-induced cholestatic liver injury in rats. J Ethnopharmacol. 2015;172:202-13
43. Blazk WF, Brown GL, Treinen KA, Denny KH. Developmental toxicity study of mangafodipir trisodium injection (MnDPDP) in new zealand white rabbits. Toxicological Sciences. 1996;33:11-5
44. O'Neal SL, Zheng W. Manganese toxicity upon overexposure: a decade in review. Curr Environ Health Rep. 2015;2:315-28
Author contact
![]() Corresponding author: fanhmedu.cn
Corresponding author: fanhmedu.cn