Impact Factor
- Issue 14; 2026
- Issue 13; 2026
- Issue 12; 2026
- Issue 11; 2026
- Issue 10; 2026
- Volume 16; 2026
- Advance Articles
- Past Issues
- Cover Images
- Cover Suggestion
- Index & Coverage
- Special Issues
Introduction
Methods
Results and Discussion
Conclusions
Supplementary Material
Acknowledgements
References
International Journal of Biological Sciences
International Journal of Medical Sciences
 Global reach, higher impact

Theranostics 2019; 9(5):1417-1425. doi:10.7150/thno.28745 This issue Cite
Research Paper
Microfluidic Isolation of Circulating Tumor Cells and Cancer Stem-Like Cells from Patients with Pancreatic Ductal Adenocarcinoma
Jose I. Varillas1,2*, Jinling Zhang2*, Kangfu Chen2, Isis I. Barnes3, Chen Liu4, Thomas J. George3 ![]() , Z. Hugh Fan1,2,5
, Z. Hugh Fan1,2,5 ![]()
1. J. Crayton Pruitt Family Department of Biomedical Engineering, University of Florida, P.O. Box 116131, Gainesville, FL 32611, USA.
2. Interdisciplinary Microsystems Group, Department of Mechanical and Aerospace Engineering, University of Florida, PO Box 116250, Gainesville, Florida 32611, USA.
3. Department of Medicine, University of Florida, P.O. Box 100278, Gainesville, FL 32611, USA.
4. Department of Pathology, Immunology and Laboratory Medicine, University of Florida, P.O. Box 100275, Gainesville, FL, 32610, USA.
5. Department of Chemistry, University of Florida, P.O. Box 117200, Gainesville, FL 32611, USA.
*These authors contributed equally to this work.
Received 2018-7-24; Accepted 2018-12-21; Published 2019-2-20
Abstract

Background: Pancreatic ductal adenocarcinoma (PDAC) requires multimodal therapeutic approaches and disease monitoring for effective treatment. Liquid biopsy biomarkers, including circulating tumor cells (CTCs) and cancer stem-like cells (CSCs), hold promise for evaluating treatment response promptly and guiding therapeutic modifications.
Methods: From 24 patients with metastatic PDAC (stage IV, M1) undergoing active systemic treatment, we collected 78 blood samples at different time points for CTC and CSC isolation using a microfluidic platform functionalized with antibodies against a CTC biomarker, epithelial cell adhesion molecule (EpCAM), or a CSC biomarker, CD133. These isolated cells were further verified, via fluorescent staining and imaging, using cytokeratin (CK), CD45, and nucleic acid stain 4',6-diamidino-2-phenylindole (DAPI).
Results: The majority (84.4%) of patient blood samples were positive for CTCs (EpCAM+CK+CD45-DAPI+) and 70.8% of patient blood samples were positive for CSCs (CD133+CK+CD45-DAPI+), using the highest baseline value of healthy samples as threshold. The CTC subtypes (EpCAM+CK+CD45-DAPI+CD133+ and EpCAM+CK+CD45-DAPI+CD133-) and CSC subtypes (CD133+CK+CD45-DAPI+EpCAM+ and CD133+CK+CD45-DAPI+EpCAM-) were also analyzed using immunochemical methods. In several cases, CSCs exhibited cytokeratin expression that did not express EpCAM, indicating that they will not be detected using EpCAM-based isolation.
Conclusion: The microfluidic platform enabled the reliable isolation of CTCs and CSCs from PDAC patient samples, as well as their subtypes. Complementary assessment of both CTCs and CSCs appears advantageous to assess the profile of tumor progressing in some cases. This research has important implications for the application and interpretation of approved methods to detect CTCs.
Keywords: circulating tumor cells, cancer stem-like cells, pancreatic cancer, microfluidics
Introduction
The spread of cancer cells from the primary tumor site to distant tissues is an early event in the metastatic process. Circulating tumor cells (CTCs) have been defined as cancer cells of solid tumor origin found in the peripheral blood and are considered to be one of the roots of metastasis. Studies have linked CTCs to tumor progression in a variety of solid tumors [1], and the enumeration of CTCs from the blood of patients with epithelial carcinomas provides valuable insights associated with disease stage and treatment evaluations [2, 3]. CTCs correlate with distant metastases and are a surrogate marker of minimal residual disease.
There are established biomarkers with clinical utility that can diagnose and monitor metastatic disease and treatment response in patients based on the cancer type (e.g., prostate specific antigen) or based on the presence, or lack thereof, of certain tumor-specific markers (e.g., hormone receptor status). However, the standard of care for anti-cancer treatment monitoring usually involves radiographic imaging and fresh tissue biopsies [4, 5], which fail to address the heterogeneity of cancers. A liquid biopsy for CTC detection offers a minimally invasive and easily repetitive method to routinely monitor changes in the tumor cells (e.g., frequency, morphologic, and genomic) that possess potential to establish new metastatic sites. CTCs have been utilized as a prognostic or predictive tool for clinical outcome in patients with localized [6, 7], metastatic [8, 9], and recurrent disease [10, 11].
Many current technologies have demonstrated the clinical validity of CTC definitions that rely on overexpressed epithelial phenotype-specific markers to capture and/or identify CTCs [12, 13]. The efficacy of EpCAM-independent approaches in CTC isolation and enrichment has also been proven [14-16]. There is considerable evidence to support the presence of cancer stem-like cells (CSCs), an ultra-rare population of cells relative to the total tumor bulk. Several groups have demonstrated that there is a link between EMT induction and stem cell markers associated with neoplastic activity [17, 18]. Tumor cells of mesenchymal phenotype are characterized as highly motile and invasive, however, not all EMT-transformed cells are necessarily CSCs. CSCs demonstrate inherent treatment resistance and maintain the capacity for self- renewal, giving rise to the heterogeneous lineages of cancer cells that comprise a tumor; CSCs are also referred to as tumor-initiating cells (TICs) [19], cancer-initiating cells (CICs) [20], or metastasis- initiating cells (MICs) [21]. These rare cells have been identified and characterized in a variety of solid tumors [22, 23] as well as hematological malignancies [24]. Investigations using breast cancer models have demonstrated that under certain conditions, normal and neoplastic non-stem cells can convert to cells with a cancer stem-like phenotype either spontaneously or by induction of EMT [25, 26].
While CTCs are typically detected by the presence of epithelial cell markers, there is no universal CSC cell surface marker. However, certain CSC surface markers have been confirmed in several different cancers. Human cluster of differentiation (CD)133 (prominin-1, AC133) is a highly conserved transmembrane glycoprotein that is localized in various plasma membrane protrusions and is suggested to interact with the actin cytoskeleton [27]. CD133+ CSCs have been identified in brain [28], lung [29], colon [30, 31], ovarian [32], prostate [33], gastric [34-36], breast [37, 38], and pancreatic cancers [39, 40]; expression of CD133 protein has been shown to increase the tumorigenic potential and treatment resistance of tumor cells in these cancers. In addition to CD133, CSC biomarkers include CD44, CD34, and others [41]. Maeda et al. identified CD133 expression as an independent prognostic factor in pancreatic head carcinoma patients and demonstrated a significant correlation between CD133 expression and histological type, lymphatic invasion, lymph node metastasis, VEGF-C expression, and lower 5-year survival rates [42]. Furthermore, Ding et al. revealed that CD133 expression in pancreatic cancer cells contributes to migration and invasion [43]. The utility of CTCs as a diagnostic biomarker for pancreatic cancer has been established by previous studies [44-46]. Thus, the dual-detection of CSCs and CTCs could prove to serve as an important treatment monitoring tool for pancreatic cancer.
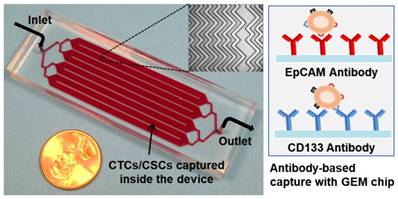
Herein, we report data of a clinical translational study aimed to characterize the relative populations of CTCs and CSCs. Because the treatment of pancreatic ductal adenocarcinoma (PDAC) requires multimodal therapeutic approaches and monitoring of tumor plasticity, these liquid biopsy biomarkers hold promise for evaluating treatment response promptly and guiding therapeutic modifications. Since CTC and CSC definitions are somewhat controversial, we use EpCAM+CK+CD45-DAPI+ cells or CD133+CK+CD45-DAPI+ cells, or other subtypes wherever possible. Our research group previously demonstrated the capture, release, and re-culture of rare CTCs from cancer patients using our geometrically enhanced mixing (GEM) microfluidic device in a malignancy where serial tumor biopsies are not feasible [47]. Similar microfluidic devices have been used to isolate rare CTCs, such as HB-chip [48], wavy-HB chip [49], CTC-chip [50], GEDI chip [51], and sinusoidal microchannel device [16]. Antibody- functionalized microfluidic devices showed advances in a malignancy where CTCs are not routinely detected by current commercial CTC assays [48, 50]. Using the EpCAM- or CD133-antibody immobilized microfluidic device shown in Figure 1, we demonstrate consistent detection of CTCs (EpCAM+CK+CD45-DAPI+) and CSCs (CD133+CK+CD45-DAPI+) from patients' blood samples and assess their utility in monitoring and evaluating treatment responses.
Picture of the 3 in × 1 in geometrically enhanced mixing (GEM) microfluidic chip, consisting of eight parallel channels with a single inlet and outlet. Inset (top): a SEM image of the herringbone mixers inside the channels. Inset (right): surface modified with CD133 antibodies for CSC capture and EpCAM antibodies for CTC capture.
Methods
Microfluidic devices
Device fabrication and instrument setup are as described previously [47]. To immobilize antibodies onto the microchannel surfaces, one device volume (100 µL) of 1 mg/mL avidin (Invitrogen, Carlsbad, CA) in phosphate buffered saline (PBS) was introduced into the device, incubated for 15 minutes, and then rinsed with a low-flow-rate PBS wash (1.5 µL/sec, 300 µL). Following avidin adsorption, 100 µL of 20 µg/mL biotinylated anti-EpCAM (Anti-Human CD326, eBioscience, San Diego, CA) or 100 µL of 20 µg/mL biotinylated anti-CD133 (clone AC133, Miltenyi Biotec, San Diego, CA) was introduced into the device, incubated for 15 minutes, and then rinsed with three high-flow-rate washes (2 µL/sec, 900 µL) of 2% bovine serum albumin (BSA) in PBS. The BSA solution was left in the devices for 20 minutes, to passivate microchannels and tubing to reduce non-specific adsorption prior to sample infusion. Functionalized devices were sealed and stored at 4 ºC (<4 hours) in a humidified container prior to infusing a patient sample. Low volume reagents (i.e., avidin and antibody solutions) were introduced into the device using very low vacuum pressure, as previously described [52]; all other reagents, buffers, and samples were infused into devices using syringe pumps (KD Legato 111, KD Scientific, Holliston, MA; PHD Ultra, Harvard Apparatus, Holliston, MA). For consistency, patient samples were always infused using the KD Legato 111 syringe pumps. The device has been characterized with detection sensitivity (capture efficiency) and specificity (cell purity), as well as the effects of flow rates and operational parameters on the device performance as reported previously [47].
Patients and sample collection
Patients with metastatic PDAC (AJCC stage IV; M1) undergoing active systemic treatment voluntarily provided peripheral blood for this study after providing informed consent. Over 80% of patients had liver metastases as their primary metastatic site, with the remaining minority having pulmonary metastases. All patients in this cohort may have received prior surgery or anti-cancer systemic therapy for their pancreatic cancer, but it had to have pre-dated enrollment in this cohort by a minimum of 30 days. Additionally, if prior treatment had been provided, radiographic measurable disease progression must have been documented prior to participation in this study. Thus, the impact of prior treatment on CTC counts was mitigated as much as it could be and reflects the diversity of clinical cases where this technology is needed. Table S1 presents the demographics of the 24 cancer patients. Active systemic treatment was provided every 2 weeks, consistent with standard of care treatment for advanced pancreatic cancer. Systemic therapy included either 5-fluorouracil, leucovorin and oxaliplatin (FOLFOX) or gemcitabine with abraxane. Some patients who were treated with FOLFOX were simultaneously enrolled in a clinical trial where they received dasatinib as a treatment adjunct. In all situations, phlebotomy was performed at time points when routine clinical care and phlebotomy were taking place. Blood (8-10 mL per patient) was drawn into BD Vacutainer tubes with anti-coagulant sodium heparin. The number of CTCs (EpCAM+CK+CD45- DAPI+) and CSCs (CD133+CK+CD45-DAPI+) were analyzed for each patient during their treatment. The CTC subtypes (EpCAM+CK+CD45-DAPI+CD133+ and EpCAM+CK+CD45-DAPI+CD133-) and CSC subtypes (CD133+CK+CD45-DAPI+EpCAM+ and CD133+CK+ CD45-DAPI+EpCAM-) were also analyzed using 4-color immunochemistry. The laboratory team was blinded about the clinical status or treatment outcomes of participating patients. This study was approved by the University of Florida Institutional Review Board.
Sample processing
Specimens were de-identified of any patient information and kept at room temperature after blood draw. All specimens were prepared and processed for CTC capture on the same day. Prior to processing, blood samples were diluted with a buffer solution (PBS) at a 1:1 ratio and centrifuged after layering over Ficoll-Paque PREMIUM density gradient medium (GE Healthcare) and spun at 800 × g for 30 minutes at 18 °C with no breaks and very low acceleration (setting to 2, on a scale of 0-9, Eppendorf Centrifuge 5804R). Each gradient layer, except for the bottom red blood cell (RBC) layer, was extracted, transferred to a new tube, and centrifuge-washed with 2% fetal bovine serum (FBS) in PBS. Most of the samples (77/78, 98.6%) were re-suspended and processed after gradient separation. For one patient sample, the blood was centrifuged (800 × g for 30 min. at 18 ºC), the plasma layer was removed, the remaining blood volume was diluted at a 1:1 ratio with buffer solution (PBS) and treated with RBC lysis buffer; this sample was processed in this manner due to technical issues encountered during isolation of the peripheral blood mononuclear cells (PBMC) using Ficoll-Paque™. The RBC lysis buffer was prepared by adding 155 mM (8.3 g/L) ammonium chloride in 0.01 M Tris-HCL buffer, with a pH of 7.5. In general, each patient sample tube (8 mL) was split evenly to infuse 4 mL into an EpCAM-functionalized device and 4 mL into a CD133-functionalized device for CTC and CSC enumeration, respectively. After blood preparation, cell pellets were re-suspended in a suspension buffer containing 1% BSA and 0.05% Tween-20 in PBS (200 µL for every 1 mL of whole blood) and passed through the microfluidic device at 1 µL/sec (i.e., 3.6 mL/h). Following patient sample introduction, non-specifically adhered cells were rinsed away with three high-flow-rate PBS washes (2 µL/sec, 900 µL).
Instrument setup and device scan
The patient blood samples were introduced into the GEM device by syringe pumping with a BD syringe connected to the inlet of the device via polymer tubing and a female luer-to-barb adapter (IDEX Health & Science, Oak Harbor, WA). An Olympus IX71 fluorescence microscope (Olympus America, Melville, NY) with an automated ProScan auto-scan stage (Prior Scientific, Rockland, MA) was used to take images of the device. First, the overview area was assigned and acquired for the entire device to obtain a 10× bright-field image. Then, each pair of microchannels was split into 10 sections, scanned and imaged at 20× magnification in bright-field and using filter cubes for DAPI, FITC (for CK), CY3 (for CD45), and CY5 (for APC-labeled EpCAM or CD133). Table S2 details the components of each filter cube (Chroma Technology Corporation, Bellows Falls, VT). The microchannel area arrayed with mixer structures was split into a total of 40 sections with each section measuring roughly 4.5 mm by 4.5 mm; the inlet and outlet bifurcated channel areas were scanned and imaged manually. The fluorescent images of an individual section area were overlaid to attain finalized detection images. ImageJ (U.S. National Institutes of Health, Bethesda, MA), CellProfiler (Broad Institute of Harvard and MIT, Cambridge, MA), and CellSens (Prior Scientific, Rockland, MA) were used as the imaging software to analyze cell images.
CTC and CSC enumeration
CTCs and CSCs were identified by using an antibody cocktail of fluorescein-isothiocyanate-labeled anti-cytokeratin (CK-FITC), phycoerythrin-labeled anti-CD45 (CD45-PE), and DAPI. The CTC staining protocol begins with cell fixation and permeabilization via incubation of 4% paraformaldehyde (PFA) and 0.2% Triton X-100 for 10 minutes, respectively, with a high-flow-rate PBS (2 µL/sec, 300 µL) rinse after each incubation. Three-color immunocytochemistry (DAPI, FITC-CK, and CD45-PE) alongside parallel phase analysis was performed to verify CTCs and identify non-specifically captured normal blood cells. The fluorescent filters used in microscopy are detailed in Table S2. To start the experiment, a solution of 2% BSA-PBS was introduced into the devices (2 µL/sec, 300 µL) and incubated for 20 minutes. An antibody cocktail composed of 12.5 µg/mL anti-CD45-PE, 25 µg/mL anti-CK-FITC, and 300 nM DAPI (at a 1:1:8 ratio, respectively) was introduced into the device, then incubated for 25-30 minutes, followed by three high-flow-rate PBS washes (2 µL/sec, 900 µL). CTCs and CSCs were verified as captured nucleated (DAPI+) cells that stained positive for CK and negative for the leukocyte marker, CD45. Nucleated cells staining positive for CD45 and negative for CK were identified as leukocytes. Phenotypic cytomorphological and nuclear features (consistent with malignant cells) were also considered when enumerating CTCs and CSCs: (1) entire nucleus housed within cytoplasm, (2) preserved cell membrane (fragments were not enumerated), and (3) cell size ≥5 µm. Isolated cancer cells from patients demonstrated overall pleomorphism, with a variety of cell sizes, shape, and nuclear-to-cytoplasmic (N/C) ratios.
CTC and CSC subtype analysis
In a subset of 16 samples, from 11 of the 24 metastatic PDAC patients, we performed CTC and CSC subtype analysis to determine co-expression of EpCAM and CD133 on captured cells. Subtype analysis capture experiments were performed similarly, processing the patient blood sample in 2 microdevices in parallel (4 mL each): one functionalized with anti-EpCAM and the other with anti- CD133. Four-color immunocytochemistry (DAPI, CK-FITC, CD45-PE, and APC-labeled EpCAM or APC-labeled CD133) was performed on this set of samples after microfluidic cell capture. In EpCAM- capture devices, anti-CD133-APC was used as the fourth labeling antibody. Correspondingly, in CD133- capture microdevices, anti-EpCAM-APC was used instead. Screening of captured cells for expression of CK was performed using 20× magnification, and the expression of EpCAM and CD133 was determined using 40× magnification.
Results and Discussion
CTC and CSC enumeration for PDAC patients
Of the patients enrolled in the clinical study, 24 unique patients with metastatic PDAC provided a total of 78 blood samples at different treatment time points for CTC and CSC isolation using the EpCAM or CD133 antibody functionalized microfluidic platform. We previously demonstrated the capability of our device to capture CTCs from whole blood [47]. In this study, we chose to perform PBMC isolation prior to sample infusion in order to increase throughput (3.3 min/mL vs. 16.7 min/mL) and blood volume processed (4 mL vs. 1 mL). Each individual patient sample was processed in parallel in two functionalized microfluidic devices (one anti-EpCAM- functionalized and one anti-CD133-functionalized). One-half of each patient sample (4 mL) was processed in a device with immobilized anti-EpCAM antibodies and the other half (4 mL) in a device with anti-CD133 antibodies.
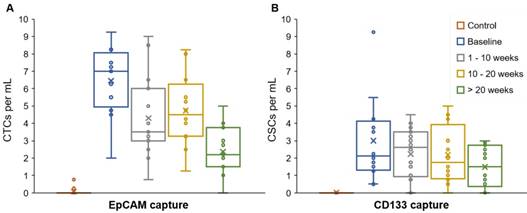
The majority (84.4%) of patient blood samples were positive for CTCs (EpCAM+CK+CD45-DAPI+) and 70.8% of samples were positive for CSCs (CD133+CK+CD45-DAPI+), using the highest baseline value of healthy samples as threshold. The threshold value was established based on healthy blood samples that served as negative control (Table S3). We detected an average of 3.87 CTCs/mL (S.D. = 2.43) and 2.02 CSCs/mL (S.D. = 1.73) in patient blood samples (Figure 2). The patient CTC and CSC enumeration data are shown in Table S4. Our results indicate that the number of CSCs is less than the number of CTCs; this is in general agreement with the CSC theory in the literature [41]. The data demonstrated a moderate correlation between CTC and CSC counts (0.425, p = 0.0008) and a weak correlation between CTCs and serum CA19-9 levels (0.320, p = 0.0136) (correlation table is presented in Table S6).
CTC and CSC enumeration data. The average, standard deviation, and spread of the CTC numbers (EpCAM+CK+CD45-DAPI+) were higher than the CSCs numbers (CD133+CK+CD45-DAPI+). EpCAM and CD133 were targeted to capture CTCs and CSCs, respectively. Expression of CK, CD45, and DAPI was determined using fluorescent staining and imaging.
This microfluidic platform and methodology enabled the reliable isolation of CTCs (EpCAM+CK+ CD45-DAPI+) and CSCs (CD133+CK+CD45-DAPI+) from stage IV, M1 PDAC patient samples. Interestingly, complementary assessment of both CTCs and CSCs appears advantageous to assess the progression of tumors, as discussed below. We have found in several patients, the CTC and CSC counts decreased with effective anti-cancer (consistency) treatment, and the numbers increased as cancer relapsed. This research has important implications for the application and interpretation of approved methods to use CTCs and CSCs as prognostic markers for real-time monitoring of cancer patients.
Treatment monitoring of patients
Patients were treated with systemic treatment involving chemotherapy after a baseline blood sample was drawn, and every 2 weeks thereafter. Patients were monitored based on complete blood count (CBC) analysis, serum CA19-9 levels, computed- tomography (CT) scans (every 2 months), and their desire or health status to remain on treatment. Measurable disease response and status were based on the RECIST criteria (version 1.1) for tumor response and scored as 'stable disease' (SD), 'progressive disease' (PD), 'partial response' (PR), or 'complete response' (CR), as previously described [53]. CTC and CSC numbers from each patient were correlated with their disease burden and treatment response.
For our analysis of treatment monitoring using CTC and CSC numbers, we focused on enumeration trends rather than absolute CTC and CSC numbers to help address interpatient heterogeneity. A cohort of 10 patients was used to determine the correlation of CTC and CSC numbers to patient treatment response. The remainder of the patient data can be found in Table S4 and Table S5. The CTC and CSC enumeration results for P-07, P-15, P-30, P-35, P-36 and P-38 are shown in Figure 3. In two cases, the CTC and CSC numbers were consistently low and decreasing, which was in agreement with the stable radiographic disease status of P-07 and P-15 (Figure 3A and 3B). In the case of P-30 (Figure 3C), CSCs numbers rapidly increased and reached similar numbers to that of CTCs. This seemingly poor response to treatment was in perfect alignment with radiographic data demonstrating progressive disease of the patient. For P-35 (Figure 3D), a small initial treatment response of declining CTC numbers is observed, followed by a steady increase all the way through end of treatment in cycle 6 during which time the CT scans showed progression of the cancer. CSC counts for P-35 remained steadily high (3.4/mL ± 0.3) throughout the patient's entire treatment; in this case, the CSC trend suggests stable disease while the magnitude of the CSC numbers would suggest a persistently high prevalence of a subpopulation of malignant cells that are associated with treatment resistance. P-36 CSC numbers (Figure 3E) were amongst the lowest in all patients studied (0.45/mL ± 0.45) and was considered positive for CSCs only in the last enumeration cycle. CTC numbers for P-36 demonstrated an initial decrease and remained low until a significant spike at cycle 14. CTC numbers correlated precisely to initial treatment response and then progressive disease evaluated when the increase in CTC counts were detected. The CTC and CSC enumeration of P-38 (Figure 3F) demonstrated stable CTC numbers and steadily increasing CSC numbers. At cycle 4, the patient's status was evaluated as “stable disease and slightly improved”, based on CT scans of the tumors.
Longitudinal enumeration of CTCs and CSCs during treatment. Graphs A-F show the evolution of CTC and CSC numbers during the clinical course and treatment of a set of PDAC patients. All patients were undergoing chemotherapy. Green arrows depict computed-tomography scans (CT scans). Each treatment cycle is 2 weeks long.
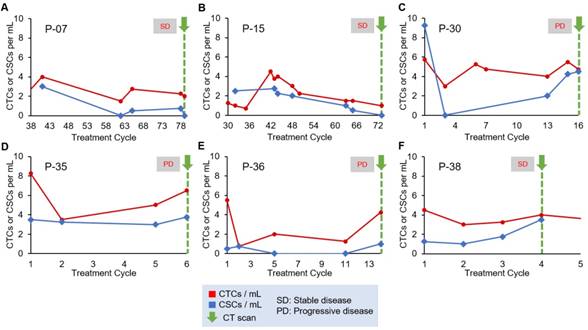
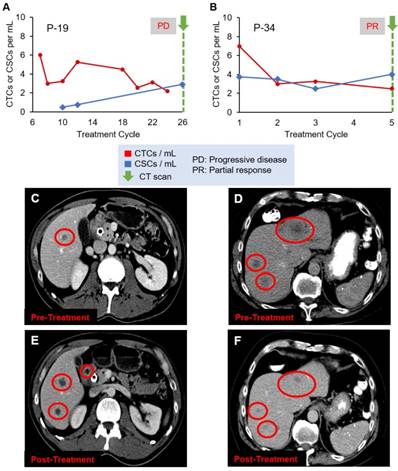
Figure 4 shows two additional patient cases, P-19 and P-34, with CT scan images. A CT scan taken at the last treatment cycle showed progression of disease (Figure 4C and 4E). Although CTC numbers were declining (Figure 4A), CSC numbers were increasing, correlating with disease progression, which may indicate development of treatment resistant clones. P-34 showed an initial decrease followed by a slow decline of CTC numbers, while CSC numbers showed stable quantity (Figure 4B). The CT scans (Figures 4D and 4F) show the patient responded to the therapy, which was in agreement with the decreasing CTC counts.
Evolution of CTC and CSC enumeration in relation to CT scans of patients (A) P-19 and (B) P-34. (C) and (D) are the CT scans of the two patients, respectively, before treatment, while (E) and (F) are the images after treatment, demonstrating the disease progression (C and E) or response to therapy (D and F). Liver metastases are the dark spots in the liver identified by the red circles.
Our results highlight the potential of this technology as an adjunct to traditional clinical monitoring methods for cancer. In the majority of the cases, the CTC and CSC trends parallel each other during the clinical course, but for a minority, additional CSC enumeration may help determine whether the cells detected represent progressive clonal treatment resistance ultimately emerging as progressive disease. To confirm resistant cell clones, additional mutational analysis would be needed.
CTC and CSC subtype enumeration
Blood samples from patients with metastatic (stage IV, M1) pancreatic adenocarcinoma were analyzed for CTC subtype enumeration using the GEM device. Patient blood was pumped through either an anti-EpCAM-coated or an anti-CD133-coated device. A total of 16 samples from 11 of the 24 patients were tested in these experiments. The patient CTC and CSC subtype enumeration data are shown in Table S5. After fixation and permeabilization, four-color immunocytochemistry was utilized to identify and count CTCs and CSCs, as well as their respective subtypes, from nonspecifically captured white blood cells, using FITC-labeled anti-CK (green), PE-labeled anti-CD45 (yellow/orange), APC-labeled anti-CD133 (red) or APC-labeled anti-EpCAM (red), and DAPI (blue) for staining. There were 4 phenotypic signatures of captured rare cells, given below, based on the capture antibody used and the fluorescent staining antibodies. There were two CTC subtypes: EpCAM+CK+CD45- DAPI+CD133+ and EpCAM+CK+CD45-DAPI+CD133-; as well as two CSC subtypes: CD133+CK+CD45-DAPI+ EpCAM+ and CD133+CK+CD45-DAPI+EpCAM-.
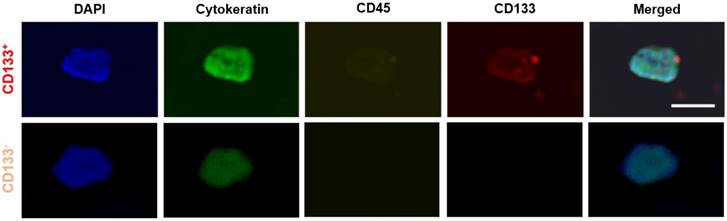
Using anti-EpCAM-coated devices, 3 of 16 samples (18.8%) were found to have CD133+ CTC subtypes (EpCAM+CK+CD45-DAPI+CD133+). In these 16 samples, 16 of 120 CTCs (13.3%) expressed CD133. Fluorescent images of CTCs with and without CD133 expression are shown in Figure 5. Using anti-CD133- coated device, 4 of 16 samples (25%) were found to have EpCAM+ CSC subtypes (CD133+CK+CD45- DAPI+EpCAM+). Within the 16 samples, 20 of 88 CSCs (22.7%) also expressed EpCAM. In addition, in 5 out of the 16 samples (31.3%), CSCs exhibited cytokeratin expression that did not express EpCAM (i.e., CD133+CK+CD45-DAPI+EpCAM-). This result is roughly in line with the literature, which states that CTCs remain undetected by conventional EpCAM- based methods and by the CellSearch® system in about one third of metastatic cancer patients [54].
Representative images of CTC subtypes: CD133 positive (top row) and CD133 negative (bottom row) subtypes. All 'CTC subtypes' were isolated in EpCAM-functionalized devices and confirmed using the FDA-approved definition of a CTC (DAPI+CK+CD45-). Expression of CD133 (red), CK (green), CD45 (yellow), and DAPI (blue) was determined using fluorescent staining and imaging. Scale bar represents 20 µm.
Conclusions
The underlying mechanisms involved in CD133- mediated induction of stem-like properties in cancer cells have yet to be elucidated. To date, few mechanisms have been proposed to link CD133 function and CSC biology [55]. Several research groups have identified distinct tumor-initiating cell subpopulations associated with CD133 expression [37-40, 42, 56, 57]. Therefore, it is possible that co-expression, or lack thereof, of other markers (e.g., CXCR4, VEGF, N-cadherin, ALDH, CD44, CD24, Annexin V, Vimentin, etc.) plays a complementary role in determining the clinical utility of blood-derived CD133+ CSC analysis. Although our approach to capture CTCs and CSCs by targeting the EpCAM and CD133 markers, respectively, has proved to consistently isolate and identify these rare malignant cells in the blood of metastatic pancreatic cancer patients, there is likely a population of CTCs or CSCs with low or no expression of EpCAM and/or CD133 antigens. To fully demonstrate the clinical utility of CD133+ CTCs, a larger trial with further confirmation of the mutational status of isolated tumor cells is needed.
Future studies that focus on the identification of rare malignant tumor cells circulating in the blood of patients should consider the addition of other markers to rule out other normal cells that may stain for CK (e.g., CD66b to rule out activated granulocytes) or CD133 [58]. The significant advances in next- generation sequencing (NGS) and single-cell technologies could be utilized in future CTC analyses for more in-depth assessment of isolated tumor cells [59, 60]. In addition, the presence of mutated circulating tumor DNA (ctDNA), alongside CTC and CSC examination, can be used to verify whether any of them is representative of relevant metastatic cell clones [61].
Our results showed that the identification, isolation, and characterization of CTCs and CSCs are feasible for cancers previously felt to be devoid of CTCs or for which clinical utility was questioned. Furthermore, the data showed that CSCs represent a measurable subset of the total CTC population. Such findings support the premise that increased sensitivity in assay refinements will likely be paramount to realize the true potential of the liquid biopsies, particularly as a surrogate marker for treatment response, relapse monitoring, and ultimate improvement in overall survival [20]. This pilot study can serve as proof-of-concept, demonstrating the capability of our technique to isolate and identify CSCs in the context of rare CTCs. Tumors that are rich in CSCs are associated with aggressive disease and poor prognosis [62], indicating that an understanding of their biology is pertinent to developing effective therapies.
Supplementary Material
Supplementary figures and tables.
Acknowledgements
Research reported in this publication was supported in part by the McJunkin Family Charitable Foundation, the University of Florida (UF) Division of Sponsored Research (Preparatory Grant), and the UF Health Cancer Center. Publication of this article was funded in part by the University of Florida Open Access Publishing Fund. Jose Varillas was supported in part by the University of Florida Clinical and Translational Science Awards (TL1TR001428 and UL1TR001427) and the Robert C. Pittman Fellowship of the Nanoscience Institute for Medical and Engineering Technology (NIMET).
Competing Interests
The authors have declared that no competing interest exists.
References
1. Shiozawa Y, Nie B, Pienta KJ, Morgan TM, Taichman RS. Cancer stem cells and their role in metastasis. Pharmacology & therapeutics. 2013;138:285-93
2. Hou HW, Warkiani ME, Khoo BL, Li ZR, Soo RA, Tan DS. et al. Isolation and retrieval of circulating tumor cells using centrifugal forces. Scientific Reports. 2013;3:1259
3. Alix-Panabières C, Pantel K. Challenges in circulating tumour cell research. Nature Reviews Cancer. 2014;14:623
4. Graham LJ, Shupe MP, Schneble EJ, Flynt FL, Clemenshaw MN, Kirkpatrick AD. et al. Current approaches and challenges in monitoring treatment responses in breast cancer. Journal of Cancer. 2014;5:58-68
5. Therasse P, Arbuck SG, Eisenhauer EA, Wanders J, Kaplan RS, Rubinstein L. et al. New guidelines to evaluate the response to treatment in solid tumors. European Organization for Research and Treatment of Cancer, National Cancer Institute of the United States, National Cancer Institute of Canada. Journal of the National Cancer Institute. 2000;92:205-16
6. Kolostova K, Broul M, Schraml J, Cegan M, Matkowski R, Fiutowski M. et al. Circulating tumor cells in localized prostate cancer: isolation, cultivation in vitro and relationship to T-stage and Gleason score. Anticancer Research. 2014;34:3641-6
7. Sola M, Margeli M, Castella E, Cirauqui B, Mariscal A, Rull M. et al. Detection of disseminated tumor cells in locally advanced breast cancer patients before primary systemic therapy. Breast. 2013;22:908-13
8. Green TL, Cruse JM, Lewis RE, Craft BS. Circulating tumor cells (CTCs) from metastatic breast cancer patients linked to decreased immune function and response to treatment. Experimental and Molecular Pathology. 2013;95:174-9
9. Cristofanilli M, Budd GT, Ellis MJ, Stopeck A, Matera J, Miller MC. et al. Circulating tumor cells, disease progression, and survival in metastatic breast cancer. The New England Journal of Medicine. 2004;351:781-91
10. Banys-Paluchowski M, Schneck H, Blassl C, Schultz S, Meier-Stiegen F, Niederacher D. et al. Prognostic Relevance of Circulating Tumor Cells in Molecular Subtypes of Breast Cancer. Geburtshilfe und Frauenheilkunde. 2015;75:232-7
11. Poveda A, Kaye SB, McCormack R, Wang S, Parekh T, Ricci D. et al. Circulating tumor cells predict progression free survival and overall survival in patients with relapsed/recurrent advanced ovarian cancer. Gynecologic Oncology. 2011;122:567-72
12. Parkinson DR, Dracopoli N, Petty BG, Compton C, Cristofanilli M, Deisseroth A. et al. Considerations in the development of circulating tumor cell technology for clinical use. Journal of Translational Medicine. 2012;10:138
13. Mohamadi RM, Besant JD, Mepham A, Green B, Mahmoudian L, Gibbs T. et al. Nanoparticle-mediated binning and profiling of heterogeneous circulating tumor cell subpopulations. Angew Chem Int Ed Engl. 2015;54:139-43
14. Ozkumur E, Shah AM, Ciciliano JC, Emmink BL, Miyamoto DT, Brachtel E. et al. Inertial focusing for tumor antigen-dependent and -independent sorting of rare circulating tumor cells. Science Translational Medicine. 2013;5:179ra47
15. Gabriel MT, Calleja LR, Chalopin A, Ory B, Heymann D. Circulating Tumor Cells: A Review of Non-EpCAM-Based Approaches for Cell Enrichment and Isolation. Clin Chem. 2016;62:571-81
16. Witek MA, Aufforth RD, Wang H, Kamande JW, Jackson JM, Pullagurla SR. et al. Discrete microfluidics for the isolation of circulating tumor cell subpopulations targeting fibroblast activation protein alpha and epithelial cell adhesion molecule. NPJ Precis Oncol. 2017:1
17. Mani SA, Guo W, Liao MJ, Eaton EN, Ayyanan A, Zhou AY. et al. The epithelial-mesenchymal transition generates cells with properties of stem cells. Cell. 2008;133:704-15
18. Morel AP, Lievre M, Thomas C, Hinkal G, Ansieau S, Puisieux A. Generation of breast cancer stem cells through epithelial-mesenchymal transition. PloS One. 2008;3:e2888
19. Zhou BB, Zhang H, Damelin M, Geles KG, Grindley JC, Dirks PB. Tumour-initiating cells: challenges and opportunities for anticancer drug discovery. Nature Reviews Drug Discovery. 2009;8:806-23
20. Cripe TP, Wang PY, Marcato P, Mahller YY, Lee PW. Targeting cancer-initiating cells with oncolytic viruses. Molecular therapy: the Journal of the American Society of Gene Therapy. 2009;17:1677-82
21. Wculek SK, Malanchi I. Neutrophils support lung colonization of metastasis-initiating breast cancer cells. Nature. 2015;528:413-7
22. Maccalli C, Volonte A, Cimminiello C, Parmiani G. Immunology of cancer stem cells in solid tumours. A review. European Journal of Cancer. 2014;50:649-55
23. Elshamy WM, Duhe RJ. Overview: cellular plasticity, cancer stem cells and metastasis. Cancer letters. 2013;341:2-8
24. Ghiaur G, Gerber J, Jones RJ. Concise review: Cancer stem cells and minimal residual disease. Stem Cells. 2012;30:89-93
25. Chaffer CL, Brueckmann I, Scheel C, Kaestli AJ, Wiggins PA, Rodrigues LO. et al. Normal and neoplastic nonstem cells can spontaneously convert to a stem-like state. Proceedings of the National Academy of Sciences of the United States of America. 2011;108:7950-5
26. Beuran M, Negoi I, Paun S, Ion AD, Bleotu C, Negoi RI. et al. The epithelial to mesenchymal transition in pancreatic cancer: A systematic review. Pancreatology: Official Journal of the International Association of Pancreatology. 2015;15:217-25
27. Weigmann A, Corbeil D, Hellwig A, Huttner WB. Prominin, a novel microvilli-specific polytopic membrane protein of the apical surface of epithelial cells, is targeted to plasmalemmal protrusions of non-epithelial cells. Proceedings of the National Academy of Sciences of the United States of America. 1997;94:12425-30
28. Singh SK, Hawkins C, Clarke ID, Squire JA, Bayani J, Hide T. et al. Identification of human brain tumour initiating cells. Nature. 2004;432:396-401
29. Tirino V, Camerlingo R, Franco R, Malanga D, La Rocca A, Viglietto G. et al. The role of CD133 in the identification and characterisation of tumour- initiating cells in non-small-cell lung cancer. Eur J Cardio-Thorac. 2009;36:446-53
30. Ricci-Vitiani L, Fabrizi E, Palio E, De Maria R. Colon cancer stem cells. Journal of Molecular Medicine. 2009;87:1097-104
31. Chen S, Song X, Chen Z, Li X, Li M, Liu H. et al. CD133 Expression and the Prognosis of Colorectal Cancer: A Systematic Review and Meta-Analysis. PloS One. 2013;8:e56380
32. Curley MD, Therrien VA, Cummings CL, Sergent PA, Koulouris CR, Friel AM. et al. CD133 Expression Defines a Tumor Initiating Cell Population in Primary Human Ovarian Cancer. Stem Cells. 2009;27:2875-83
33. Collins AT, Berry PA, Hyde C, Stower MJ, Maitland NJ. Prospective identification of tumorigenic prostate cancer stem cells. Cancer Research. 2005;65:10946-51
34. Wakamatsu Y, Sakamoto N, Oo HZ, Naito Y, Uraoka N, Anami K. et al. Expression of cancer stem cell markers ALDH1, CD44 and CD133 in primary tumor and lymph node metastasis of gastric cancer. Pathology International. 2012;62:112-9
35. Wen L, Chen X-Z, Yang K, Chen Z-X, Zhang B, Chen J-P. et al. Prognostic Value of Cancer Stem Cell Marker CD133 Expression in Gastric Cancer: A Systematic Review. PloS One. 2013;8:e59154
36. Pu X, Chang-Liang S, Jin-Fang L, Dan W, Xiao-Yan X. Prognostic value of circulating CD133+ cells in patients with gastric cancer. Cell Proliferation. 2015;48:311-7
37. Bock C, Rack B, Huober J, Andergassen U, Jeschke U, Doisneau-Sixou S. Distinct expression of cytokeratin, N-cadherin and CD133 in circulating tumor cells of metastatic breast cancer patients. Future Oncology. 2014;10:1751-65
38. Brugnoli F, Grassilli S, Lanuti P, Marchisio M, Al-Qassab Y, Vezzali F. et al. Up-modulation of PLC-β2 reduces the number and malignancy of triple-negative breast tumor cells with a CD133+/EpCAM+ phenotype: a promising target for preventing progression of TNBC. BMC Cancer. 2017;17:617
39. Hermann PC, Huber SL, Herrler T, Aicher A, Ellwart JW, Guba M. et al. Distinct populations of cancer stem cells determine tumor growth and metastatic activity in human pancreatic cancer. Cell Stem Cell. 2007;1:313-23
40. Poruk KE, Blackford AL, Weiss MJ, Cameron JL, He J, Goggins M. et al. Circulating Tumor Cells Expressing Markers of Tumor-Initiating Cells Predict Poor Survival and Cancer Recurrence in Patients with Pancreatic Ductal Adenocarcinoma. Clinical Cancer Research. 2017;23:2681-90
41. Nguyen LV, Vanner R, Dirks P, Eaves CJ. Cancer stem cells: an evolving concept. Nature Reviews Cancer. 2012;12:133-43
42. Maeda S, Shinchi H, Kurahara H, Mataki Y, Maemura K, Sato M. et al. CD133 expression is correlated with lymph node metastasis and vascular endothelial growth factor-C expression in pancreatic cancer. Brit J Cancer. 2008;98:1389-97
43. Ding Q, Yoshimitsu M, Kuwahata T, Maeda K, Hayashi T, Obara T. et al. Establishment of a highly migratory subclone reveals that CD133 contributes to migration and invasion through epithelial-mesenchymal transition in pancreatic cancer. Hum Cell. 2012;25:1-8
44. Court CM, Ankeny JS, Hou S, Tseng HR, Tomlinson JS. Improving pancreatic cancer diagnosis using circulating tumor cells: prospects for staging and single-cell analysis. Expert Rev Mol Diagn. 2015;15:1491-504
45. Pimienta M, Edderkaoui M, Wang R, Pandol S. The Potential for Circulating Tumor Cells in Pancreatic Cancer Management. Front Physiol. 2017;8:381
46. Xie ZB, Yao L, Jin C, Fu DL. Circulating tumor cells in pancreatic cancer patients: efficacy in diagnosis and value in prognosis. Discov Med. 2016;22:121-8
47. Sheng W, Ogunwobi OO, Chen T, Zhang J, George TJ, Liu C. et al. Capture, release and culture of circulating tumor cells from pancreatic cancer patients using an enhanced mixing chip. Lab on a Chip. 2014;14:89-98
48. Stott SL, Hsu CH, Tsukrov DI, Yu M, Miyamoto DT, Waltman BA. et al. Isolation of circulating tumor cells using a microvortex-generating herringbone-chip. Proceedings of the National Academy of Sciences of the United States of America. 2010;107:18392-7
49. Wang S, Thomas A, Lee E, Yang S, Cheng X, Liu Y. Highly efficient and selective isolation of rare tumor cells using a microfluidic chip with wavy-herringbone micro-patterned surfaces. The Analyst. 2016;141:2228-37
50. Nagrath S, Sequist LV, Maheswaran S, Bell DW, Irimia D, Ulkus L. et al. Isolation of rare circulating tumour cells in cancer patients by microchip technology. Nature. 2007;450:1235-9
51. Gleghorn JP, Pratt ED, Denning D, Liu H, Bander NH, Tagawa ST. et al. Capture of circulating tumor cells from whole blood of prostate cancer patients using geometrically enhanced differential immunocapture (GEDI) and a prostate-specific antibody. Lab on a Chip. 2010;10:27-9
52. Varillas JI, Chen K, Zhang J, George TJ Jr, Hugh Fan Z. A Novel Microfluidic Device for Isolation of Circulating Tumor Cells from Pancreatic Cancer Blood Samples. Methods in Molecular Biology. 2017;1634:33-53
53. Eisenhauer EA, Therasse P, Bogaerts J, Schwartz LH, Sargent D, Ford R. et al. New response evaluation criteria in solid tumours: revised RECIST guideline (version 1.1). European Journal of Cancer. 2009;45:228-47
54. Grover PK, Cummins AG, Price TJ, Roberts-Thomson IC, Hardingham JE. Circulating tumour cells: the evolving concept and the inadequacy of their enrichment by EpCAM-based methodology for basic and clinical cancer research. Annals of Oncology. 2014;25:1506-16
55. Jang JW, Song Y, Kim SH, Kim J, Seo HR. Potential mechanisms of CD133 in cancer stem cells. Life Sciences. 2017;184:25-9
56. Li C, Heidt DG, Dalerba P, Burant CF, Zhang L, Adsay V. et al. Identification of pancreatic cancer stem cells. Cancer Research. 2007;67:1030-7
57. Kim MP, Fleming JB, Wang HM, Abbruzzese JL, Choi W, Kopetz S. et al. ALDH Activity Selectively Defines an Enhanced Tumor-Initiating Cell Population Relative to CD133 Expression in Human Pancreatic Adenocarcinoma. PloS One. 2011:6
58. Che J, Yu V, Dhar M, Renier C, Matsumoto M, Heirich K. et al. Classification of large circulating tumor cells isolated with ultra-high throughput microfluidic Vortex technology. Oncotarget. 2016;7:12748-60
59. Navin NE. Cancer genomics: one cell at a time. Genome Biol. 2014;15:452
60. Zhu Z, Qiu S, Shao K, Hou Y. Progress and challenges of sequencing and analyzing circulating tumor cells. Cell Biol Toxicol. 2018;34:405-15
61. Alix-Panabieres C, Pantel K. Real-time liquid biopsy: circulating tumor cells versus circulating tumor DNA. Ann Transl Med. 2013;1:18
62. Ailles LE, Weissman IL. Cancer stem cells in solid tumors. Current Opinion in Biotechnology. 2007;18:460-6
Author contact
![]() Corresponding authors: Z. Hugh Fan (hfanedu) and Thomas J. George (thom.georgeufl.edu)
Corresponding authors: Z. Hugh Fan (hfanedu) and Thomas J. George (thom.georgeufl.edu)