Impact Factor
- Issue 14; 2026
- Issue 13; 2026
- Issue 12; 2026
- Issue 11; 2026
- Issue 10; 2026
- Volume 16; 2026
- Advance Articles
- Past Issues
- Cover Images
- Cover Suggestion
- Index & Coverage
- Special Issues
Introduction
Methods
Results
Discussion
Abbreviations
Supplementary Material
Acknowledgements
References
International Journal of Biological Sciences
International Journal of Medical Sciences
 Global reach, higher impact

Theranostics 2019; 9(4):974-985. doi:10.7150/thno.30835 This issue Cite
Research Paper
Near infrared imaging of epidermal growth factor receptor positive xenografts in mice with domain I/II specific antibody fragments
Wendy Bernhard1, Ayman El-Sayed1†, Kris Barreto1†, Carolina Gonzalez1, Humphrey Fonge2,3,4 ![]() , Clarence Ronald Geyer1
, Clarence Ronald Geyer1 ![]()
1. Department of Pathology and Laboratory Medicine, University of Saskatchewan, College of Medicine, Saskatoon SK, Canada
2. Department of Medical Imaging, University of Saskatchewan, College of Medicine, Saskatoon SK, Canada
3. Saskatchewan Centre for Cyclotron Sciences (SCCS), the Fedoruk Centre, Saskatoon SK, Canada
4. Department of Medical Imaging, Royal University Hospital Saskatoon, Saskatoon SK, Canada
†These authors contributed equally to this work.
Received 2018-10-21; Accepted 2018-12-31; Published 2019-1-30
Abstract

Epidermal growth factor receptor (EGFR) is a transmembrane cell surface receptor that is frequently overexpressed and/or mutated in many cancers. Therapies targeting EGFR have poor outcomes due to the lack of reliable diagnostic tests to monitor EGFR. Current in vitro EGFR diagnostic methods are invasive, requiring biopsies, which limits tumor sampling and availability. EGFR molecular imaging provides non-invasive whole-body images capable of detecting primary tumors and metastases, which can be used to diagnose and monitor response to therapy.
Methods: We evaluated properties of two anti-EGFR fragments, 8708 and 8709, as molecular-targeted imaging probes. 8708 and 8709 are anti-EGFR antigen binding fragments (Fabs) that recognize domain I/II of EGFR, which is distinct from epitopes recognized by current anti-EGFR therapeutic antibodies. We used complementarity determining region sequences from 8708 and 8709 Fabs to generate an anti-EGFR IgG and (scFv)2 and scFv-Fc antibody fragments. We expressed, purified, and labeled the IgG and fragments with IRDye800CW and used them to image EGFR-positive and -negative xenografts in CD-1 nude mice. 8709 scFv-Fc was also tested for competitive binding with the therapeutic anti-EGFR antibody nimotuzumab and for quantifying ratios of EGFR and EGFRvIII deletion mutant.
Results: IRDye800CW-labeled 8708 (scFv)2 and 8709 scFv-Fc imaging probes showed high levels of accumulation and good retention in EGFR-positive xenografts, with peak accumulation occurring at 24 and 48 hours post injection, respectively. IRDye680RD-labeled 8709 scFv-Fc did not compete with IRDye800CW-labeled nimotuzumab for EGFR binding as assayed by flow cytometry using an EGFR-positive cell line. IRDye680RD-labeled 8709 scFv-Fc and IRDye800CW-labeled nimotuzumab used in combination were able to determine the ratio of cells expressing EGFR and a deletion mutant EGFRvIII.
Conclusion: IRDye800CW-labeled 8708 (scFv)2 and 8709 scFv-Fc had desirable binding affinities, clearance times, and tumor accumulation to be used for imaging in combination with current EGFR targeted therapies. This study highlights the potential for using 8708 (scFv)2 and 8709 scFv-Fc as EGFR diagnostic and therapy monitoring tools.
Keywords: EGFR, near infrared fluorescence imaging, IRDye800CW, antibody fragments
Introduction
Molecular-targeted imaging probes are used to identify tumors, define tumor markers and margins, and monitor tumor response to therapy. Epidermal growth factor receptor (EGFR) is overexpressed or mutated in a number of cancers [1]. Current EGFR diagnostic assays are invasive and suffer from a number of caveats. For example, to assess the status of an EGFR-positive cancer, the cancerous tissues must be biopsied or surgically resected and tested for EGFR expression or specific mutations [2]. These procedures are limited in their applicability due to the heterogeneous expression and mutation status of EGFR within a patient and throughout the tumor itself [3]. Further, it is not possible to comprehensively biopsy tumors or identify metastatic lesions and EGFR mutations as they can change over time and in response to treatment [3].
EGFR is widely studied as a therapeutic target and more recently as an imaging target. There are currently four therapeutic EGFR-targeting antibodies, cetuximab, panitumumab, necitumumab, and nimotuzumab. Cetuximab and panitumumab have been conjugated to different tracers and are currently in clinical trials for imaging [4]. PET imaging studies using 89Zr-labeled cetuximab show a correlation between probe uptake in the tumor and response to therapy [5], highlighting the ability of molecular-targeted imaging probes to select patients for therapy. When the molecular-targeted imaging probe is constructed from a therapeutic, it is limited in its ability to assess therapeutic response, as it must compete with the therapeutic for tumor uptake. For example, during cetuximab therapy, PET imaging with 89Zr-labeled cetuximab is not feasible since the therapeutic dose of cetuximab blocks EGFR binding of the imaging probe [6]. To overcome this problem, imaging probes are being sought that bind to epitopes on EGFR that are distinct from epitopes recognized by therapeutic antibodies. Currently, all EGFR therapeutic antibodies bind epitopes on domain III of EGFR [7-9].
Since all current EGFR therapeutic antibodies bind domain III, diagnostic imaging could be problematic since EGFR mutations have been observed that are resistant to cetuximab in colorectal and head and neck cancers [10, 11] and to cetuximab and panitumumab in gastrointestinal cancers [12]. Patients with these mutations do not respond well to anti-EGFR antibody therapy. The EGFR status of patients with these resistant mutations will not be accurately diagnosed with imaging probes based on the therapeutic antibodies since these antibodies do not bind to the mutant EGFR. In this case, imaging may reveal that EGFR is not overexpressed in these cancers. This information is important for patient therapy, as treatments could be changed to other anti-EGFR therapeutics that do not bind to domain III. Other EGFR mutations such as EGFRvIII, a tumor-specific deletion that produces a truncated form of EGFR, lacking domain I and most of domain II [13, 14], can also affect imaging probe binding. EGFRvIII is expressed in a number of cancers, including glioblastoma, breast, colorectal, and prostate [15]. In glioblastoma, more than half of tumors overexpressing EGFR also express EGFRvIII [15]. Detecting EGFRvIII would be valuable, as therapies targeting EGFRvIII have shown efficacy in glioblastoma [15].
Here, we evaluated imaging properties of antibody fragments that recognize domains I/II of EGFR. We previously isolated two anti-EGFR Fabs, 8708 and 8709, which bind domains I/II of EGFR [16]. We used the complementarity determining regions (CDRs) of these Fabs to construct IRDye800CW-labeled (scFv)2, scFv-Fc, and IgG imaging probes. We evaluated their in vitro and in vivo imaging properties in mouse cancer xenograft models.
Methods
Cloning
CDRs from 8708 and 8709 Fabs [16] were subcloned as (scFv)2, scFv-Fc, and IgG as described previously [17].
Cell line maintenance
Cell growth media was obtained from Thermo Fisher Scientific. A-431 (CRL-1555) and MDA-MB-435S (HTB-129) cell lines were obtained from and authenticated by ATCC and grown at 37°C with 5% CO2 in 90% Roswell Park Memorial Institute medium (RPMI) supplemented with 10% fetal bovine serum (FBS). HEK293T cells (CRL-3216) were obtained from and authenticated by ATCC and grown at 37°C with 5% CO2 in 90% Dulbecco's Modified Eagle's Medium (DMEM) supplemented with 10% FBS. Expi293F cells (A14527) were obtained from and authenticated by Thermo Fisher Scientific and grown at 37°C with 5% CO2 in Expi293 media. All cell lines were expanded after receiving and multiple aliquots were cryopreserved. Cell lines were propagated for a maximum of one month.
Protein expression and purification
Plasmids expressing scFv-Fcs and IgGs were transfected in Expi293 cells using ExpiFectamine (Thermo Fisher Scientific, Hampton, NH), according to the manufacturer's protocol. Proteins were purified using a MabSelect SuRe column (Thermo Fisher Scientific, Hampton, NH) as previously described [17]. Plasmids expressing Fab and (scFv)2 fragments were transfected into Rosetta (DE3) electro-competent E. coli cells (Millipore, Burlington, MA) and purified using a HiTrap protein L column (Thermo Fisher Scientific, Hampton, NH) as previously described [17]. The extinction coefficient was determined using Expasy protparam (www.expasy.org/tools/protparam.html).
Bioanalyzer
Unlabeled and IRDye800CW-labeled 8708 and 8709 fragments were analyzed using an Agilent 2100 Bioanalyzer (Agilent Technologies, Santa Clara, CA) with the Agilent Technologies High Sensitivity Protein 250 Kit under non-reducing conditions. Samples were diluted to 0.5 mg/mL and processed according to the manufacturer's instructions. The size and purity were calculated using Agilent 2100 Expert software.
Labeling antibodies and antibody fragments
Antibody fragments were labeled with the IRDye800CW-NHS (LI-COR Biosciences, Lincoln, NE) or IRDye680RD-NHS, following the manufacturer's instructions and as previously described [18]. The labeling ratio was calculated by measuring the absorbance at 280 nm and 780 nm for IRDye800CW-labeled proteins and at 280 nm and 672 nm for the IRDye680RD-labeled proteins and calculated using the following formula: (IRDye/protein) = (A780/εIRDye)/A280 - (0.03 x A780)/ εProtein. Where εIRDye is the extinction coefficient of the IRDye, 0.03 is a correction factor for the absorbance of the fluorescent dyes, and εProtein is the extinction coefficient for the protein.
Transient transfection into HEK293T cells
8 x 10⁵ HEK293T cells were plated 24 hours before transfection in complete media. Plasmids (2 µg) expressing either wild-type EGFR-GFP (Addgene, Cambridge MA) or mutant EGFRvIII-GFP [16] were mixed with 100 µL of Opti-Eagles minimum essential media (Opti-MEM) (Thermo Fisher Scientific, Hampton, NH) to a final concentration of 30 µg/mL. Polyethylenimine (PEI) (Sigma, Aldrich, St. Louis, MI) was added to 100 µL of Opti-MEM to a final concentration of 120 µg/mL. Plasmids were added to the PEI mixture and incubated at room temperature for 20 minutes. The transfection reaction was added drop wise to cells and incubated at 37°C with 5% CO2 for 48 hours.
Flow cytometry binding assay
In vitro binding studies of IRDye800CW-labeled 8708 and 8709 antibody fragments were performed using EGFR-positive A-431 (epidermoid carcinoma) and EGFR-negative MDA-MB-435 (melanoma) human cancer cell lines as previously described [18]. Competition binding studies were performed in the presence of 300 nM nimotuzumab or 300 nM 8709 scFv-Fc and incubated for 30 minutes at room temperature prior to titration.
Analysis of wildtype EGFR and mutant EGFRvIII by flow cytometry
For wild-type and mutant EGFRvIII binding studies, HEK293T cells were transfected with wildtype EGFR or EGFRvIII mutant plasmid with an efficiency between 60-70%. For analysis, cells were gated on transfected cells (Supplementary Figure 4A). After 48 hours cells were analyzed by flow cytometry for GFP expression to ensure transfection (Supplementary Figure 4A). Cells expressing mutant EGFRvIII or wild-type EGFR were mixed at the following ratios of EGFR:EGFRvIII: 1:0, 75:25, 50:50, 25:75, 0:1. Cell mixtures were incubated with 300 nM of IRDye800CW-nimotuzumab or 300 nM of IRDye800CW-8709 scFv-Fc at room temperature for 30 minutes, on ice for 15 minutes, and analyzed by flow cytometry on a Gallios flow cytometer (Beckman Coulter, Brea, CA).
Mouse xenograft models and imaging
All animals used in this study were cared for under the supervision and guidelines of the University of Saskatchewan Animal Care Committee (protocol # 20150048). Xenografts were prepared by mixing a 50 µL of culture containing 107 A-431 or MDA-MB-435 cells with 50 µL of Matrigel matrix basement membrane (Discovery Laboware Inc., Bedfored, MA). The cell mixture was subcutaneously injected into the right hind flank of 4-6 week old female CD-1 nude mice. Xenograft growth was monitored using external calipers for 3-4 weeks until they reached 150-300 mm3. At this point, mice were intravenously injected with 0.5 nmoles of IRDye800CW-labeled antibody or fragment in a volume of 200 µL. Mice were anesthetised with 2.5% isoflurane and imaged at 1, 2, 3, 4, 6, 24, 48, and 72 hpi. In addition, (scFv)2 fragments were imaged at 96 hpi and the scFv-Fcs and IgGs were imaged at 144 and 168 hpi using the Pearl Impulse Imager (LI-COR). 785/820 nm excitation/emission filters were used to monitor fluorescence. Fluorescent images were overlaid with white light images captured by the CCD camera in the Pearl Impulse Imager. Xenografts, liver, kidney, and contralateral site (background) were analyzed using three regions of interest (equivalent-sized areas containing the same number of pixels) on each organ to calculate the mean fluorescence intensity using Image Studio Software (version 3.1).
Statistical analysis
The mean fluorescence intensity (MFI) values obtained from titration of the IRDye800CW labeled and unlabeled 8708 and 8709 fragment binding to A-431 and MDA-MB-435 cells were analyzed using FlowJo software V.10.0.8. The MFI values were analyzed using non-linear regression to calculate the apparent KD (KD,app ) values using GraphPad Prism version 6 (La Jolla, CA). A two-way analysis of variance (ANOVA) with multiple comparisons using GraphPad Prism version 6 was used to compare the KD,app values of labeled and unlabeled 8708 and 8709 fragments.
The normalized fluorescent signals and tumor-to-background ratios for IRDye800CW-8708 and -8709 labeled antibody fragments in fluorescence imaging were compared with a two-way analysis of variance (ANOVA) with multiple comparisons using GraphPad Prism 6. All experiments were performed with at least three biological replicates (n ≥ 3) and error bars represent the standard error of the mean (SEM).
Results
Protein Expression, purification, and labeling of 8708 and 8709 antibody fragments
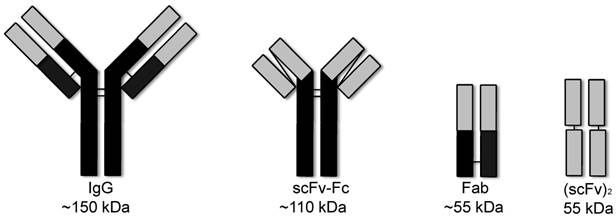
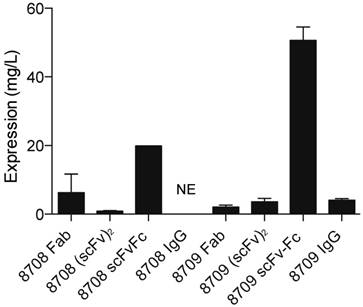
Anti-EGFR Fabs, 8708 and 8709, were previously developed and characterized [16]. We cloned the (scFv)2, scFv-Fc, and IgG probes based on CDRs of 8708 and 8709 Fabs (Figure 1). The Fab and (scFv)2 were expressed and purified using a bacterial expression system and the scFv-Fc and IgG were expressed and purified using a mammalian expression system. The 8708 Fab and scFv-Fc were purified at high levels with average yields of around 12 and 20 mg/L, respectively. The 8708 (scFv)2 was difficult to express and was purified with an average yield of < 1 mg/L (Figure 2). We were unable to successfully express the 8708 IgG. 8709 fragments were purified with average yields of around 4 mg/L except for the scFv-Fc, which expressed well and was purified with yields of 50 mg/L. Antibody fragments were labeled with IRDye800CW for flow cytometry and imaging experiments. Labeling efficiencies for antibody fragments were between 1-2 IRDye800CW molecules/antibody fragment (Supplementary Figure 1A). Labeled and unlabeled antibody fragments were analyzed for size and purity. All antibody fragments had the expected molecular weight before and after labeling (Supplementary Figure 1B) and were obtained with a purity of 80% or higher (Supplementary Figure 1C).
Antibody and fragments. The IgG and scFv-Fc are divalent and are 150 kDa and 110 kDa. The Fab and (scFv)2 are divalent and are both about 55 kDa.
Protein expression yield of 8708 and 8709 fragments. Proteins were expressed using a mammalian system (scFv-Fc and IgG) or a bacterial expression system (Fab and (scFv)2). Average amount of protein obtained is shown in mg/L. There was no expression (NE) for the 8708 IgG.
In vitro cell binding of 8708 and 8709 fragments to A-431 and MDA-MB-435 cells
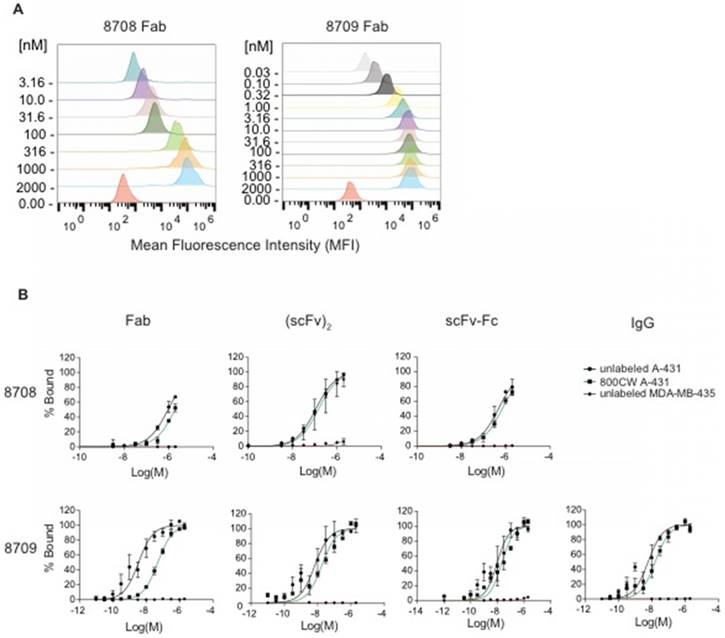
We measured the ability of IRDye800CW-labeled and unlabeled 8708 and 8709 fragments to bind EGFR expressed on cells using EGFR-positive (A-431) and EGFR-negative (MDA-MB-435) cell lines. Twelve point saturation curves were used to obtain apparent KD (KD,app) values for 8709 fragments (Figure 3, Table 1). Since the 8708 IgG was not successfully expressed or purified, only the 8708 Fab, (scFv)2, and scFv-Fc were tested for binding using eight point curves. The 8708 (scFv)2 had a KD,app value of 110 ± 10 nM on A-431 cells (Figure 3B, Table 1). Labeling of the (scFv)2 with IRDye800CW did not affect the KD,app (p > 0.05). The 8708 Fab and scFv-Fc did not saturate at the highest concentration tested (2 µM) (Figure 3B). There was negligible binding of 8708 fragments to the EGFR negative cell line, MDA-MB-435 (Figure 3B). The unlabeled 8709 Fab, (scFv)2, scFv-Fc, and IgG had KD,app values of 6 ± 2, 9 ± 3, 12 ± 5, and 7 ± 2 nM, respectively. There were no significant differences (p > 0.05) in K D,app values between the different 8709 fragments. There was a significant difference in KD,app values between the unlabeled and IRDye800CW-labeled 8709 Fab (p < 0.0001), but there was no significant difference between the unlabeled and IRDye800CW-labeled (scFv)2, scFv-Fc, or IgG (Figure 3B).
8708 and 8709 fragment flow cytometry. 8708 and 8709 fragments were titrated with A-431 or MDA-MB-435 cells to obtain saturation binding curves. A) Representative partial overlaid histogram of 8708 and 8709 Fab titration binding to A-431 cells. The concentration of Fabs shown on y-axis is in nanomolar (nM). B) Flow cytometry saturation binding curves of unlabeled and IRDye800CW-labeled 8708 Fab, (scFv)2, scFv-Fc, and 8709 Fab, (scFv)2, scFv-Fc, and IgG binding to A-431 and MDA-MB-435 cells showing the percent of cells bound ± SEM.
KD, app values of labeled and unlabeled 8708 and 8709 antibody fragment binding to A-431 cells
| Fragment | KD, app (unlabeled) (nM) | KD,app (IRDye800CW) (nM) | |
|---|---|---|---|
| 8708 | Fab | ns | ns |
| (scFv)2 | 110 ± 10 | 93 ± 3 | |
| scFv-Fc | ns | ns | |
| 8709 | Fab | 6 ± 2 | 50 ± 2* |
| (scFv)2 | 9 ± 3 | 18 ± 2 | |
| scFv-Fc | 12 ± 5 | 22 ± 6 | |
| IgG | 7 ± 2 | 17 ± 4 |
*Significant difference between the unlabeled and IRDye800CW-labeled 8709 Fab (p < 0.0001). ns = no saturation.
In vivo near infrared imaging of 8708 and 8709 fragments in CD-1 nude mouse xenograft models
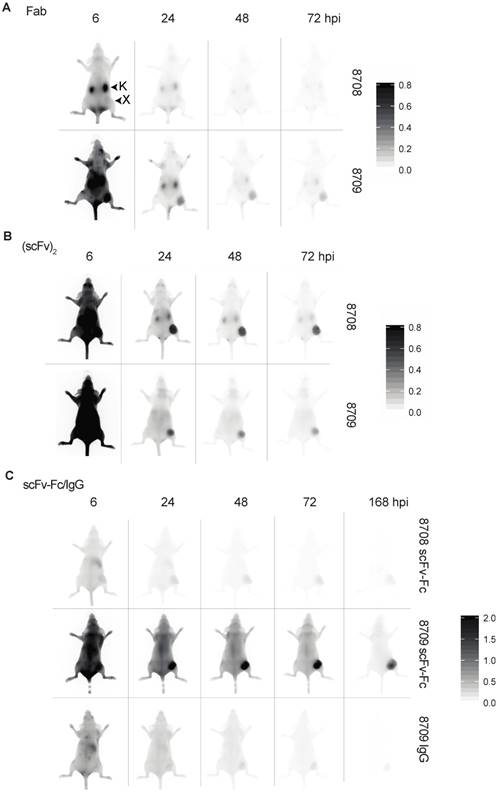
To characterize the in vivo imaging properties of 8708 and 8709 imaging probes, mice bearing A-431 xenografts were injected with IRDye800CW-labeled antibody fragments and imaged at a number of time points (Figure 4A). For IRDye800CW-labeled Fab imaging probes, the 8709 Fab accumulated more than the 8708 Fab in the A-431 xenograft. The 8708 Fab did not accumulate at high levels in the A-431 xenograft and was cleared primarily through the kidney (Figure 4A, Supplementary Figure 2A). It peaked at 3 hours post injection (hpi) with a fluorescent signal of 20 ± 6 au (Figure 5A). The 8709 Fab accumulated quickly in the xenograft and remained visible up to 72 hpi (Figure 4A, Figure 5A, top). The 8709 Fab fluorescent signal peaked at 1 hpi in the xenograft (fluorescent signal = 391 ± 170 au) and then cleared quickly through the kidney and liver (Figure 4A, Figure 5A, Supplementary Figure 2A, 3A). The fluorescent signal of the 8709 Fab was significantly higher than the 8708 Fab at 1 hpi (p ≤ 0.001), 2 hpi (300p ≤ 0.01), and 3 hpi (p ≤ 0.05). The tumor to background ratio (TBR) of the 8709 Fab was significantly higher than 8708 Fab at 24 hpi (p ≤ 0.01), 48 hpi (p ≤ 0.001), and 72 hpi (p ≤ 0.0001) (Figure 5A, bottom).
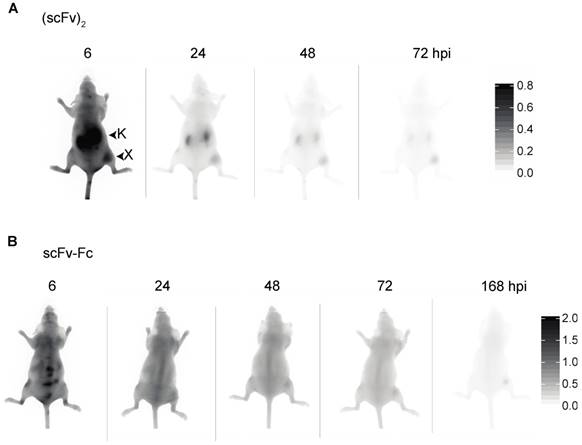
Near infrared images of IRDye800CW-labeled 8708 and 8709 fragments in A-431 xenograft bearing mice in the dorsal position. Images shown were taken at 6, 24, 48, and 72 hours post injection (hpi) for the Fab and (scFv)2 with the addition of 168 hpi for the scFv-Fc and IgG. Near infrared images of the 8708 and 8709: A) Fab, B) (scFv) 2, and C) scFv-Fc and 8709 IgG. Scale bars are shown on the right. Images of at least three different mice were taken. X = xenograft; K = kidney.
Near infrared image analysis of the A-431 xenograft. IRDye800CW-labeled fragments: A) Fab, B) (scFv)2, and C) scFv-Fc and IgG. Imaging probes were injected into A-431 xenograft tumor bearing mice, imaged, and analyzed over time (hours post injection (hpi)). Data represents the mean of the normalized signal or TBR (tumor-to-background ratio) of the three different regions of interest in the xenograft at least three different mice ± SEM. * p < 0.05, ** p < 0.01, *** p < 0.001 and **** p < 0.0001.
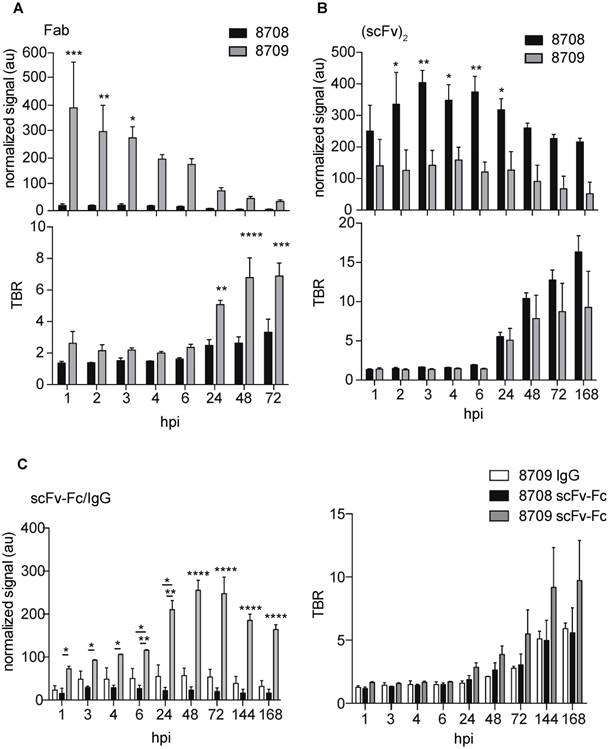
IRDye800CW-labeled (scFv)2 imaging probes accumulated in the xenograft and remained visible out to 72 hpi (Figure 4B). The 8708 (scFv)2 cleared through the kidney and liver (Figure 4B, Supplementary Figure 2B, 3B), whereas the 8709 (scFv)2 cleared only through the liver (Figure 4B, Supplementary Figure 2B, 3B). The fluorescence signal of 8708 and 8709 (scFv)2 peaked in the xenograft at 3 hpi (400 ± 38 au) and 4 hpi (160 ± 24 au), respectively and remained up to 24 hpi, after which they slowly cleared. The fluorescent signal of the 8708 (scFv)2 in the xenograft was significantly higher than the 8709 (scFv)2 from 2-24 hpi (p ≤ 0.05 for 2 hpi, 4 hpi, and 24 hpi, p ≤ 0.01 for 3 hpi and 6 hpi) (Figure 5A). TBRs for (scFv)2 fragments were between 1.5 - 2.5 until 24 hpi, when they increased to more than 7 and steadily increased above 10 at 96 hpi (Figure 5B).
IRDye800CW-labeled 8709 scFv-Fc probe accumulated at higher levels in the A-431 xenograft than the IRDye800CW-labeled 8708 scFv-Fc probe (Figure 4C, Figure 5C). The 8708 scFv-Fc accumulated at low levels in the xenograft (Figure 4C). It peaked at 3 hours with a fluorescent signal of 30 ± 3 au and cleared through the liver (Figure 5C, Supplementary Figure 2C, 3C). The 8709 scFv-Fc accumulated in the xenograft and peaked at 48 hpi (260 ± 24 au) and slowly cleared after 72 hpi but the signal remained high (> 160 au) at 168 hpi (Figure 5C, top). At all time points except at 1 hpi the fluorescent signal for the 8709 scFv-Fc was significantly higher than the 8708 scFv-Fc (p ≤ 0.05 for 2 hpi and 3 hpi, p ≤ 0.01 for 4 and 6 hpi, p ≤ 0.0001 for 24-168 hpi). The TBR for the 8708 scFv-Fc was between 1-2 for the first 24 hours and increased to > 5 at 168 hpi, however the fluorescent signal at all time points was low (between 16-30 au) (Figure 5C, bottom). The 8709 scFv-Fc TBR was between 1.7-2.9 at 24 hpi after which it steadily increased to 10 at 168 hpi.
Since the 8708 IgG did not express, we compared the IRDye800CW-labeled 8709 IgG to IRDye800CW-labeled scFv-Fc fragments. The 8709 IgG accumulated at low levels in the xenograft similar to the 8708 scFv-Fc (Figure 4C, 5C, Supplementary Figure 2C, 3C) and had a much lower signal than the 8709 scFv-Fc (Figure 4C, Figure 5C, top). The fluorescent signal for the 8709 IgG peaked at 48 hpi at 57 ± 17 au (Figure 5C, top). From 6-168 hpi the fluorescent signal of the 8709 scFv-Fc was significantly higher than the 8709 IgG (p ≤ 0.05 at 6 hours and p ≤ 0.0001 at 24-168 hpi). The 8709 IgG TBR was between 1-3 for the first 72 hours and it increased to > 5 and continued to increase until 168 hpi, however, fluorescence signals at these time points were low (30-50 au) (Figure 5C, bottom). The 8709 scFv-Fc had higher accumulation in the xenograft at all time points compared to the 8708 scFv-Fc and 8709 IgG.
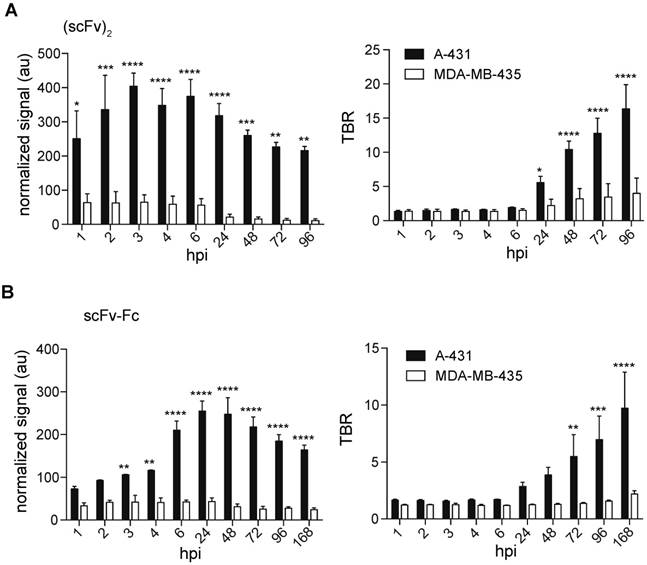
We investigated the accumulation of the IRDye800CW-labeled 8708 (scFv)2 and 8709 scFv-Fc in the EGFR-negative control xenografts as they showed the best signal and retention for the small and large imaging probes tested (Figure 6). The 8708 (scFv)2 signal in MDA-MB-435 xenografts (between 11 - 64 au) was significantly lower than the signal in A-431 xenografts (between 216-400 au) at all time points (p ≤ 0.05 at 1 hpi, p ≤ 0.001 at 2 and 48 hpi, p ≤ 0.0001 at 3-24 hpi, p ≤ 0.01 at 72-96 hpi) (Figure 7A). The TBR of 8708 (scFv)2 in the MDA-MB-435 xenograft was below 2 at 6 hpi, after which it increased to 4 at 96 hpi, however the signal was low at this time point (11 au). The 8708 (scFv)2 TBR was significantly higher in A-431 xenografts compared to MDA-MB-435 xenografts at 24 hpi and all time points after (p ≤ 0.05 at 24 hpi and p ≤ 0.0001 at 48-96 hpi). The signal for 8709 scFv-Fc in MDA-MB-435 xenografts (between 24 - 43 au) was significantly lower than the signal in A-431 xenografts (between 110-255 au) at 3 hpi and all time points after (p ≤ 0.01 at 3-4 hpi, and p ≤ 0.0001 at 6-168 hpi) (Figure 7B). The TBR for the 8709 scFv-Fc in the MDA-MB-435 xenografts did not increase above 2.2. The 8709 scFv-Fc TBR was significantly higher in A-431 than in MDA-MB-435 xenografts from 72-168 hpi (p ≤ 0.01 at 72 hpi, p ≤ 0.001 at 96 hpi and p ≤ 0.0001 at 168 hpi).
Near infrared imaging of 8708 (scFv)2 and 8709 scFv-Fc in MDA-MB-435 EGFR-negative control cell line. Representative images from A) 8708 (scFv)2 and B) 8709 scFv-Fc imaging probes injected into MDA-MB-435 xenograft bearing mice. Images shown were taken at 6, 24, 48, and 72 hours post injection (hpi). A minimum of three mice were imaged for each probe. X = xenograft; K = kidney.
Near infrared image analysis of 8708 (scFv)2 and 8709 scFv-Fc in A-431 and MDA-MB-435 cell lines. Fluorescent signal and TBR analysis of A) 8708 (scFv)2 and B)8709 scFv-Fc mouse images. Images shown were taken at 6, 24, 48, 72, and 168 hpi. Normalized fluorescent signal is expressed in arbitrary units (au) and TBR (tumor-to-background ratio) in A-431 and MDA-MB-435 tumor bearing mice. A minimum of three mice were analyzed to determine the SEM. * p < 0.05, ** p < 0.01, *** p < 0.001 and **** p < 0.0001.
8709 scFv-Fc domain I/II binding imaging probe detects EGFR-positive cells in the presence of domain III binding therapeutic antibody nimotuzumab
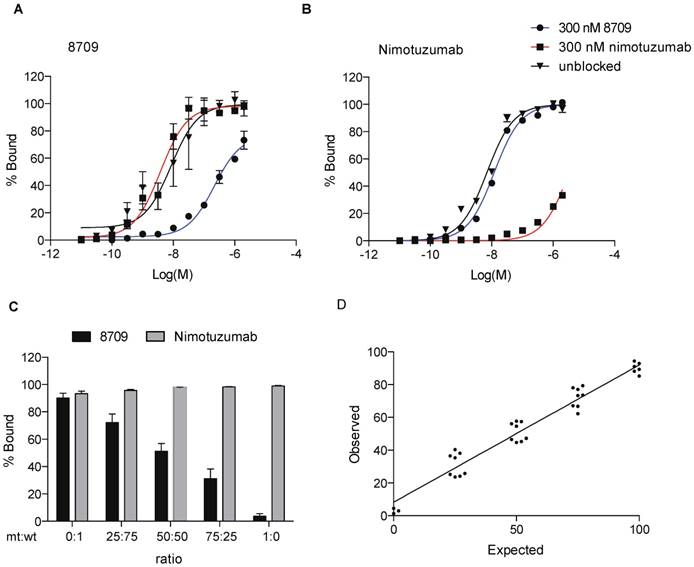
To assess the ability of the EGFR domain I/II imaging probes to detect EGFR-positive cells in the presence of domain III therapeutic antibodies, we monitored 8709 scFv-Fc binding to A-431 cells in the presence of the domain III binding therapeutic antibody nimotuzumab. We measured binding of IRDye680RD-labeled 8709 scFv-Fc and IRDye680RD-nimotuzumab to A-431 cells using flow cytometry in the presence of saturating amounts of nimotuzumab or 8709 scFv-Fc. We added 300 nM of 8709 scFv-Fc or nimotuzumab and titrated A-431 cells with IRDye680RD-labeled 8709-scFv-Fc or IRDye680RD-labeled nimotuzumab and measured changes in cell fluorescence (Figure 8A, B). When A-431 cells were saturated with 300 nM of nimotuzumab, the IRDye680RD-labeled 8709-scFv-Fc binding curve was the same as the binding curve obtained in the absence of nimotuzumab and the KD,app values were not significantly different, indicating that 8907 scFv-Fc and nimotuzumab did not compete for EGFR binding (Figure 8A). However, when A-431 cells were saturated with 8709 scFv-Fc, competition was observed and IRDye680RD-labeled 8709 scFv-Fc binding decreased with the KD, app increasing from 12 nM to > 200 nM (Figure 8A). Similarly, when IRDye680RD-nimotuzumab was titrated on A-431 cells treated with 300 nM of 8709 scFv-Fc, nimotuzumab bound A-431 cells similarly to the binding observed in the absence of 8709 scFv-Fc. IRDye680RD-nimotuzumab binding to A-431 cells, however was inhibited when cells were saturated with 300 nM of nimotuzumab, with the KD,app increasing from 10 nM to > 1 µM (Figure 8B).
8709 scFv-Fc as a tool to monitor EGFRvIII mutation status. A) 8709 scFv-Fc saturation binding curve with or without a saturating dose of 8709 scFv-Fc or nimotuzumab. B) Nimotuzumab saturation binding curve with or without a saturating dose of 8709 scFv-Fc or nimotuzumab. C) Analysis of different ratios of wildtype EGFR and mutant EGFRvIII expressing cells using IRDye680RD-8709 scFv-Fc and/or IRDye800CW-nimotuzumab. D) Expected (% of wildtype EGFR) and Observed (% of cells bound by 8709 scFv-Fc to HEK293T cells expressing wildtype EGFR and mutant EGFRvIII. Data from A and B represents mean (n=3). Data from C and D represents mean (n = 8). mt = mutant; wt = wildtype.
Detection of EGFRvIII mutation status using the 8709 imaging probe
To detect the ratio of cells containing wild-type EGFR or mutant EGFRvIII, we used 8709 and nimotuzumab imaging probes. Both imaging probes recognize wild-type EGFR, however the EGFRvIII deletion mutant is missing all of domain I and most of domain II and is not recognized by 8709 [16,19]. Cells expressing EGFR or EGFRvIII were mixed at different ratios and a saturating dose of IRDye800CW-nimotuzumab or IRDye800CW-8709 scFv-Fc was added to the cell mixtures and binding was analyzed by flow cytometry (Figure 8C). Nimotuzumab recognized both wild type and EGFRvIII expressing cells and bound 90-100% of cells at all EGFR:EGFRvIII ratios (Supplementary Figure 4B, Supplementary Table 1). 8709 scFv-Fc recognized only the wild-type EGFR and the signal decreased as the ratio of EGFR wild type cells decreased (Figure 8C, D). The percent of cells expressing wild type EGFR added to the cell mixture represents the 'expected' value (x-axis) in Figure 8D. The 'observed' value (y-axis) is the percent of cells that were bound by 8709 scFv-Fc in the cell mixture. Hek293T cells did not express EGFR when tested for binding of IRDy800CW-nimotuzumab (Supplementary Figure 4C).
Discussion
Therapies based on a molecular level analysis of the cell such as receptor overexpression or mutation can lead to more tailored treatment plans and prevent unnecessary therapy and associated side effects. Both optical imaging with a fluorescent probe and nuclear imaging with a radionuclide attached to the probe can be used for this purpose. Here, we investigated imaging properties of IRDye800CW-labeled 8708- and 8709-based antibody and antibody fragment imaging probes that target EGFR domain I/II to identify probes with the best imaging properties.
The (scFv)2 was the only 8708 fragment that showed binding saturation on EGFR positive A-431 cells and accumulation at the xenograft in vivo. The 8708 Fab and scFv-Fc did not saturate on A-431 cells at a concentration of 2 µM and showed little accumulation in A-431 xenografts. We were unable to express the 8708 IgG. The 8708 fragments have a much longer CDRH3 than most antibodies as it contains the EGFR dimerization loop [16]. It is possible that this contributes to instability of the 8708 fragments. The structure of the (scFv)2 is quite different than the other fragments. The (scFv)2 forms a dimer between the variable regions of two different peptide chains to make two antigen binding sites on opposite sides of the protein [20]. A number of (scFv)2 fragments have been crystalized and have been shown to adopt different conformations [20]. These fragments have significant structural diversity and flexibility due to the instability of the interacting interface [20]. This flexibility within the structure may be better able to accommodate the long CDRH3.
The 8709 IgG and fragments showed saturation binding on A-431 cells. There was no significant difference in binding between the monovalent and divalent 8709 fragments in terms of calculated KD,app. The 8709 fragments all had very similar K D,app values, however their levels of xenograft accumulation and time required to accumulate differed. All fragments that bound and saturated on A-431 cells (8708 (scFv)2 , 8709 Fab, 8709 (scFv)2 and 8709 scFv-Fc) accumulated in the A-431 xenograft except the 8709 IgG. The reason for the low accumulation of 8709 IgG to the xenograft was unknown. It may be due to quick clearance or poor antibody stability. Imaging results showed that 8709 IgG was cleared quickly as evident by the low signal in the mouse body at 6 hours compared to 8709 scFv-Fc where the mouse body still showed a high signal.
Antibody fragments have been explored as imaging probes, since their small size and inability to bind FcRn receptors gives them shorter half-lives and faster tumor uptake compared to their IgG counterparts [21, 22]. In our study, we found that the fluorescence signal of the smaller fragments ((scFv)2 and Fab) accumulated faster and peaked sooner (between 3-4 hpi and 1 hpi, respectively) in the xenograft than the larger scFv-Fc, which peaked at 48 hours. However, the (scFv)2 TBR was below 2 until 24 hpi. After 24 hours the TBR increased above 5 and its fluorescent signal was still high, indicating that (scFv)2 fragments may be better to image at some time point after 24 hpi. The fluorescent signal of the 8709 Fab peaked at 1 hpi and cleared quickly to almost background by 24 hpi, indicating it might be a good candidate for imaging, however it would be difficult to distinguish at these early time points since the TBR of the 8709 Fab was around 2 until 24 hpi after which it increased above 5 but the signal dropped significantly at this time point.
The 8709 scFv-Fc also has potential as an imaging agent, although it did not clear as fast as the 8708 (scFv)2 it did accumulate to the xenograft within 24 hours and peaked at 48 hours. The TBR was close to 3 at 24 hpi and almost 4 at 48 hpi. In comparison to IRDye800CW-nimotuzumab, which accumulates in A-431 xenografts within 24 hours and peaks at 96 hpi with a mean fluorescent signal of 578 ± 72 AU [18], the IRDye800CW-8709 scFv-Fc cleared faster and peaked sooner at 48 hours with an average fluorescent signal of 255 ± 24 AU. The signal from IRDye800CW-nimotuzumab is significantly higher (p < 0.05) and is retained in the xenograft longer, however the fluorescent signal and TBR from 8709 scFv-Fc was high enough to be clearly imaged at 48 hours and cleared quicker which is a desirable property for an imaging agent. In a recent report it was shown with IRDye800CW labeled panitumumab (which also targets EGFR) that a TBR of three was required to obtain clear differentiation between tumor and normal tissue during image-guided surgery [23]. This indicated that the 8709 scFv-Fc may have potential as an imaging reagent at 24-48 hpi and warrants further investigation.
EGFR expression status may be visualized in multiple tumours simultaneously using molecular imaging to determine if a patient is responding to a given therapy, however there is a blocking effect that can take place when there is a high amount of the therapeutic antibody [6, 24]. Since all current anti-EGFR therapeutic antibodies target the domain III of EGFR, 8709 can be used during therapy to assess EGFR expression levels and response to therapy. We used a saturating dose of the therapeutic anti-EGFR antibody nimotuzumab and titrated 8709 scFv-Fc with A-431 cells. We found that a saturating dose of nimotuzumab did not change the KD,app of 8709 scFv-Fc. The opposite was also true, a saturating dose of 8709 did not change the KD,app of nimotuzumab. We previously showed that 8709 binding is not blocked by current EGFR therapeutic antibody cetuximab and only partially blocked by panitumumab [16].
In addition to therapeutic monitoring, 8709 could also be used to predict whether a patient has specific EGFR mutations. EGFRvIII for example is a tumor-specific mutation that results from deletion within the extracellular domain that forms a junction between exons 1 and 8 [13, 14]. This mutation is expressed at a high frequency in glioblastoma tumors [15]. We tested to see if we could determine the ratio of mutant EGFRvIII to wildtype EGFR by mixing cells expressing wildtype EGFR and mutant EGFRvIII at different ratios and analyzing the cell mixture by flow cytometry. We were able to determine the amount of wildtype and mutant EGFRvIII ratios as expected. This type of assay may be useful to assess the ratio of mutant EGFRvIII to wildtype EGFR tumours, which can potentially be used to more accurately prescribe the type of therapy to be used particularly for glioblastoma since over half of glioblastoma tumors overexpressing EGFR also express EGFRvIII [15].
In conclusion, we have used EGFR domain I/II specific antibody fragments that may be used with current therapies or other imaging agents. We assessed these antibodies as optical probes to screen out the best fragments to be used as imaging probes. We are pursuing the use of these antibody fragments as imaging probes alone and in combination with other antibodies using PET/SPECT.
Abbreviations
EGFR: epidermal growth factor receptor; CDR: complementarity determining region; Fab: antigen binding fragment; Fc: fragment crystallizable; GFP: green fluorescent protein; hpi: hour post injection; KD,app: apparent KD; MFI: mean fluorescence intensity; NIR: near infrared; ROI: region of interest; (scFv)2: single chain variable fragment; TBR: tumor-to-background ratio; 89Zr: zirconium 89.
Supplementary Material
Supplementary figures and table.
Acknowledgements
This work was funded by WD and CCSRI.
Contributions
W.B. designed and performed experiments (labeling, flow cytometry, cell culture, xenografts and imaging), analyzed data and wrote the manuscript. K.B. designed experiments, analyzed data and reviewed and edited the manuscript. A.E. designed and performed experiments (cloned fragments, xenografts and imaging), analyzed data and reviewed and edited the manuscript. C.G. performed experiments (bioanalyzer, cell culture, protein expression and purification). H.F. helped supervise the study and reviewed and edited the manuscript. C.R.G. supervised the study and reviewed and edited the manuscript.
Competing Interests
The authors have declared that no competing interest exists.
References
1. Arteaga CL, Engelman JA. ERBB receptors: From oncogene discovery to basic science to mechanism-based cancer therapeutics. Cancer Cell. 2014;25:282-303
2. Wolff AC, Hammond ME, Hicks DG. et al. Recommendations for human epidermal growth factor receptor 2 testing in breast cancer: American society of clinical oncology/college of American pathologists clinical practice guideline update. J Clin Oncol. 2013;31:3997-4013
3. Pereira PMR, Abma L, Henry KE. et al. Imaging of human epidermal growth factor receptors for patient selection and response monitoring - from PET imaging and beyond. Cancer Lett. 2018;419:139-51
4. clinicaltrials.gov (NCT00691548, NCT01691391, NCT01987375, NCT02736578, NCT02855086, NCT03134846, NCT03384238, NCT03405142, NCT03510208, NCT03582124, NCT03733210, NCT03764137, NCT02415881). Accessed 24 December 2018. https://clinicaltrials.gov/
5. Menke-van der Houven van Oordt CW, Gootjes EC, Huisman MC. et al. 89Zr-cetuximab PET imaging in patients with advanced colorectal cancer. Oncotarget. 2015;6:30384-93
6. Hoeben BA, Molkenboer-Kuenen JD, Oyen WJ. et al. Radiolabeled cetuximab: Dose optimization for epidermal growth factor receptor imaging in a head-and-neck squamous cell carcinoma model. Int J Cancer. 2011;129:870-8
7. Voigt M, Braig F, Göthel M. et al. Functional dissection of the epidermal growth factor receptor epitopes targeted by panitumumab and cetuximab. Neoplasia. 2012;14:1023-31
8. Tundidor Y, García-Hernández CP, Pupo A. et al. Delineating the functional map of the interaction between nimotuzumab and the epidermal growth factor receptor. MAbs. 2014;6:1013-25
9. Schmitz KR, Bagchi A, Roovers RC. et al. Structural evaluation of EGFR inhibition mechanisms for nanobodies/VHH domains. Structure. 2013;21:1214-24
10. Montagut C, Dalmases A, Bellosillo B. et al. Identification of a mutation in the extracellular domain of the epidermal growth factor receptor conferring cetuximab resistance in colorectal cancer. Nat Med. 2012;18:221-3
11. Braig F, Kriegs M, Voigtlaender M. et al. Cetuximab resistance in head and neck cancer is mediated by egfr-k521polymorphism. Cancer Res. 2017;77:1188-99
12. Braig F, März M, Schieferdecker A. et al. Epidermal growth factor receptor mutation mediates cross-resistance to panitumumab and cetuximab in gastrointestinal cancer. Oncotarget. 2015;6:12035-47
13. Yamazaki H, Ohba Y, Tamaoki N. et al. A deletion mutation within the ligand binding domain is responsible for activation of epidermal growth factor receptor gene in human brain tumors. Jpn J Cancer Res. 1990;81:773-9
14. Humphrey PA, Wong AJ, Vogelstein B. et al. Amplification and expression of the epidermal growth factor receptor gene in human glioma xenografts. Cancer Res. 1988;48:2231-8
15. Gan HK, Cvrljevic AN, Johns TG. The epidermal growth factor receptor variant III (egfrviii): Where wild things are altered. FEBS J. 2013;280:5350-70
16. Miersch S, Maruthachalam BV, Geyer CR. et al. Structure-Directed and tailored diversity synthetic antibody libraries yield novel anti-egfr antagonists. ACS Chem Biol. 2017;12:1381-9
17. El-Sayed A, Bernhard W, Barreto K, Gonzalez C, Hill W, Pastushok L, Fonge H, Geyer CR. Evaluation of antibody fragment properties for near-infrared fluorescence imaging of her3-positive cancer xenografts. Theranostics. 2018;8:4856-69
18. Bernhard W, El-Sayed A, Barreto K. et al. Near infrared fluorescence imaging of EGFR expressionin vivousing irdye800cw-nimotuzumab. Oncotarget. 2018;9:6213-27
19. Libermann TA, Nusbaum HR, Razon N. et al. Amplification, enhanced expression and possible rearrangement of EGF receptor gene in primary human brain tumours of glial origin. Nature. 1985;313:144-7
20. Kwan N, Kim Y, Lee J. Structural diversity and flexibility of diabodies. Methods. 2018 in press
21. Nakamura H, Fang J, Jun F. et al. Development of next-generation macromolecular drugs based on the EPR effect: Challenges and pitfalls. Expert Opin Drug Deliv. 2015;12:53-64
22. Xenaki KT, Oliveira S, van Bergen En Henegouwen PMP. Antibody or antibody fragments: Implications for molecular imaging and targeted therapy of solid tumors. Front Immunol. 2017;8:1287
23. Gao RW, Teraphongphom NT, van den Berg NS. et al. Determination of tumor margins with surgical specimen mapping using near-infrared fluorescence. Cancer Res. 2018;78:5144-54
24. Nayak TK, Regino CA, Wong KJ. et al. PET imaging of her1-expressing xenografts in mice with 86Y-CHX-A''-dtpa-cetuximab. Eur J Nucl Med Mol Imaging. 2010;37:1368-76
25. Aerts HJ, Dubois L, Hackeng TM. et al. Development and evaluation of a cetuximab-based imaging probe to target EGFR and EGFRvIII. Radiother Oncol. 2007;83:326-32
Author contact
![]() Corresponding authors: Clarence Ronald Geyer, PhD, Email: ron.geyerca. Tel: 306-966-2040 and Humphrey Fonge, PhD, humphrey.fongeca; Tel: 306-655-3353
Corresponding authors: Clarence Ronald Geyer, PhD, Email: ron.geyerca. Tel: 306-966-2040 and Humphrey Fonge, PhD, humphrey.fongeca; Tel: 306-655-3353