Impact Factor
- Issue 14; 2026
- Issue 13; 2026
- Issue 12; 2026
- Issue 11; 2026
- Issue 10; 2026
- Volume 16; 2026
- Advance Articles
- Past Issues
- Cover Images
- Cover Suggestion
- Index & Coverage
- Special Issues
Introduction
Methods
Results
Discussion
Conclusion
Abbreviations
Supplementary Material
Acknowledgements
References
International Journal of Biological Sciences
International Journal of Medical Sciences
 Global reach, higher impact

Theranostics 2019; 9(2):554-572. doi:10.7150/thno.27213 This issue Cite
Research Paper
Evaluation of [11C]NMS-E973 as a PET tracer for in vivo visualisation of HSP90
Koen Vermeulen1*, Evelyne Naus2*, Muneer Ahamed3, Bala Attili1, Maxime Siemons1,2, Kaat Luyten1,2, Sofie Celen1, Joost Schymkowitz2, Frederic Rousseau2, Guy Bormans1 ![]()
1. Laboratory for Radiopharmaceutical Research, Department of Pharmacy and Pharmacology, KU Leuven, Leuven, Belgium
2. Switch Laboratory, VIB-KU Leuven Center for Brain & Disease Research, KU Leuven, Leuven, Belgium
3. College of Science and Engineering, Flinders University, Bedford Park, South Australia, Australia
*These authors contributed equally to this manuscript
Received 2018-5-11; Accepted 2018-11-30; Published 2019-1-1
Abstract

Heat shock protein 90 is an ATP-dependent molecular chaperone important for folding, maturation and clearance of aberrantly expressed proteins and is abundantly expressed (1-2% of all proteins) in the cytosol of all normal cells. In some tumour cells, however, strong expression of HSP90 is also observed on the cell membrane and in the extracellular matrix and the affinity of tumoural HSP90 for ATP domain inhibitors was reported to increase over 100-fold compared to that of HSP90 in normal cells. Here, we explore [11C]NMS-E973 as a PET tracer for in vivo visualisation of HSP90 and as a potential tool for in vivo quantification of occupancy of HSP90 inhibitors.
Methods: HSP90 expression was biochemically characterized in a panel of established cell lines including the melanoma line B16.F10. B16.F10 melanoma xenograft tumour tissue was compared to non-malignant mouse tissue. NMS-E973 was tested in vitro for HSP90 inhibitory activity in several tumour cell lines. HSP90-specific binding of [11C]NMS-E973 was evaluated in B16.F10 melanoma cells and B16.F10 melanoma, prostate cancer LNCaP and PC3, SKOV-3 xenograft tumour slices and in vivo in a B16.F10 melanoma mouse model.
Results: Strong intracellular upregulation and abundant membrane localisation of HSP90 was observed in the different tumour cell lines, in the B16.F10 tumour cell line and in B16.F10 xenograft tumours compared to non-malignant tissue. NMS-E973 showed HSP90-specific inhibition and reduced proliferation of cells. [11C]NMS-E973 showed strong binding to B16.F10 melanoma cells, which was inhibited by 200 µM of PU-H71, a non-structurally related HSP90 inhibitor. HSP90-specific binding was observed by in vitro autoradiography of murine B16.F10 melanoma, LNCaP and PC3 prostate cancer and SKOV-3 ovary carcinoma tissue slices. Further, B16.F10 melanoma-inoculated mice were subjected to a µPET study, where the tracer showed fast and persistent tumour uptake. Pretreatment of B16.F10 melanoma mice with PU-H71 or Ganetespib (50 mg/kg) completely blocked tumour accumulation of [11C]NMS-E973 and confirmed in vivo HSP90 binding specificity. HSP90-specific binding of [11C]NMS-E973 was observed in blood, lungs and spleen of tumour-bearing animals but not in control animals.
Conclusion: [11C]NMS-E973 is a PET tracer for in vivo visualisation of tumour HSP90 expression and can potentially be used for quantification of HSP90 occupancy. Further translational evaluation of [11C]NMS-E973 is warranted.
Keywords: HSP90, PET imaging, carbon-11, melanoma, NMS-E973
Introduction
The heat shock protein (HSP) family is part of a big cluster of molecular chaperones important for folding, maturation and clearance of aberrantly expressed proteins. HSPs facilitate cellular signalling processes and control the general maintenance of cell homeostasis. HSPs occur in all cellular compartments of eukaryotic cells as well as in all prokaryotes [1]. They are classified into a number of functionally and structurally distinct families that are named after the molecular mass of well-characterised members, ranging from 10 to 100 kDa. The 90 kDa members of the eukaryotic HSP-family (HSP90) are ATP-dependent proteins that can predominantly be found in the cytosol, although they also occur in the nucleus bound to obligate substrates, such as the nuclear receptors (glucocorticoid and androgen receptors) [2]. HSP90 occurs as two major isoforms: the inducible HSP90AA1 (HSP90α) and the constitutively expressed HSP90AB1 (HSP90β). Other paralogues exist that are restricted to the endoplasmic reticulum (ER) and mitochondria; 94 kDa glucose-regulated protein (Grp94) and tumour necrosis factor receptor-associated protein 1 (TRAP1), respectively. In a stress-free environment, these 90 kDa chaperones make up 1-2% of all the soluble cellular proteins, whereas their fraction increases to 6-7% in cancer cells and up to 10% during cellular stress [3-5].
HSP90-mediated processes function with the help of a complex of co-chaperones (chaperone machinery), which consist of different cofactors with different binding preferences for specific HSP90 conformations. Several cofactors regulate the ATPase activity of HSP90; others modulate/maturate substrate processing. Moreover, the HSP90 complex is regulated by post translational modifications such as acetylation, nitrosylation and phosphorylation [6]. The client proteins processed by the HSP90 machinery are abundant; over 400 have been reported, encompassing kinases, transcription factors, E3-ubiquitin ligases, steroid hormone receptors and other essential signalling proteins [7,8]. Many of these client proteins contribute to the six hallmarks of cancer [9].
HSP90 is found to be upregulated in many types of cancer ranging from hematopoietic to solid tumours. Furthermore, some cancer cells are addicted to and exploit the HSP90 complex, keeping oncogenic proteins from being degraded by the proteasome, elevating the survival chances of the tumour cells and maintaining the malignant state [6,11]. Not only expression levels were found to be higher but HSP90 was also found to adopt a tumour-specific conformation in multichaperone complexes in tumours, resulting in a 100-fold increase in affinity for the ATP site binding inhibitor 17-AAG [12]. In normal cells, HSP90 is confined to the intracellular space; but, in tumour cells (fibrosarcoma [13], melanoma [14], breast cancer [15]), vast expression of HSP90 was also observed on the cell surface or secreted to the extracellular matrix (ECM), consensually referred to as extracellular HSP90 (eHSP90) [16].
Currently, several HSP90 inhibitors are being developed and some are being evaluated in oncological clinical trials [17]. The mechanism of action of most HSP90 inhibitors is based on disrupting the interaction between ATP and the N-terminal ATP-binding domain of the enzyme. Inhibition of the ATP pocket will restrain HSP90 in the ADP-bound state and client proteins will be ubiquitinated and probed for subsequent degradation by the proteasome [11]. However, C-domain inhibitors are also currently under investigation. These inhibitors destabilize the chaperone complex, leading to release of co-chaperones and substrates and subsequent degradation of client proteins [9].
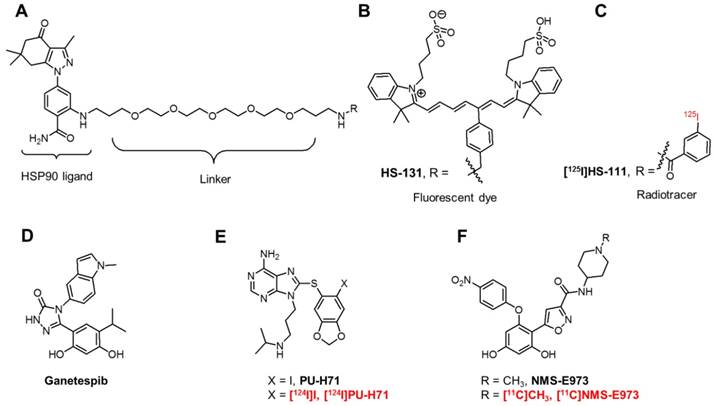
First-generation HSP90 inhibitors encompass derivatives of natural products such as Geldanamycin and Radicicol. Although Geldanamycin is a potent N-terminal HSP90 inhibitor, its use was limited due to solubility issues, limited in vivo stability and hepatotoxicity in animal models. This led to the development of Geldanamycin analogues (Alvespimycin, Tanespimycin, Retaspimycin HCl) with more favourable pharmacokinetics and less toxicity. Newer, synthetic inhibitors, include molecules based on purine (PU-H71, Figure 1E), resorcylic pyrazole/isoxazole (Ganetespib, Figure 1D, NMS-E973, Figure 1F) and benzamide scaffolds. However, this list is not limitative and new chemical entities with affinity for HSP90 are continued to be discovered [9]. Although over 15 HSP90 inhibitors are being evaluated in clinical trials and initial preclinical results look promising, many of the compounds have not lived up to expectations. Frequent adverse effects (gastrointestinal problems, reversible night blindness) limit the further use or evaluation of these compounds. Moreover, HSP90 inhibition via the ATP-containing N-domain induces a heat shock response (HSR) via heat shock factor 1 (HSF1), which upregulates transcription of pro-survival HSPs, HSP27, HSP40 and HSP70 [18]. The use of a combinatorial approach to target HSP90 and HSP70 or HSF1 can bypass this compensatory effect, increasing the effectiveness of drug treatment. The development of C-terminal inhibitors, where the HSR is less pronounced, can also be an alternative [19]. Research has also taken an interest in targeting eHSP90. Where Tsutsumi et al. observed an absence of internalisation of the cell-impermeable HSP90 inhibitor DMAG-N-oxide in melanoma cells [20], Crowe et al. demonstrated eHSP90-specific active internalisation of their fluorescent probes HS-27 and HS-131 (Figure 1B) and radiolabelled [125I]HS-111 (Figure 1C) in mammary tumour cells [21]. Furthermore, internalisation of the HS probes was blocked using an antibody against the C-terminal of HSP90 [22]. Imaging studies with HS-131 showed increased expression levels and internalisation of eHSP90 in aggressive malignant cells. Following this, it was concluded that eHSP90 can be a valuable target of cancer cell metastasis and invasiveness and can play a defined role as a biomarker of malignant cell behaviour.
Chemical structures of fluorescent probes and nuclear imaging probes targeting HSP90. (A) Core structure of HS compounds. (B) Fluorescent dye HS-131. (C) Radiotracer [125I]HS-111. (D) Potent HSP90 inhibitor Ganetespib. (E) PU-H71 and its 124I-labeled radiotracer. (F) NMS-E973 and its radiolabelled version [11C]NMS-E973.
The radiosynthesis of a small molecule HSP90 inhibitor [124I]PU-H71 (Figure 1E) was recently reported [23], and the biodistribution of this positron emission tomography (PET) tracer was studied in MDA-MB-468/ASPC1 mouse xenografts, two different tumour types with different abundancies of the HSP90 chaperone complex. The tracer showed relatively slow kinetics but tracer uptake in the HSP90-high MDA-MB-468 tumour persisted over 48 h, whereas tracer uptake in the HSP90-low ASPC1 tumour gradually decreased over 48 h. Furthermore, patients harbouring different types of cancers (breast cancer, lymphoma, gynaecologic malignancies) were subjected to PET-CT scans 24 h after injection of [124I]PU-H71 to identify PU-PET responsive tumours as part of a clinical study NCT01393509. [24]. An early phase I clinical trial is recruiting patients for PET imaging studies with this tracer (clinical trial identifier: NCT01269593).
A copper-64-labelled dimeric Sansalvamide A decapeptide was used to evaluate HSP90 expression in pancreatic cancer. The tracer showed in vivo uptake in PL45 tumours that could be efficiently blocked by pretreatment of the animals with 17-AAG at 4 h post tracer injection. Tumour-to-muscle ratios showed adequate tumour uptake; however, substantial hepatobiliary uptake was observed [25].
Recently, Brasca et al. reported NMS-E973, a potent and selective HSP90 inhibitor that showed great promise in several in vitro cellular assays against numerous tumour cell lines [26]. NMS-E973 (Figure 1F) was reported with a half maximal depolymerisation concentration (DC50) of 10 nM and a dissociation constant (KD) of 0.35 nM for HSP90α and 4.5 nM and 670 nM for Grp94 and TRAP1, respectively. NMS-E973 was tested against a panel of 52 protein kinases, where it showed high selectivity towards HSP90. In several in vivo studies, the compound induced a decrease in tumour growth and was effective against intracranially implanted melanoma [27]. The efficacy of NMS-E973 was also confirmed in a glioblastoma xenograft mouse model, where p53 upregulated modulator of apoptosis (PUMA) was induced following treatment of NMS-E973, leading to a reduction in tumour volume [28].
In this work, we report the radiosynthesis, in vitro and in vivo evaluation of [11C]NMS-E973 as a PET probe for in vivo visualisation of HSP90 in B16.F10 melanoma-inoculated mice.
Methods
High-performance liquid chromatography (HPLC) analysis
HPLC was performed on a LaChrom Elite HPLC system (Hitachi, Darmstadt, Germany) connected to a Waters 2487 UV-vis detector and a 3-inch NaI(Tl) scintillation detector connected to a single channel analyser (Gabi, Raytest, Straubenhardt, Germany). Registration and integration of the HPLC chromatograms was performed with GINA Star (Raytest) or RaChel (Lablogic, Sheffield, UK) software. The chemical and radiochemical purity (RCP) was assessed using reversed phase (RP)-HPLC (BDS Hypersil C18, 100 × 3 mm, 5 µm) eluted with 80%/20% Na2HPO4 0.01 M pH 9.3/CH3CN at a flow rate of 0.6 mL/min. The column effluent passed a UV detector (254 nm) and a NaI(Tl) scintillation detector. The identity of the tracer was determined by co-elution with cold reference compound on the same HPLC system.
Quantification of radioactivity in biological samples
Quantification was performed with an automated gamma counter equipped with a 3-inch NaI(Tl) well crystal coupled to a multichannel analyser (Wallac 1480 Wizard, Wallac, Turku, Finland). The results were corrected for background radiation, physical decay during counting and detector dead time.
Animal experiments
Animals were kept in a thermoregulated (22 °C) and humidity-controlled environment with a 12 h/12 h light/dark cycle in individual ventilated cages and had free access to food and water. All animal experiments were conducted with approval of the local University Ethics Committee for Animals and according to the Belgian code of practice for the care and use of animals. Female C57BL/6 mice, 8 weeks of age (body mass 20-25 g) and female Wistar rats (body mass 170-200 g) were purchased from Janvier (La Genest-Saint Isle, France). Naval medical research institute (NMRI)-mice (body mass 30-40 g) were purchased from Envigo (Venray, The Netherlands).
LC-MS analysis
Elucidation of intermediate reaction products was accomplished using a Dionex Ultimate 3000 LC system (Thermo Fisher Scientific, Sunnyvale, USA) coupled to a high-resolution time-of-flight mass spectrometer (TOF-HRMS) (MaXis impact, Bruker, Bremen, Germany) equipped with an orthogonal electrospray (ESI) interface. Acquisition and processing of data were done using Compass IsotopePattern (version 3.2, Bruker).
NMR analysis
NMR was performed using proton nuclear magnetic resonance (1H NMR) at 400 MHz. Chemical shifts are reported in parts per million (ppm) relative to tetramethylsilane (TMS, δ = 0). Carbon nuclear magnetic resonance (13C NMR) spectra were acquired at 101 MHz on a Bruker AVANCE 400 MHz spectrometer (5 mm probe, Bruker AG, Fällanden, Switzerland).
Statistical analysis
Quantitative data are expressed as mean ± SD. Conventional statistics, repeated one-way analysis of variance (ANOVA) with Dunnett's post hoc test or one-way ANOVA/Tukey (HSD) test were calculated using Graphpad Prism 7.04 (Graphpad Software). Significance was accepted at the 95% probability level. High content data are represented as boxplots with Kruskal-Wallis test with Dunnet's correction.
Reagents and chemicals
Synthesis of the precursor compound 7, 5-[2,4-Dihydroxy-6-(4-nitrophenoxy) phenyl]-N-(piperidin-4-yl)-isoxazole-3-carboxamide was performed as described by Brasca et al. [26] and a detailed synthetic protocol and characterization is provided in Supplementary Material (Figure S1). HSP90 inhibitors, Ganetespib, PU-H71, Pifithrin-µ, PU-WS13, and authentic reference compound NMS-E973 were purchased from Selleckchem or MedChem Express and used without further purification. Total polar surface area (tPSA) and LogD values were calculated using Marvinsketch (Marvin 14.10.13.0, 2014, ChemAxon, http://www.chemaxon.com).
Cell culture
All analysed cell lines including MCF-7, PC-3, B16.F10, OVCAR-3, BT-474 and MDA-MB-415 were obtained from the American Type Culture Collection (ATCC). All lines were grown according to the supplier's instruction in medium (F-16 or Dulbecco's Modified Eagle's Medium (DMEM)) supplemented with 10% fetal bovine serum, non-essential amino acids and glutamine (Life Technologies, USA).
Inhibitory concentration (IC50) analysis
Cells were plated in 96-well plates at 2000 cells/well at day 0. At day 1, cells were treated with compound for 24 h at a concentration range of 0-1 mM. Cells were subsequently fixed with 4% PFA for 20 min. Subsequent DAPI staining of nuclei and imaging by high-content analysis allowed counting of remaining nuclei after treatment with different concentrations. Statistical analysis to calculate IC50 values was performed using GraphPad Prism 7.04. Data were fitted to a non-linear regression curve and three-parameter model.
Immunofluorescent staining of cells and high-content screening
Cells were plated in 96-well plates (Greiner) at a density of 8000-10000 cells/well. At day 1, cells were treated with vehicle (DMSO; 0.001% final concentration), or with a compound (NMS-E973 or Ganetespib) at its IC50 concentration for 16 h. At day 2, cells were washed with PBS and fixed with 4% paraformaldehyde (Thermo Scientific, 16% PFA diluted in PBS) for 30 min and either permeabilised or not by adding 0.2% Triton-X100 to blocking buffer (1% bovine serum albumin (BSA) in PBS) for 60 min. Primary antibodies were added to the cells in blocking buffer at a dilution of 1:500 (Anti-HSP90, AC88, Abcam, anti- AKT, C67E7, CST and anti-HSP70 6B3,CST), and incubated overnight at 4 °C with gentle shaking. Cells were washed 3 times for 5 min in PBS and subsequently incubated with DAPI (0.1 µg/mL and/or secondary antibody (1:1000; goat-anti mouse, goat anti rabbit, goat anti rat, alexa 549, alexa 477, CY5; PROMEGA) in blocking buffer for 60 min. Imaging was performed on an IN Cell Analyser 2000 (GE Healthcare). The IN Cell Developer package (v1.9.2) allows visualization, imaging, and quantification of staining intensity and quantification of inclusions in cells following immunofluorescent staining. Statistical analyses are done on a minimum of 1000 single cells per condition by R-studio (version 0.97.55) using R (3.0.1) software.
Immunofluorescent staining of tumour section slices
Slices were fixed with 4% paraformaldehyde (Thermo Scientific, 16% PFA diluted in PBS) for 30 min and antigen retrieval at pH 9 (EnVision FLEX Target Retrieval Solution, Dako) was executed according to the manufacturer's guidelines. To eliminate fixation-caused autofluorescence, tissue sections were incubated in 1 mg/mL sodium borohydride 3 times for 10 min at room temperature. Slides were then blocked with 10% goat serum, 1% (w/v) BSA and 0.3 M glycine in tris-buffered saline (TBS) for 1 h. The primary antibodies (HSP90 AC88, Abcam) were incubated in blocking buffer overnight at 4 °C at 1/200 dilution. The secondary antibody was diluted in blocking buffer (1/500 dilution, goat-anti mouse alexa-594; PROMEGA) and incubated for 1 h together with DAPI (0.1 µg/mL). After several washing steps in TBS, the tissue sections were mounted with antifade reagent (ProLong Gold, Invitrogen) and kept in the dark for 24 h. Negative control slides (no primary antibody addition) were included in every batch. The screening was performed using a Nikon Eclipse TE-2000S inverted microscope at 60× magnification.
Radiosynthesis
Carbon-11 was produced by proton irradiation of a N2 + H2 (5%) gas mixture in a Cyclone 18/9 cyclotron (IBA Louvain-la-Neuve, Belgium) as [11C]CH4 by a 14N(p,α)11C nuclear reaction. [11C]CH4 was converted to [11C]CH3I in a home-built gas phase recirculation module. [11C]NMS-E973 was synthesized by N-methylation of the precursor, 5-[2,4-Dihydroxy-6-(4-nitrophenoxy) phenyl]-N-(piperidin-4-yl)-isoxazole-3-carboxamide by bubbling [11C]CH3I with a helium flow through a solution of the precursor (400-500 µg) dissolved in anhydrous DMSO (200-250 µL) in the presence of Cs2CO3 (1-3 mg). After the transfer of the radioactivity was completed, the reaction vial was heated to 100 °C for 4 min. After cooling down, the crude mixture was diluted with 1.2 mL of water and the reaction mixture was purified by HPLC on a C18 column (XBridge C18 column, 5 µm, 4.6 mm × 150 mm; Waters, Milford, USA) eluted with 69%/31% Na2HPO4 0.01 M pH 9.3/EtOH at a flow rate of 1 mL/min. The corresponding product peak was collected and diluted with saline to obtain a final ethanol concentration <10%. The solution was filtered through a sterile 0.22 µm membrane filter (Millex GV 13 mm; Millipore, Billerica, MA).
Confirmation of N-methylation
Tert-butyl-4-[({5-[2,4-bis(methoxymethoxy)-6-(4-nitrophenoxy)phenyl]-isoxazole-3-yl}carbonyl)amino]piperidin-1-carboxylate (3.5×10⁻⁴ mmol) was weighed and dissolved in 200 µL CH3CN in a reaction vial with septum containing 2.87 mg Cs2CO3. CH3I (3.09×10⁻⁵ mmol) dissolved in 10 µL CH3CN, was transferred with a N2 stream over a silver triflate column heated to 225 °C, to form methyl triflate, and bubbled through the reaction mixture. After a 10 min reaction at room temperature, the crude mixture was treated with 1 M of HCl overnight to remove the BOC protecting group. The mixture was injected on LC-MS and the QC HPLC system (BDS Hypersil C18, 100 × 3 mm, 5 µm; eluted with 80%/20% Na2HPO4 0.01 M pH 9.3/CH3CN). The crude mixture was co-injected on HPLC with 10 µL of 10 µg/mL NMS-E973.
Biodistribution studies
The biodistribution of [11C]NMS-E973 was studied in healthy female Wistar rats (body mass 170-200 g) and healthy NMRI-mice (body mass 30-40 g). The animals were anesthetized with 2.5% isoflurane in O2 at a flow rate of 1 L/min and injected with ~18.5 MBq (rats) or 5.5 MBq (mice) of tracer via a tail vein. The rodents were sacrificed by decapitation after 2, 10, 30 or 60 min p.i. (n = 3 per time point). To assess HSP90-specific binding in healthy tissue, NMRI-mice were injected intraperitoneally (I.P.) 45 min before tracer injection with either vehicle, NMS-E973 (25 mg/kg) or PU-H71 (50 mg/kg) dissolved in an aqueous solution of 5% DMSO and 40% (2-hydroxypropyl)-β-cyclodextrin. Pretreatment solutions were sterile filtered through a 0.22 µm membrane filter (Millex-GV, Millipore). Blood and organs of interest were collected in tared tubes and weighed. The radioactivity in the different organs was counted in an automated gamma counter, as described above. For the calculation of the total radioactivity in blood, muscle and bone, the masses were assumed to be respectively 7%, 40% and 12% of the total body mass [29-31]. Data were expressed as percentage of injected dose (%ID) and standardized uptake value (SUV). %ID was calculated as (counts per min (cpm) in organ / total cpm recovered) × 100%. SUV was calculated as (radioactivity in cpm in organ / weight of organ in g) / (total cpm recovered / total body weight in g). Data are expressed as mean ± SD; n = 3 per time point. Of note, %ID of urine takes into account the excreted urine as well as the whole bladder.
Plasma radiometabolite studies
Healthy male NMRI-mice were anesthetized with 2.5% isoflurane in O2 at a flow rate of 1 L/min and injected with about 11 MBq of the tracer via a tail vein. Mice were sacrificed by decapitation at 2, 10 or 30 min p.i. (n = 3 per time point). Blood was collected in K2EDTA-containing tubes (BD vacutainer, BD, Franklin Lakes, NJ, U.S.A.) and stored on ice. The blood was centrifuged for 10 min at (2330 ×g) to separate the plasma. Plasma (350 µL) was spiked with 20 µL authentic reference compound (100 µg/mL in DMSO), weighed and counted in a gamma counter. Subsequently, individual plasma samples (300-350 µL) were analysed by RP-HPLC on a Chromolith RP C18 column (3 mm × 100 mm, Merck, Darmstadt, Germany) eluted with gradient mixtures of CH3CN (A) and 0.05 M NaOAc pH 5.5 (B) (Table S1). After passing through an in-line UV detector (254 nm) coupled to a 3-inch NaI(Tl) scintillation detector connected to a single channel analyser, the HPLC eluent was collected in 1 mL fractions with 15 fractions in total per plasma sample; radioactivity was measured in an automated gamma counter.
Murine-grown tumour and muscle tissue slices
10×106 LNCaP, SKOV-3, or PC3 cells per mouse in 50% Matrigel (VWR, Radnor, U.S.A.) were subcutaneously inoculated into the right shoulder of 7-8-week-old BALB/c nu/nu mice (body mass 20-25 g) obtained from Janvier (La Genest-Saint Isle, France). The tumours were allowed to grow for 4-5 weeks until they reached ~0.5-0.75 cm3 in size as determined using a caliper. 5×10⁵ B16.F10 cells per mouse were implanted subcutaneously in the right dorsal flank of 8-week-old C57BL/6 mice (body mass 20-25 g) purchased from Janvier (La Genest-Saint Isle, France). The tumours were allowed to grow for 10-15 days until they reached ~0.5-0.75 cm3 in size as determined using a caliper. Subsequently, the mice were anesthetized with 2.5% isoflurane in O2 at a flow rate of 1 L/min after which they were sacrificed by decapitation. Tumour or muscle tissue was excised, rinsed with saline to remove blood and rapidly frozen in 2-methylbutane (-40 °C). Next, 20 µm sections were obtained using a cryotome (Shandon cryotome FSE; Thermo Fisher, Waltham, MA) and these were mounted on adhesive microscope slides (Superfrost Plus; Thermo Fisher Scientific) and stored at -20 °C.
In vitro autoradiography of tumour, muscle and myocardium tissue slices
Frozen slices were air-dried and preincubated in PBS for 10 min at room temperature. After drying, the slices were incubated with 74 kBq/mL of the tracer in 200-250 µL PBS + 0.3% BSA per section for 10 min at room temperature. To assess binding specificity, slices were incubated with 74 kBq/mL of tracer (200-250 µL PBS + 0.3% BSA) in the presence of DMSO (10%) or 100 µM of either authentic NMS-E973, PU-H71, Ganetespib, PU-WS13 or HSP70 inhibitor Pifithrin-µ in DMSO (10%). Incubation solutions were removed, after which the tumour slices were washed twice for 5 min in PBS + 0.3% BSA at 4 °C with a final washing step encompassing a quick dip in water at 4 °C, after which the slices were dried. Autoradiograms were obtained by exposing the slices to a phosphor storage screen (super-resolution screen; Perkin Elmer, Waltham, MA) overnight. The screens were read using a Cyclone Plus system (Perkin Elmer) and the images were analysed using Optiquant software (Perkin Elmer). Results are expressed as digital light units per square mm (DLU/mm2). Percentage block vs control was calculated as (DLU/mm2 in the presence of 100 µM blocker) / (DLU/mm2 tracer only) on 3-4 tissue sections from the same experiment.
Ex vivo autoradiography of B16.F10 melanoma, heart and muscle tissue
A B16.F10 melanoma-inoculated mouse, generated as mentioned above, and a healthy C57BL/6 mouse were injected with 4.5-5.5 MBq of [11C]NMS-E973. After 30 min, an overdose of pentobarbital (200 mg/kg I.P. Doléthal, Vetoquinol N.V. Aartselaar, Belgium) was administered followed by perfusion with saline via the left ventricle, followed by opening of the right atrium, until the liver turned pale. Organs of interest were quickly excised and snap frozen in 2-methylbutane (-40 °C). Next, 60 µm sections were obtained using a cryotome (Shandon cryotome FSE; Thermo Fisher, Waltham, MA) and these were mounted on adhesive microscope slides (Superfrost Plus; Thermo Fisher Scientific) after which they were exposed to a phosphor storage screen (super-resolution screen; Perkin Elmer, Waltham, MA) overnight. The remaining excised tissue was further sectioned in 20 µm slices and stored at -20 °C.
Cell binding studies
B16.F10 melanoma cells were seeded (200.000 cells/well) in 24-well plates and incubated at 37 °C for 24 h in the presence of 5% CO2. After washing with PBS, the cells were incubated with 555 kBq of [11C]NMS-E973 dissolved in DMEM in the presence of 2% DMSO, or 200 µM of NMS-E973, PU-H71 or Pifithrin-µ dissolved in DMSO (2%) for 60 min at 37 °C and 5% CO2. After incubation, cells were washed three consecutive times with 250 µL of ice-cold PBS. The cells were then incubated twice with 500 µL glycine-HCl in PBS (50 mM, pH 2.8) for 5 min at room temperature to remove radioactivity bound to the cell surface. Cells were washed again three consecutive times with ice-cold PBS and subsequently lysed using 250 µL of lysis buffer (reagent A100, Chemometec, Allerod, Denmark). After 5 min incubation, 250 µL neutralization buffer (reagent B, Chemometec, Allerod, Denmark) was added to quench the lysing of the cells. Glycine wash and lysed fractions were collected and radioactivity was counted with an automated gamma counter. The number of cells per well was counted using an automated counting device (NucleoCounter® NC-200™, Chemometec). Results were expressed as percentage of applied radioactivity bound to 1×10⁶ cells. Radiotracer experiments with live cells potentially allow for quantification of HSP90-specific binding in extracellular and intracellular compartments. We initially tried to quantify the eHSP90-bound fraction by applying an acidic glycine wash [32] but in subsequent autoradiography experiments we observed that acidic wash did not result in complete dissociation of [11C]NMS-E973 from tissue slices and hence we only used total cell binding data in this study.
µPET imaging studies on B16.F10-inoculated C57BL/6 mice
Ten days after inoculation, mouse (n = 3) whole-body PET scans were acquired on 3 consecutive days using a FOCUS™ 220 µPET scanner (Concorde Microsystems, Knoxville, U.S.A.). Before the start of the PET scan, mice were anesthetized using 2.5% isoflurane in oxygen (2 L/min) and kept under anaesthesia during the entire scan period. The experimental setup is presented in Table 1. At day one and three, mice were pretreated I.P. 45 min before tracer injection with either vehicle (day 1-1) or PU-H71 (50 mg/kg) (day 3-1) dissolved in an aqueous solution of 5% DMSO and 40% (2-hydroxypropyl)-β-cyclodextrin. A similar study was conducted comparing vehicle-pretreated mice with Ganetespib (50 mg/kg) dissolved in the same vehicle (Table 1, day 1-2, 2-2) Pretreatment solutions were filtered through a 0.22 µm membrane filter (Millex-GV, Millipore). Immediately after intravenous (I.V.) injection of 11 MBq [11C]NMS-E973 via a tail vein, mice were scanned dynamically for a duration of 90 min. Following day 1-1 scans, the mice were subjected to an overnight fasted state with only access to water. Following the abstinence period (day 2-1), mice were anesthetized using 2.5% isoflurane in oxygen (2 L/min) and injected I.P. with 11 MBq 2-[18F]fluoro-2-deoxy-D-glucose ([18F]FDG). The mice were allowed to recover consciousness during the uptake period of [18F]FDG. 60 min p.i. mice were anesthetized (2.5% isoflurane in oxygen 2 L/min) and submitted to a 10-min static PET scan. Acquisition data of the dynamic scans were Fourier rebinned in 24 time frames (4 ×15 s, 4 × 60 s, 5 × 180 s, 8 × 300 s, 3 × 600 s). Time activity curves (TACs) of the tumours were generated using PMOD software (v3.3, PMOD Technologies, Zürich, Switzerland).
Experimental setup of µPET imaging studies of B16.F10-inoculated C57BL/6 mice.
| Day | Number of animals | Tracer | Experiment | Route of administration | Blocking 45 min pre tracer injection | Type of scan | Duration of scan |
|---|---|---|---|---|---|---|---|
| 1-1 | 3 | [11C]NMS-E973 | Baseline | I.V. | Vehicle | Dynamic | 0-90 min |
| 2-1 | 3 | [18F]FDG | Baseline | I.P. | / | Static | 10 min, 60-70 min p.i. |
| 3-1 | 3 | [11C]NMS-E973 | Block | I.V. | PU-H71 (50 mg/kg) | Dynamic | 0-90 min |
| 1-2 | 4 | [11C]NMS-E973 | Baseline | I.V. | Vehicle | Dynamic | 0-90 min |
| 2-2 | 6 | [11C]NMS-E973 | Block | I.V. | Ganetespib (50 mg/kg) | Dynamic | 0-90 min |
Results
Biochemical characterization of HSP90, HSP70 and AKT protein expression in a panel of established cancer cell lines
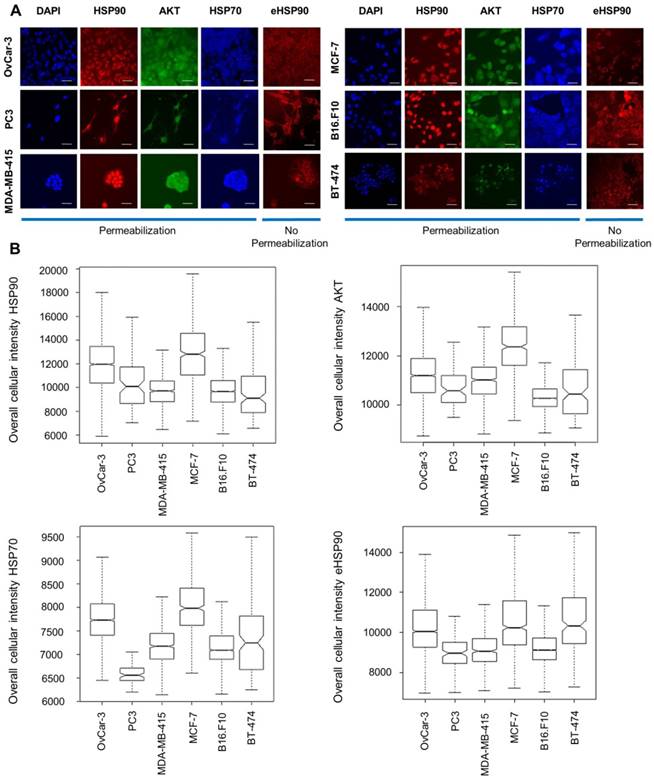
We selected 6 established cancer cell lines of different origin including breast (MCF-7, MDA-MB-415 and BT-474), ovarian (OVCAR-3), prostate (PC3) and murine melanoma (B16.F10). By performing immunofluorescent staining analysis and subsequent high-content imaging analysis, endogenous protein expression of HSP90, HSP70 and AKT in all these lines was characterized. AKT, a client protein of HSP90, was included as its stability is dependent on HSP90. Additionally, extracellular expression of HSP90 was determined by employing a non-permeabilization staining method. While permeabilization lead to a more diffuse staining of HSP90 throughout the whole cell including the nucleus, non-permeabilization resulted in diffuse membrane staining and excluded nucleus staining. HSP90 is thus expressed on the cell membrane, in the cytoplasm and in the nucleus. We observed different expression levels of HSP70, eHSP90 and AKT throughout these cell lines (Figure 2).
Immunocytochemical staining and protein expression levels of HSP70, HSP90 and AKT in different cancer cell lines. (A) Immunofluorescent staining of cellular baseline HSP90, AKT, HSP70 and eHSP90 protein in different cell lines with DAPI as reference nuclear staining. Scale bar, 100 µm. (B) Immunofluorescence intensity measurements by high-content imaging represented as box plots. Boxplots represent the median of n > 1000 cells.
In vitro biochemical characterization of NMS-E973 vs Ganetespib activity in cancer cell lines
Throughout this study, Ganetespib was used as a positive control for HSP90 inhibition and its activity is compared with that of NMS-E973. Therefore, IC50 values were determined for NMS-E973 and Ganetespib after 24 h incubation in all cell lines by a dose dependence response assay and subsequent nuclei counting by high-content imaging analysis (Table 2). Inhibition of HSP90 by NMS-E973 or Ganetespib lead to fast and significant reduction in the number of cells after 24 h in most lines, with the exception of the MCF-7 cell line, which shows a stronger resistance to both drugs and probably needs a longer incubation time to see significant cell death. Similarly, the IC50 of PU-H71 in B16.F10 cells was determined to be 108 ± 86 nM.
IC50 determination of NMS-E973 and Ganetespib.
| Cell line | IC50 NMS-E973 (nM) ± SD | IC50 Ganetespib (nM) ± SD |
|---|---|---|
| MCF-7 | ∞ | ∞ |
| MDA-MB-415 | 174 ± 10 | 24 ± 9 |
| BT-474 | 276 ± 25 | 412 ± 19 |
| B16.F10 | 454 ± 35 | 321 ± 47 |
| PC-3 | 48 ± 21 | 138 ± 42 |
| OvCar-3 | 677 ± 41 | 279 ± 39 |
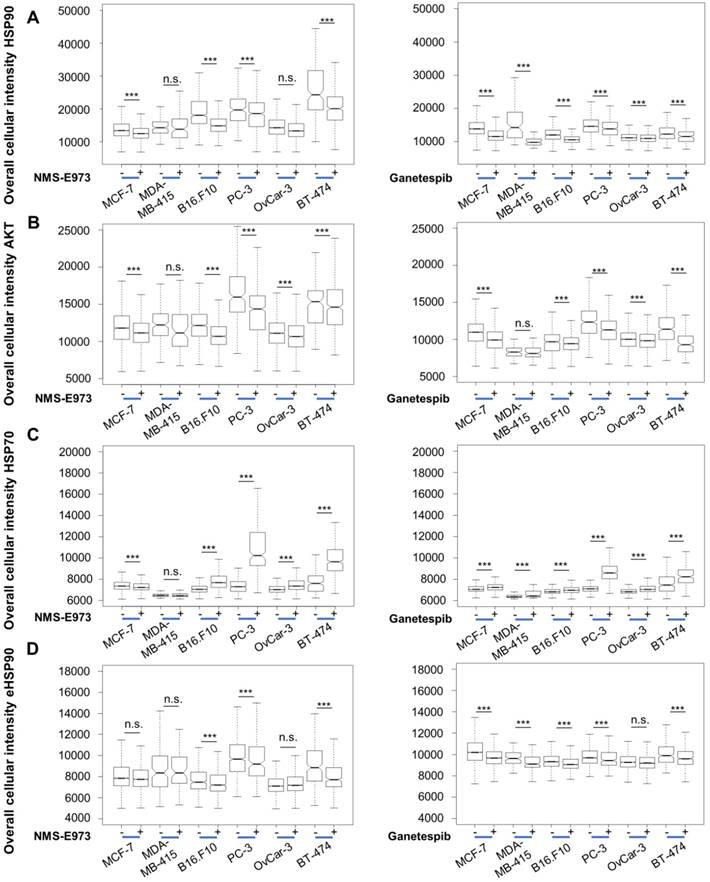
As HSP90 regulates the expression and stabilization of a number of client proteins, including AKT, inhibition of HSP90 results in downregulation of these proteins' expression levels. Likewise, HSP70 is upregulated as a result of HSP90 inhibition, due to induction of a cellular heat shock response [11]. High-content imaging analysis after staining shows that treatment of the cell lines at their IC50 concentration for 16 h with Ganetespib or NMS-E973 resulted in significantly lower expression of AKT and upregulated HSP70 response in comparison to vehicle-treated controls (Figure 3). When quantifying expression levels of HSP90, we observed that total HSP90 expression in cells was slightly but significantly down after both treatments. The intensity of total HSP90 expression levels is on average higher than the eHSP90 staining levels due to the nucleus exclusion. The effect of NMS-E973 and Ganetespib on the expression of HSP90 and eHSP90 in the B16.F10 melanoma cell line was further investigated (Figure S2). These data show that treatment with both inhibitors did not visibly change the phenotype of the cells. Additionally, CDK1 expression was characterized by SDS/Western blot of the B16.F10 melanoma line. Inhibition of HSP90 by NMS-E973 and Ganetespib was confirmed as the CDK1 signal was reduced by the treatment. As a protein loading control, the HSP90-independent protein GAPDH was used. (Figure S3). In conclusion, NMS-E973 shows a potent in vitro cell HSP90 inhibitory activity comparable to that of Ganetespib.
Effect of NMS-E973 and Ganetespib treatment on different cell lines. Boxplot of high-content imaging results of HSP90 (A), AKT (B), HSP70 (C) and eHSP90 (D). Staining shows the effect on protein expression of overnight treatment with NMS-E973 or Ganetespib, indicating the HSP90 inhibitory activity of the compounds. Boxplots are of three independent experimental repeats with the number of cells analysed per condition > 1000 (***P<0.001).
Biochemical characterization of HSP90 protein expression in xenograft-derived tumour tissue
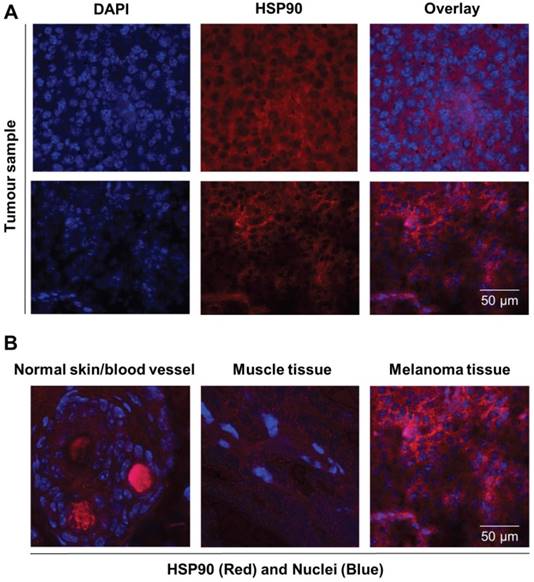
HSP90 protein was biochemically characterized in both the B16.F10 melanoma cell line and corresponding derived xenograft tumour tissue by immunocytochemical and histofluorescent staining. Immunohistochemistry experiments were performed on tumour slices of xenograft-derived B16.F10 melanoma tissue, and diffuse HSP90 staining patterns were observed that are comparable to the in vitro cell culture staining experiments (Figure 4A). Interestingly, healthy skin tissue and healthy muscle tissue were found to express low levels of HSP90 in comparison to the melanoma tissue, indicating that HSP90 is clearly upregulated in malignant tissue (Figure 4B). From these experiments, vast upregulation of HSP90 expression in B16.F10 melanoma cells and tissue was confirmed.
Immunofluorescent staining of normal, healthy tissue and melanoma tissue. (A) Representative immunofluorescence images of tumour sections (n = 2) stained for nuclei (DAPI, blue) and HSP90 (Alexa 594, red) showing expression of HSP90. Scale bar, 50 µm. (B) Immunofluorescence overlay images of nuclei (DAPI, blue) and HSP90 (TexasRed, Red) staining showing that HSP90 expression in skin and muscle tissue is low in comparison to that of malignant melanoma tissue. Strong red staining in blood vessels is caused by autofluorescence.
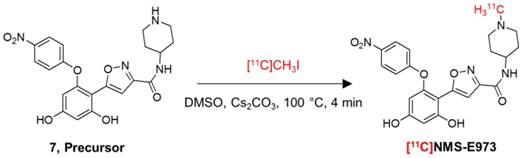
Radiosynthesis
Attempts to radiolabel the desmethyl radiolabeling precursor with [11C]CH3I or [11C]CH3OTf dissolved in DMF in the presence or absence of DIPEA were unsuccessful. However, successful radiochemical methylation was achieved by dissolving the precursor in anhydrous DMSO and reacting with [11C]CH3I in the presence of Cs2CO3 (Figure 5). The reaction yielded 25-40% of the title compound relative to total recovered carbon-11 radioactivity on preparative HPLC. The title compound was easily purified by RP-HPLC to a radiochemical purity of >97% and a molar activity of ~85 GBq/µmol at the end of synthesis (EOS) (n = 3). A QC-chromatogram of [11C]NMS-E973 spiked with authentic reference compound NMS-E973 is depicted in Figure S4. Additional simulated labelling tests were performed to confirm methylation on the piperidine moiety (Figures S5-S7).
Radiosynthesis of [11C]NMS-E973.
In vitro and ex vivo autoradiography
In vitro autoradiography experiments with [11C]NMS-E973 were conducted on sections of several different tumour tissues and compared to healthy murine muscle tissue. Regional binding heterogeneity of the tracer was observed in all tumour types (Figure 6). A tendency for higher radiotracer concentration at the edges of the tumour sections was noticed. To assess tracer HSP90 binding specificity, tumour slices were incubated with [11C]NMS-E973 in the presence of 100 µM NMS-E973, non-structurally related HSP90 inhibitors PU-H71 and Ganetespib, the HSP70 inhibitor Pifithrin-µ, or the Grp94 inhibitor PU-WS13. Tracer binding was quantified as DLU/mm2 in tumour tissues and compared to healthy muscle tissue. Blocking efficiencies are presented in Table 3. Co-incubation with Pifithrin-µ or PU-WS13 yielded no significant reduction in tracer binding to any of the studied tissues. Blocking with NMS-E973 (90% block), PU-H71 (82% block) and Ganetespib (85% block) was most effective in the PC3 tumour sections. The ovary carcinoma SKOV-3 showed similar potent blocking compared to the B16.F10 tumour sections. Roughly 75% of the tracer was blocked by incubation with NMS-E973 and approximately 60% with PU-H71 and Ganetespib. Incubation of muscle tissue resulted in significant tracer blocking that was, however, less pronounced compared to that of tumour tissue.
In vitro autoradiography. In vitro autoradiography of (A) LNCaP, (B) PC3, (C) SKOV-3, (D) B16.F10 melanoma, and (E) murine muscle tissue. Slices were incubated with tracer, tracer + NMS-E973, tracer + PU-H71, tracer + Pifithrin-µ, tracer + Ganetespib, tracer + PU-WS13, or tracer + Pifithrin-µ at 74 kBq/mL of [11C]NMS-E973 per slice and 100 µM of blocking agents. (F) Ex vivo vs in vitro autoradiography. Tissue was acquired from the same B16.F10 melanoma-bearing mouse. Intensity is depicted as DLU/mm2. n = 3-4 sections per group.
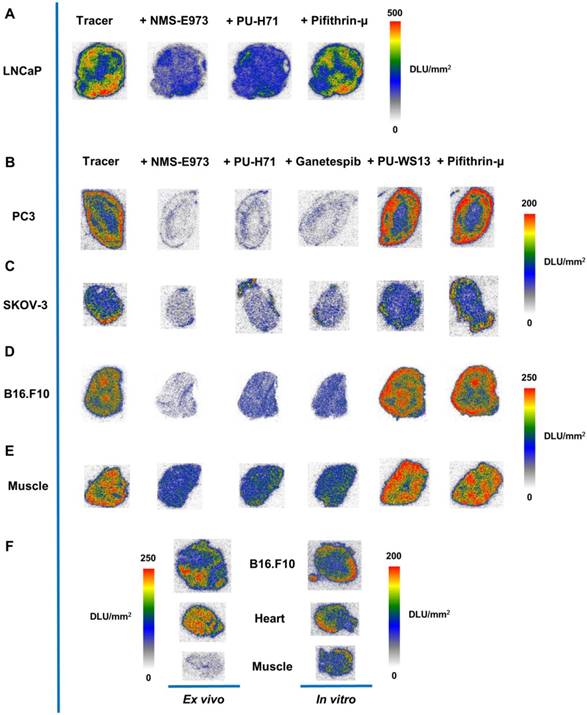
Percentage blocking of tracer binding in the presence of different HSP90 inhibitors in several tumour types.
| Tissue | Compound | % Block + SDa |
|---|---|---|
| LNCaP | NMS-E973 | 63 ± 4*** |
| PU-H71 | 51 ± 5*** | |
| Pifitrhin-µ | 11 ± 14n.s. | |
| PC3 | NMS-E973 | 90 ± 1*** |
| PU-H71 | 84 ± 2*** | |
| Ganetespib | 85 ± 2*** | |
| PU-WS13 | No block | |
| Pifitrhin-µ | No block | |
| SKOV-3 | NMS-E973 | 73 ± 9*** |
| PU-H71 | 55 ± 7*** | |
| Ganetespib | 62 ± 5*** | |
| PU-WS13 | No block | |
| Pifitrhin-µ | No block | |
| B16.F10 | NMS-E973 | 74 ± 3*** |
| PU-H71 | 57 ± 3*** | |
| Ganetespib | 59 ± 3*** | |
| PU-WS13 | No block | |
| Pifitrhin-µ | No block | |
| Muscle | NMS-E973 | 54 ± 3*** |
| PU-H71 | 44 ± 3*** | |
| Ganetespib | 41 ± 2*** | |
| PU-WS13 | No block | |
| Pifitrhin-µ | No block |
a Calculated as (average DLU/mm2 in tissue slice in the presence of 100 µM blocker) / (average DLU/mm2 in tissue slice tracer only), ***P≤0.001, n.s. = not significant. SD values are of 3-4 different slices from the same experiment.
To study the difference between in vitro and in vivo tracer binding, an ex vivo autoradiography experiment was set up where uptake and distribution of the tracer was compared in tissues of a B16.F10 melanoma inoculated mouse. Sections of the organs of interest (tumour, heart and muscle) were further used on the following day (after decay of the injected carbon-11 activity) in an in vitro autoradiography study. Similar to the previous study, higher tracer binding to the outer edges of the sections was observed in the in vitro autoradiography for all the studied tissues, whereas ex vivo studies show a more homogenous distribution of the tracer. Furthermore, muscle tissue radioactivity concentration is clearly lower compared to that of myocardium and tumour tissue in ex vivo autoradiography; similar radioactivity concentrations were observed in in vitro autoradiography experiments of the same tissues.
In addition, the tissue radioactivity distribution pattern is remarkably different between ex vivo autoradiography (relatively homogeneous) and in vitro autoradiography (higher concentration at the outer edges of the section) for identical tissues.
Cell binding studies
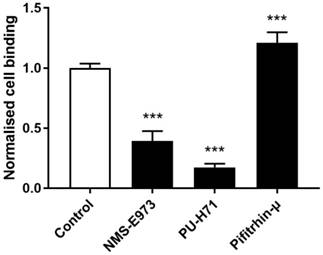
To study binding of [11C]NMS-E973 to HSP90 in live cells, a cell binding study was performed on B16.F10 melanoma cells (Figure 7). The reduction of [11C]NMS-E973 cell binding in the presence of 200 µM PU-H71 (83%) was higher than that in the presence of 200 µM NMS-E973 (61%). The HSP70 inhibitor Pifithrin-µ was used as a negative control for the blocking studies. A significant increase (P≤0.001) in total binding (+21%) compared to that of control conditions was observed, suggesting increased HSP90 expression resulting from HSP70 inhibition.
Cell binding of [11C]NMS-E973 to B16.F10 melanoma cells. Specific cell binding was assessed by blocking with NMS-E973, PU-H71 or Pifithrin-µ (200 µM) at 37 °C. Values are expressed as percentage of applied radioactivity bound to 1×10⁶ cells normalised to the value for control cells. Data are expressed as mean ± SD (n = 3). Significance is calculated as control vs blocking (***P≤0.001).
Biodistribution studies and plasma radiometabolite study
The biodistribution of [11C]NMS-E973 was studied in healthy female Wistar rats and healthy male NMRI-mice (Tables S2-S3). [11C]NMS-E973 was cleared from the plasma predominantly by the hepatobiliary system combined with a smaller fraction of renal clearance. Only limited brain and testes uptake (< 0.1 %ID) of the tracer was observed. The amount of intact tracer in the plasma was determined in male NMRI-mice at 2, 10 and 30 min p.i. At least 72% of recovered radioactivity corresponded to intact tracer at 30 min post tracer injection. The detected radiometabolite was more polar than the title compound at all time points examined (Figure S8).
To assess tracer binding in healthy tissue, pretreatment studies with NMS-E973 (25 mg/kg) and PU-H71 (50 mg/kg) were conducted in NMRI-mice. Mice were sacrificed 10 min after tracer injection. Data are expressed as %ID and SUV (Table S4). When comparing the vehicle-pretreated and inhibitor-injected animals, only limited displacement of radioactivity in the organs of interest was observed. Significant blockage of tracer binding was seen after pretreatment with NMS-E973, but only in the lungs and blood. PU-H71 pretreatment yielded no significant displacement, however, a shift of radioactivity from the hepatobiliary circuit to the blood occurred, suggesting slower hepatobiliary plasma clearance.
Additional biodistribution studies were performed 60 min after tracer injection on B16.F10 melanoma-inoculated tumour mice pretreated with vehicle (n = 3), PU-H71 (50 mg/kg I.V., n = 4) or Ganetespib (50 mg/kg I.V., n = 3). Data are shown in Table S5. A significant decrease in tumour uptake was observed after blocking with either PU-H71 or Ganetespib. A decrease in blood radioactivity was also observed after pretreatment with PU-H71 and Ganetespib. Tumour/muscle SUV ratios are respectively, 2.4 ± 0.9 in control conditions, 1.2 ± 0.2 for blocking with PU-H71 and 1.1 ± 0.2 for Ganetespib blocking.
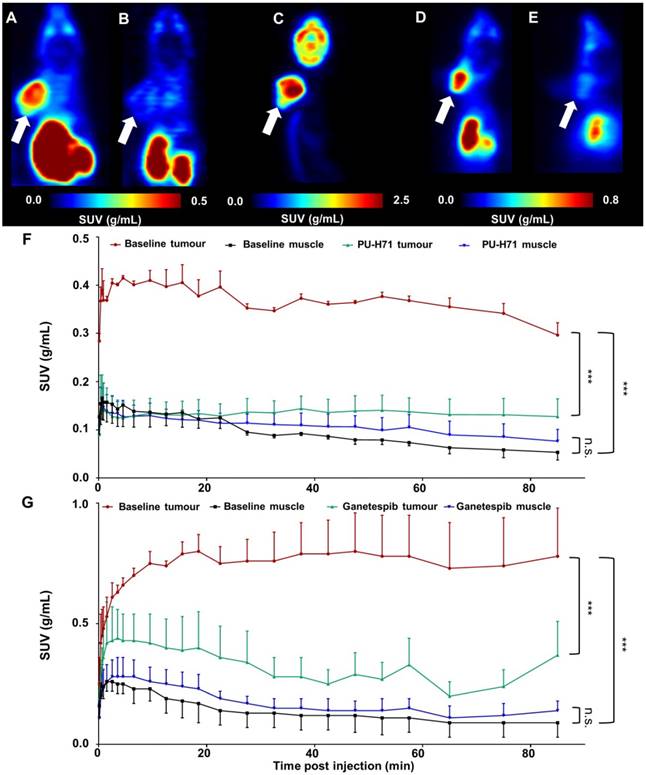
µPET studies in B16.F10-inoculated C57BL/6 mice
Figure 8 shows the results of µPET studies conducted in C57BL/6 mice inoculated with B16.F10 melanoma cells. Mice were scanned on consecutive days and time-activity curves are shown as mean SUV ± SD (Figure 8F-G). The averaged images of the baseline scan (0-90 min p.i., Figure 8A-D) revealed tumour-specific uptake of radioactivity, indicated by a high tumour-to-background contrast. TACs of baseline scans on separate days show highly reproducible tumour uptake of the tracer (Figure 8F-G). Tumour uptake of [11C]NMS-E973 was significantly blocked by pretreatment with either PU-H71 or Ganetespib (SUV0-90min P≤0.001) whereas no blocking effect was observed in muscle tissue (SUV0-90min n.s.) (Figure 8B, E, F-G), in line with the results of the B16.F10 melanoma-inoculated tumour mice biodistribution blocking study. Consistent with the ex vivo biodistribution (Table S5), both hepatobiliary and renal tracer clearance were observed. µPET studies also confirmed limited (if any) activity passing through the blood-brain barrier (BBB). High tumour-to-background contrast was observed in mice injected with [18F]FDG and subjected to a 10 min static scan (60-70 min after tracer injection). The distribution of radioactivity in the tumour suggests a highly active tumour with limited necrosis (Figure 8C).
Whole-body coronal µPET imaging of C57BL/6 mice inoculated with B16.F10 melanoma. (A) Averaged baseline image of 90-min dynamic scan after injection of [11C]NMS-E973. (B) Averaged image of 90-min dynamic scan after blocking with 50 mg/kg PU-H71 administered I.P. 45 min before [11C]NMS-E973 injection. (C) µPET image derived from a 10-min static scan (60-70 min p.i.) after I.P. injection of 11 MBq of [18F]FDG. (D) Averaged baseline image of 90-min dynamic scan after injection of [11C]NMS-E973. (E) Averaged image of 90-min dynamic scan after blocking with 50 mg/kg Ganetespib administered I.P. 45 min before [11C]NMS-E973 injection. (A-E) White arrows indicate tumour site. (F) Averaged TACs derived from baseline (red, tumour uptake; black, muscle uptake) and PU-H71 blocking (green, tumour uptake; blue, muscle uptake) studies (n = 3). (G) Averaged TACs derived from baseline (red, tumour uptake; black, muscle uptake) and Ganetespib blocking (green, tumour uptake; blue, muscle uptake) studies (n = 4-6). Significance calculated on SUV0-90 min, (***P≤0.001, n.s. = not significant).
Discussion
HSP90 and its extracellular counterpart eHSP90 have gained attention as detrimental regulators of cancer maintenance in several tumour types, contributing to cell motility, invasion and metastasis [33]. Over 15 HSP90 inhibitors are being evaluated in clinical trials [34]. Uncertainty about optimal treatment regimens remain and possible side effects such as reversible night blindness and gastrointestinal problems still occur [19]. Hence, elucidation of the optimal therapeutic potential of HSP90 inhibitors is required. In an attempt to reveal the effect of HSP90 inhibition on the downstream pathway, researchers have focused on imaging client proteins or regulated pathways after HSP90 inhibition. In two separate studies, [18F]FDG was used in combination with HSP90 inhibitors Retaspimycin HCl (IPI-504) or BIIB021 in patients with metastatic gastrointestinal stromal tumours. Reduced uptake of [18F]FDG was observed after treatment, implying metabolic changes in the tumour cells resulting from HSP90 inhibitor treatment [35,36]. In another PET study, anti-EGFR antibody Cetuximab was radiolabelled with Iodine-124 to assess the efficacy of HSP90 inhibitor Onalespib in mice xenografts of head-and-neck squamous cell carcinoma. Reduced uptake of radiolabelled antibody was observed in mice treated with Onalespib, implying a decreased expression of HSP90 client protein EGFR [37]. [89Zr]Trastuzumab and [89Zr]Bevacizumab have been used to evaluate the effect of HSP90 inhibitor Luminespib in, respectively, HER2-positive and estrogen receptor-positive metastatic breast cancer patients [38]. The use of HSP90 as a PET biomarker could be key to understanding the role played by HSP90 in health and disease and may enable rational optimisation of HSP90 inhibitor administration regimens by quantification of tumour HSP90 occupancy after HSP90 inhibitor treatment. In this respect, we successfully radiolabelled and evaluated [11C]NMS-E973.
Extracellular HSP90 is known to be expressed by highly active, metastatic tumours as is observed in several tumour lines ranging from breast cancer to melanomas [14,22]. Normal cells do not express eHSP90 except under conditions promoting cellular stress [33]. One example of eHSP90 appearance in healthy tissue has been observed in response to tissue damage and subsequent wound healing [39]. Translocation of HSP90 to the cell surface or ECM occurs via an exosome trafficking pathway partially mediated by upstream regulators including p53 and hypoxia-inducible factor-1α (HIF-1α) [16,40]. It was postulated that eHSP90 functions as a regulator of cell motility, angiogenesis and cell invasion processes in both malignant states and during tissue injury. Moreover eHSP90 is actively internalised by endocytic processes as shown in a study by Crowe et al. and it was suggested that this process occurs via multiple pathways [21]. In the same study, it was determined that many aggressive tumour cell lines actively internalise eHSP90 and this internalisation process was not influenced by fluorescent inhibitors targeting the ATP-binding pocket. Moreover, internalisation was inhibited using a C-terminal antibody [22].
We have characterized total and extracellular HSP90 expressions in 6 cell lines in vitro using high-content screening (Figure 2A-B). High-content screening analysis is an imaging method to visualize, image and quantify protein expression levels in tumour cells, allowing analysis of a large number of cells in an automated manner. By subsequent quantification and morphometric analyses HSP90, eHSP90, HSP70 and AKT protein expression levels on a single cell level throughout different cell lines were quantified. All cell lines expressed eHSP90, some to a higher extent than other. HSP90, HSP70 and AKT are all expressed in the cytoplasm as well as in the nucleus in a diffuse manner. These cell lines thus provide a useful tool for compound activity analysis. We first determined the IC50 for NMS-E973 and Ganetespib to determine treatment concentrations without excessive cell death. Next, we analysed protein expression levels upon treatment with NMS-E973 and compared its activity to Ganetespib as a control. When HSP90 is functionally inhibited, client proteins such as AKT and CDK1 will fail to mature due to destabilized complex formation between client protein and chaperone, leading to increased ubiquitination and subsequent proteasomal degradation [12]. High-content imaging indeed showed a decrease in AKT expression in all the studied cell lines besides the MDA-MB-415 breast cancer line (where presumably a longer incubation time is needed) when incubated with inhibitors. Moreover, western blot studies indicated a significantly lowered expression of the HSP90 client protein CDK1 (Figure S3) in the presence of HSP90 inhibitors Ganetespib or NMS-E973. Furthermore, HSP70 expression, which is induced via the heat shock response to compensate inhibited HSP90 [41], was upregulated after treatment of cells with NMS-E973 (Figure 3C) or Ganetespib. The potency of NMS-E973 to affect HSP90 function is thus in accordance with previous literature reports [11,26].
Experiments on B16.F10 melanoma cells (Figure 7) showed efficient blocking of [11C]NMS-E973 binding during co-incubation of the cells with NMS-E973 or PU-H71, indicating that cell binding is HSP90 selective. PU-H71, a representative of the purine-bearing class of HSP90 inhibitors, was chosen as a non-structurally related inhibitor and is known as an inhibitor of the epichaperome, a complex connectivity of HSP90-HSP70 and its co-chaperones [24,42]. Blocking with 200 µM PU-H71 was more efficient compared to 200 µM NMS-E973. Based on their respective tPSA and logD values, 151.20 Å2 and 1.04 for NMS-E973 and 100.11 Å2 and 0.70 for PU-H71, passive diffusion of NMS-E973 over the cell membrane may be more limited and exposure of the intracellular compartment to PU-H71 can be faster and more substantial, leading to higher blocking efficiency. Moreover, the IC50 of NMS-E973 and PU-H71 where determined to be 454 nM and 108 nM, respectively, in the B16.F10 cell line, indicating a 4-fold higher activity of PU-H71 towards the B16.F10 melanoma cell line. Inhibition of HSP70 with Pifithrin-µ, a p53 inhibitor with known activity against HSP70 (IC50 = 2.5-12.7 µM) [43], yielded a significant increase in tracer binding. HSP70 is closely linked to HSP90 and plays an important role in the HSP90 machinery as a provider of client proteins [41]. HSP90 inhibition induces HSP70 transcription and upregulation [11,44] and HSP70 ablation enhances HSP90 inhibitor efficacy and induces apoptosis [45,46]. Inversely, it was reported that inhibition with Pifithrin-µ or knockdown of HSP70 was unable to upregulate HSP90 expression [47]. However, following the crosstalk and interplay between HSP90 and HSP70, high sensitivity detection of radioactivity by gamma counting can possibly enable quantification of the latter mechanism, mediated by an affinity increase rather than a change in expression. This may explain the increased total binding of [11C]NMS-E973 in B16.F10 melanoma cells observed after co-incubation with Pifithrin-µ compared to the control conditions.
In an in vitro autoradiography experiment, slices of different tumour types were incubated with [11C]NMS-E973 in the presence or absence of 100 µM NMS-E973, PU-H71, Ganetespib, PU-WS13 or Pifithrin-µ. Heterogeneous tracer distribution was observed and the border regions of the tumour sections showed the highest radioactivity concentration, which was particularly the case for the PC3 tissue (Figure 6B). The investigated tumours showed variable degrees of HSP90-specific binding (Table 3) This may be attributed to the aggressiveness of the different tumour types as it was reported that tumours with higher metastatic potential had increased expression levels of eHSP90 and showed higher internalisation of the eHSP90 fluorescent probe HS-131 [21]. The highest HSP90-specific binding was observed in the PC3 prostate cancer, which is described as a tumour with prominent metastatic potential [48] and high expression of HSP90 and eHSP90 (Figure 2). Incubating the tumour sections in the presence of Ganetespib yielded similar results to blocking with PU-H71 in SKOV-3 and B16.F10 tissue. (Figure 6C, D). The androgen-dependent LNCaP and androgen-independent PC3 prostate carcinomas and SKOV-3 ovarian cancer are representatives of gonadal malignancies. Stabilisation and nuclear transfer of the agonist or antagonist-bound androgen receptor is mediated by HSP90 [49]. It was observed that [11C]NMS-E973 shows HSP90-specific binding to both PC3 and LNCaP tumour sections, independent of their reliance on the androgen receptor.
It has to be noted that most HSP90 inhibitors are pan-selective, meaning that they exert activity against the different HSP90 isoforms. PU-H71 has been determined to have a higher affinity, expressed as IC50, towards Grp94 (30 nM) compared to HSP90α (43 nM) [50]. Furthermore, Grp94 is known to be highly expressed in different kinds of cancers [51]. To discriminate [11C]NMS-E973 binding to Grp94 and HSP90α, PU-WS13, a purine-based HSP90 inhibitor with highest potency towards Grp94 (EC50 220 nM) and 140-fold selectivity over HSP90α [52] was used as a blocking compound in an in vitro autoradiography experiment (Figure 6). No significant blocking in any of the studied tumour tissues (PC3, B16.F10, muscle) was observed. This further emphasizes the tracer specificity for HSP90. Similar to the cell binding study, the HSP70 inhibitor Pifithrin-µ was unable to challenge [11C]NMS-E973 in any of the investigated tissue sections.
We found intriguing differences when comparing ex vivo autoradiography (resulting from in vivo physiological tracer distribution) with in vitro autoradiography (tracer distribution on post mortem tissues) of adjacent sections of identical muscle, myocardium and tumour tissue samples. Higher tracer concentrations were observed at the edges of the tissue sections in in vitro autoradiography, whereas a more homogenous uptake was observed for ex vivo autoradiography. In addition, the tracer concentration was lower for skeletal muscle compared to myocardium and tumour tissue in ex vivo autoradiography experiments (in line with biodistribution results), whereas tracer concentration was comparable for the three studied tissues in the in vitro autoradiography experiments. We hypothesize that HSP90 expression and/or affinity changes due to processes associated with sacrificing the animal causing cell stress and cell death lead to the observed differences between ex vivo and in vitro autoradiography [53], but further studies will be required to examine this hypothesis.
Ex vivo biodistribution studies conducted on two rodent species (Tables S2-S3), indicated preferential hepatobiliary excretion of [11C]NMS-E973. This excretion can limit the detection of tumours in the abdominal region. Efforts can be made to develop more polar HSP90 tracers that are mainly excreted via the renal tract. The plasma concentration of the tracer decreased steadily over time. The 2/60 min ratio of blood activity was similar for rats and mice; however, rat blood radioactivity levels (%ID) were twice as high as those of mice. More than 70% of radioactivity in mouse plasma corresponded to intact tracer at 30 min p.i. (Figure S8).
Biodistribution experiments on B16.F10 melanoma mice confirmed HSP90-specific tumour binding as it could also be blocked by pretreatment with either PU-H71 or Ganetespib. In addition, we also observed a blocking effect in blood and blood-rich organs (lungs, spleen), indicating HSP90-specific binding that was not observed in healthy mice. This interesting observation may be related to tumour shedding of HSP90 [54-55].
The literature reports ubiquitous and high (2% of total proteins) expression of HSP90 in all cells. Based on an estimated average protein mass per unit of cell volume of 0.2 g/mL, we calculated the total mass of protein in a 2000 µm3 cell to be 4×10⁻¹⁰ g [56]. As HSP90 comprises 2% of this mass, an estimated total density of receptors (Bmax) of 222 pmol/mg protein for HSP90 in unstressed conditions could be calculated, corresponding to 30 µM per tissue. In comparison, the well-known dopamine 2 receptor (D2R), which is efficiently visualized by [11C]Raclopride PET [57,58], has a Bmax in the striatum ranging from 290-360 fmol/mg protein. It is hence remarkable that generally low uptake of [11C]NMS-E973 is observed in in vivo healthy tissue. More so in an in vivo biodistribution study on healthy NMRI-mice, blocking with NMS-E973 or PU-H71 did not result in significant tracer concentration decrease in healthy tissues (Table S4).
Rats were included in the biodistribution studies to study the reported brain permeability of [11C]NMS-E973. However, in our study, [11C]NMS-E973 showed only limited, if any, brain uptake of the tracer (<0.1 %ID) (Tables S2-S3) in 2 rodent species. It has been postulated that passive diffusion through the BBB occurs for compounds with a tPSA value under 90 Å2 and a logD value ranging from 2.0 to 3.5 [59]. Calculated tPSA and LogD values for NMS-E973 (151.20 Å2 and 1.04) are far from the assumed optimal PSA and logD values that allow significant brain penetration. Moreover, µPET images (Figure 8A, D) confirm the low brain uptake of [11C]NMS-E973. Nevertheless NMS-E973 may still have an effect on intracranial tumours, such as glioma, as in these conditions the BBB may be damaged.
Tumour targeting of [11C]NMS-E973 was clearly established in µPET studies on C57BL/6 mice inoculated with B16.F10 melanoma cells. HSP90 binding specificity of [11C]NMS-E973 was confirmed in vivo by pretreatment studies with PU-H71 and Ganetespib. [11C]NMS-E973 tumour binding was significantly reduced throughout the whole scan period. When comparing [11C]NMS-E973 and [18F]FDG µPET, a similar intratumoural distribution of the tracer was observed.
The reason(s) for the specific tumour targeting of [11C]NMS-E973 still remain to be determined. Malignant cells have significantly increased HSP90 levels but an increased affinity or relocalisation of HSP90 from intracellular to more accessible surface-bound sites could also contribute to the increased tracer concentration in the tumour. Recent studies also sugggest a role of the epichaperome, a network of different HSPs and their co-chaperones, as an important factor in cancer dynamics. The interplay and connectivity between HSPs and their co-chaperones determines the resistance to and effectiveness of HSP90 inhibitors [42].
Our results suggest that [11C]NMS-E973 PET enables quantification of HSP90 expression in tumours, possibly identifying patients that may respond to treatment with HSP90 inhibitors. Furthermore, HSP90-PET with [11C]NMS-E973 can potentially be used to quantify HSP90 occupancy in tumours after treatment with HSP90 inhibitors, contributing to rational optimisation of dose regimens for treatment of patients with HSP90 inhibitors. However, to fully optimize its use as an occupancy measuring tool, translation to the clinic will be required. The limitations of this study are that visualisation of HSP90 will be difficult in the abdominal region due to hepatobiliary and renal clearance of [11C]NMS-E973. Further, the tracer shows relatively low SUV values in the tumour, but this uptake was highly HSP90 specific. Although carbon-11 has its advantages as its enables multiple injections each day, its half-life of 20.38 min limits its use in studies where steady-state conditions are required. A switch to a fluorine-18 compound can resolve this matter.
Conclusion
We efficiently radiolabelled and evaluated [11C]NMS-E973 in vitro and in vivo as an HSP90-specific PET tracer. Evaluation of NMS-E973 confirmed its HSP90 inhibitory activity. Cell binding studies in B16.F10 melanoma cells showed specific binding of [11C]NMS-E973. Biodistribution studies showed low brain uptake and preferential hepatobiliary clearance, and an absence of observable HSP90-specific binding in healthy tissues. However, clear tumour binding that was blocked by pretreatment with PU-H71 and Ganetespib was observed in in vitro and in vivo experiments. These pre-clinical results indicate that [11C]NMS-E973 PET can be used to quantify HSP90 expression in vivo in tumours and may allow quantification of target occupancy after treatment with HSP90-targeted drugs.
Abbreviations
%ID: percentage of injected dose; ANOVA: analysis of variance; ATCC: American type culture collection; BBB: blood-brain barrier; Bmax: maximum number of binding sites; BSA: bovine serum albumin; C-domain: C-terminus domain; CDK1: cyclin-dependent kinase 1; CPM: counts per minute; D2R: dopamine 2 receptor; DC50: half maximal depolymerisation concentration; DLU: digital light units; DMEM: dulbecco's modified eagle's medium; EGFR: epidermal growth factor receptor; ECM: extracellular matrix; eHSP90: extracellular heat shock protein 90; EOS: end of synthesis; ER: endoplasmic reticulum; ESI: electrospray ionisation; Grp94: 94 kDa glucose regulated protein; HIF-1α: hypoxia-inducible factor-1α; HPLC: high pressure/performance liquid chromatography; HSF1: heat shock factor-1; HSP: heat shock protein; HSP90α: HSP90AA1; HSP90β: HSP90AB1; HSR: heat shock response; I.P.: intraperitoneal; I.V.: intravenous; KD: equilibrium dissociation constant; M-domain: middle domain; N-domain: N-terminal domain; NMRI: naval medical research institute; p.i.: post injection; PBS: phosphate buffered saline; PET: positron emission tomography; PUMA: p53 upregulated modulator of apoptosis; RCP: radiochemical purity; ROI: region of interest; RP-HPLC: reversed phase high pressure chromatography; SUV: standardized uptake value; TAC: time activity curves; TGF-α: tumour growth factor α; TOF-HRMS: time-of-flight high-resolution mass spectrometer; TRAP1: tumour necrosis factor receptor associated protein 1; TBS: tris buffered saline; tPSA: total polar surface area; [18F]FDG: 2-[18F]fluoro-2-deoxy-D-glucose.
Supplementary Material
Supplementary methods, figures and tables.
Acknowledgements
The authors would like to thank Julie Cornelis, Ivan Sannen, Pieter Haspeslagh, Jeroen Peetroons and Jana Hemelaers from the Laboratory for Radiopharmaceutical Research and Ann Van Santvoort and Tine Buelens from the Department of Nuclear Medicine. The Switch Laboratory was supported by grants from the European Research Council under the European Union's Horizon 2020 Framework Programme ERC Grant agreement 647458 (MANGO) to JS, the Flanders institute for biotechnology (VIB), the University of Leuven (“Industrieel Onderzoeksfonds”), the Flanders Research Foundation (FWO), the Flanders Agency for innovation by Science and Technology (IWT, SBO grant 60839) and the Federal Office for Scientific Affairs of Belgium (Belspo), IUAP, grant number P7/16. EN was supported by a PhD fellowship from the IWT. The Laboratory for Radiopharmaceutical Research was supported by grants from the Flanders Agency for innovation by Science and Technology (IWT, SBO grant 130065) and the Programme funding IMIR (KU Leuven).
Author contributions
KV developed and performed radiosynthesis, organic synthesis and experiments with radioactive compounds. EN performed cellular and biochemical analyses. MA performed organic synthesis, analysis and characterization of synthesized compounds. BA and SC aided in performing experiments with radioactivity. MS and KL provided tumour-inoculated mice. KV, EN, MA, GB, JS and FR designed the study, performed statistical analysis or writing and revision of the manuscript.
Competing Interests
The authors have declared that no competing interest exists.
References
1. Jee H. Size dependent classification of heat shock proteins: a mini-review. J Exerc Rehabil. 2016;12:255-259
2. Echeverría PC, Mazaira G, Erlejman A. et al. Nuclear import of the glucocorticoid receptor-HSP90 complex through the nuclear pore complex is mediated by its interaction with Nup62 and importin beta. Mol Cell Biol. 2009;29:4788-4797
3. Chen B, Piel WH, Gui L, Bruford E, Monteiro A. The HSP90 family of genes in the human genome: Insights into their divergence and evolution. Genomics. 2005;86:627-637
4. Whitesell L, Lindquist SL. HSP90 and the chaperoning of cancer. Nat Rev Cancer. 2005;5:761-772
5. Erlejman AG, Lagadari M, Toneatto J, Piwien-Pilipuk G, Galigniana MD. Regulatory role of the 90-kDa-heat-shock protein (HSP90) and associated factors on gene expression. Biochim Biophys Acta Gene Regul Mech. 2014;1839:71-87
6. Schopf FH, Biebl MM. Buchner J. The HSP90 chaperone machinery. Mol cell Biol. 2017;18:345-360
7. Sidera K, Patsavoudi E. Extracellular HSP90, conquering the cell surface. Cell Cycle. 2008;7:1564-1568
8. Barrott JJ, Haystead TJ. HSP90, an unlikely ally in the war on cancer. FEBS J. 2013;280:1381-1396
9. Sidera K, Patsavoudi E. HSP90 inhibitors: current development and potential in cancer therapy. Recent Pat Anticancer Drug Discov. 2014;9:1-20
10. Kawaguchi Y, Kovacs JJ, McLaurin A, Vance JM, Ito A, Yao TP. The deacetylase HDAC6 regulates aggresome formation and cell viability in response to misfolded protein stress. Cell. 2003;115:727-738
11. Trepel J, Mollapour M, Giaccone G, Neckers L. Targeting the dynamic HSP90 complex in cancer. Nat Rev Cancer. 2010;10:537-549
12. Kamal A, Thao L, Sensintaffar J. et al. A high-affinity conformation of HSP90 confers tumour selectivity on HSP90 inhibitors. Nature. 2003;425:407-410
13. Eustace BK, Jay DG. Extracellular roles for the molecular chaperone, HSP90. Cell Cycle. 2004;3:1098-1100
14. Becker B, Multhoff G, Farkas B. et al. Induction of HSP90 protein expression in malignant melanomas and melanoma metastases. Exp Dermatol. 2004;13:27-32
15. Sidera K, Gaitanou M, Stellas D, Matsas R, Patsavoudi E. A critical role for HSP90 in cancer cell invasion involves interaction with the extracellular domain of HER-2. J Biol Chem. 2008;283:2031-2041
16. Li W, Sahu D, Tsen F. Secreted heat shock protein-90 (HSP90) in wound healing and cancer. Biochim Biophys Acta Mol Cell Res. 2012;1823:730-741
17. Neckers L, Trepel JB. Stressing the development of small molecules targeting HSP90. Clin Cancer Res. 2014;20:275-277
18. Piper P, Millson S. Mechanisms of resistance to HSP90 inhibitor drugs: A complex mosaic emerges. Pharmaceuticals. 2011;4:1400-1422
19. Butler LM, Ferraldeschi R, Armstrong HK, Centenera MM. Maximizing the therapeutic potential of HSP90 inhibitors. Mol Cancer Res. 2015;13:1445-51
20. Tsutsumi S, Scroggins B, Koga F. et al. A small molecule cell-impermeant HSP90 antagonist inhibits tumor cell motility and invasion. Oncogene. 2008;27:2478-2487
21. Crowe LB, Hughes PF, Alcorta D. et al. A fluorescent HSP90 probe demonstrates the unique association between extracellular HSP90 and malignancy in vivo. ACS Chem Biol. 2017;12:1047-1055
22. Barrott JJ, Hughes PF, Osada T. et al. Optical and radioiodinated tethered HSP90 inhibitors reveal selective internalization of ectopic HSP90 in malignant breast tumor cells. Chem Biol. 2013;20:1187-1197
23. Taldone T, Zatorska D, Ochiana SO. et al. Radiosynthesis of the iodine-124 labeled HSP90 inhibitor PU-H71. J Label Compd Radiopharm. 2016;59:129-132
24. Rodina A, Wang T, Yan P. et al. The epichaperome is an integrated chaperome network that facilitates tumour survival. Nature. 2016;538:397-401
25. Wang X, Zhang J, Wu H, Li Y, Conti PS, Chen K. PET imaging of HSP90 expression in pancreatic cancer using a new 64Cu-labeled dimeric Sansalvamide A decapeptide. Amino Acids. 2018;50:897-907
26. Brasca MG, Mantegani S, Amboldi N. et al. Discovery of NMS-E973 as novel, selective and potent inhibitor of heat shock protein 90 (HSP90). Bioorganic Med Chem. 2013;21:7047-7063
27. Fogliatto G, Gianellini L, Brasca MG. et al. NMS-E973, a novel synthetic inhibitor of HSP90 with activity against multiple models of drug resistance to targeted agents, including intracranial metastases. Clin Cancer Res. 2013;19:3520-3532
28. Sun L, Yang S, Chi G, Jin X. HSP90 inhibitor NMS-E973 exerts the anticancer effect against glioblastoma via induction of PUMA-mediated apoptosis. Onco Targets Ther. 2018;11:1583-1593
29. Horti G, Fan H, Kuwabara H. et al. 11C-JHU75528: a radiotracer for PET imaging of CB1 cannabinoid receptors. J Nucl Med. 2006;47:1689-1696
30. Burns HD, Van Laere K, Sanabria-Bohórquez S. et al. [18F]MK-9470, a positron emission tomography (PET) tracer for in vivo human PET brain imaging of the cannabinoid-1 receptor. Proc Natl Acad Sci U S A. 2007;104:9800-9805
31. Frizberg AR, Whitney WP, Kuni CC. Biodistribution and renal excretion of 99mTC-N, N'bis-(mercaptoacetamido) ethylenediamine. Effect of renal tubular transport inhibitors. Int J Nucl Med Biol. 1982;9:79-82
32. Eder M, Schäfer M, Bauder-Wüst U. et al. 68Ga-complex lipophilicity and the targeting property of a urea-based PSMA inhibitor for PET imaging. Bioconjugate Chem. 2012;23:688-697
33. Li W1, Tsen F, Sahu D, Bhatia A, Chen M, Multhoff G. Extracellular HSP90 (eHSP90) as the actual target in clinical trials: Intentionally or unintentionally. Int Rev Cell Mol Biol. 2013;303:203-235
34. Wang H, Lu M, Yao M, Zhu W. Effects of treatment with an HSP90 inhibitor in tumors based on 15 phase II clinical trials. Mol Clin Oncol. 2016;5:326-334
35. Wagner A, Chugh R, Rosen L. et al. A phase I study of the HSP90 inhibitor Retaspimycin hydrochloride (IPI-504) in patients with gastrointestinal stromal tumors or soft-tissue sarcomas. Clin Cancer Res. 2013;19:6020-6029
36. Dickson MA, Okuno SH, Keohan ML. et al. Phase II study of the HSP90-inhibitor BIIB021 in gastrointestinal stromal tumors. Ann Oncol. 2013;24:252-257
37. Spiegelberg D, Mortensen AC, Selvaraju RK, Eriksson O, Stenerlöw B, Nestor M. Molecular imaging of EGFR and CD44v6 for prediction and response monitoring of HSP90 inhibition in an in vivo squamous cell carcinoma model. Eur J Nucl Med Mol Imaging. 2016;43:974-982
38. Gaykema S, Schroeder C, Vitfell-Rasmussen J. et al. 89Zr-trastuzumab and 89Zr-bevacizumab PET to evaluate the effect of the HSP90 inhibitor NVP-AUY922 in metastatic breast cancer patients. Clin Cancer Res. 2014;20:3945-3954
39. Hance MW, Nolan KD, Isaacs JS. The double-edged sword: Conserved functions of extracellular HSP90 in wound healing and cancer. Cancers. 2014;6:1065-1097
40. Yang C, Robbins PD. The roles of tumor-derived exosomes in cancer pathogenesis. Clin Dev Immunol. 2011;2011:842849
41. Buchner J, Li J. Structure, function and regulation of the HSP90 machinery. Biomed J. 2013;36:106-117
42. Joshi S, Wang T, Araujo TLS, Sharma S, Brodsky JL. Adapting to stress - chaperome networks in cancer. Nat Rev Cancer. 2018;18:562-575
43. Kaiser M, Kühnl A, Reins J. et al. Antileukemic activity of the HSP70 inhibitor Pifithrin-μ in acute leukemia. Blood Cancer J. 2011;1:e28
44. Thirstrup K, Sotty F, Montezinho L. et al. Linking HSP90 target occupancy to HSP70 induction and efficacy in mouse brain. Pharmacol Res. 2016;104:197-205
45. Zhang L, Fok JJL, Mirabella F. et al. HSP70 inhibition induces myeloma cell death via the intracellular accumulation of immunoglobulin and the generation of proteotoxic stress. Cancer Lett. 2013;339:49-59
46. Davenport EL, Zeisig A, Aronson LI. et al. Targeting heat shock protein 72 enhances HSP90 inhibitor-induced apoptosis in myeloma. Leukemia. 2010;24:1804-1807
47. Sekihara K, Harashima N, Tongu M. et al. Pifithrin-μ, an inhibitor of heat-shock protein 70, can increase the antitumor effects of hyperthermia against human prostate cancer cells. PLoS One. 2013;8:1-11
48. Tai S, Sun Y, Squires JM. et al. PC3 is a cell line characteristic of prostatic small cell carcinoma. Prostate. 2011;71:1668-1679
49. Georget V, Térouanne B, Nicolas J, Sultan C. Mechanism of antiandrogen action: Key role of HSP90 in conformational change and transcriptional activity of the androgen receptor. Biochemistry. 2002;41:11824-11831
50. Patel HJ, Patel PD, Ochiana SO. et al. Structure-activity relationship in a purine-scaffold compound series with selectivity for the endoplasmic reticulum HSP90 paralog Grp94. J Med Chem. 2015;58:3922-3943
51. Khandelwal A, Crowley VM, Blagg BSJ. Resorcinol-based Grp94-selective inhibitors. ACS Med Chem Lett. 2017;8:1013-1018
52. Patel PD, Yan P, Seidler PM, Patel HJ, Sun W, Yang C. et al. Paralog-selective HSP90 inhibitors define tumor-specific regulation of HER2. Nat Chem Biol. 2013;9:677-684
53. Saito K, Dai Y, Ohtsuka K. Enhanced expression of heat shock proteins in gradually dying cells and their release from necrotically dead cells. Exp cell res. 2005;310:229-236
54. Zhang G, Liu Z, Ding H. et al. Tumor induces muscle wasting in mice through releasing extracellular Hsp70 and Hsp90. Nat Commun. 2017;8:589
55. Grammatikakis N, Vultur A, Ramana C. et al. The role of HSP90N, a new member of the Hsp90 family, in signal transduction and neoplastic transformation. J Biol Chem. 2002;277:8312-8320
56. Milo R. What is the total number of protein molecules per cell volume? A call to rethink some published values. BioEssays. 2013;35:1050-1055
57. Hietala J, Någren K, Lehikoinen P, Ruotsalainen U, Syvälahti E. Measurement of striatal D2 dopamine receptor density and affinity with [11C]Raclopride in vivo: a test-retest analysis. J Cereb Blood Flow Metab. 1999;19:210-217
58. Ikoma Y, Watabe H, Hayashi T. et al. Measurement of density and affinity for dopamine D 2 receptors by a single positron emission tomography scan with multiple injections of [11C]Raclopride. J Cereb Blood Flow Metab. 2010;30:663-673
59. Pike VW. PET radiotracers: crossing the blood-brain barrier and surviving metabolism. Trends Pharmacol Sci. 2009;30:431-440
Author contact
![]() Corresponding author: Dr. Guy Bormans. Email: guy.bormansbe
Corresponding author: Dr. Guy Bormans. Email: guy.bormansbe