Impact Factor
- Issue 14; 2026
- Issue 13; 2026
- Issue 12; 2026
- Issue 11; 2026
- Issue 10; 2026
- Volume 16; 2026
- Advance Articles
- Past Issues
- Cover Images
- Cover Suggestion
- Index & Coverage
- Special Issues
Introduction
Methods
Results
Discussion
Conclusions
Abbreviations
Supplementary Material
Acknowledgements
References
International Journal of Biological Sciences
International Journal of Medical Sciences
 Global reach, higher impact

Theranostics 2019; 9(2):540-553. doi:10.7150/thno.28374 This issue Cite
Research Paper
Comprehensive characterization of the mutational landscape in multiple myeloma cell lines reveals potential drivers and pathways associated with tumor progression and drug resistance
Veronika Vikova1, Michel Jourdan1, Nicolas Robert2, Guilhem Requirand2, Stéphanie Boireau2, Angélique Bruyer1, Laure Vincent4, Guillaume Cartron3,4,5, Bernard Klein1,2,3, Olivier Elemento6, Alboukadel Kassambara1,2, ![]() , Jérôme Moreaux1,2,3,
, Jérôme Moreaux1,2,3, ![]()
1. IGH, CNRS, Univ Montpellier, France
2. CHU Montpellier, Department of Biological Hematology, Montpellier, France
3. Univ Montpellier, UFR de Médecine, Montpellier, France
4. CHU Montpellier, Department of Clinical Hematology, Montpellier, France.
5. Univ Montpellier, UMR CNRS 5235, Montpellier, France.
6. Englander Institute for Precision Medicine, Institute for Computational Biomedicine, Weill Cornell Medical College, 1305 York Avenue, New York, NY 10021, USA;
*These authors contributed equally to this work and share last authorship.
Received 2018-7-8; Accepted 2018-12-12; Published 2019-1-1
Abstract

Human multiple myeloma tumor cell lines (HMCLs) have been a cornerstone of research in multiple myeloma (MM) and have helped to shape our understanding of molecular processes that drive tumor progression. A comprehensive characterization of genomic mutations in HMCLs will provide a basis for choosing relevant cell line models to study a particular aspect of myeloma biology, or to screen for an antagonist of certain cancer pathways.
Methods: We performed whole exome sequencing on a large cohort of 30 HMCLs, representative of a large molecular heterogeneity of MM, and 8 control samples (epstein-barr virus (EBV)-immortalized B-cells obtained from 8 different patients). We evaluated the sensitivity of HMCLs to ten drugs.
Results: We identified a high confidence list of 236 protein-coding genes with mutations affecting the structure of the encoded protein. Among the most frequently mutated genes, there were known MM drivers, such as TP53, KRAS, NRAS, ATM and FAM46C, as well as novel mutated genes, including CNOT3, KMT2D, MSH3 and PMS1. We next generated a comprehensive map of altered key pathways in HMCLs. These include cell growth pathways (MAPK, JAK-STAT, PI(3)K-AKT and TP53 / cell cycle pathway), DNA repair pathway and chromatin modifiers. Importantly, our analysis highlighted a significant association between the mutation of several genes and the response to conventional drugs used in MM as well as targeted inhibitors.
Conclusion: Taken together, this first comprehensive exome-wide analysis of the mutational landscape in HMCLs provides unique resources for further studies and identifies novel genes potentially associated with MM pathophysiology, some of which may be targets for future therapeutic intervention.
Keywords: human multiple myeloma cell lines, exome sequencing, mutational landscape
Introduction
Multiple myeloma (MM) is the second most widespread hematological cancer; it is characterized by the accumulation of malignant plasma cells within the bone marrow.
Despite the survival improvement brought by current treatments, the majority of patients relapses and succumbs to the disease with a median survival of 6 years [1].
MM is a highly heterogeneous disease at genetic and clinical levels [2-4]. Recent studies, using next-generation sequencing, have revealed the complex mutational landscape of MM patients as well as a considerable intraclonal heterogeneity in association with drug resistance and tumor progression [5-7]. Given these observations, the improvement of MM treatment might come from personalized medicine, taking into account the patients' genetic background [6].
A major difficulty in advancing the understanding of drug resistance in MM is the availability of primary tumor cells. MM cells can survive for several days of culture, but cannot be expanded in vitro for the vast majority of patients. This represents a serious limitation for a meaningful biological study on the resistance mechanisms. An alternative strategy is to use MM cell lines as an unlimited source of tumor cells.
Human multiple myeloma cell lines (HMCLs) have been widely used for the understanding of MM biology, the identification and validation of target genes, and the screening of potential anti-myeloma drugs. However, biological studies in MM are often performed with a restricted number of HMCLs that are poorly characterized at the molecular level and do not reflect the heterogeneity of MM patients. In the past few years, we have derived a large cohort of patient-derived HMCLs that remain dependent on the addition of exogeneous MM growth factors, thereby reflecting primary tumor conditions [8]. Using these myeloma cell lines, we recently described that they recapitulate the molecular heterogeneity found in MM primary tumors by analyzing the gene expression profile [8]. However, the mutational landscape of human myeloma cell lines has never been described.
A comprehensive characterization of genomic mutations in myeloma cell lines would advance our understanding of myeloma pathophysiology and could also provide a basis for choosing relevant cell line models to study a particular aspect of myeloma biology, or to screen for an antagonist of specific cancer pathways.
In this study, we present, for the first time, the mutational landscape of human myeloma cell lines. We conducted whole-exome sequencing (WES) on 30 HMCLs, representative of the molecular heterogeneity of MM, and 8 control samples (EBV-immortalized B-cells from 8 of the same patients). We identified a high confidence list of 236 protein-coding genes with mutations likely affecting the structure of the encoded protein. These genes include well-known MM drivers such as the tumor suppressor TP53, the MAPK pathway (KRAS, NRAS and BRAF), the ataxia-telangiectasia mutated (ATM), cyclin D1 (CCND1), the RB transcriptional corepressor (RB1) and the family with sequence similarity 46 Member C (FAM46C) [6,9]. Additionally, we identified novel mutated genes involved in key pathways, including JAK-STAT, PI(3)K-AKT, DNA repair and chromatin modifier pathways. Interestingly, we found that mutations in KRAS, FAM46C, KMT2D, PMS1 and USP6 were significantly associated with drug resistance.
Methods
Samples
XGs human myeloma cell lines (HMCLs) were obtained as previously described [8]. AMO-1, LP1, L363, OPM2, MOLP2, MOLP8, Lopra and SKMM2 were purchased from DSMZ (Braunsweig, Germany) and RPMI8226 from ATCC (American Tissue Culture Collection, Rockville, MD, USA). JJN3 was kindly provided by Dr. Van Riet (Bruxelles, Belgium) and MM1S by Dr. S. Rosen (Chicago, USA). HMCLs were authenticated according to their short tandem repeat profiling and their gene expression profiling using Affymetrix U133 plus 2.0 microarrays deposited in the ArrayExpress public database under accession numbers E-TABM-937 and E-TABM-1088. HMCLs characteristics, obtained from previously published analysis results [8], are available in Table S1. EBV-immortalized B-cells from 8 different patients have been used as control cells. The patients are those from whom the XG1, XG3, XG5, XG10, XG13, XG14, XG16 and XG19 cell lines were generated.
WES
WES was performed on 30 HMCLs and 8 control samples (EBV-immortalized B-cells from 8 of the same patients). We also performed and analyzed the WES of purified primary MM cells from 59 patients in order to compare mutated genes between HMCLs and primary tumor cells. Forty-three newly diagnosed patients and patients at relapse (N=16) were treated by high-dose chemotherapy plus autograft. Lines of treatments of patients at relapse were described in Table S2. Bone marrow samples were collected after patients' written informed consent in accordance with the Declaration of Helsinki and institutional research board approval from Montpellier University hospital (DC-2008-417).
The WES library preparation was done with 1000 ng of input DNA. Sequences of exome were enriched using SureSelectxt kit and SureSelectxt All Exons v5 library (Agilent Technologies, Santa Clara, California, USA). Paired-end exome sequencing was performed on the enriched exome sequences using the illumina NextSeq500 sequencing instrument (Helixio, Clermont-Ferrand, France), generating 75 bp paired-end reads with 100X average coverage per sample.
Analysis of single nucleotide variants
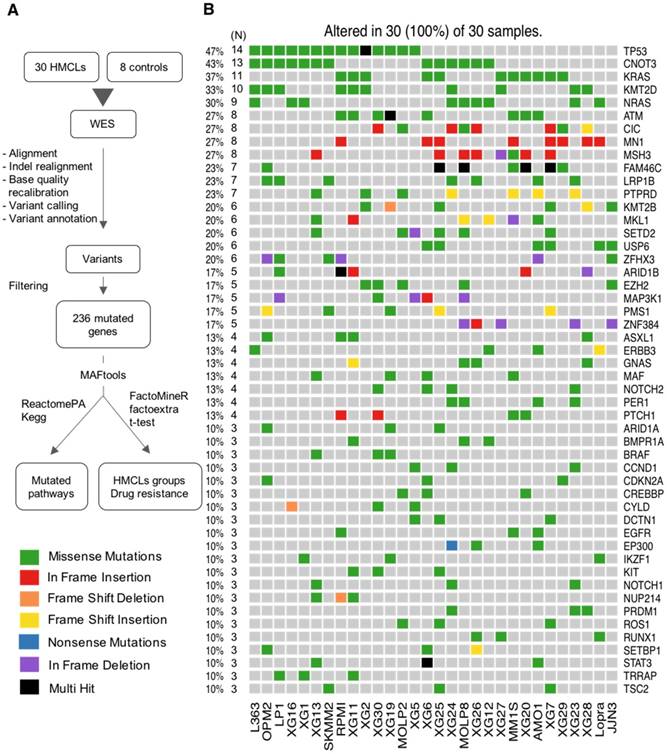
The workflow of data analysis is illustrated in Figure 1A. Read pairs were mapped to the reference human hg19 genome using the Bowtie 2 aligner version 2.3.2 [10]. SAMTools version 1.5 [11] was used to convert Sequence Alignment Map (SAM) files to sorted Binary Alignment Map (BAM) files. Indel Realignment and base quality recalibration steps were completed with GATK 3.8-1 [12]. BCFtools version 1.5 [11] was utilized to detect variants from the BAM file and outputs into a Variant Call Format (VCF) file. We used ANNOVAR version 2017Jul16 [13] to annotate the variants. Mutations were determined by applying a series of filters on the ANNOVAR output. Firstly, we filter out mutations present in control EBV (Epstein-Barr Virus) samples and in dbSNP database (version 138). Synonymous and intronic variants as well as mutations located in segmental duplications were removed, along with variants present in greater than 1% of the 1000 genome project [14] and/or Exome Sequencing Project (ESP6500). Secondly, we prioritize mutations by filtering them based on four deleterious predictors included in the ANNOVAR software (SIFT, PolyPhen2, FATHMM and LRT). Variants are considered for further analyses only if they are predicted deleterious by at least one of the deleterious predictors. Finally, we retain only mutations that were present in COSMIC [15] and/or OncoKB [16] databases. The MAF (Mutation Annotation File Format) file format was used to store the genomic mutations of the different cell lines in the same file. We used the maftools [17] R/Bioconductor package to summarize, analyze and visualize the MAF files. Copy Number Variations (CNV) and IgH translocations were determined by the CNV-seq method [18] and fluorescence in situ hybridization (FISH) [8,19], respectively. Significant mutual exclusive mutations were assessed with the maftools R package [17]. The subclonal heterogeneity was inferred by clustering variants according to their allele frequencies using maftools R package [17]. The subclonal heterogeneity could be inferred by clustering variants according to their allele frequencies [20,21]. inferHeterogeneity function uses density based finite or infinite (dirichlet process) mixture models, to cluster and classify variants into subclones [22,23]. The presence of different subclones are visualized using density plots of variant allele fraction VAF. Variants on copy number altered regions were excluded. Pathway enrichment analyses were performed using the R package ReactomePA [24] and Kegg database [25-27].
Analysis workflow and human myeloma cell lines (HMCLs) mutational landscape. (A) Exome sequencing data from MM cell lines and control samples EBV-immortalized B-cells were processed in three steps (alignment, variant calling and variant annotation). In order to find mutations, obtained variants were filtered according to four criteria described in the methods section. Mutations were prioritized using four deleterious predictors included in the ANNOVAR software (SIFT, PolyPhen2, FATHMM and LRT). Mutated genes present in COSMIC and/or OncoKB databases were kept for further analyses. Selected mutated genes were analyzed with the R package MAFtools. Pathway enrichment analysis was done with R package ReactomePA and Kegg database. HMCLs were classified into groups based on their mutational profile using the R packages FactoMineR and factoextra. (B) Oncoplot of the top 50 most frequently mutated genes in the HMCLs. Colored squares show mutated genes, while grey squares show non mutated genes. Each color represents a different type of mutations: missense (green), in frame insertion (red), frame shift deletion (orange), frame shift insertion (yellow), nonsense mutations (blue), in frame deletion (purple) and multi hit (black). Percentages above the heatmap represent mutation rate among all cell lines presenting at least one mutated gene of the tested gene list. N is the number of cell lines mutated for a given gene.
HMCLs response to drug treatment
HMCLs were cultured in RPMI-1640 medium (Gibco, Thermo Fisher Scientific, Waltham, Massachusetts, USA) supplemented with fetal bovine serum (FBS, Eurobio, Les Ulis, France) (10%) and Interleukin 6 (IL6, Peprotech, Rocky Hill, New Jersey, USA) for XG cell lines. We evaluated the sensitivity of the cell lines to ten drugs, including Bortezomib (Euromedex), Melphalan (HAC Pharma), Lenalidomide (Selleckchem), Pomalidomide (Selleckchem), IKK2 inhibitor (AS602868), CDK inhibitor (AT7519 CDK1/2/4/5/6/9i, Selleckchem), TSA (Trichostatin A, HDACi, Sigma), SAHA (Suberanilohydroxamic acid, HDACi, Selleckchem), Panabinostat (HDACi, Selleckchem) and Dexamethasone. For a given drug, HMCLs were treated with different concentrations. The IC50was determined at day 4 using the CellTiter-Glo assay (Promega, Madison, Wisconsin, USA), as previously described [28,29]. The data represent the mean ± standard deviation of three independent experiments that were carried out on sextuplet culture wells (Table S3). The subset of HMCLs used for analyses were characterized, for drug response, in previous studies [28,30-34] and selected according to the different molecular subgroups previously described by transcriptomic analyzes [8].
Statistical analyses
All statistical calculations were carried out using the R software (R Foundation for Statistical Computing, Vienna, Austria). The classification of HMCLs into multiple groups based on their mutation profile was done by unsupervised multiple correspondence analysis (MCA) and hierarchical clustering using the R packages FactoMineR [35] and factoextra [36]. Wilcoxon test was used to evaluate the significance of the association between mutated genes and response to treatment.
Results
Landscape of mutations in HMCLs
We performed WES on 30 HMCLs as well as on EBV-immortalized B-cells from 8 patients (used to derive 8 XGs cell lines), which are used as control cells. However, no cell line represents a hyperdiploid subgroup. Two cell lines, XG16 and XG27, are characterized by the absence of recurrent translocation. XG16 is characterized by chromothripsis, including a huge number of chromosomal rearrangements involving localized genomic regions; it is associated with poor outcome in MM [37].
First, we sought to identify exonic variants, non-synonymous variants and variants predicted to be deleterious, as these are the candidates for cancer pathogenesis and drug targets. We identified 9570 non-synonymous exonic mutations in the cell lines, as specified in the Methods section. These mutations involve a total number of 4743 unique genes. Next, we focused on mutations present in COSMIC and/or OncoKB databases, which contain previously reported, mutated genes in cancers or those having oncogenic functions. We identified a high confidence list of 236 protein coding genes with mutations affecting the structure of encoded protein (Table S4). In these genes, we detected 576 variants (range: 8 - 32; median: 19 per cell lines), including 468 point mutations and 108 insertions/deletions (INDELS). The point mutations include 459 missense and 9 nonsense mutations (Figure S1A-B). Ranking by mutation type indicates an excess of C > T transitions (Figure S1C).
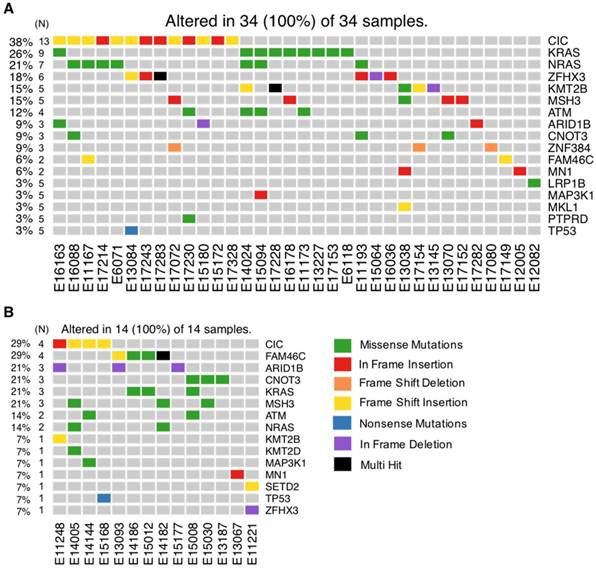
As recurrently mutated genes in HMCLs could represent novel candidate driver genes in MM progression, we investigated the most frequently mutated genes in HMCLs. The top 50 most frequently mutated genes are illustrated in Figure 1B. Twenty-two of the 50 genes were mutated in at least 5 out of the 30 cell lines (17%). These genes include TP53 (47%), CNOT3 (43%), KRAS (37%), KMT2D (33%), NRAS (30%), ATM, MN1 and MSH3 (27%), FAM46C (23%), KMT2B and SETD2 (20%), and EZH2 and PMS1 (17%). Importantly, some of these genes, TP53, KRAS, NRAS, ATM, and FAM46C, have been previously reported to be a target of recurrent mutations in newly diagnosed MM patients [6,9]. Notably, 86% of the frequently mutated genes in HMCLs were also found to be mutated in at least one primary tumor sample from myeloma patients (Figure 2A-B). One hundred and seventy-nine out of the 236 (76%) identified mutations were also described in primary MM cells from newly diagnosed patients in previous studies [6,9,38,39]. Among them, CIC, KRAS and NRAS were the most frequently mutated genes in patients and were identified at diagnosis (Figure 2A) and relapse (Figure 2B). Interestingly, FAM46C mutation was more frequent at relapse than at newly diagnosed patients, underlying its role as a myeloma driver gene. KMT2D and SETD2 were mutated only in patients at relapse (Figure 2A-B). Fourty percent of the mutations identified in patients present at a higher frequency in HMCLs, including TP53, CNOT3 and KMT2D mutations (Table S5). Moreover, variant allele frequency analysis of mutated genes revealed that HMCLs present one to four subclones, a range that was comparable to MM patients samples (Table S6A-B). This is consistent with previous results demonstrating that HMCLs derived in the presence of IL-6 display a molecular heterogeneity which overlaps one of MM patients [8].
Frequently mutated genes in HMCLs shared with MM patients at diagnosis and relapse. Exome-seq data of 59 MM patients including 43 newly diagnosed and 16 relapsing were processed with the analysis workflow. (A) Oncoplot of frequently mutated genes in HMCLs (N >= 5) shared with patients at diagnosis. (B) Oncoplot of frequently mutated genes in HMCLs (N ≥ 5) shared with patients at relapse. Eleven patients without detectable mutations were not included in the figure. N is the number of patients mutated for a given gene.
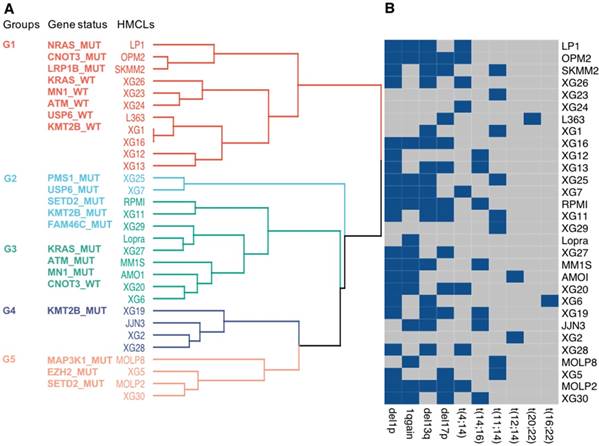
Further analyses were performed, using the 22 frequently mutated genes, to classify HMCLs into multiple groups based on their mutational profile. Unsupervised MCA followed by hierarchical clustering produced 2 major dendrogram branches with 5 subgroups (Figure 3A). Group 1 (LP1, OPM2, SKMM2, XG26, XG23, XG24, L363, XG1, XG16, XG12, and XG13) is mainly characterized by NRAS, CNOT3 and LRP1B mutated (MUT) and KRAS, MN1, ATM, USP6 and KMT2B wild type (WT) genes; group 2 (XG25 and XG7) is associated with mutations in PMS1, USP6, SETD2, KMT2B and FAM46C; group 3 (RPMI, XG11, XG29, Lopra, XG27, MM1S, AMO1, XG20, and XG6) is mainly characterized by the presence of mutations in KRAS, ATM and MN1 as well as CNOT3 WT; group 4 (XG19, JJN3, XG2, and XG28) is characterized by KMT2B mutations; cell lines of group 5 (MOLP8, XG5, MOLP2, and XG30) were associated with mutations in MAP3K1, EZH2 and SETD2 (Figure 3A). We investigated the link between the groups defined by the mutational profile and major MM cytogenetic abnormalities (Figure 3B). No significant association between the molecular heterogeneity defined by the mutational profile and the recurrent IgH translocations was identified (Figure 3B). Del1p, 1q gain, del13q and del17p were respectively found in 70%, 50%, 56% and 43% of HMCLs. Notably, 10 cell lines are characterized by TP53 mutation and del17p underlining HMCLs with TP53 bi-allelic event, known to be associated with a dramatic impact on survival in MM (Table S1) [40]. Furthermore, 5 cell lines are associated with del1p and FAM46C mutations double-hit events (Table S1) [40].
Classification of HMCLs into groups. (A) HMCLs were classified into multiple groups based on their mutation profile using multiple correspondence analysis followed by hierarchical clustering. The dendrogram shows five sub-groups with associated mutations. (B) HMCLs characteristics. Heatmap showing main CNV and translocations in MM for all cell lines. Blue squares, unlike grey squares, show the presence of the feature in the cell line.
Mutations in key pathways controlling cell growth
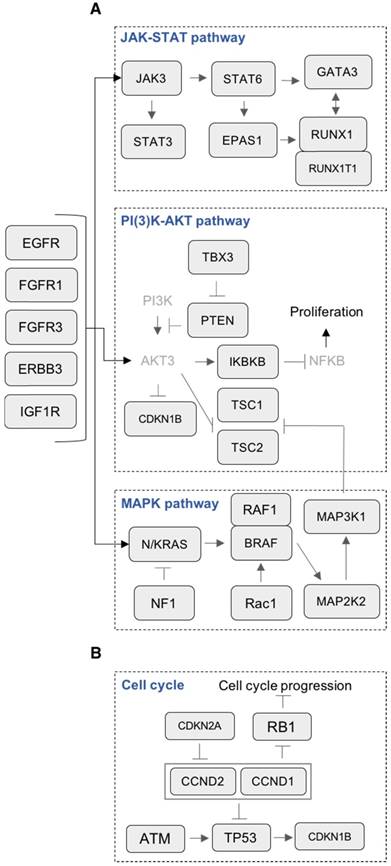
Many canonical pathways known to be involved in MM cell survival and proliferation were mutated, including JAK-STAT, PI(3)K-AKT and MAPK (Figure 4A). Mutation of genes involved in the MAPK pathway was the most prevalent (25/28 HMCLs, 89%). In this pathway, the most frequently mutated genes were KRAS (39%), NRAS (32%), MAP3K1 (18%) and BRAF (11%) (Figure 5A). In addition to these recurrently mutated genes, we found occasional mutations in other genes involved in MAPK signaling, including MAP2K2 (7%), RAC1 (4%), RAF1 (4%) and NF1 (4%). Mutations in KRAS and NRAS were mutually exclusive (Figure S2A). This suggests that mutations occurring simultaneously in these genes might be lethal for cancer cells or that the second mutation did not confer a selective advantage. According to that, KRAS and NRAS mutations could represent good candidates for therapies based on synthetic lethality. Mutations in the JAK-STAT pathway included STAT3 (11%), RUNX1 (11%), EPAS1 (7%), JAK3 (7 %) and STAT6 (4%) (Figure 4A and 5A). Mutated genes in the PI(3)K-AKT pathway include TSC2 (11%), TBX3 (7%), PTEN (7%), IKBKB (4%) and TSC1 (3%). Notably, several receptors activating these pathways were also mutated, including ERBB3 (14%), EGFR (11%) and IGF1R (11%) (Figure 4A and 5A). Additionally, mutations in p53/cell-cycle pathway were detected in 76% of the cell lines (Figure 4B and 5B). The most recurrently mutated genes include TP53 (61%), ATM (35%), CCND1 (13%), CDKN2A (13%) and RB1 (9%). Importantly, mutations in CCND1, TP53 and ATM are associated with a negative impact on survival [38].
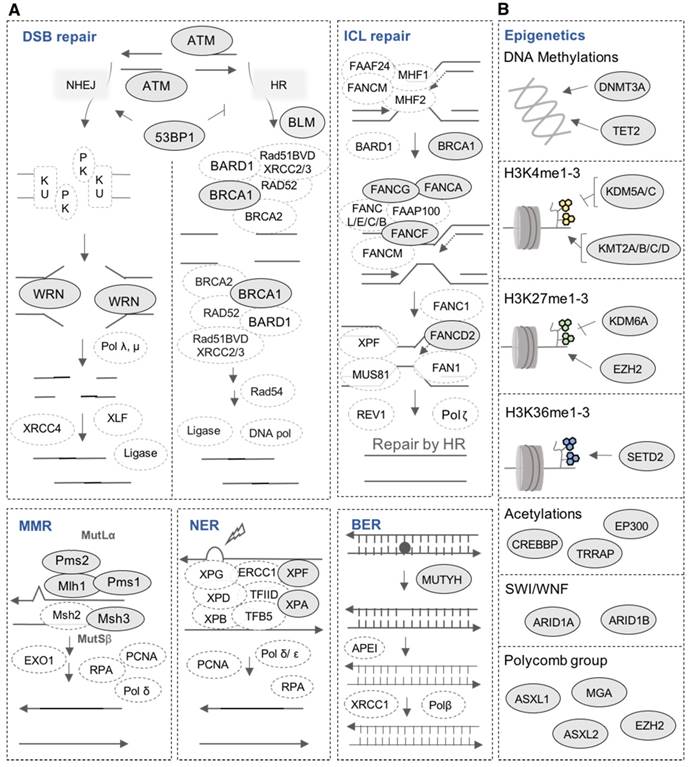
Mutations in key pathways controlling cell growth. (A) Representation of mutated genes in the JAK-STAT pathway, PI(3)K-AKT pathway, MAPK pathway and receptors. Mutated genes are shown in squares. Gene names in light grey color are non-mutated. (B) Representation of mutated genes involved in cell cycle.
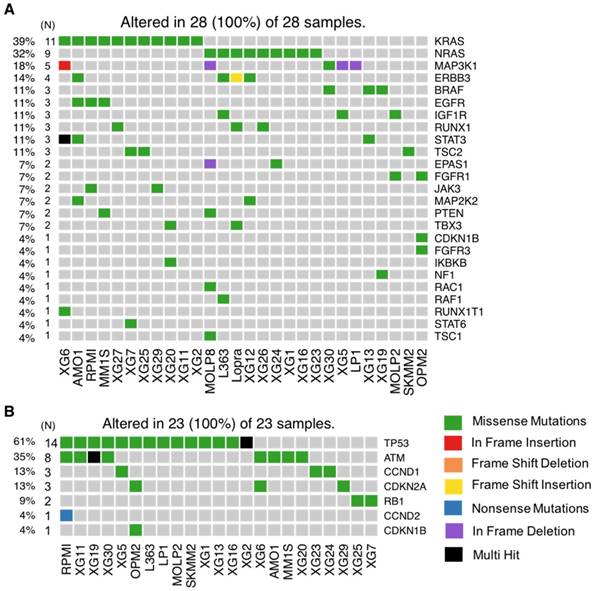
HMCLs mutational portrait for genes involved in cell growth. (A) Oncoplot of all proliferation-mutated genes. Twenty-eight cell lines out of 30 have at least one mutated gene belonging to the proliferation group. (B) Oncoplot of all cell cycle mutated genes. Twenty-three cell lines out of 30 have at least one mutated gene belonging to the cell cycle group.
Mutations in DNA repair pathways
DNA repair is one of the most important biological mechanisms involved in cancer development and drug resistance [41]. Depending on the type of DNA damage, specific DNA repair pathways are used to restore genetic information. Base excision repair (BER), nucleotide excision repair (NER) and mismatch repair (MMR) operate on nucleotide lesions occurring on single strands. For double-strand breaks, there are two major pathways, including non-homologous end-joining (NHEJ) and homologous recombination (HR). The alteration of DNA repair pathways can promote tumorigenesis and can induce drug resistance. Notably, multiple lines of evidence underlie the close link between DNA damage repair pathways and response to treatment in MM as well as patients' survival [38,42,43]. Our analysis revealed mutations in 16 DNA repair genes (Figure 6A and 7A). ATM is the most frequently mutated DNA repair gene (MR: 38%), mainly with missense mutations. Other frequently mutated DNA repair genes include MSH3 (38%; in frame insertion, frame deletion and missense), PMS1 (24%; missense and frame shift insertion) and FANCG (10%; missense). In addition to these recurrently mutated genes, we found occasional mutations in other key genes: TP53BP1, BLM, BRCA1, ERCC4, FANCA, FANCD2, FANCF, MLH1, MUTYH, PMS2, WRN and XPA (Figure 6A and 7A).
Mutations in DNA repair pathways and epigenetic factors. (A) Representation of mutated genes in the main DNA repair pathways. Mutated genes are shown in filled ellipses. (B) Representation of mutated epigenetic factors according to the type of epigenetic modifications they generate.
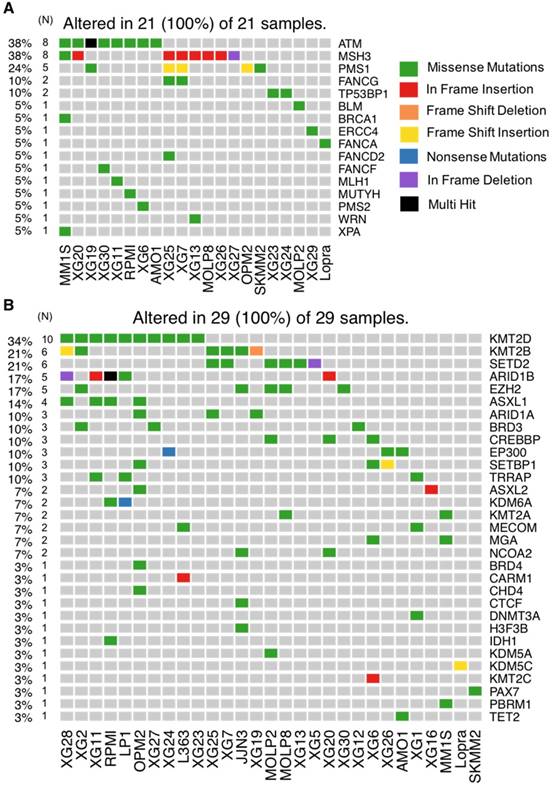
HMCLs mutational portrait for genes involved in DNA repair pathways and epigenetic factors. (A) Oncoplot of all DNA repair mutated genes. Twenty-one cell lines out of 30 have at least one mutated gene belonging to DNA repair pathway. (B) Oncoplot of all mutated epigenetic factors.
Mutations in epigenetic modifiers
Our analysis revealed mutations in several chromatin-modifying or chromatin-regulatory key genes, including histone demethylases (KDM5C, KDM5A, and KDM6A), histone methyltransferases (KMT2A/B/C/D, EZH2, and SETD2), genes in polycomb complex (ASXL1/L2 and MGA) and SWI/SNF chromatin remodeling complex (ARID1A and ARID1B). KMT2D, KMT2B, SETD2, ARID1B and EZH2 were the most frequently mutated genes with various types of alterations (Figure 6B and 7B).
Evaluating the association between HMCL mutation profile and response to treatment
We analyzed the relationship between the mutational status of HMCLs and response to conventional drugs in MM (Bortezomib, Melphalan, Dexamethasone and IMiDs) as well as targeted inhibitors (HDAC, CDK and IKK inhibitors). Three pan-HDAC inhibitors have been tested, including Panobinostat, SAHA and TSA.
Importantly, we found a significant (p-value < 0.05) association between several key mutated genes and resistance to drugs, including Panobinostat (FAM46C and KRAS), Dexamethasone (KMT2D), TSA (PMS1) and SAHA (USP6) (Figure 8A).
Association between mutated genes and drug response. HMCLs have been treated with a conventional drug used in MM (Dexamethasone, IMiDs) and targeted inhibitors (TSA, SAHA, and Panobinostat). For a given drug, bar plots are the IC50 of the drug according to the mutated genes. The IC50 values in cell lines were compared using Wilcoxon test. (A) Mutated gene associated with drug resistance. (B) Mutated genes associated with drug sensitivity. N is the number of cell lines tested with a given drug and involved in the statistical test. * : p-value < 0.05, ** : p-value < 0,01. Error bars represent mean standard deviation.
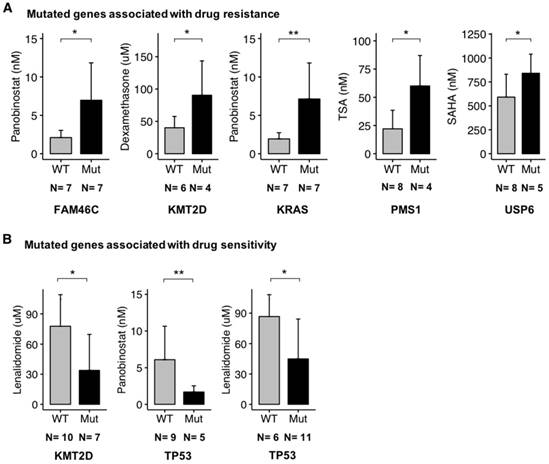
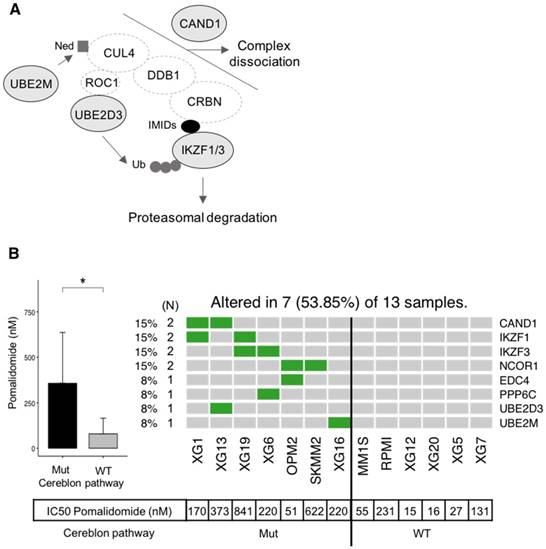
Additionally, other gene mutations were significantly (p-value < 0.05) related to drug sensitivity, including Lenalidomide (KMT2D and TP53) and Panobinostat (TP53) (Figure 8B). Recently, Sievers et al. described key proteins required for the anti-myeloma effects of IMiDs using a CRISPR-Cas9 screen [44]. Investigating mutations in the network involved in IMiDs activity, we identified mutations of CAND1, IKZF1, IKZF3, NCOR1, EDC4, PPP6C, UBE2D3 and UBE2M in our panel of cell lines (Figure 9A-B). Of major interest are HMCLs with a mutation of at least one of these genes that exhibited a significant, 5.4-fold higher resistance to pomalidomide (Figure 9B).
Association between mutated genes involved in the cereblon pathway and resistance to Pomalidomide. (A) Representation of mutated genes involved in IMiD-mediated CRL4CRBN activity. Mutated genes are shown in filled ellipses. (B) Seven HMCLs presenting missense mutations of genes involved in the cereblon pathway as well as six HMCLs without mutations (WT) have been treated with Pomalidomide. IC50 of Pomalidomide for each tested HMCL is shown in the table below the heatmap. IC50 of mutated (Mut) and wild type (WT) HMCLs were compared using Wilcoxon test. * : p-value < 0.05. Error bars represent mean standard deviation.
Taken together, this analysis has highlighted key genes with potential importance in drug resistance in MM. Further biological studies will be needed to understand the role of these genes in MM cell response to treatment.
Discussion
HMCLs are invaluable biomedical research tools that have been extensively used to understand MM physiopathology as well as for drug screening. In this study, we report, for the first time, the mutational landscape of the largest HMCLs cohort to date, which is a representative of the large molecular spectrum of the disease. We identified a list of 236 mutated protein-coding genes, including genes involved in critical pathways such as MAPK (KRAS, NRAS, MAP3K1 and BRAF) (Figure 4A and 5A), JAK-STAT (RUNX1, STAT3, EPAS1, JAK3 and STAT6) (Figure 4A and 5A), PI(3)K-AKT (PTEN, TSC1/2, TBX3 and IKBKB) (Figure 4A and 5A), TP53/cell cycle (TP53, CCND1, CDKN2A and RB1) (Figure 4B and 5B), DNA repair pathways (ATM, MSH3, PMS1 and FANCG) (Figure 6A and 7A) and chromatin modifiers (KMT2D, KMT2B, SETD2, ARID1B and EZH2) (Figure 6B and 7B), as well as in growth factor receptors (ERBB3, EGFR and IGF1R) (Figure 4A and 5A).
Importantly, among the most recurrently mutated genes in HMCLs, there were the previously identified genes in primary MM cells, including TP53 (47%), KRAS (37%), NRAS (30%), ATM (27%) and FAM46C (23%) (Figure 1B)[6,9]. Mutations in CCR4-NOT Transcription Complex Subunit 3 (CNOT3, 43%) and the Lysine Methyltransferase 2D (KMT2D, 33%) also appear at high frequencies, highlighting their potential importance in MM tumor progression.
CNOT3 is part of the CCR4-NOT complex, which is one of the major deadenylases in eukaryotes. Thus, CNOT3 plays an important role in mRNA stability regulation [45]. Moreover, CNOT3 has been shown to contribute in early B cell development through the regulation of p53 mRNA stability and Igh rearrangement [45]. In addition, CNOT3 has been identified as a tumor suppressor in T-ALL [46].
KMT2D has recently emerged as one of the most frequently mutated genes in a variety of cancers [47]. Additionally, KMT2D is involved in normal B cell differentiation; KMT2D deregulation promotes lymphomagenesis [48]. Mutations in KMT2D identified thus far point to its loss-of-function in pathogenesis and suggest its role as a tumor suppressor in various tissues. Previous studies support that KMT2D has distinct roles in neoplastic cells, as opposed to normal cells, and that inhibiting KMT2D may be a viable strategy for cancer therapeutics [47,48].
Other novel mutated genes with potential importance in MM biology include PTPRD (Protein Tyrosine Phosphatase, Receptor type D, 23%) (Figure 1B), LRP1B (LDL Receptor-Related Protein 1B, 23%) (Figure 1B), SETD2 (SET Domain Containing 2, 20%) (Figure 1B, 6B and 7B), EZH2 (Enhancer of Zeste 2 Polycomb Repressive Complex 2, 17%) (Figure 1B, 6B and 7B) and FANCG (FA Complementation Group G, 7%) (Figure 6A and 7A). PTPRD is a protein tyrosine phosphatase signaling molecule that is known to be involved in oncogenic transformation. It has been reported as frequently lost in many cancers and is associated with tumor-suppressor activity [49]. LRP1B belongs to the low-density lipoprotein (LDL) receptor family. LRP1B is a putative tumor suppressor and LRP1B silencing has been observed in renal and thyroid cancers [50,51]. Mutations in SETD2 have been found in 12% of B-cell acute lymphoblastic leukemia and in a range between 1% and 2% of B-cell lymphoma; they have also been found in chronic lymphocytic leukemia and acute myeloid leukemia (AML) [52]. More recently, SETD2 mutations were also reported in MM [39]. This gene has a key role in DNA repair since it is required for DNA mismatch repair and for DNA double-strand break repair [53,54]. Moreover, it has been shown that SETD2 mutations lead to resistance to DNA-damaging agents in leukemia [55]. EZH2 (Enhancer of Zeste 2 Polycomb Repressive Complex 2) is known to be deregulated in MM [56]. Recently, few studies highlighted the interest to target EZH2, with or without being associated with other drugs such as Bortezomib or IMiDs, to overcome MM drug resistance [30,57,58]. FANCG is involved in Fanconi anemia, a disorder that is characterized by an impaired bone marrow function and that predisposes to AML [59]. Furthermore, high expression of Fanconi anemia genes is associated with poor prognosis in B cell malignancies, including MM [42,60].
Altogether, these data underline mutations of reported tumor suppressor genes that may play a key role in MM progression. It will be of interest to investigate multi-omics analyses integrating RNA-seq, mutations and single nucleotide polymorphisms (SNP) analyses to identify significant associations between genetic abnormalities in this large cohort of MM cell lines.
Interestingly, our analysis reveals that HMCLs present one to four subclones, a range that is similar to primary tumor samples (Table S6A-B). These results suggest that HMCLs can be used to study the effect of MM treatments on subclonal evolution, which is critical to understand the mechanisms underlying relapse from chemotherapy and drug resistance. In this context, analysis of the subclonal composition and phylogenetic pattern of the HMCLs at single cell level will be of particular interest [61].
It is noteworthy that our analysis highlighted mutual exclusive mutations in HMCLs between KRAS and NRAS, implying that they did not occur together in the same cell lines. Mutual exclusivity is important for the understanding of cancer progression and functional relationships between the alterations. Moreover, genes mutated in a mutually exclusive fashion can be interesting for targeted treatment through a synthetic lethality approach [62].
We also identified 10 HMCLs characterized by TP53 bi-allelic events and 5 HMCLs presenting del1p and FAM46C mutation double hits (Table S1). These cell lines represent a potent model to identify therapeutic strategies in order to improve the survival of patients characterized by these bi-allelic inactivations and poor outcome [40].
HMCLs are potent tools not only to study molecular mechanisms underlying MM but also for first-line tests to decipher drug effects on MM cells. In this study, we found a significant association between mutated genes and drug resistance or sensitivity. These genes include FAM46C, KMT2D, KRAS, PMS1, USP6 and TP53 (Figure 8A-B). Further studies are needed to validate their biological role in treatment response. FAM46C is described as one of the most frequently mutated genes in MM in several studies and its function is largely unknown [63]. Recently, it has been described as a potential onco-supressor and a non-canonical poly(A) polymerase specific to B-cell lineage [63]. Furthermore, double-hit events involving FAM46C are associated with poor outcome in MM patients after relapse [40]. FAM46C mutation was associated with higher resistance of HMCLs to Panobinostat, an histone deacetylase inhibitor (HDACi). HDACi are known to activate NFκB through inhbition of HDAC3-mediated deacetylation of the p65/RelA NFκB subunit [64]. This NFκB activation by HDACi participated in the biological rationale of combining HDACi with proteasome inhibitors in MM [65]. According to that, MM cells with FAM46C mutations could be associated with lower dependence on NFκB pathway. Notably, we also found significant associations between TP53 mutations and sensitivity to Panobinostat and Lenalidomide (Figure 8B). These data underlined previous observations indicating that MM cells sensitive to Panobinostat are significantly enriched in genes related to high tumor metabolism and growth compared to resistant ones associated with a more quiescent state [28]. TP53 bi-allelic event is also associated with a dramatic impact on survival in MM patients after relapse, whereas TP53 mutations were not associated with a prognostic impact [40]. The higher sensitivity of TP53 mutated HMCLs to Panobinostat HDACi and Lenalidomide could be of clinical interest in MM patients with TP53 MM driver mutations. Furthermore, mutations in genes required for IMiD-mediated CRL4CRBN activity [44] have been found to be associated with significant resistance to pomalidomide in our panel of HMCLs. These genes included IKZF1 and IKZF3 that are ubiquitinated and degraded by CRL4CRBN, CAND1 and UBE2M cullin-RING ligase regulators, UBE2D3 E2 ubiquitin-conjuating enzyme and other genes of unclear function (PPP6C, NCOR1 and EDC4) (Figure 9). These data illustrate the mechanistic importance of acquired mutations in known genes required for IMiD-mediated toxicity and could open new avenues of therapies aimed at overcoming these processes.
Conclusions
In summary, this study provides a comprehensive map of mutations in HMCLs. Our data provide unique resources for further studies and could help identify novel, critical genes and pathways potentially associated with MM progression. The determination of actionable mutations potentially associated with drug resistance/sensitivity may open the way for alternative targeted treatments.
Abbreviations
AML: acute myeloid leukemia; BAM: binary alignment map; BER: base excision repair; EBV: epstein barr virus; FBS: fetal bovine serum; FISH: fluorescence in situ hybridization; HDACi: histone deacetylase inhibitor; HMCLs: human myeloma cell lines; HR: homologous recombination; IL6: interleukin 6; INDELS: insertions/deletions; MAF: mutation annotation file format; MCA: multiple correspondence analysis; MM: multiple myeloma; MMR: mismatch repair; MR: mutation rate; MUT: mutated; NER: nucleotide excision repair; NHEJ: non-homologous end joining; SAHA: suberoyl anilide hydroxamic acid; SAM: sequence alignment map; TSA: trichostatin a; VCF: variant call format; WES: whole exome sequencing; WT: wild type; T-ALL: t-cell acute lymphoblastic leukemia.
Supplementary Material
Supplementary figures and tables.
Acknowledgements
This work was supported by grants from French INCA (Institut National du Cancer) Institute (PLBIO15-256), ITMO Cancer (MM&TT), AF3M and SIRIC Montpellier (INCa-DGOS-Inserm 6045). VV is supported by a grant from Guillaume Espoir association (France).
Contributions
VV performed the research and participated in the writing of the paper. MJ, NR, GR, SB and AB participated in the research. GC, and LV participated in clinical data analysis and participated in the writing of the paper. BK, and OE participated in the research and in the writing of the paper. AK and JM supervised the research and the writing of the paper.
Competing Interests
The authors have declared that no competing interest exists.
References
1. Röllig C, Knop S, Bornhäuser M. Multiple myeloma. Lancet Lond Engl. 2015;385:2197-208
2. Walker BA, Leone PE, Chiecchio L, Dickens NJ, Jenner MW, Boyd KD. et al. A compendium of myeloma-associated chromosomal copy number abnormalities and their prognostic value. Blood. 2010;116:e56-65
3. Zhan F, Huang Y, Colla S, Stewart JP, Hanamura I, Gupta S. et al. The molecular classification of multiple myeloma. Blood. 2006;108:2020-8
4. Bergsagel PL, Kuehl WM. Molecular pathogenesis and a consequent classification of multiple myeloma. J Clin Oncol Off J Am Soc Clin Oncol. 2005;23:6333-8
5. Walker BA, Wardell CP, Melchor L, Hulkki S, Potter NE, Johnson DC. et al. Intraclonal heterogeneity and distinct molecular mechanisms characterize the development of t(4;14) and t(11;14) myeloma. Blood. 2012;120:1077-86
6. Lohr JG, Stojanov P, Carter SL, Cruz-Gordillo P, Lawrence MS, Auclair D. et al. Widespread genetic heterogeneity in multiple myeloma: implications for targeted therapy. Cancer Cell. 2014;25:91-101
7. Keats JJ, Chesi M, Egan JB, Garbitt VM, Palmer SE, Braggio E. et al. Clonal competition with alternating dominance in multiple myeloma. Blood. 2012;120:1067-76
8. Moreaux J, Klein B, Bataille R, Descamps G, Maïga S, Hose D. et al. A high-risk signature for patients with multiple myeloma established from the molecular classification of human myeloma cell lines. Haematologica. 2011;96:574-82
9. Bolli N, Avet-Loiseau H, Wedge DC, Van Loo P, Alexandrov LB, Martincorena I. et al. Heterogeneity of genomic evolution and mutational profiles in multiple myeloma. Nat Commun. 2014;5:2997
10. Langmead B, Salzberg SL. Fast gapped-read alignment with Bowtie 2. Nat Methods. 2012;9:357-9
11. Li H, Handsaker B, Wysoker A, Fennell T, Ruan J, Homer N. et al. The Sequence Alignment/Map format and SAMtools. Bioinforma Oxf Engl. 2009;25:2078-9
12. DePristo MA, Banks E, Poplin R, Garimella KV, Maguire JR, Hartl C. et al. A framework for variation discovery and genotyping using next-generation DNA sequencing data. Nat Genet. 2011;43:491-8
13. Wang K, Li M, Hakonarson H. ANNOVAR: functional annotation of genetic variants from high-throughput sequencing data. Nucleic Acids Res. 2010;38:e164
14. 1000 Genomes Project Consortium, Auton A, Brooks LD, Durbin RM, Garrison EP, Kang HM. et al. A global reference for human genetic variation. Nature. 2015;526:68-74
15. Forbes SA, Beare D, Boutselakis H, Bamford S, Bindal N, Tate J. et al. COSMIC: somatic cancer genetics at high-resolution. Nucleic Acids Res. 2017;45:D777-83
16. Chakravarty D, Gao J, Phillips SM, Kundra R, Zhang H, Wang J. et al. OncoKB: A Precision Oncology Knowledge Base. JCO Precis Oncol. 2017:2017
17. Anand Mayakonda, Phillip Koeffler. Maftools: Efficient analysis, visualization and summarization of MAF files from large-scale cohort based cancer studies. bioRxiv. 2016
18. Xie C, Tammi MT. CNV-seq, a new method to detect copy number variation using high-throughput sequencing. BMC Bioinformatics. 2009;10:80
19. Popp S, Jauch A, Schindler D, Speicher MR, Lengauer C, Donis-Keller H. et al. A strategy for the characterization of minute chromosome rearrangements using multiple color fluorescence in situ hybridization with chromosome-specific DNA libraries and YAC clones. Hum Genet. 1993;92:527-32
20. Ding L, Ley TJ, Larson DE, Miller CA, Koboldt DC, Welch JS. et al. Clonal evolution in relapsed acute myeloid leukaemia revealed by whole-genome sequencing. Nature. 2012;481:506-10
21. Miller CA, White BS, Dees ND, Griffith M, Welch JS, Griffith OL. et al. SciClone: inferring clonal architecture and tracking the spatial and temporal patterns of tumor evolution. PLoS Comput Biol. 2014;10:e1003665
22. Fraley C, Raftery AE. Model-Based Clustering, Discriminant Analysis, and Density Estimation. J Am Stat Assoc. 2002;97:611-31
23. Jara A, Hanson TE, Quintana FA, Müller P, Rosner GL. DPpackage: Bayesian Non- and Semi-parametric Modelling in R. J Stat Softw. 2011;40:1-30
24. Yu G, He Q-Y. ReactomePA: an R/Bioconductor package for reactome pathway analysis and visualization. Mol Biosyst. 2016;12:477-9
25. Ogata H, Goto S, Sato K, Fujibuchi W, Bono H, Kanehisa M. KEGG: Kyoto Encyclopedia of Genes and Genomes. Nucleic Acids Res. 1999;27:29-34
26. Kanehisa M, Sato Y, Kawashima M, Furumichi M, Tanabe M. KEGG as a reference resource for gene and protein annotation. Nucleic Acids Res. 2016;44:D457-462
27. Kanehisa M, Furumichi M, Tanabe M, Sato Y, Morishima K. KEGG: new perspectives on genomes, pathways, diseases and drugs. Nucleic Acids Res. 2017;45:D353-61
28. Moreaux J, Reme T, Leonard W, Veyrune J-L, Requirand G, Goldschmidt H. et al. Gene expression-based prediction of myeloma cell sensitivity to histone deacetylase inhibitors. Br J Cancer. 2013;109:676-85
29. Viziteu E, Grandmougin C, Goldschmidt H, Seckinger A, Hose D, Klein B. et al. Chetomin, targeting HIF-1α/p300 complex, exhibits antitumour activity in multiple myeloma. Br J Cancer. 2016;114:519-23
30. Herviou L, Kassambara A, Boireau S, Robert N, Requirand G, Müller-Tidow C. et al. PRC2 targeting is a therapeutic strategy for EZ score defined high-risk multiple myeloma patients and overcome resistance to IMiDs. Clin Epigenetics. 2018;10:121
31. Jourdan M, Moreaux J, Vos JD, Hose D, Mahtouk K, Abouladze M. et al. Targeting NF-kappaB pathway with an IKK2 inhibitor induces inhibition of multiple myeloma cell growth. Br J Haematol. 2007;138:160-8
32. Moreaux J, Rème T, Leonard W, Veyrune J-L, Requirand G, Goldschmidt H. et al. Development of gene expression-based score to predict sensitivity of multiple myeloma cells to DNA methylation inhibitors. Mol Cancer Ther. 2012;11:2685-92
33. Moreaux J, Bruyer A, Veyrune J-L, Goldschmidt H, Hose D, Klein B. DNA methylation score is predictive of myeloma cell sensitivity to 5-azacitidine. Br J Haematol. 2014;164:613-6
34. Viziteu E, Klein B, Basbous J, Lin Y-L, Hirtz C, Gourzones C. et al. RECQ1 helicase is involved in replication stress survival and drug resistance in multiple myeloma. Leukemia. 2017;31:2104-13
35. Lê S, Josse J, Husson F. FactoMineR: A Package for Multivariate Analysis. J Stat Softw. 2008
36. Kassambara A, Mundt F. factoextra: Extract and Visualize the Results of Multivariate Data Analysis. 2017.
37. Magrangeas F, Avet-Loiseau H, Munshi NC, Minvielle S. Chromothripsis identifies a rare and aggressive entity among newly diagnosed multiple myeloma patients. Blood. 2011;118:675-8
38. Walker BA, Boyle EM, Wardell CP, Murison A, Begum DB, Dahir NM. et al. Mutational Spectrum, Copy Number Changes, and Outcome: Results of a Sequencing Study of Patients With Newly Diagnosed Myeloma. J Clin Oncol Off J Am Soc Clin Oncol. 2015;33:3911-20
39. Walker BA, Mavrommatis K, Wardell CP, Ashby TC, Bauer M, Davies FE. et al. Identification of novel mutational drivers reveals oncogene dependencies in multiple myeloma. Blood. 2018;132:587-97
40. Weinhold N, Ashby C, Rasche L, Chavan SS, Stein C, Stephens OW. et al. Clonal selection and double-hit events involving tumor suppressor genes underlie relapse in myeloma. Blood. 2016;128:1735-44
41. Torgovnick A, Schumacher B. DNA repair mechanisms in cancer development and therapy. Front Genet. 2015 [cited 2018 Feb 2]; 6. Available from:http://journal.frontiersin.org/article/10.3389/fgene.2015.00157/abstract
42. Kassambara A, Gourzones-Dmitriev C, Sahota S, Rème T, Moreaux J, Goldschmidt H. et al. A DNA repair pathway score predicts survival in human multiple myeloma: the potential for therapeutic strategy. Oncotarget. 2014;5:2487-98
43. Gourzones-Dmitriev C, Kassambara A, Sahota S, Rème T, Moreaux J, Bourquard P. et al. DNA repair pathways in human multiple myeloma: role in oncogenesis and potential targets for treatment. Cell Cycle Georget Tex. 2013;12:2760-73
44. Sievers QL, Gasser JA, Cowley GS, Fischer ES, Ebert BL. Genome-wide screen identifies cullin-RING ligase machinery required for lenalidomide-dependent CRL4CRBN activity. Blood. 2018;132:1293-303
45. Inoue T, Morita M, Hijikata A, Fukuda-Yuzawa Y, Adachi S, Isono K. et al. CNOT3 contributes to early B cell development by controlling Igh rearrangement and p53 mRNA stability. J Exp Med. 2015;212:1465-79
46. De Keersmaecker K, Atak ZK, Li N, Vicente C, Patchett S, Girardi T. et al. Exome sequencing identifies mutation in CNOT3 and ribosomal genes RPL5 and RPL10 in T-cell acute lymphoblastic leukemia. Nat Genet. 2013;45:186-90
47. Guo C, Chen LH, Huang Y, Chang C-C, Wang P, Pirozzi CJ. et al. KMT2D maintains neoplastic cell proliferation and global histone H3 lysine 4 monomethylation. Oncotarget. 2013;4:2144-53
48. Zhang J, Dominguez-Sola D, Hussein S, Lee J-E, Holmes AB, Bansal M. et al. Disruption of KMT2D perturbs germinal center B cell development and promotes lymphomagenesis. Nat Med. 2015;21:1190-8
49. Wang D, Wang L, Zhou J, Pan J, Qian W, Fu J. et al. Reduced expression of PTPRD correlates with poor prognosis in gastric adenocarcinoma. PloS One. 2014;9:e113754
50. Prazeres H, Torres J, Rodrigues F, Pinto M, Pastoriza MC, Gomes D. et al. Chromosomal, epigenetic and microRNA-mediated inactivation of LRP1B, a modulator of the extracellular environment of thyroid cancer cells. Oncogene. 2011;30:1302-17
51. Ni S, Hu J, Duan Y, Shi S, Li R, Wu H. et al. Down expression of LRP1B promotes cell migration via RhoA/Cdc42 pathway and actin cytoskeleton remodeling in renal cell cancer. Cancer Sci. 2013;104:817-25
52. Licht JD. SETD2: a complex role in blood malignancy. Blood. 2017;130:2576-8
53. Li F, Mao G, Tong D, Huang J, Gu L, Yang W. et al. The histone mark H3K36me3 regulates human DNA mismatch repair through its interaction with MutSα. Cell. 2013;153:590-600
54. Carvalho S, Vítor AC, Sridhara SC, Martins FB, Raposo AC, Desterro JMP. et al. SETD2 is required for DNA double-strand break repair and activation of the p53-mediated checkpoint. eLife. 2014;3:e02482
55. Mar BG, Chu SH, Kahn JD, Krivtsov AV, Koche R, Castellano CA. et al. SETD2 alterations impair DNA damage recognition and lead to resistance to chemotherapy in leukemia. Blood. 2017;130:2631-41
56. Pawlyn C, Bright MD, Buros AF, Stein CK, Walters Z, Aronson LI. et al. Overexpression of EZH2 in multiple myeloma is associated with poor prognosis and dysregulation of cell cycle control. Blood Cancer J. 2017;7:e549
57. Zeng D, Liu M, Pan J. Blocking EZH2 methylation transferase activity by GSK126 decreases stem cell-like myeloma cells. Oncotarget. 2017;8:3396-411
58. Dimopoulos K, Søgaard Helbo A, Fibiger Munch-Petersen H, Sjö L, Christensen J, Sommer Kristensen L. et al. Dual inhibition of DNMTs and EZH2 can overcome both intrinsic and acquired resistance of myeloma cells to IMiDs in a Cereblon-independent manner. Mol Oncol. 2017
59. Xie Y, de Winter JP, Waisfisz Q, Nieuwint AW, Scheper RJ, Arwert F. et al. Aberrant Fanconi anaemia protein profiles in acute myeloid leukaemia cells. Br J Haematol. 2000;111:1057-64
60. Bret C, Klein B, Cartron G, Schved J-F, Constantinou A, Pasero P. et al. DNA repair in diffuse large B-cell lymphoma: a molecular portrait. Br J Haematol. 2015;169:296-9
61. Melchor L, Brioli A, Wardell CP, Murison A, Potter NE, Kaiser MF. et al. Single-cell genetic analysis reveals the composition of initiating clones and phylogenetic patterns of branching and parallel evolution in myeloma. Leukemia. 2014;28:1705-15
62. Szczurek E, Beerenwinkel N. Modeling mutual exclusivity of cancer mutations. PLoS Comput Biol. 2014;10:e1003503
63. Mroczek S, Chlebowska J, Kuliński TM, Gewartowska O, Gruchota J, Cysewski D. et al. The non-canonical poly(A) polymerase FAM46C acts as an onco-suppressor in multiple myeloma. Nat Commun. 2017;8:619
64. Chen L-F, Greene WC. Regulation of distinct biological activities of the NF-kappaB transcription factor complex by acetylation. J Mol Med Berl Ger. 2003;81:549-57
65. Harrison SJ, Quach H, Yuen K, Strayer A, Copeman MC, Peinert S. et al. High Response Rates with the Combination of Bortezomib, Dexamethasone and the Pan-Histone Deacetylase Inhibitor Romidepsin in Patients with Relapsed or Refractory Multiple Myeloma in a Phase I/II Clinical Trial. Blood. 2008;112:3698
Author contact
![]() Corresponding author: Jérôme Moreaux, Laboratory for Monitoring Innovative Therapies, Department of Biological Hematology, Hôpital Saint-Eloi - CHRU de Montpellier, 80, av. Augustin Fliche, 34295 Montpellier Cedex 5, IGH - Institute of Human Genetics, CNRS UMR 9002. http://www.igh.cnrs.fr/. Phone: +33 (0)4 67 33 79 03; fax: +33 (0)4 67 33 70 36; mail: jerome.moreauxcnrs.fr
Corresponding author: Jérôme Moreaux, Laboratory for Monitoring Innovative Therapies, Department of Biological Hematology, Hôpital Saint-Eloi - CHRU de Montpellier, 80, av. Augustin Fliche, 34295 Montpellier Cedex 5, IGH - Institute of Human Genetics, CNRS UMR 9002. http://www.igh.cnrs.fr/. Phone: +33 (0)4 67 33 79 03; fax: +33 (0)4 67 33 70 36; mail: jerome.moreauxcnrs.fr