Impact Factor
- Issue 14; 2026
- Issue 13; 2026
- Issue 12; 2026
- Issue 11; 2026
- Issue 10; 2026
- Volume 16; 2026
- Advance Articles
- Past Issues
- Cover Images
- Cover Suggestion
- Index & Coverage
- Special Issues
Introduction
Results and Discussion
Conclusion
Experimental Section
Abbreviations
Supplementary Material
Acknowledgements
References
International Journal of Biological Sciences
International Journal of Medical Sciences
 Global reach, higher impact

Theranostics 2019; 9(2):381-390. doi:10.7150/thno.28376 This issue Cite
Research Paper
Highly-Soluble Cyanine J-aggregates Entrapped by Liposomes for In Vivo Optical Imaging around 930 nm
Dyego Miranda1*, Haoyuan Huang1*, Homan Kang2, Ye Zhan1, Depeng Wang1, Yang Zhou3, Jumin Geng1, Hailey I. Kilian1, Wesley Stiles2, Aida Razi4, Joaquin Ortega4, Jun Xia1, Hak Soo Choi2, Jonathan F. Lovell1 ![]()
1. Department of Biomedical Engineering, University at Buffalo, State University of New York, Buffalo, NY 14260, USA
2. Gordon Center for Medical Imaging, Department of Radiology, Massachusetts General Hospital and Harvard Medical School, Boston, MA 02114, USA
3. College of Chemistry, Chemical Engineering and Materials Science, Shandong Normal University, Jinan 250014, China
4. Department of Anatomy and Cell Biology, McGill University, Montreal, Quebec, H3A 0C7, Canada
*Equal contribution
Received 2018-7-8; Accepted 2018-11-16; Published 2019-1-1
Abstract

Near infrared (NIR) dyes are useful for in vivo optical imaging. Liposomes have been used extensively for delivery of diverse cargos, including hydrophilic cargos which are passively loaded in the aqueous core. However, most currently available NIR dyes are only slightly soluble in water, making passive entrapment in liposomes challenging for achieving high optical contrast.
Methods: We modified a commercially-available NIR dye (IR-820) via one-step Suzuki coupling with dicarboxyphenylboronic acid, generating a disulfonated heptamethine; dicarboxyphenyl cyanine (DCP-Cy). DCP-Cy was loaded in liposomes and used for optical imaging.
Results: Owing to increased charge in mildly basic aqueous solution, DCP-Cy had substantially higher water solubility than indocyanine green (by an order of magnitude), resulting in higher NIR absorption. Unexpectedly, DCP-Cy tended to form J-aggregates with pronounced spectral red-shifting to 934 nm (from 789 nm in monomeric form). J-aggregate formation was dependent on salt and DCP-Cy concentration. Dissolved at 20 mg/mL, DCP-Cy J-aggregates could be entrapped in liposomes. Full width at half maximum absorption of the liposome-entrapped dye was just 25 nm. The entrapped DCP-Cy was readily detectable by fluorescence and photoacoustic NIR imaging. Upon intravenous administration to mice, liposomal DCP-Cy circulated substantially longer than the free dye. Accumulation was largely in the spleen, which was visualized with fluorescence and photoacoustic imaging.
Conclusions: DCP-Cy is simple to synthesize and exhibits high aqueous solubility and red-shifted absorption from J-aggregate formation. Liposomal dye entrapment is possible, which facilitates in vivo photoacoustic and fluorescence imaging around 930 nm.
Keywords: cyanine, J-aggregate, liposomes, photoacoustic
Introduction
Near-infrared (NIR) dyes are used extensively for biomedical imaging applications, owing to enhanced tissue penetration of light in the NIR window.[1, 2] A wide range of contrast media has been explored for NIR fluorescence and photoacoustic in vivo imaging.[3-21] Cyanines are amongst the most commonly-used NIR dyes.[22-24] They can form end-to-end “J-aggregates” with red shifted absorption that have been observed since the 1930s.[25-27] Indocyanine green (ICG) and IR-820 are two of the most commonly used cyanine dyes, with ICG being clinically approved for use in humans. ICG is one of the more hydrophilic NIR dyes, but its water solubility is <5 mg/mL, and it tends to aggregate.[28] This is in contrast to shorter wavelength fluorescence dyes such as calcein or sulforhodamine, which can readily dissolve at concentrations at least an order of magnitude higher. ICG formulations typically make use of delivery systems appropriate for hydrophobic compounds, such as micelles, lipids, silica particles, etc.[29-31] Although liposomal cyanine formulations have been reported, the dye is often loaded in the bilayer, and not the aqueous core with limited solubility.[32, 33] This is consistent with most other NIR dyes, which are also hydrophobic and thus have similar formulation strategies.[34, 35] A highly soluble NIR dye would enable alternative formulation strategies (such as passive entrapment in the core of liposomes) while providing strong NIR contrast. In some cases, formation of J-aggregates in solution can be controlled for theranostic purposes.[36-38] Previously reported nano-assemblies of J-aggregates were successfully used for imaging, photothermal therapy (PTT) and chemotherapy using polymers and inorganic carriers.[38, 39] In this work we describe the synthesis, formulation and characterization of a novel, highly soluble cyanine dye that forms J-aggregates that could be entrapped in liposomes for photoacoustic imaging.
Results and Discussion
Synthesis and characterization of DCP-Cy
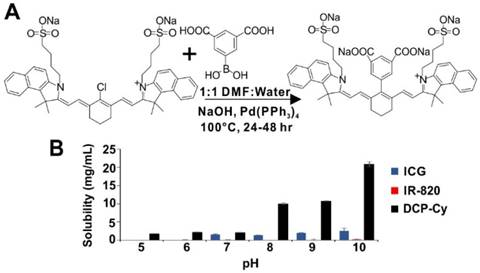
DCP-Cy was synthesized from IR-820 with a facile, one-step Suzuki-coupling (Fig. 1A). The method followed that described by Achilefu,[40] except a dicarboxy phenylboronic acid was used to generate two carboxylic acid in the product, intended for enhanced solubility. Briefly, IR-820 was stirred with 10-fold excess 3,5-dicarboxyphenylboronic acid in basic DMF-water (1:1), with Pd(PPh3)4 as a catalyst for 24-48 hours at 100 °C. Products were recrystallized in THF to remove unincorporated reactants. Crystals were further dissolved in 0.1 M NaOH aqueous solution and extracted with [water:ethyl acetate] (1:1). The aqueous phase was collected, and the products were precipitated and collected following addition of substantial amounts of acetone (yield: 52.1%). The purity of the dye was confirmed by HPLC (>99%) (Fig. S1). Further confirmation of the newly synthesized compound was observed by the results of MALDI-TOF mass spectrum (with both the single charged and two charged peaks) and 1H NMR (Fig. S2 and S3). The aqueous solubility of DCP-Cy improved significantly by introducing two carboxylic groups, in mildly basic pH. As shown in Fig. 1B, from pH 8-10, DCP-Cy had approximately 10 times greater water solubility than ICG and could be readily dissolved to concentrations exceeding 20 mg/mL at pH 10.
Dicarboxyphenyl cyanine (DCP-Cy). A) Synthesis of DPC-Cy. B. Solubility of ICG, IR-820 and DCP-Cy in sucrose phosphate buffer, pH 5-10.
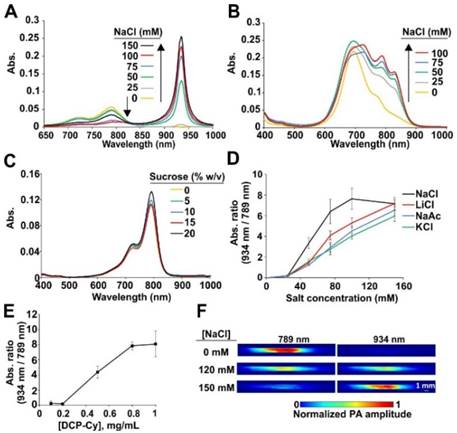
When dissolved in deionized water, DCP-Cy displayed an NIR absorbance peak at 789 nm. However, increasing concentrations of NaCl up to 150 mM caused formation of J-aggregates and induced a drastic red-shift by 145 nm, to 934 nm (Fig. 2A). In monomeric form, DCP-Cy absorption was red-shifted by about 10 nm compared to ICG, whereas in J-aggregate form, DCP-Cy absorption is red-shifted by about 40 nm compared to ICG J-aggregates.[36] The effect of NaCl on ICG solutions in similar conditions was far less pronounced (Fig. 2B), with limited induction of J-aggregation. In sucrose solutions at pH 7.4, no significant spectral effects were observed at different osmotic strengths (Fig. 2C). Thus, salt contributes to the efficient formation of DCP-Cy J-aggregates. Salt-induced J-aggregation of cyanines is a known phenomenon.[41, 42] When DCP-Cy was dissolved in other salts (KCl, LiCl and NaAc), J-aggregate formation (as indicated by the 934:789 nm absorption ratio) occurred, although NaCl appeared to induce this slightly more effectively, for reasons that are not clear (Fig. 2D). The NIR absorption peak ratio of J-aggregates was not sensitive to pH (Fig. S4). The presence of salt alone was not sufficient for the J-aggregate formation, as DCP-Cy concentration was also important. In 150 mM NaCl, full transition from monomer to J-aggregate occurred within a dye concentration range of 0.2 to 1 mg/mL (Fig. 2E). The salt-dependent J-aggregation state of DCP-Cy could readily be imaged with photoacoustic imaging (Fig. 2F). When a pulse laser excitation of 789 nm was used, the monomeric DCP-Cy generated photoacoustic signal, whereas the J-aggregated form of the dye generated signal with 934 nm excitation, which corresponds to the absorption spectra properties. The quantified photoacoustic values are shown in Table S1.
Characterization of DCP-Cy J-aggregates. Spectra of DCP-Cy (A) or ICG (B) in solutions of pH 7.4 and indicated NaCl concentrations. C. Spectra of DCP-Cy at indicated sucrose concentration; D. Ratio between 934 and 789 nm absorbance peaks of 1 mg/mL DCP-Cy at pH 7.4 in indicated salt conditions. E. Absorbance ratio of varying concentrations of DCP-Cy in 150 mM NaCl, pH 7.4. F. Photoacoustic images of DCP-Cy using 789 or 934 nm excitation pulses in pH 7.4 buffer with indicated salt concentration.
Liposomal DCP-Cy
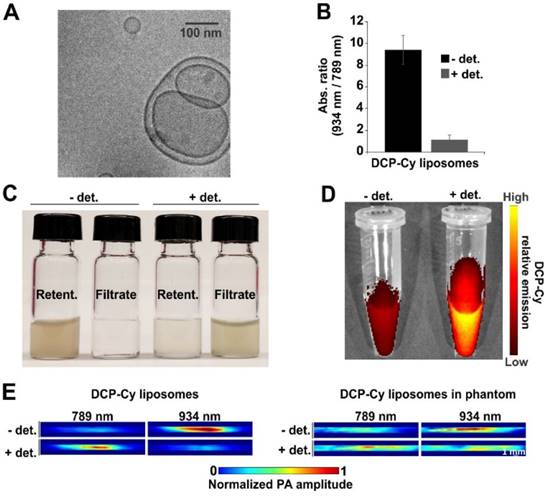
DCP-Cy in J-aggregate form was dissolved at 20 mg/mL in 150 mM NaCl PBS, pH 10 for passive encapsulation in liposomes. Liposomes were formed with dioleoylphosphatidylcholine and distearoylphosphatidylcholine in a molar ratio of 1:3, along with 50 mol. % cholesterol and 5 mol. % of PEGylated DSPE, a formulation used previously for dye entrapment.[43] Lipids were dissolved in ethanol and then injected into an aqueous dye solution at 60 °C, followed by size-exclusion chromatography to remove non-entrapped dye. Liposomes cooled at room temperature for 1 hr prior to gel filtration, during which time the formation of a rusty metallic color became apparent (Fig. S5). Subsequent membrane filtration of DCP-Cy liposomes resulted in decreasing J-aggregate composition as revealed by lower 934:789 nm absorption ratio (Fig. S6), possibly due to disassembly of the aggregates or loss of larger particles. Based on dynamic light scattering, liposome size decreased from 434 nm to 306 nm or 249 nm following filtration through 0.45 or 0.2 µm filters respectively (Fig. S7). Liposomes were subsequently used without filtration steps. When examined with cryo-electron microscopy, no distinct J-aggregate structures were apparent, suggesting the J-aggregates were small in size (Fig. 3A). When liposomes were lysed with detergent, the 934:789 nm absorption ratio decreased, showing that the entrapped dye was released and converted to monomeric form (Fig. 3B). Conversely, prior to detergent addition, the intensity of the J-aggregate absorption band to the monomeric absorption band was approximately 9.4, implying that less than 10 percent of the liposomal dye formulation was in the monomeric form. To further confirm the nature of dye release following exposure to detergent, centrifugal filtration was used to separate entrapped and released DPC-Cy (Fig. 3C). As expected, only lysed liposomes released DCP-Cy as could be detected by passage of the small dye through the 100,000 Da pore size membrane into the filtrate. Fluorescence imaging could also confirm the dye release (Fig. 3D). Under a 710-760 nm excitation source (specific to the monomeric form of the dye), the detergent-lysed liposomes exhibited greater fluorescence, reflecting conversion of J-aggregates into monomers. As shown in Fig. 3E, Photoacoustic imaging was able to reveal aggregation state of liposomal DCP-Cy J-aggregates (at 934 nm), whereas following liposome lysis, the free dye was signal apparent became apparent 789 nm. Photoacoustic imaging of the DCP-Cy was also successful through agar phantoms (with 1 % intralipid) at 2 cm depth. Both DCP-Cy dye and DCP-Cy liposomes could be bleached under high laser power continuous irradiation at 808 nm of 1000 mW/cm2 (Fig S8).
DCP-Cy J-aggregates can be loaded into liposomes A) Cryo-EM image of DCP-Cy liposomes; B) Ratio between 934 and 789 nm absorbance with or without lysis of the liposomes with 0.1 % Tritron X100 (+/- det.) C) Detergent-induced release of DCP-Cy from liposomes based on centrifugal filtration retention. D) Liposomal DCP-Cy fluorescence +/- det. with excitation around 735 nm. E) Photoacoustic imaging of liposomal DCP-Cy +/- det. at 789 nm laser excitation. The imaging on the right was carried out in an agar phantom (with 1 % intralipid) at 3 cm depth.
Pharmacokinetics, biodistribution and in vivo optical imaging
Next, liposomal DCP-Cy was injected via tail vein to mice (≈11 mg/kg). DCP-Cy was detected from small volumes of collected mouse serum (Fig. 4A). The liposomal J-aggregates were stable in vivo in circulating blood, based on the dominant absorption peak at 934 nm. DCP-Cy liposomal J-aggregates were also shown to be stable in serum in vitro (Supporting Fig. S9).
In vivo administration and photoacousic imaging of DCP-Cy liposomes. A) Absorption of serum at various time points following DCP-Cy liposomes intravenous administration to mice B) Serum absorption at 934 nm (n = 7 mice). C) Absorption of DCP-Cy liposomes diluted in in MeOH or PBS (multiplied by the dilution factor which was 100, measured in 1 cm path length cuvette); D) Biodistribution of liposomal DCP-Cy 24 hours post injection, following homogenization and methanol extraction of the dye (n=7 mice per time point). E) Non-invasive photoacoustic images of mice with 934 nm pulse laser excitation. Mice were imaged with the transducer on the abdomen under anesthesia. Following imaging and sacrifice, a photograph confirmed that the photoacoustic signal is localized to the spleen. White and yellow squares mark the location of the liver and spleen, respectively.
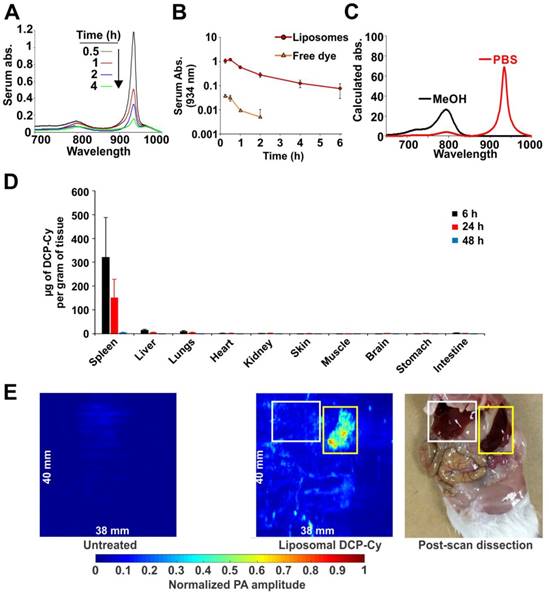
The liposomes were cleared from circulation relatively quickly, with a half-life of less than 2 hours (Fig. 4B). The serum absorption at 934 nm generally ranged from 1 to 0.1 for 6 hours following intravenous administration. Despite the relatively short half-life, liposomal dye entrapment resulted in substantially greater serum presence compared to the free dye, which produced extremely low serum absorption at the same injected dose.
The calculated absorption (i.e., considering the experimental dilution factor) of the DCP-Cy liposome stock solution used for injection is shown in Fig. 4C, dissolved in either PBS or methanol. In PBS, the full width half maximum was just 25 nm. Dissolving the liposomes in methanol effectively destroyed the J-aggregates, enabling straightforward quantification of the dye in homogenized organs following overnight methanol extraction, based on an absorption standard curve.
As shown in Fig. 4D, 6 hours after administration, DCP-Cy accumulated in the spleen of the mice. From 6 to 24 hours after intravenous injection, DCP-Cy concentration in the spleen decreased from 320 to 150 µg of DCP-Cy per gram of tissue. The dye was nearly completely removed by 48 hours. Very low amounts of DCP-Cy were detected in any other parts of the body. When the spleen was homogenized in PBS, the J-aggregate peak was present, although aqueous extraction resulted in higher background than methanol extraction (Fig. S10). Over a period of a couple of days, DCP-Cy absorption was cleared from the spleen.
Nanoparticles are typically taken up by the reticular endothelial system which includes the liver and spleen. However, the reason for the strong accumulation observed in the spleen (over 50 times more avidly than the liver on a per gram tissue basis) requires further investigation. Other types of PEGylated nanoparticles have been previously observed to accumulate substantially more in the spleen than liver [44, 45]. Of note, Cui and colleagues found that large PEG nanoparticles of both 500 nm and 280 nm accumulated strongly in the spleen, compared to liver. However, the larger nanoparticle accumulated more rapidly in the spleen [46]. Therefore, the relatively larger size of the liposomes (400 nm) may contribute, as might the inclusion of PEG on the liposome surface. Nanocarriers with imaging and therapeutic function hold potential for theranostic applications.[47] In this study the liposomes were only loaded with DCP-Cy, but in the future, it might be possible to co-load therapeutic cargo with the dye, to enable photoacoustic-guided drug delivery.[48]
Based on the splenic avidity of DCP-Cy liposomes, we assessed non-invasive photoacoustic computed tomography (PACT) in living mice. Mice were imaged 24 hours following injection of the dye. The J-aggregate absorption wavelength at 934 nm was used. As shown in Fig. 4F, control mice lacking DCP-Cy injection did not exhibit any photoacoustic signals. However, in mice that were administered DCP-Cy liposomes, a strong signal was detected in the spleen. Dye localization was confirmed by subsequent dissection and opening the abdomen of the mouse and overlapping the signal to the visible location of the spleen. As shown by the highlighted white and yellow squares, DPC-Cy photoacoustic signal was localized in the spleen, but not the liver. Interestingly, Kim et al. recently reported techniques for enhancing localization of photoacoustic probes specifically to the liver[49], which suggests the future possibility for combining multiplexed, organ-specific, color-coded contrast agents.
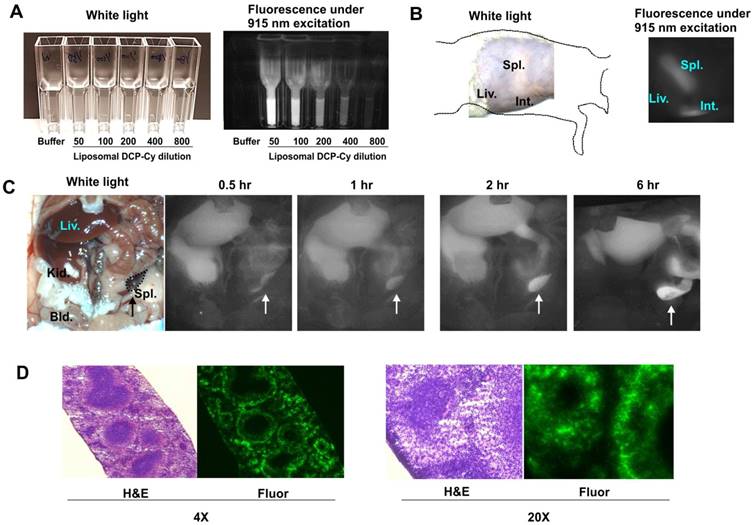
As cyanine J-aggregates tend to be fluorescently emissive, we sought to assess whether liposomal DCD-Cy could be detected using fluorescence imaging, in addition to photoacoustic imaging. Different imaging modalities have distinct advantages with respect to cost, resolution and imaging depth.[50] As shown in Figure 5A, using a custom setup with a 915 nm laser diode excitation source with a 950 nm long pass filter, DCP-Cy liposomes could be detected at high dilutions from the as-prepared stock solution. DCP-Cy liposomes were then intravenously injected into mice, which were imaged 6 hours after injection. The outline of a spleen could be seen non-invasively through the abdominal wall using fluorescence imaging (Fig 5B). Next, experiments were conducted with the abdomen opened, in order to better visualize dye distribution kinetics. As shown in Fig 5C, 30 minutes following the administration of liposomal DCP-Cy, relatively little signal was observed in the spleen. However, in the next 6 hours, the spleen signal intensified, implying that macrophages in the spleen gradually entrapped the liposomes. The kinetics of spleen uptake are shown in Fig S11. To confirm this, fluorescent imaging of spleen sections showed that cells of the spleen reticular endothelial system took up the liposomes (Fig 5D). Further work is required to assess the impact of DCP-Cy on spleen function and better elucidate uptake and clearance mechanism.
Fluorescence imaging using liposomal DCP-Cy. A) White light and fluorescence imaging of DCP-Cy liposomes with the indicated dilution factors. B) Non-invasive fluorescence imaging in a mouse of DCP-Cy liposomes 6 hours after intravenous injection. C) Fluorescence imaging demonstrates dye distribution kinetics. Arrows indicate the location of the spleen. D) H&E and fluorescence imaging of the spleen 24 hours after intravenous injection. (×10 for left panel and 20x for right pannel)
Conclusion
Commercially available IR-820 dye was chemically modified using Suzuki coupling to generate DCP-Cy in a one-step, facile reaction. DCP-Cy formed J-aggregates in the presence of salts, especially NaCl, resulting in a drastic red shift from 789 nm to 934 nm. Solubilization of DCP-Cy in basic aqueous solutions at 20 mg/mL enabled encapsulation of the dye, in J-aggregate form, into liposomes. Liposomes exhibited a sharp peak at 934 nm of the encapsulated J-aggregates. Liposomal DCP-Cy circulated substantially longer than the free dye and localized to the spleen, which could be imaged non-invasively with fluorescence and photoacoustic imaging around 930 nm. We conclude that DCP-Cy represents a new, easy-to-synthesize dye with high water solubility and unique properties for liposome entrapment and J-aggregate imaging.
Experimental Section
Materials
IR-820 was obtained from Sigma-Aldrich; 3,5-Dicarboxyphenylboronic acid was obtained from Combi-Blocks Inc.; Sodium hydroxide was obtained from Fisher Scientific; Tetrakis(triphenylphosphine)- palladium(0) (Pd(PPh3)4) was obtained from TCI; Indocyanine green (ICG) was obtained from Chem-Impex International Inc. Lipids purchased from CordenPharma include 1,2-Dioleoyl-sn-glycero-3-phosphocholine (DOPC, #LP-R4-070), 1,2-distearoyl-sn-glycero-3-phosphocholine (DSPC, #LP-R4-076), 1,2-distearoyl-sn-glycero-3-phosphoethanolamine-N-(methoxy(PEG)-2000 (MPEG-2000-DSPE, #LP-R4-039). Cholesterol was purchased from Nu-Chek Prep, Inc. (#CH-800-A28-Z).
Synthesis of DCP-Cy
1098.05 mg of 80% contained IR-820 (1.03 mmol), 2171.10 mg 3,5-Dicarboxyphenylboronic acid (10.34 mmol, 10 times of IR-820), 413.60 mg NaOH (10.34 mmol, NaOH: 3,5-Dicarboxyphenylboronic acid = 1:1) and 239.00mg Pd(PPh3)4 (0.207 mmol, 20% of IR-820) were mixed together in 50 mL DMF:water = 1:1 (v/v) solution. Oxygen was removed with a freeze-pump- thaw method three times. The reaction was carried out at 100 °C for 48 hr (for small scale reaction, the reaction time can be reduced to 24 h). After cooling down to room temperature, solvents were removed and the solids were re-dissolved in methanol and centrifuged to remove salts. The supernatants were collected and recrystallized in THF overnight. The crystals were washed with THF for three times and re-dissolved in 100 mL 0.1 M NaOH and reacted for overnight. Then, 200 mL DMSO was added to the solution and centrifuged to remove salts. By extracting with ethyl acetate, products were concentrated in the aqueous phase while DMSO moved to the organic phase. The aqueous phase was collected and acetone was added to precipitate the final product. The yield was 52.1% (564.15 mg). For purity analysis on HPLC, DCP-Cy dye was diluted in water and assessed with a Waters Micromass® ZQ™ with a 2790 Separations Module and a 996 Photodiode Array Detector. A 10 minute gradient of 30-80 % acetonitrile in 0.1% trifluoroacetic acid was used.
Solubility tests for ICG, IR-820 and DCP-Cy
ICG, IR-820 and DCP-Cy were dissolved in phosphate buffer and a standard curve was obtained. The samples were weighted and mixed with pH = 5-10 10% sucrose contained phosphate buffer and sonicate for 10min. After that, the solutions were centrifuged at 14,000 rcf for 15 min and supernatants were collected. The solubility test of each dye was performed by comparing the absorbance intensities of related supernatants and comparing them to the standard curves.
Spectral properties of DCP-Cy
For assessing the absorbance spectra of DCP-Cy and ICG in different NaCl contained phosphate buffer, the dyes were dissolved in 0, 25, 50, 75, 100 and 150 mM NaCl phosphate buffer pH = 7.4 at the concentration of 1 mg/mL, then the absorbance spectra were tested with Perkin Elmer Lambda 35 UV/VIS Spectrometer. For the absorbance spectra of DCP-Cy in sucrose, DCP-Cy samples was dissolved in 5%, 10%, 15% and 20% sucrose pH = 7.4 at the concentrations of 1mg/mL. For the absorbance of DCP-Cy in different salts, DCP-Cy was dissolved in various concentrations of NaCl, KCl, LiCl and NaAc in phosphate buffer pH = 7.4 at the dye concentration of 1 mg/mL, then the absorbance spectra were tested and the ratios were calculated by using the intensities at 934 nm divided intensities at 789 nm. To test the relationship between absorbance ratio and dye concentration, DCP-Cy was dissolved in 150 mM NaCl pH = 7.4 phosphate buffer with the concentrations of 100, 200, 500, 800 and 1000 µg/mL. To test the pH effects on absorbance ratios, DCP-Cy was dissolved in 150 mM NaCl contained pH=5-8 phosphate buffer at the concentration of 1 mg/mL.
Preparation and characterization of DCP-Cy liposomes
Liposomes were formed with [DOPC:DSPC:Chol:DSPE-PEG] at a molar ratio of [2.25:6.75:10:1]. Liposomes were prepared by the ethanol injection method. Briefly, 20 mg/mL lipids were dissolved in 200 µL ethanol and mixed in glass tubes at 60 °C. Lipids were injected into 800 µL of a solution containing 20 mg/mL of DCP-Cy in PBS (150 mM NaCl, 7 mM Na2HPO4, 3 mM NaH2PO4, pH 10) at 60 °C. The samples were incubated in at 4 °C for 1 hr and the solution presented with a metallic color (Fig. S5). To remove the non-encapsulated components, size-exclusion chromatography was used. Columns containing Sephadex G-75 were loaded with 1 mL of liposome samples and the liposome fractions in the void volume were collected. Dye entrapment efficiency was estimated at 17 %. The size of DCP-Cy liposomes was determined by dynamic light scattering in a NanoBrook 90 plus PALS.
To determine the correlation of particle size and absorbance values liposomes were filtered using a 25 mm syringe filter with 450 nm cellulose acetate membrane purchased from VWR international, North America (#28145-497) and a 13 mm syringe filter with 200 nm nylon membrane from Agilent Technologies (Agilent Captiva Econo Filter, #5190-5269). After extrusion, absorbance spectra were tested with Perkin Elmer Lambda 35 UV/VIS Spectrometer.
To induce liposome breakage and release of DCP-Cy dye, 10% Triton® X-100 (Alfa Aesar, #9002-93-1) was added to samples. Triton® X-100 treatment was utilized for observation on spectra changes (l789 nm/l934 nm ratio) by adding 10 µL TX-100 to 1 mL of diluted sample in 150 mM NaCl PBS, pH 10. For detergent-induced dye release, liposomes were added to 100K Nanosep® tubes (Pall Life Sciences Nanosep® Centrifugal Device, #OD100C34) and induce loss of self-quenching of DCP-Cy dye entrapped in the liposomes.
Cryo-electron microscopy (cryo-EM)
Holey carbon grids (c-flat CF-2/2-2C-T) were washed by submerging them into chloroform overnight. Two samples were analyzed: free- DCP-Cy dye (4 mg/mL) in 150 mM NaCl PBS (pH 10) and DCP-Cy liposomes (2 mg/mL lipids). Grids were glow discharged at 5 mA for 15 seconds prior to application of the sample. 4µL of the liposomes were deposited on the electron microscopy grid. Vitrification was performed in a Vitrobot (ThermoFisher) by blotting the grids once for 3 seconds and blot force +1 before they were plunged into liquid ethane. Temperature and relative humidity during the vitrification process were maintained at 25 °C and 100%, respectively. The grid was loaded into the Tecnai F20 electron microscope operated at 200kV using a Gatan 626 single tilt cryo-holder. Images were collected using a defocus of -2.7 µm in a CCD camera at a nominal magnification of 50,000X, which produced images with a calibrated pixel size of 2.21Å. Images were collected with a total dose of 25 e-/Å2.
Photoacoustic system for tube and spleen imaging
The excitation source for our photoacoustic computed tomography (PACT) system is an Nd:YAG pumped optical OPO laser (SureliteTM OPO Plus, Continuum) with 10 Hz pulse repetition rate and 10 ns pulse duration. Sample was filled into a tube (1 mm in diameter) placed at the focus of transducer array (ATL/Philips L7-4, 5 MHz central frequency, 128 elements), and was imaged under both 789 nm and 934 nm excitation, which was routed to the imaging region through a cylindrical fiber bundle with 1.4 cm diameter. The light intensity on the tube surface was around 12 mJ/cm2, which is below the American National Standards Institute (ANSI) safety limit. The received PA signals were amplified (by 54 dB) and digitized by a 128-channel ultrasound data acquisition (DAQ) system (Vantage, Verasonics) with 20 MHz sampling rate. After each laser pulse, the raw channel data was reconstructed using the universal back-projection algorithm[51], and was displayed in real-time during experiments. In each experiment, 100 frames were acquired for averaging. For better comparison, only signals within tube region are shown.
For in vivo PA imaging, a lab-made holder was used to combine optical fiber bundles and the linear array transducer. Optical fiber bundles were placed on both side of the transducer for an illumination 25 mm above the spleen and the photoacoustic waves are detected by the transducer (L7-4) in the middle. The holder was fixed on a step-motor stage which moves the holder during the scanning. The field of view of the in vivo PA imaging was 38 mm × "40 mm", which fully covered the spleen area.
Pharmacokinetics
Seven BALB/c mice were intravenously injected in the tail with 200 µL of DCP-Cy liposomes at a dose of ≈11 mg/Kg of DCP-Cy (≈277 µg of DCP-Cy, considering mice having an average weight of 25 grams). For each time-point, small volumes of blood were collected. Samples were centrifuged at 500 rcf for 15 min and the serum was collected. For free DCP-Cy pharmacokinetics, 12 BALB/c mice were intravenously injected in the tail with 200 µL of DCP-Cy dye at the same dose of the liposomal formulation. Mice were sacrificed at specific time-points and larger volumes of blood were collected. Serum was diluted or not (depending on the serum volume) in PBS (150 mM NaCl, pH 10) and the absorbance scan was obtained using a Perkin Elmer Lambda 35 UV/VIS Spectrometer.
Biodistribution
Nineteen BALB/c mice were intravenously injected in the tail with 200 µL of DCP-Cy liposomes at a dose of ≈11 mg/kg of DCP-Cy. Mice were sacrificed and had their organs removed and weighed at 6, 24 or 48 hr post-injection. The small cut of each organ was placed in homogenization tubes with metal beads and 500 µL of PBS (150 mM NaCl, pH 10) or MeOH was added to each tube. Tubes were placed in a Bullet Blender® Storm 24 homogenizer for 15 min at maximum speed. Samples homogenized in MeOH were further incubated overnight at 4 °C. After homogenization, samples were centrifuged at 1500 rcf for 15 min and the supernatant was collected. An additional centrifugation step was performed to further remove any remaining tissue. The supernatant was placed in a 700 µL quartz cuvette and the absorbance scans were obtained using a Perkin Elmer Lambda 35 UV/VIS Spectrometer. Dye concentration in MeOH was determined by comparing to a standard curve. Calculations were adjusted by organ weight.
Fluorescence Imaging
Animals were housed in an AAALAC-certified facility and studied under the supervision of Massachusetts General Hospital (MGH) Institutional Animal Care and Use Committee (IACUC) in accordance with the approved institutional protocol (#2016N000136). Exposure to isoflurane inhalant anesthesia was used to anesthetize mice for brief non-surgical procedures. 100 µL of DCP-Cy liposomes was injected intravenously into CD-1 mice, and the major organs were imaged at each time point after lateral laparotomy under the real-time FLARE imaging system equipped with a 915 nm excitation laser source and a 950 nm long pass emission filter. Color and NIR fluorescence images were acquired simultaneously using customized software. The fluorescence and background intensities of a region of interest over spleen and muscle were quantified using ImageJ v1.48 (National Institutes of Health, Bethesda, MD) and the signal-to-background ratio (SBR) was calculated as SBR = (spleen fluorescence-background) /background, where the background is the fluorescence intensity of muscle.
Abbreviations
DCP-Cy: dicarboxyphenyl cyanine; ICG: Indocyanine green; NIR: Near infrared; PACT: photoacoustic computed tomography; PBS: Phosphate-buffered saline; UV/VIS: ultraviolet/visible.
Supplementary Material
Supplementary figures and tables.
Acknowledgements
This work was supported by the National Institutes of Health (R01EB017270 and DP5OD017898), the National Science Foundation (1555220) and a Brazilian CAPES Science without Borders scholarship.
Competing Interests
The authors have declared that no competing interest exists.
References
1. Pansare VJ, Hejazi S, Faenza WJ, Prud'homme RK. Review of long-wavelength optical and NIR imaging materials: contrast agents, fluorophores, and multifunctional nano carriers. Chem Mater. 2012;24:812-27
2. Luo S, Zhang E, Su Y, Cheng T, Shi C. A review of NIR dyes in cancer targeting and imaging. Biomaterials. 2011;32:7127-38
3. Kim C, Favazza C, Wang LV. In vivo photoacoustic tomography of chemicals: high-resolution functional and molecular optical imaging at new depths. Chem Rev. 2010;110:2756-82
4. Pu K, Shuhendler AJ, Jokerst JV, Mei J, Gambhir SS, Bao Z. et al. Semiconducting polymer nanoparticles as photoacoustic molecular imaging probes in living mice. Nat Nanotechnol. 2014;9:233
5. Achilefu S. Lighting up Tumors with Receptor-Specific Optical Molecular Probes. Technol Cancer Res Treat. 2004;3:393-409
6. Weber J, Beard PC, Bohndiek SE. Contrast agents for molecular photoacoustic imaging. Nat Methods. 2016;13:639
7. Zha Z, Deng Z, Li Y, Li C, Wang J, Wang S. et al. Biocompatible polypyrrole nanoparticles as a novel organic photoacoustic contrast agent for deep tissue imaging. Nanoscale. 2013;5:4462-7
8. Chen Q, Liu X, Zeng J, Cheng Z, Liu Z. Albumin-NIR dye self-assembled nanoparticles for photoacoustic pH imaging and pH-responsive photothermal therapy effective for large tumors. Biomaterials. 2016;98:23-30
9. Lemaster JE, Jokerst JV. What is new in nanoparticle-based photoacoustic imaging?. Wiley Interdiscip Rev Nanomed Nanobiotechnol. 2017:9
10. Jiang Y, Pu K. Advanced Photoacoustic Imaging Applications of Near-Infrared Absorbing Organic Nanoparticles. Small. 2017:13
11. Gao F, Bai L, Feng X, Tham Huijun P, Zhang R, Zhang Y. et al. Remarkable In Vivo Nonlinear Photoacoustic Imaging Based on Near-Infrared Organic Dyes. Small. 2016;12:5239-44
12. Lei Z, Li X, Luo X, He H, Zheng J, Qian X. et al. Bright, Stable, and Biocompatible Organic Fluorophores Absorbing/Emitting in the Deep Near-Infrared Spectral Region. Angew Chem. 2017;129:3025-9
13. Li W, Chen X. Gold nanoparticles for photoacoustic imaging. Nanomedicine. 2015;10:299-320
14. Lee Dong Y, Kim Jin Y, Lee Y, Lee S, Miao W, Kim Hyeon S. et al. Black Pigment Gallstone Inspired Platinum-Chelated Bilirubin Nanoparticles for Combined Photoacoustic Imaging and Photothermal Therapy of Cancers. Angew Chem Int Ed. 2017;56:13684-8
15. Lee C, Kim J, Zhang Y, Jeon M, Liu C, Song L. et al. Dual-color photoacoustic lymph node imaging using nanoformulated naphthalocyanines. Biomaterials. 2015;73:142-8
16. Zhen X, Zhang J, Huang J, Xie C, Miao Q, Pu K. Macrotheranostic Probe with Disease-Activated Near-Infrared Fluorescence, Photoacoustic, and Photothermal Signals for Imaging-Guided Therapy. Angew Chem Int Ed. 2018;57:7804-8
17. Lin LS, Song J, Yang HH, Chen X. Yolk-Shell Nanostructures: Design, Synthesis, and Biomedical Applications. Adv Mater. 2018;30:1704639
18. Huang X, Song J, Yung BC, Huang X, Xiong Y, Chen X. Ratiometric optical nanoprobes enable accurate molecular detection and imaging. Chem Soc Rev. 2018;47:2873-920
19. Jiang Y, Upputuri PK, Xie C, Lyu Y, Zhang L, Xiong Q. et al. Broadband Absorbing Semiconducting Polymer Nanoparticles for Photoacoustic Imaging in Second Near-Infrared Window. Nano Lett. 2017;17:4964-9
20. Miao Q, Pu K. Emerging Designs of Activatable Photoacoustic Probes for Molecular Imaging. Bioconjug Chem. 2016;27:2808-23
21. Zhang Y, Jeon M, Rich LJ, Hong H, Geng J, Zhang Y. et al. Non-invasive multimodal functional imaging of the intestine with frozen micellar naphthalocyanines. Nat Nanotechnol. 2014;9:631-8
22. Conceição DS, Ferreira DP, Ferreira LFV. Photochemistry and cytotoxicity evaluation of heptamethinecyanine Near Infrared (NIR) dyes. Int J Mol Sci. 2013;14:18557-71
23. Shi C, Wu JB, Pan D. Review on near-infrared heptamethine cyanine dyes as theranostic agents for tumor imaging, targeting, and photodynamic therapy. J Biomed Opt. 2016;21:50901
24. Shindy HA. Fundamentals in the chemistry of cyanine dyes: A review. Dyes Pigments. 2017;145:505-13
25. Jelley EE. Molecular, Nematic and Crystal States of I: I-Diethyl-Cyanine Chloride. Nature. 1937;139:631-2
26. Würthner F, Kaiser TE, Saha-Möller CR. J-Aggregates: From Serendipitous Discovery to Supramolecular Engineering of Functional Dye Materials. Angew Chem Int Ed. 2011;50:3376-410
27. Julia LB, Yuri LS, Ihor DP, Alexander PD. Fluorescent J-aggregates of cyanine dyes: basic research and applications review. Methods Appl Fluoresc. 2017;6:012001
28. Rotermund F, Weigand R, Penzkofer A. J-aggregation and disaggregation of indocyanine green in water. Chem Phys. 1997;220:385-92
29. Kim G, Huang S-W, Day KC, O'Donnell M, Agayan RR, Day MA. et al. Indocyanine-green-embedded PEBBLEs as a contrast agent for photoacoustic imaging. J Biomed Opt. 2007;12:044020
30. Kirchherr A-K, Briel A, Mäder K. Stabilization of Indocyanine Green by Encapsulation within Micellar Systems. Mol Pharm. 2009;6:480-91
31. Ma Y, Tong S, Bao G, Gao C, Dai Z. Indocyanine green loaded SPIO nanoparticles with phospholipid-PEG coating for dual-modal imaging and photothermal therapy. Biomaterials. 2013;34:7706-14
32. Beziere N, Lozano N, Nunes A, Salichs J, Queiros D, Kostarelos K. et al. Dynamic imaging of PEGylated indocyanine green (ICG) liposomes within the tumor microenvironment using multi-spectral optoacoustic tomography (MSOT). Biomaterials. 2015;37:415-24
33. Lajunen T, Kontturi L-S, Viitala L, Manna M, Cramariuc O, Róg T. et al. Indocyanine Green-Loaded Liposomes for Light-Triggered Drug Release. Mol Pharm. 2016;13:2095-107
34. Sreejith S, Joseph J, Lin M, Menon NV, Borah P, Ng HJ. et al. Near-Infrared Squaraine Dye Encapsulated Micelles for in Vivo Fluorescence and Photoacoustic Bimodal Imaging. ACS Nano. 2015;9:5695-704
35. Dong S, Teo JDW, Chan LY, Lee C-LK, Sou K. Far-Red Fluorescent Liposomes for Folate Receptor-targeted Bioimaging. ACS Appl Nano Mater. 2018;1:1009-13
36. Liu R, Tang J, Xu Y, Zhou Y, Dai Z. Nano-sized Indocyanine Green J-aggregate as a One-component Theranostic Agent. Nanotheranostics. 2017;1:430-9
37. Shakiba M, Ng KK, Huynh E, Chan H, Charron DM, Chen J. et al. Stable J-aggregation enabled dual photoacoustic and fluorescence nanoparticles for intraoperative cancer imaging. Nanoscale. 2016;8:12618-25
38. Song X, Zhang R, Liang C, Chen Q, Gong H, Liu Z. Nano-assemblies of J-aggregates based on a NIR dye as a multifunctional drug carrier for combination cancer therapy. Biomaterials. 2015;57:84-92
39. Song X, Gong H, Liu T, Cheng L, Wang C, Sun X. et al. J-aggregates of organic dye molecules complexed with iron oxide nanoparticles for imaging-guided photothermal therapy under 915-nm light. Small. 2014;10:4362-70
40. Lee H, Mason JC, Achilefu S. Synthesis and Spectral Properties of Near-Infrared Aminophenyl-, Hydroxyphenyl-, and Phenyl-Substituted Heptamethine Cyanines. J Org Chem. 2008;73:723-5
41. Slavnova TD, Chibisov AK, Gorner H. Kinetics of salt-induced J-aggregation of cyanine dyes. J Phys Chem A. 2005;109:4758-65
42. Xiang J, Yang X, Chen C, Tang Y, Yan W, Xu G. Effects of NaCl on the J-aggregation of two thiacarbocyanine dyes in aqueous solutions. J Colloid Interface Sci. 2003;258:198-205
43. Miranda D, Carter K, Luo D, Shao S, Geng J, Li C. et al. Multifunctional Liposomes for Image-Guided Intratumoral Chemo-Phototherapy. Adv Healthc Mater. 2017;6:1700253
44. Peng C, Zheng L, Chen Q, Shen M, Guo R, Wang H. et al. PEGylated dendrimer-entrapped gold nanoparticles for in vivo blood pool and tumor imaging by computed tomography. Biomaterials. 2012;33:1107-19
45. Keca JM, Valic MS, Cheng MHY, Jiang W, Overchuk M, Chen J. et al. Mixed and Matched Metallo-Nanotexaphyrin for Customizable Biomedical Imaging. Advanced Healthc Mater. 0. 1800 857
46. Cui J, De Rose R, Alt K, Alcantara S, Paterson BM, Liang K. et al. Engineering Poly(ethylene glycol) Particles for Improved Biodistribution. ACS Nano. 2015;9:1571-80
47. Huang H, Lovell JF. Advanced Functional Nanomaterials for Theranostics. Adv Funct Mater. 2016;27:1603524
48. Xia J, Kim C, Lovell JF. Opportunities for Photoacoustic-Guided Drug Delivery. Curr Drug Targets. 2015;16:571-81
49. Lee D, Beack S, Yoo J, Kim SK, Lee C, Kwon W. et al. In Vivo Photoacoustic Imaging of Livers Using Biodegradable Hyaluronic Acid-Conjugated Silica Nanoparticles. Adv Funct Mater. 0. 1800 941
50. Rieffel J, Chitgupi U, Lovell JF. Recent Advances in Higher-Order, Multimodal, Biomedical Imaging Agents. Small. 2015;11:4445-61
51. Xu M, Wang LV. Universal back-projection algorithm for photoacoustic computed tomography. Phys Rev E. 2005;71:016706
Author contact
![]() Corresponding author: jflovelledu
Corresponding author: jflovelledu