13.3
Impact Factor
Theranostics 2018; 8(22):6121-6131. doi:10.7150/thno.29070 This issue Cite
Research Paper
High performance immunochromatographic assay for simultaneous quantitative detection of multiplex cardiac markers based on magnetic nanobeads
1. Zhujiang Hospital, Southern Medical University, 253 Gongye Road, Guangzhou, Guangdong 510280, China.
2. Department of Instrument Science and Engineering, School of Electronic Information and Electrical Engineering, Shanghai Jiao Tong University, Shanghai Engineering Research Center for Intelligent diagnosis and treatment instrument, Key Laboratory of Thin Film and Microfabrication (Ministry of Education), Shanghai 200240, China.
3. Shanghai Institute of Microsystem and Information Technology, Chinese Academy of Sciences, Shanghai 200050, China.
4. School of Naval Architecture, Ocean & Civil Engineering, Shanghai Jiao Tong University, Shanghai 200240, China.
5. Lufeng People's Hospital, 43 Chengdong Avenue, Lufeng, Guangdong 516500, China.
Received 2018-8-7; Accepted 2018-10-19; Published 2018-11-29
Abstract

The detection of cardiac markers is critical to the diagnosis of acute myocardial infarction, and immunochromatographic assays are a common tool for point-of-care analysis.
Methods: We report a multiplexed lateral flow test strip for simultaneous quantitative detection of cardiac troponin I (cTnI), creatine kinase isoenzyme MB (CKMB), and myoglobin (Myo). Hydrophilic, monodisperse, stable, and carboxyl-modified (COOH-) magnetic nanobeads (MNBs) were used to construct immunomagnetic probes specific to the three cardiac markers. The detection area of the sandwich-style complexes contained three test lines for cTnI, CKMB, and Myo. The magnetic signal intensity of the detection area in the nitrocellulose membrane was measured via a magnetic immunochromatography reader developed in house.
Results: To optimize the assay, a modified working buffer was also investigated to improve the detection sensitivity, decrease the background noise, and shorten the detection time. The MNB-based immunochromatography test (MICT) strip offers a wide linear dynamic detection range, rapid detection, high sensitivity, and specificity. The limit of detection was 0.0089 ng/mL for cTnI, 0.063 ng/mL for CKMB, and 0.05 ng/mL for Myo with minimal cross-reactivity. There were 110 clinical human serum samples that were used to evaluate this platform with high correlation.
Conclusion: MICT shows great potential as a supplemental method for in vitro diagnostics in the laboratory or in other point-of-care testing (POCT) applications.
Keywords: magnetic nanobeads, immunochromatography, POCT, cardiac markers
Introduction
Acute myocardial infarction (AMI) is the onset of pathological myocardial ischemic necrosis and it is a life-threatening emergency due to its rapid onset, high fatality rate, and poor prognosis. Limited data have shown that more than 8 million people over 40 years of age experienced AMI in 2010; this number is expected to increase to 16 million by 2020 [1]. An AMI diagnosis is determined according to persistent chest pain or other symptoms of myocardial ischemia accompanied with ST-segment elevation of electrocardiogram (ECG). Here, myocardium reperfusion should be performed within 120 min of symptom onset to ensure a favorable prognosis [2]. However, the ECG auxiliary examination cannot accurately diagnose AMI in some cases because ST-segment deviation could occur in other diseases, including acute pericarditis, left ventricular hypertrophy (LVH), and left bundle branch block (LBBB). Moreover, non-ST-segment elevation myocardial infarction, unstable angina pectoris, and some super-early stage AMI onsets do not show an ECG ST deviation [2, 3].
Some sensitive and specific cardiac markers, such as cardiac troponin I (cTnI), creatine kinase isoenzyme MB (CKMB), and myoglobin (Myo), can help detect/diagnose AMI when myocardial ischemia is suspected for non-ST segment deviation ECG manifestation [3, 4]. At the preliminary stage of AMI, Myo—a small oxygenation hemoprotein (17 kDa) present in myocardia and skeletal muscle cells—is released into the blood within 1 h and peaks after 6 hours [5]. CKMB is a small-molecule protein (86 KDa) 98% expressed in myocardium cell that is released from ischemic cells within 4 h with a peak at about 24 h [6]. The CKMB biomarker not only helps to diagnose AMI but also reflects the extent of disease and assesses prognosis. cTnI is specifically expressed in myocardium cells (23 kDa) and is the gold standard for the diagnosis of myocardium necrosis [7]. The release time of cTnI is similar to CKMB reaching a peak within 48 h. Myocardial infarction can be accessed via the concentration of these three markers. Considering the narrow therapeutic time windows of AMI, rapid, sensitive, and quantitative detection of these three markers can reduce mortality and evaluate prognosis.
Immunochromatography tests (ICT) are one of the most common technologies for AMI POCT detection. They are fast with low costs, low sample volumes, and quantitative determination [8]. In recent years, cardiac biomarker detection via ICT has become a popular research area. Some ICT assays use colloidal gold [9], fluorescent dyes [10, 11], fluorescent microsphere [12], SERS materials [13], up-conversion particles [14], and magnetic nanobeads [15] as probes. However, the utility of colloidal gold is hindered by the low sensitivity and narrow dynamic range [16], while fluorescence detection via quantum dot and up-conversion materials is limited by high background noise and fluorescence quenching [17]. Most studies only detected one or two markers in a single strip. Magnetic nanobeads (MNBs) show great potential for applications in ICT technology due to their high signal to noise ratio, large total surface area for antibody coupling, magnetic enhancement, and large dynamic range [18]. Most ICTs use colloidal gold or fluorescent dyes as probes—they only detect optical signal from the top 10 μm of the NC membrane. Using MNB as probes for ICT can collect the entire magnetic signal from the 100 μm-thick strips to improve sensitivity 10- to 1000-fold [19]. In our previous studies and other relevant reports [20], there are some adverse factors that restrict the application of MNBs, including self-aggregation after antibody coupling, high background noise due to nonspecific reaction, and the need for special magnetic signal detection tools.
Here, antibody-conjugated MNB immunomagnetic probes were developed to simultaneously measure cTnI, CKMB, and Myo via MICT. The magnetic signal intensity of the nitrocellulose (NC) membrane was measured with a magnetic immunochromatography reader developed in our lab. To obtain optimal results, a modified working buffer was also used to facilitate the detection sensitivity and reduce detection time. The results proved that this MICT provides easy, rapid, and simultaneous quantitative detection of cTnI, CKMB, and Myo. This paves the way for multi-biomarker MICT assay development.
Methods
Materials
Carboxylic-MNBs were provided by Biomag Biotechnology Co., Ltd., (Jiangsu, China). The conjugate pad (Ahlstrom 8964), sample pad (SB06), adsorbent pad, polyvinyl chloride plate, and the NC membrane (Millipore 135) were provided by JieNing Biological Technology Co., Ltd., (Shanghai, China). Goat anti-mouse IgG antibodies were obtained from Shanghai JieYi Biotechnology Co., Ltd., (Shanghai China). The mouse anti-cTnI antibodies (4T21-16A11 and 4T21-19C7) were purchased from HyTest Ltd., (Turku, Finland). Recombinant human cardiac troponin I protein (ab207624) was purchased from Abcam Company (UK). The mouse anti-Myo antibodies (10M-50C and 10-M50D), Myo protein (30R-3022), mouse anti-CKMB antibodies (10-1363 and 10-1064), and CKMB protein (30-1082) were purchased from Fitzgerald Industries International (MA, USA). The BCA protein assay kit was purchased from Beyotime Institute of Biotechnology, (Shanghai, China). Bovine serum albumin (BSA), 1-ethyl-3-(3-dimethyllaminopropyl)-carbodiimide hydrochloride (EDC), N-hydroxy-succinimide (NHS) and 2-(N-morpholino) ethanesulfonic acid (MES) were purchased from Aladdin (Los Angeles, CA, USA).
Instruments
A 120kV biology transmission electron microscope (TEM) (FEI, USA) and JSM-7800F Prime Schottky field emission scanning electron microscopy (SEM) (JEOL, Japan) were used to characterize the morphology of the MNBs and NC membrane. A UV-visible spectrometer 50 Coach VARIAN (VARIAN Inc, USA) was used to verify antibody conjugation. A MULTISKAM MK3 (Thermo, USA) was used to measure the unconjugated antibody concentration. Antibodies were immobilized onto the NC membrane with an XYZ dispensing system (XYZ3060) (BioDot, USA).
Preparation of immunomagnetic probes for cardiac markers
The probes were prepared according to a previously published report [19] with slight modifications. The detailed procedures are as follows: 1 mg MNBs was dissolved in 250 µL MES buffer (50 mM pH 5.5) with 10 min ultrasonic processing. Then, 2 mg of EDC and NHS were mixed with the MNBs for activation. After activation for 20 min at room temperature, the excess EDC and NHS were removed via magnetic separation. Subsequently, 80 µg cTnI antibodies (Cat: 16A11, HyTest), 60 µg CKMB antibodies (Cat: 1063, Fitzgerald), or 50 µg Myo antibodies (Cat: 10-M50D, Fitzgerald) were added to the activated MNBs solution (5 mM borate buffer solution (BBS), pH 9), respectively. The MNBs solution was mixed with rotation for 3 h at 35°C, then allowed to stand overnight at room temperature. The supernatant was tested with the BCA assay, and the remaining functional groups were blocked (5 mM BBS, 5% BSA, pH 7.4) for 1 h. Finally, the immunomagnetic probes were resuspended in buffer (5 mM BBS, 0.1% BSA, 0.05% Tween-20) at 4°C before use.
Assembly of the magnetic lateral flow strip
The MICT strip consists of four parts: the sample pad, conjugate pad, NC membrane, and absorbent pad. The sample pad and conjugate pad were pretreated with buffer following a previous method [21]. These four parts were pasted onto a polyvinyl chloride plate with 1-2 mm overlap of each component. The cTnI (19C7, 2 mg/mL), CKMB (10-1364, 2 mg/mL), Myo antibodies (10-M50C, 1 mg/mL), and goat anti-mouse IgG antibody (1 mg/mL) were immobilized on the NC membrane with 4-mm intervals designated as test line 1 (T1), test line 2 (T2), test line 3 (T3), and control line (C line) by the XYZ dispensing system. The assembly was cut into 4-mm-wide individual strips and stored at room temperature inside a sealed plastic bucket with a desiccant until use.
MICT strip reader (MIR) system
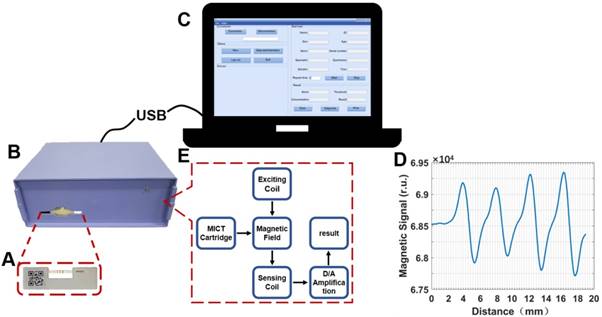
The MIR system was developed to quantify the magnetic signals of each test line and control line. Figure 1 shows that the MIR system consists of three components: the MICT cartridge (Figure 1A), MIR apparatus (Figure 1B), and operating program (Figure 1C). The internal core of the MIR (Figure 1E) consists of a magnetic core, excitation coil, and two parallel sensing coils. The excitation coil could excite the magnetic core to generate an electromagnetic field. When the MICT cartridge was inserted into the MIR apparatus, two parallel sensing coils monitored perturbations of the electromagnetic field caused by the MNBs on T and C lines. The variation value was positively correlated with the amount of MNBs captured on the detection area. The operating program transformed the variation value into magnetic signal after differential amplification (Figure 1D) establishing a relationship between the amount of MNBs and the magnetic signal value.
Schematic diagram of the MIR system. (A) MICT cartridge. (B) MIR apparatus. (C) Software platform. (D) Magnetic signal result. (E) Operating principle of MIR.
Clinical samples
This study was approved by the Medical Ethics Committee of the Southern Medical University, Guangzhou, China. Here, 110 serum samples were provided from Zhujiang Hospital, Southern Medical University and stored at -80°C for further use. An electrochemiluminescence immunoassay assay (ECLIA) was used for independent measurements of cTnI, CKMB, and Myo.
Assay Procedure
First, 80 μL of sample or pretreated serum was mixed with 4 µL of cTnI, CKMB, and Myo probes for 10 min of pre-incubation. Probes were enriched with an external magnet, and 80 µL of the supernatant was discarded. The probes were re-dispersed and dripped onto the conjugated pad. Then, 80 µL of the working buffer was pipetted onto the sample pad to facilitate probe migration along the strip by capillary action. After 10 min, another 30 µL of working buffer was applied to wash the background for 3 min. The strip was installed with a cartridge and inserted into the MIR apparatus for T and C line magnetic signals detection. By substituting the obtained T/C value into the calibration curve, the corresponding concentration of analytes can be obtained.
Statistical analyses
Three replicates were performed for each experiment. The data are presented as the mean ± standard deviation. Statistical consistency was evaluated with a McNemar's Test with statistical significance set at P < 0.01. All of the data were analyzed by SPSS 20.0 software, and diagrams were generated with Origin Lab 8.5.
Results and discussion
Principle of MICT
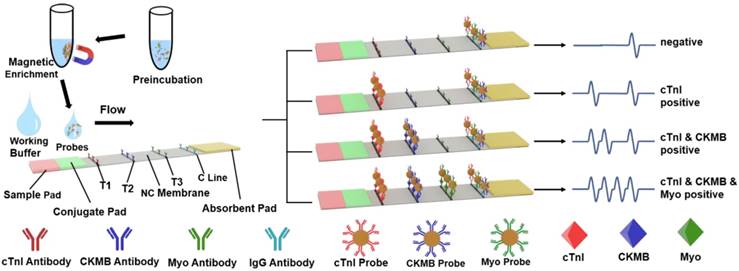
Figure 2 shows the principle of MICT—it is based on a sandwich-type immunoassay. The capture antibodies were immobilized at the T1, T2, T3, and C lines of the NC membrane; detected antibodies were conjugated on the surface of the MNBs creating three cardiac marker probes. Probes were incubated with cardiac markers to form a complex and loaded onto the conjugate pad. The strip allowed the probe complexes to migrate along the absorption pad in the liquid phase. As a result, all of the complexes sequentially flowed through the T1, T2, and T3 lines and were bound by capture antibodies completing the antibody sandwich and leading to a positive result. Ultimately, unbound probes were captured by the IgG antibody at the C line. If there were no markers in the sample, then the result is negative. When the reaction was complete (usually 15-20 min), the test strip was packed in a cartridge and inserted into the MIR to measure and interpret the magnetic signal of the T and C lines. Standard curves were plotted using the proportional relationship between the concentration of cardiac markers and the T/C intensity.
Characterization of probes and strip
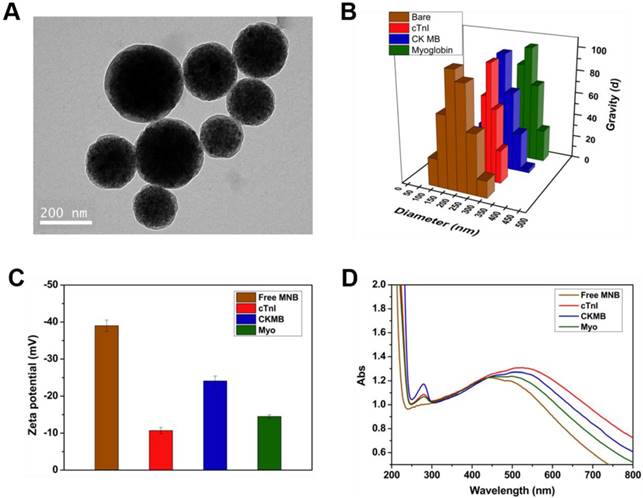
The diameter, dispersion, and stability of the probes could significantly influence the sensitivity, specificity, and reaction time of the MICT. Therefore, probe characterization studied the morphology and antibody conjugation. TEM (Figure 3A) samples prepared by the negative staining method revealed monodisperse probes with a uniform core-shell structure and size (180 nm diameter) after antibody conjugation. Meanwhile, dynamic light scattering (DLS) showed that the hydrodynamic diameter of the free MNBs was 198 nm with a diameter that increased to 285 nm, 278 nm, and 334 nm after antibody conjugation of cTnI, CKMB, and Myo, respectively (Figure 3B). The zeta potential of free MNBs was -39 mV suggesting that the carboxyl groups on the modified MNBs surfaces offered electrostatic repulsion to prevent probe aggregation. The zeta potential increased to -24.1 mV for cTnI, -14.5 mV for CKMB, and -10.7 mV for Myo, respectively (Figure 3C). The changes in diameter and zeta potential implied that the surface carboxyl sites were successfully occupied by antibodies. An ultraviolet spectrophotometer was used to confirm the conjugation of the MNBs and antibodies. Ultraviolet absorption peaks at 280 nm appeared for all three probes (Figure 3D) after antibody conjugation; the 280 nm absorption peak of free MNBs was absent.
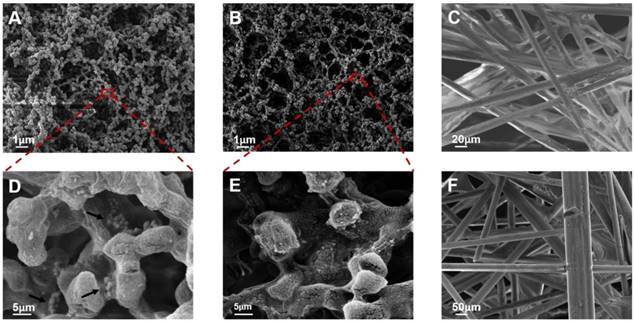
The structure of the pads and membrane was characterized by SEM. The NC membrane had a uniform porous structure with approximately 8-μm pores (Figure 4A and 4B), which ensured that the probes flowed smoothly and had adequate time for interaction with the probe-antigen complex and capture antibodies. The test line revealed that the probes could bind to the NC membrane when the biomarkers were present (Figure 4D). No probe residue was found at the T line for a negative result (Figure 4E) implying that the background signal of the T line was negligible. The sample pad was a solution cushion and consisted of an irregular mesh screen structure composed of glass cellulose with a diameter of 50 to 100 μm by SEM (Figure 4F). Solidified salt crystals and proteins attached to the surface of the glass fiber could re-dissolve to increase the ionic strength of the liquid and strengthen the flow blocking effect. The conjugate pad (Figure 4C) had a denser structure than the sample pad with pore diameters of 20-50 μm. The structure of the conjugate pad ensured that the probe released smoothly into the NC membrane. It can also slow the flow of the sample solution and stabilize longitudinal release of probes into the NC membrane.
Schematic illustration of MICT detection of cTnI, CKMB and Myo.
Characterization of Probes. (A) TEM image of probes. (B) Dynamic light scattering (DLS) result of free MNBs and three probes. (C) Zeta potential of free MNBs and three probes. (D) Ultraviolet spectrophotometer determination of free MNBs and three probes.
Optimization of immunomagnetic probes
According to the principle of MICT, the probes' capacity to capture cardiac markers determines the detection sensitivity of the assay and is closely related to the amount of conjugated antibody on the probe surface. To determine the optimal antibody loading, different amounts of the three antibodies (cTnI, CKMB, and Myo) were added to the activated MNBs. The concentration of the unconjugated antibody was measured via a BCA test kit. When an adequate concentration (100 ng/mL) of the three cardiac markers was used for testing, the ratio of T and C first increased firstly and tends to be stabilized (cTnI and CKMB) or declined (Myo) with increasing introduced antibodies amount (Figure 5A). The results indicated that the efficiency of MNB-antibody conjugation reached saturation point.
SEM characterization of NC membrane for positive result (A and D), negative result (B and E), conjugate pad (C) and sample pad (F). The black arrows in Figure 4D indicated that the probes were bound on the test line.
(A) Relationship of introduced antibody and sensitivity. (B) Calibration curve of BCA kit test and the conjugated antibodies effect of probes. The conjugated amount was derived from original concentration minus BCA measured supernatant concentration.
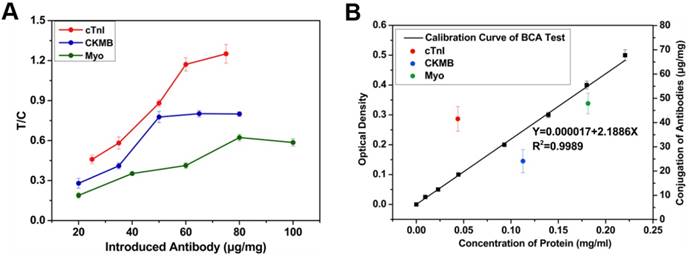
High loading levels prevented binding with target due to steric hindrance—this decreased sensitivity [22]. Thus, 60, 50, and 80 μg were selected for cTnI, CK-MB, and Myo antibody, respectively. To determine the reproducibility and precision of antibody conjugation, the conjugation effect between antibodies and MNBs were evaluated in 5 batches via BCA assay (Figure 5B); the conjugation rate was the conjugated antibodies divided by the introduced antibodies—this was 48.2% to 69.8% with a standard deviation of less than 6%.
Development of the working buffer
In our preliminary study, the probes were monodisperse, stable, and with high antibody conjugation. Nevertheless, a small amount of the probes could not be released from the conjugate pad or the flow stopped at the initial terminal of the NC membrane when using PBS or Tris buffer. These residual probes could decrease the signal of the T line as well as the sensitivity of the MICT assay. Moreover, the result had a slight false positive and a high background during detection of a negative sample. These limitations were attributed to the incubation and magnetic enrichment steps, which accelerated the aggregation of probes and led to nonspecific reactions at the T line. To correct this problem, a new working buffer was investigated.
BSA and glycine were used to block the non-specific sites of MNBs and minimize non-specific reactions with the NC membrane during incubation. Sucrose promoted the hydrophilicity of the NC membrane and enhanced the antibody-antigen reactions. Tween-20 made the probes more hydrophilic and monodisperse, and it facilitated probe release and lateral flow. Different concentrations of the reagents arranged and combined to optimize the working buffer (10 mM PBS pH 7.4 buffer, 2% BSA, 0.1% glycine, 0.1% Tris base, and 1% Tween-20).
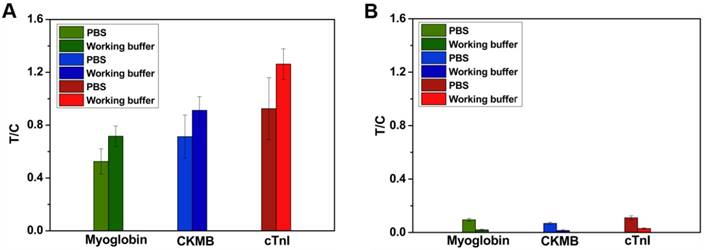
Positive and negative samples were diluted with working buffer and analyzed by MICT. The T/C assessed the accuracy of the assay. Figure 6A shows that the T/C increased from 1.33879 ± 0.00183 to 1.79854 ±0.00225 in positive samples (100 ng/mL cTnI). In negative samples (Figure 6B), the T/C decreased from 0.10346 ± 0.00134 to 0.00984 ± 0.00109. The results indicate that the working buffer increased sensitivity and decreased background MICT signal. The probes could stop at the broadside edges of the NC membrane during pure serum detection. The probes in undetected areas of the NC membrane could interfere with the magnetic field leading to inaccurate results. However, no similar results were found in working buffer-diluted serum. As expected, the total analysis time decreased from 20 min to 13 min with the use of this working buffer.
Analytical performance of MICT
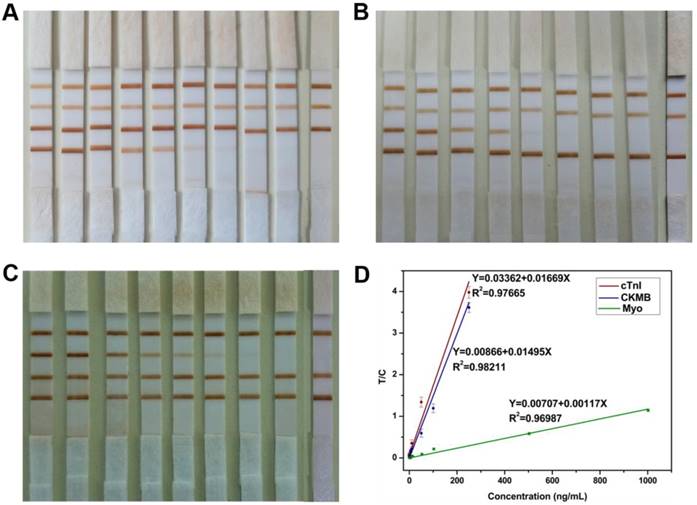
Since the probes and strips were fabricated and the working buffer was used to improve the MICT performance, three cardiac markers were used to verify the quantitative performance of MICT. A series of cTnI samples (0.05-250 ng/mL) were mixed with a constant concentration of CKMB and Myo (100 ng/mL) in working buffer. After testing the samples, the results (Figure 7A) showed that the color intensity of T1 decreased with the cTnI marker concentration diluted, and no visible band emerged at T1 for the lowest concentration sample. Meanwhile, the results of the T2 and T3 for CKMB and Myo did not significantly change. The same phenomenon was observed for CKMB and Myo samples (Figure 7B-C). In the expected threshold value of these three markers (0.5 ng/mL for cTnI, 5 ng/mL for CKMB, and 50 ng/mL for Myo), visible bands appeared at the test lines, which indicated that the MICT performed well even without the MIR equipment. The LOD by naked eye was 0.5 ng/mL for cTnI, 5 ng/mL for CKMB, and 5 ng/mL for Myo [23].
For quantitative detection, the magnetic signal of each sample was measured three times, and the corresponding magnetic signals at the test and control lines were measured by the MIR system. Calibration curves and linear regression analysis results for the three markers are shown in Figure 7D. Before sensitivity evaluation, 20 cardiac marker-free samples were tested to determine the blank (background). The LOD was defined as three-fold the background signal; the lower limit of quantitation (LLOQ) was 10 times the blank [24]. Linear dynamic detection range was limit between LLOQ and upper limit quantitation (ULOQ) [25]. The LOD of three markers were 0.0089 ng/mL for cTnI, 0.063 ng/mL for CKMB, and 0.05 ng/mL for Myo. The three cardiac markers had a wide linear dynamic range of about four orders of magnitude: 250-0.03 ng/mL for cTnI, 250-0.21 ng/mL for CKMB, and 1000-0.17 ng/mL for Myo. The CV of LLOQ and ULOQ were 15%. The correlation coefficient R was approximately 0.99 for each marker. The results confirmed that MICT could be used for quantitative detection of three cardiac markers with a wide linear dynamic range and high sensitivity. However, the negative serum was expensive, and this linear dynamic range and sensitivity were obtained with working buffer-based calibration solutions rather than negative serum [26].
Endogenous cross-reactivity of MICT
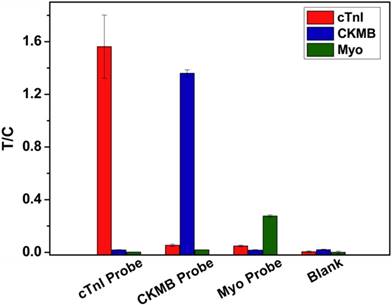
To verify the endogenous cross-reactivity of MICT, each cardiac marker probe was incubated with composite cardiac marker samples (100 ng/mL cTnI, 100 ng/mL CKMB, and 200 ng/mL Myo) and applied into the strip for testing. Figure 8 compares the T/C of the three T lines. For analysis of the cTnI probe, the T/C of T1 was significant, while the T/C of T2 and T3 were nearly equal to background intensity suggesting that the cross-reactivity between the cTnI probe and CKMB or Myo markers is negligible. This result also showed that the non-specific binding of the probe to the capture antibody is essentially zero. The other two probes had similar results.
(A) MICT result of positive sample using PBS and working buffer dilution. (B) MICT result of negative sample using PBS and working buffer dilution.
(A) Detection result of a series concentration of cTnI samples (250, 100, 50, 10, 5, 1, 0.5, 0.1, 0.05 and 0 ng/mL) mixed with constant concentration of CKMB and Myo (100 ng/mL) in working buffer. (B) Detection result of a series concentration of CKMB samples (250, 100, 50, 10, 5, 1, 0.5, 0.1 and 0 ng/mL) mixed with constant concentration of cTnI and Myo (100 ng/mL) in working buffer. (C) Detection result of a series concentration of Myo samples (1000, 500, 100, 50, 10, 5, 1, 0.5 and 0 ng/mL) mixed with constant concentration of cTnI and CKMB (100 ng/mL) in working buffer. (D) Calibration curves for simultaneous detection of three kinds of samples.
Endogenous cross-reactivity of MICT.
Clinical sample examination of MICT
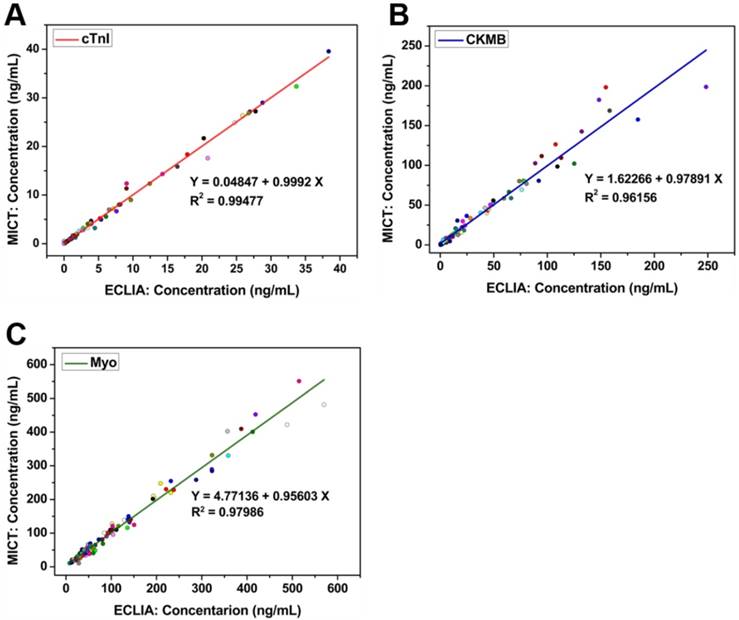
To assess the clinical practicability and effectiveness of MICT, 110 clinical serum samples (previously quantified by ECLIA) were analyzed via the cardiac MICT, and the corresponding concentrations were obtained. Regression and correlation statistics were used to evaluate the two methods. The Pearson correlation coefficient (R) was 0.994 for cTnI, 0.981 for CKMB, and 0.99 for Myo; the slope of each regression equation was close to 1 indicating excellent correlation between the two methods (Figure 9A-C). In other words, the ability of MICT to quantitatively detect three cardiac markers simultaneously was similar to ECLIA but with faster analysis time, low cost, and easy operation. A spiked recovery experiment verified the accuracy of MICT. Different concentrations of cTnI (10, 1, and 0.1 ng/mL), CKMB (50, 10, and 1 ng/mL), and Myo (100, 10, and 1 ng/mL) were spiked into serum samples (0.15 ng/mL for cTnI, 0.82 ng/mL for CKMB and 33.28 ng/mL for Myo). The result is illustrated in Table 1. The recovery rates for the spiked sample were 95.40%-101.36%, 97.8%-105.4%, and 95.9%-103.9% for cTnI, CKMB, and Myo, respectively (n= 5). The relative standard deviations (RSD) were all lower than 10%. The results are very close to the spiked concentration, which confirms the assay's reliability.
Spiked recovery of cardiac markers by MICT (n=5).
| Sample | cTnI (0.15 ng/mL) | CMKB (0.83 ng/mL) | Myo (33.28 ng/mL) | ||||||
|---|---|---|---|---|---|---|---|---|---|
| Added (ng/mL) | 10 | 1 | 0.1 | 50 | 10 | 1 | 200 | 50 | 1 |
| Found (ng/mL) | 9.872 | 1.148 | 0.245 | 50.381 | 10.614 | 1.884 | 241.144 | 82.113 | 34.220 |
| Recovery (%) | 97.216 | 101.360 | 95.400 | 99.101 | 97.836 | 105.360 | 103.932 | 97.666 | 95.940 |
| RSD (%) | 4.359 | 5.417 | 7.088 | 5.550 | 6.518 | 5.311 | 5.550 | 6.518 | 5.311 |
Recovery rate=(Found-Sample)/Added × 100%; RSD: relative standard deviations.
Regression and correlation statistics result between MICT and ECLIA for cTnI (A), CKMB (B) and Myo (C), respectively.
FICT*MICT crosstabulation of cardiac markers detection.
| FICT | Total | Significance of McNemar Test | Symmetric Measures | ||||
|---|---|---|---|---|---|---|---|
| Negative | Positive | kappa Value | Significance | ||||
| cTnI*MICT | Negative | 13 | 1 | 14 | 1 | 0.842 | 0 |
| Positive | 2 | 26 | 28 | ||||
| Total | 15 | 27 | 42 | ||||
| CKMB*MICT | Negative | 13 | 0 | 13 | 0.5 | 0.893 | 0 |
| Positive | 2 | 27 | 29 | ||||
| Total | 15 | 27 | 42 | ||||
| Myo*MICT | Negative | 21 | 1 | 22 | 1 | 0.856 | 0 |
| Positive | 2 | 18 | 20 | ||||
| Total | 23 | 19 | 42 | ||||
FICT: fluorescence immunochromatography test; MICT: magnetic nanobeads based immunochromatography test.
Comparison in different reports of triplex cardiac markers simultaneous detection methods.
| Author | Dynamic detection range | Material | Duration |
|---|---|---|---|
| Jung-Hwan Choa, Min-Hakima, etc. [10] | 0.05-25 ng/mL (cTnI) | Alexa Fluor 647 dye | 20 min |
| 0.2-100 ng/mL (CKMB) 2-1000 ng/mL (Myo) | |||
| DiZhang, LiHuang, etc. [13] | 0.01-50 ng/mL (cTnI) | AgNBA@Au SERS probes | 45 min |
| 0.02-90 ng/mL (CKMB) | |||
| 0.01-500 ng/mL (Myo) | |||
| Tae Kyum Kim, Sang Wook Oh, etc. [11] | 0.01-50 ng/mL (cTnI) | Alexa Fluor 647 dye | 17 min |
| 1-100 ng/mL (CKMB) | |||
| 1-500 ng/mL (Myo) | |||
| Choi DH, Lee SK, etc. [9] | 0.01-30 ng/mL (cTnI) | Gold nanoparticles | 10 min |
| Cai Y, Kang K, etc. [12] | 0.087-40 ng/mL (cTnI) | Fluorescent Microspheres | 15 min |
| Sirkka N, Lyytikäinen A, etc. [14] | 0.00314-50 ng/mL (cTnI) | Upconverting nanophosphors | 15 min |
| Xu Q, Xu H, etc. [15] | 0.01-1000 ng/mL (cTnI) | Magnetic bead | 15 min |
| Our MICT | 0.05-250 ng/mL (cTnI) 0.1-250 ng/mL (CKMB) | Magnetic bead | 25 min |
| 0.1-1000 ng/mL (Myo) |
Next, to compare the efficiency of rapid commercial fluorescence ICT (FICT) kits, we measured 42 clinical serum samples. FICT is the most widely used and mature rapid detection method. A paired chi-square test was conducted, and the threshold values for positive diagnosis were 0.5 ng/mL for cTnI, 5 ng/mL for CKMB, and 50 ng/mL for Myo (Table. 2). All of the McNemar[27] values were significantly greater than 0.05. The kappa score of MICT and FICT were 0.842 for cTnI, 0.893 for CKMB, and 0.856 for Myo, p < 0.01. All of the kappa scores were greater than 0.75 [28], which indicates excellent agreement between both methods. Additionally, there was no significant difference between the two methods. However, the FICT dynamic detection range was narrower than MICT: 0.1-100 ng/mL vs. 0.03-250 ng/mL for cTnI, 0.21-80 ng/mL vs. 0.17-250 ng/mL for CKMB, and 1-400 ng/mL vs. 0.1-1000 ng/mL for Myo respectively. Thus, the MICT shows great potential for rapid, quantitative, highly sensitive, and specific detection of cardiac markers.
Other reports also describe multiplex detection of these three cardiac markers and were compared to our work (Table. 3). The dynamic detection range is narrower than MICT. MICT has great potential as a supplemental tool for POCT applications.
Conclusion
In this study, a magnetic nanobead-based strip and supporting MIR system were developed successfully for the simultaneous and quantitative detection of cTnI, CKMB, and Myo. A modified working buffer was also investigated to improve the detection sensitivity, decrease the background noise, and shorten the detection time. The linear dynamic range of the MICT assay was 0.03-250 ng/mL for cTnI, 0.21-250 ng/mL for CKMB, and 0.17-1000 ng/mL for Myo; these values are well within the clinical concentration range. The LOD values were 0.0089 ng/mL for cTnI, 0.063 ng/mL for CKMB, and 0.05 ng/mL for Myo. We believe that in other areas of POCT applications, such as environmental monitoring and toxicology testing, which require handling of large number of samples, MICT can more effectively exert its magnetic enrichment to improve detection sensitivity. Future optimization of this approach will be to decrease the pre-incubation time to the minimum.
Abbreviations
AMI: acute myocardial infarction; BBS: borate buffer solution; BSA: bovine serum albumin; C line: control line; CKMB: creatine kinase isoenzyme MB; COOH-: carboxyl-modified; cTnI: cardiac troponin I; ECG: electrocardiogram; ECLIA: electrochemiluminescence immunoassay assay; EDC: 1-ethyl-3-(3-dimethyllaminopropyl)-carbodiimide hydrochloride; FICT: fluorescence immunochromatography test; ICT: immunochromatography test; LBBB: left bundle branch block; LLOQ: lower limit of quantitation; LVH: left ventricular hypertrophy; MES: 2-(N-morpholino) ethanesulfonic acid; MICT: magnetic nanobeads based immunochromatography test; MIR: magnetic nanobeads based immunochromatography test strip reader; MNBs: magnetic nanobeads; Myo: myoglobin; NC: nitrocellulose; NHS: N-hydroxy-succinimide; POCT: point-of-care testing; SEM: scanning electron microscopy; RSD: relative standard deviations; T1: test line 1; T2: test line 2; T3: test line 3; TEM: transmission electron microscope; ULOQ: upper limit of quantitation.
Acknowledgements
We are grateful for the financial support by the National Natural Science Foundation of China (Grant Nos. 81571835, 81672247, and 61503246), The National Key Research and Development Program of China (Grant No. 2017FYA0205300), National Key Basic Research Program (973 Project) (No.2015CB931802), Shanghai Science and Technology Fund (No.15DZ2252000).
Competing Interests
The authors have declared that no competing interest exists.
References
1. The world bank: toward a healthy and harmonious life in china: stemming the rising tide of non-communicable diseases. Revised July 26, 2011. http://www.worldbank.org/en/news/feature/2011/07/26/toward-health-harmonious-life-china-stemming-rising-tide-of-non-communicable-diseases
2. Ibanez B, James S, Agewall S, Antunes MJ, Bucciarelli-Ducci C, Bueno H. et al. 2017 ESC guidelines for the management of acute myocardial infarction in patients presenting with ST-segment elevation: the task force for the management of acute myocardial infarction in patients presenting with ST-segment elevation of the european society of cardiology (ESC). Eur Heart J. 2018;39:119-77
3. Thygesen K, Alpert JS, Jaffe AS, Simoons ML, Chaitman BR, White HD. et al. Third universal definition of myocardial infarction. Eur Heart J. 2012;33:2551-67
4. Fan J, Ma J, Xia N, Sun L, Li B, Liu H. Clinical value of combined detection of CK-MB, MYO, cTnI and plasma NT-proBNP in diagnosis of acute myocardial Infarction. Clin Lab. 2017;63:427-33
5. Plebani M, Zaninotto M. Diagnostic strategies in myocardial infarction using myoglobin measurement. Eur Heart J. 1998;19:N12-5
6. Dohi T, Maehara A, Brener SJ, Généreux P, Gershlick AH, Mehran R. et al. Utility of peak creatine kinase-MB measurements in predicting myocardial infarct size, left ventricular dysfunction, and outcome after first anterior wall acute myocardial infarction (from the INFUSE-AMI trial). Am J Cardiol. 2015;115:563-70
7. Hasic S, Kiseljakovic E, Jadric R, Radovanovic J, Winterhalter-Jadric M. Cardiac troponin I: the gold standard in acute myocardial infarction diagnosis. Bosn J Basic Med Sci. 2003;3:41-4
8. Wang K, Qin W, Hou Y, Xiao K, Yan W. The application of lateral flow immunoassay in point of care testing: a review. Nano Biomed Eng. 2016;8:172-83
9. Choi DH, Lee SK, Oh YK, Bae BW, Lee SD, Kim S. et al. A dual gold nanoparticle conjugate-based lateral flow assay (LFA) method for the analysis of troponin I. Biosens Bioelectron. 2010;25:1999-2002
10. Zhang N, Ma Z-Y, Ruan Y-F, Zhao W-W, Xu J-J, Chen H-Y. Simultaneous photoelectrochemical immunoassay of dual cardiac markers using specific enzyme tags: a proof of principle for multiplexed bioanalysis. Anal Chem. 2016;88:1990-4
11. Kim Tae K, Oh Sang W, Hong Soon C, Mok Young J, Choi Eui Y. Point-of-care fluorescence immunoassay for cardiac panel biomarkers. J Clin Lab Anal. 2014;28:419-27
12. Cai Y, Kang K, Li Q, Wang Y, He X. Rapid and sensitive detection of cardiac troponin I for point-of-care tests based on red fluorescent microspheres. Molecules. 2018:23
13. Zhang D, Huang L, Liu B, Ni H, Sun L, Su E. et al. Quantitative and ultrasensitive detection of multiplex cardiac biomarkers in lateral flow assay with core-shell SERS nanotags. Biosens Bioelectron. 2018;106:204-11
14. Sirkka N, Lyytikäinen A, Savukoski T, Soukka T. Upconverting nanophosphors as reporters in a highly sensitive heterogeneous immunoassay for cardiac troponin I. Anal Chim Acta. 2016;925:82-7
15. Xu Q, Xu H, Gu H, Li J, Wang Y, Wei M. Development of lateral flow immunoassay system based on superparamagnetic nanobeads as labels for rapid quantitative detection of cardiac troponin I. Mat Sci Eng C-Mate. 2009;29:702-7
16. Huang X, Aguilar ZP, Xu H, Lai W, Xiong Y. Membrane-based lateral flow immunochromatographic strip with nanoparticles as reporters for detection: a review. Biosens Bioelectron. 2016;75:166-80
17. Sajid M, Kawde A-N, Daud M. Designs, formats and applications of lateral flow assay: a literature review. J Saudi Chem Soc. 2015;19:689-705
18. Wang Y, Xu H, Wei M, Gu H, Xu Q, Zhu W. Study of superparamagnetic nanoparticles as labels in the quantitative lateral flow immunoassay. Mat Sci Eng C-Mate. 2009;29:714-8
19. Lu W, Wang K, Xiao K, Qin W, Hou Y, Xu H. et al. Dual immunomagnetic nanobeads-based lateral flow test strip for simultaneous quantitative detection of carcinoembryonic antigen and neuron specific enolase. Sci Rep. 2017;7:42414
20. Kalidasan V, Liu XL, Herng TS, Yang Y, Ding J. Bovine serum albumin-conjugated ferrimagnetic iron oxide nanoparticles to enhance the biocompatibility and magnetic hyperthermia performance. Nano-Micro Lett. 2016;8:80-93
21. Chen Y, Wang K, Liu Z, Sun R, Cui D, He J. Rapid detection and quantification of tumor marker carbohydrate antigen 72-4 (CA72-4) using a superparamagnetic immunochromatographic strip. Anal Bioanal Chem. 2016;408:2319-27
22. Saha B, Songe P, Evers TH, Prins MW. The influence of covalent immobilization conditions on antibody accessibility on nanoparticles. Analyst. 2017;142:4247-56
23. Penttilä K, Koukkunen H, Kemppainen A, Halinen M, Rantanen T, Pyörälä K, Penttilä I. Myoglobin, creatine kinase MB, troponin T, and troponin I — rapid bedside assays in patients with acute chest pain. Int J Clin Lab Res. 2004;29:93-101
24. Shabir GA. Validation of high-performance liquid chromatography methods for pharmaceutical analysis: understanding the differences and similarities between validation requirements of the US Food and Drug Administration, the US Pharmacopeia and the International Conference on Harmonization. J Chromatogr A. 2003;987:57-66
25. EMAgency. Guideline on bioanalytical method validation. EMA Guideline. 2012;44:1-23
26. Administration USFD: establishing the performance characteristics of in vitro diagnostic devices for the detection or detection and differentiation of influenza viruses - guidance for industry and FDA staff. Document issued on: July 15, 2011 https://. www.fda.gov/MedicalDevices/DeviceRegulationandGuidance/GuidanceDocuments/ucm079171.htm
27. Trajman A, Luiz R. McNemar χ2 test revisited: comparing sensitivity and specificity of diagnostic examinations. Scand. J Clin Lab Inv. 2008;68:77-80
28. Byrt T. How good is that agreement? Epidemiology. 1996;7:561
Author contact
![]() Corresponding author: Kan Wang, wk_xacom Jinghua He, hjh5258com
Corresponding author: Kan Wang, wk_xacom Jinghua He, hjh5258com
 Global reach, higher impact