Impact Factor
 Global reach, higher impact
Theranostics 2018; 8(20):5731-5743. doi:10.7150/thno.28782 This issue Cite
Research Paper
Spatial-Temporal Cellular Bioeffects from Acoustic Droplet Vaporization
Ching-Hsiang Fan, Yi-Ting Lin, Yi-Ju Ho, Chih-Kuang Yeh ![]()
Department of Biomedical Engineering and Environmental Sciences, National Tsing Hua University, Hsinchu, Taiwan
Received 2018-7-26; Accepted 2018-10-16; Published 2018-11-10
Abstract

One of the major challenges in developing acoustic droplet vaporization (ADV)-associated therapy as an effective and safe strategy is the precise determination of the spatial cellular bioeffects after ADV (cell death or cell membrane permeabilization). In this study, we combined high-speed camera imaging and live-cell microscopic imaging to observe the transient dynamics of droplets during ADV and to evaluate the mechanical force on cells.
Methods: C6 glioma cells were co-incubated with DiI-labeled droplets (radius: 1.5, 2.25, and 3.0 μm). We used an acousto-optical system for high-speed bright-field (500 kfps) and fluorescence (40 kfps) microscopic imaging in order to visualize the dynamics of droplets under ultrasound excitation (frequency = 5 MHz, pressure = 5-8 MPa, cycle number = 3, pulse number = 1). Live-cell microscopic imaging was used to monitor the cell morphology, cell membrane permeabilization, and cell viability by membrane-anchored Lyn-yellow fluorescence protein, propidium Iodide staining, and calcein blue AM staining, respectively.
Results: We discovered that the spatial distribution of ADV-induced bioeffects could be mapped to the physical dynamics of droplet vaporization. For droplets with a 1.5 μm radius, the distance threshold for ADV-induced cell death (5.5±1.9 μm) and reversible membrane permeabilization (11.3±3.5 μm) was well correlated with the distance of ADV-bubble pressing downward to the floor (5.7±1.3 μm) and maximum distance of droplet expansion (11.5±2.6 μm), respectively. These distances were enlarged by increasing the droplet sizes and insonation acoustic pressures. The live-cell imaging results show that ADV-bubbles can directly disrupt the cell membrane layer and induce intensive intracellular substance leakage. Further, the droplets shed the payload onto nearby cells during ADV, suggesting ADV could directly induce adjacent cell death by physical force and enhancement of chemotherapy to distant cells.
Conclusion: This study provide new insights into the ADV-mediated physicochemical synergic effect for medical applications.
Keywords: acoustic droplets, ultrasound, acoustic droplet vaporization, cellular bioeffects, high-speed microscopy
Introduction
Perfluorocarbon (PFC) carriers possess a high solubility of oxygen that enables the transport of oxygen to human tissues [1, 2]. The early clinical development of PFC droplets with albumin shell can serve as an ultrasound contrast agent (e.g., heart, kidneys) via pre-activated translation into microscale bubbles prior to injection [3]. Recently, several preclinical researches have shown the potential utility of phospholipid or polymer shells based PFC droplets [4]. The PFC droplet phase change can also be acoustically activated by clinical ultrasound, a process termed acoustic droplet vaporization (ADV). In this scenario, the bubbles generated from PFC droplets can selectively occlude the blood flow of the targeted vasculature, increase the efficiency of ultrasonic ablation, reduce dissolved oxygen, and provide ultrasound contrast signal [5-10]. The occurrence of ADV is usually accompanied by mechanical forces acting on the surrounding tissues, which can increase the permeability of the blood-brain barrier in brain vessels [11]. Currently, by embedding drugs into droplets, ADV can further achieve a physicochemical synergic effect in tumor treatment, releasing anesthetic molecules for transcranial neuromodulation, and delivering payloads from acoustically responsive scaffolds [12-14]. Although the medical application of ADV has been widely explored, the treatment outcomes of the studies have varied. For instance, ADV can be used to destroy tumor vessels, while safely inducing reversible enhancement of cerebral vessel permeability [11, 15, 16]. Inside the tumor, ADV can result in serious cellular damage and eventually cell death, or facilitate cellular drug/gene uptake without leading lethal damage to the cell [17, 18]. These outcomes were heterogeneous because the ADV-induced bioeffects were influenced by several factors, including ultrasound parameters, droplet formulation, and acoustic environment. It had been considered that the rapid formation, expansion and contraction of ADV bubbles would interact with the near cells [1-5]. High pressure or long pulse of ultrasound would enlarge the displacement of ADV bubbles, leading sever cellular membrane deformation and higher irreversible membrane permeabilization rate [16, 19-22]. High pressure or long pulse of ultrasound would enlarge the displacement of ADV bubbles, leading sever cellular membrane deformation and higher irreversible membrane permeabilization rate [16, 20]. The irreversible membrane permeabilization rate increased with increasing droplet concentration and droplet size [20]. The outcome of cell membrane permeabilization also depended on the distance between ADV bubble and cell [20]. However, the spatial cellular bioeffects after ADV and the influence of the droplet-to-cell distance on cellular bioeffects did not be fully elucidated. Understanding the properties and control of the ADV related mechanical bioeffects is critical for the correct application of ADV in various medical applications.
For ADV-mediated cellular bioeffects, the dynamics of droplet vaporization need to be considered. During ADV, two phenomena can yield the mechanical forces responsible for the ADV-induced bioeffects: (1) the rapid volume enlargement during the liquid-gas phase transition within several microseconds [23, 24], as well as (2) the evolution of the ADV-bubble [18, 25, 26]. The momentum of droplet expansion could lead to overexpansion and oscillation of ADV-bubbles, or to recondensation into the liquid droplet state (when the PFC boiling point is higher than ambient temperature) on the microsecond timescale [23, 24, 27, 28]. A recent study observed that endothelial cell monolayer damage increased as the bubble cloud size increased [19], but was limited to the bubble cloud area, suggesting that the ADV-generated bubble may also contribute to cellular damage. However, the effects of droplet ADV on neighboring cells still are not entirely understood. Particularly, a thorough elucidating of the dynamic behavior of ADV bubbles adjacent cells, interactions between ADV bubbles and cell, and related cellular response at the single-cell level is necessary. These issues may be important for controlling and predicting the mechanical bioeffects during ADV-mediated therapy.
To address the mechanisms underlying the cellular bioeffects of droplet vaporization, we coupled a custom-designed, high-speed microscopy system (tens of microsecond resolution) with a second CCD camera (millisecond resolution) to investigate droplet vaporization dynamics and the resulting cellular bio-effect dynamics (membrane permeability enhancement and viability) over their relevant physical timescales. Florescent dye-labeled droplets were co-incubated with C-6 glioma cells. The membrane permeability and viability of each cell after ADV were characterized by the membrane-impermeable fluorescence marker and cell viability tracer under different parameters (droplet-cell distance, acoustic pressure, droplet size). We aimed to identify the spatial distribution and mechanisms underlying the ADV-induced cellular bio-effects.
Methods
Preparation of droplets
Droplets were fabricated with 5 mol % 1,2-distearoyl-sn-glycero-3-phosphoethanolamine-N-[carboxy(polyethylene glycol)-2000] (DSPE-PEG 2000, Avanti Polar Lipids Inc., AL, USA), 94.8 mol % 2-distearoyl-sn-glycero-3-phosphocholine (DSPC, Avanti Polar Lipids Inc.), and 0.2 mol %1,1'-dioctadecyl-3,3,3',3'-tetramethylindocarbocyanine perchlorate (DiI, Sigma Aldrich Co., MO, USA) according to previously reported procedures [29]. The DSPE-PEG 2000, DSPC, and DiI were dissolved in chloroform in a 2-mL vial. The lipid solution was vaporized to remove chloroform and produce a lipid film on the bottom. The lipid film was mixed with 100 μL perfluoropentane (C5F12, boiling point: 29 ˚C) and degassed phosphate-buffered saline (PBS). The solution was sonicated (2510, Bransonic, CT, USA) for 5 min to form DiI-labeled droplets. In order to avoid droplet evaporation, the droplet emulsions were kept at 20°C during sonication. The DiI-labeled droplets suspension was then purified by centrifugation (2 min, 6,000 rpm) and re-suspended with fresh PBS (Figure S1).
High-speed microscopy system
The ADV experiments were conducted by a acousto-optical system for high-speed bright-field and fluorescence microscopy imaging with ultrasound sonication [29]. The imaging system consisted of a microscope (model IX71, Olympus Corp., Tokyo, Japan), a high-speed camera (model FASTCAMSA4, Photron Ltd., Tokyo, Japan) and a water tank. During the experiment, the tank was filled with deionized and degassed water at 37°C. The ultrasound sonication system with an annular 5-MHz focused ultrasound transducer (model SU-128, Sonic Concepts Inc., WA, USA) was confocally aligned with a 40× objective (Carl Zeiss Ltd., Tokyo, Japan). Note that this arrangement ensures that the radial symmetry of the ultrasound intensity distribution is within the microscopic field of view. A waveform generator (model AWG 2005, Tektronix Inc., CA, USA) was used to generate a single three-cycle sinusoidal wave signal that was amplified with a radiofrequency power amplifier (model A150, E&I Ltd., NY, USA) to drive the transducer (peak negative pressure: 5 and 8 MPa). The acoustic pressure was measured using a polyvinylidene difluoride type hydrophone (model HGL-0085, ONDA, Sunnyvale, CA, USA; calibration range = 1-40 MHz; spatial resolution: 85 μm) in an acrylic water tank that was filled with distilled and degassed water at 25°C.
Experimental setup
Experiment A: the dynamic size change, and the downward press of the ADV- bubble
The experimental setup is demonstrated in Fig. 1(A). The ultrasound transducer was aligned with the objective in a face-to-face arrangement. Droplets with a radii of 1.5, 2.25, and 3.0 μm were settled on the bottom of the glass dish and behaved as if they were in contact with a vessel wall. For monitoring the radius change of droplets during ADV, bright-field images were acquired at a capture rate of 500,000 fps. To assess the press downward onto the glass and vesicle release during droplet ADV, bottom-view observations were performed before, during, and after ADV. The printed DiI-lipid complexes appeared as bright spots at capture rates of 1,000 fps by a high-speed fluorescence microscopic imaging system. The laser was operated in burst mode (532 nm, 0.32 mW/μm2, SDL-532-1000T, Dream Lasers Technology, Shanghai, China) for excitation of DiI in the optical plane of focus. The total area of the printing region in each parameter was estimated from the acquired images by Matlab. The printing radius (Pri-R) was evaluated by πr2.
Illustration of (A) glass experimental setup and (B) tube experimental setup.
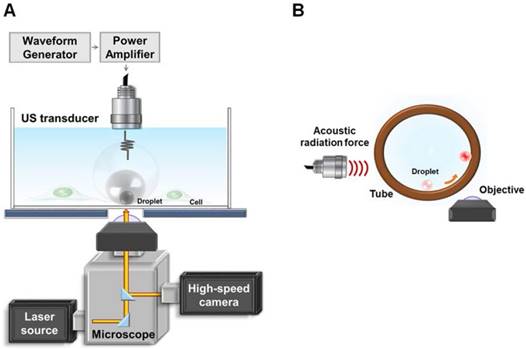
Experiment B: the side-view observation of ADV
To further verify that the ADV bubble was attached to the bottom of dish, we also performed the side-view observation of ADV in a 200-μm cellulose tube (Spectrum Laboratories. Inc., CA, USA). The ultrasound transducer was confocally positioned at a 90° angle to the objective (Fig. 1(B)). To perform the side-view observation of ADV, the droplets were firstly arranged to the side surface of the cellulose tube by acoustic radiation forces (10% duty cycle with 500 kPa) [30], permitting the optical focal plane to be nearly perpendicular to the wall during the droplet-to-bubble transition. In addition to regular bottom-view observation, side-view observations were made possible after droplets were attracted to half the height of the tube against the tube wall. The droplets then received the ADV pulse and were visualized with a high-speed fluorescence microscopic imaging system at 225,000 fps.
Cell culture
C6 glioma cells were incubated in fetal bovine serum, penicillin/ streptomycin, and Dulbecco's Modified Eagle's medium/Ham's Nutrient Mixture F-12 (DMEM/F12) at 37⁰C. One day before the experiment, C6 cells (1 × 10⁵) were seeded on a round glass coverslip and placed into a 6-well plate. Before starting the experiment, the glass coverslip was transferred to the Attofluor™ cell chamber (Thermo Fisher Scientific, MA, USA), which was mounted on the microscope. The droplets were then added into the chamber (1 × 10⁵ droplet/mL).
Cellular membrane permeability assessment
Propidium iodide (150 nM, excitation: 539 nm, emission: 610 nm) was co-incubated with cells before the experiment and the intracellular fluorescence intensity was recorded by an inverted microscope (Eclipse Ti, Nikon, Tokyo, Japan), equipped with 60× 1.0 NA oil lens (Nikon) to estimate the permeability of the cell membrane. The images were captured by the NIS Elements AR software, starting from 60 s prior to ADV, and lasting for a total of 600 s. Note that the cells were maintained in a humidified atmosphere of 5% CO2 at 37 °C during the imaging.
Cell viability assays
The calcein blue AM (15 μΜ; excitation: 320 nm, emission: 450 nm; C1429, Molecular Probe, USA) was co-incubated with cells before the experiment and the intracellular fluorescence intensity was recorded by microscopic imaging to estimate the cell viability. This fluorescence probe was directly absorbed by the cell membrane and was retained for several hours upon cleavage of the AM esters by intracellular esterases. Once the membrane of cell is seriously injured, the probe leaks from the cell and no intracellular fluorescence is monitored. The image acquisition procedure was previously described.
Cell morphology and intracellular substance leakage
The cell morphology and intracellular substance leakage after droplet ADV were assessed by labeling membranes of C6 cells with Lyn-CFP and expressing intracellular YFP-FKBP-β-Gal florescence protein, respectively. One day before initiation of the experiments, the C6 cells were transfected with Lyn-CFP construct or YFP-FKBP-β-Gal construct using transfection solution consisting of LT-1 reagent (Mirus, WI, USA) and DNA plasmid (2 μg). After successful transfection, the cells expressed membrane-anchoring cyan fluorescence protein and cytosolic yellow fluorescence protein, respectively. The cell morphology after the ADV process was assessed with serial depth of images (slice thickness: 5 μm) and reconstructed by NIS Elements AR software.
Data processing
The droplet radius, the droplet-to-cell distance, PI fluorescence intensity, and CBAM fluorescence intensity were estimated with a built-in function in the NIS-Elements software. The relative changes in the calcein Blue AM and PI fluorescence at different times (Fpost) post-ADV were normalized with respect to the pre-ADV basal fluorescence (F0) and presented as the percentage difference (relative changes = (Fpost - Fpre)/Fpre) × 100%. Following the experiment, different responses of cells were compared based on the Student t-test to determine the statistical significance of these types. Each experiment was performed with at least three independent replicates.
Results
Categorization of heterogeneous cellular effects from droplet vaporization
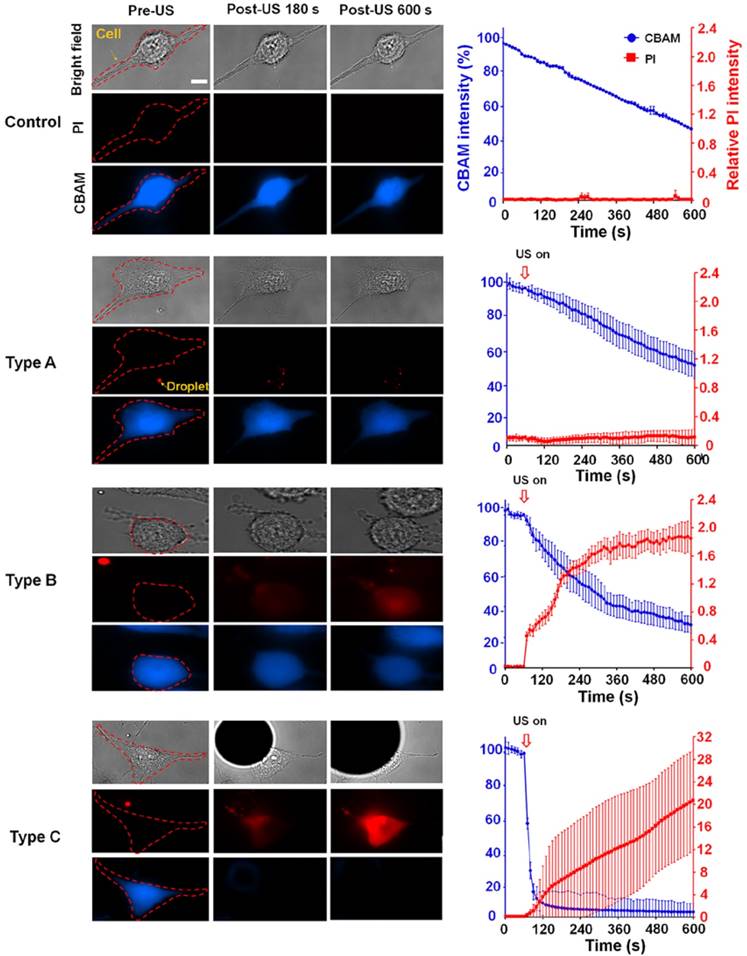
We characterized three typical cellular effects after ADV (type A-C) by measuring changes in the fluorescence intensities of intracellular propidium iodide (PI) and calcein blue AM (CBAM) across the total population of cells (Fig. 2). The decrease in CBAM intensity in the control group was probably due to the photobleaching effect. For type A, there was no diverse change in the PI level or CBAM intensity compared with the negative control at 600 s after ADV (PI: 0.01±0.01 vs 0.01±0.01; CBAM: 50.70±8.03% vs 51.52±4.82%, each p>0.05), indicating intact membranes and normal viability. In the case of type B, the PI level quickly increased within 180 s after ADV, and progressively reached a steady level at 600 s (0.19±0.01 to 1.9±0.34); CBAM intensity decreased within 180 s after ADV, and was retained at 600 s (55.80± 8.67% to 33.90±6.48%), suggesting that these cells underwent reversible membrane permeability enhancement and remained viable. With type C, PI influx into the cell was augmented compared with the baseline level (before ADV) at 600 s (0.01±0.01 to 20.81±5.94); the CBAM intensity dramatically decreased to 15±3.1% of the baseline level within the 180 s after ADV (4.36±2.91% to 3.05±2.44%), indicating unsuccessful reseal of the membrane permeability and loss of viability.
The observed ADV-induced bio-effects on adjacent cells (N=266). Left: different types of cells were identified by bright-field and fluorescence (PI and CBAM) images pre- and post-US; right: time trace of intracellular PI uptake level and CBAM fluorescence intensity from 0 s (the beginning of US exposure) to 600 s, with 15-s intervals. Scale bar: 10 μm. Data are presented as mean ± SD.
Dependence of droplet-induced cellular effects on the droplet-to-cell distance
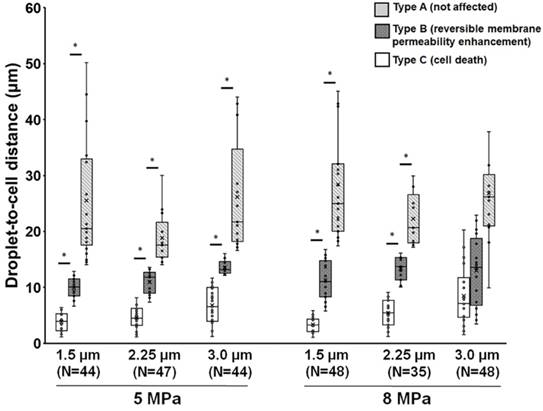
The observation described within the aforementioned results demonstrates that droplets can be used to induce viable cellular membrane permeability enhancement potentially for drug delivery or cell death for therapeutic applications, suggesting the potential for biomedical applications. Next, we characterized the relationship between the cellular effects and the droplet-to-cell distances with different parameters (droplet size and acoustic pressure). A global summary of data obtained from droplet-to-cell distances from 0 to 55 μm is presented in Fig. 3. The site of the droplet relative to the cell is a key non-acoustic issue that affects cell membrane permeability. Generally, ADV-triggered cellular bio-effects correlate with the droplet-to-cell distances, from near to far: type C, type B, and type A. For instance, when 1.5 μm (radius) droplets were sonicated by 5 MPa US, the mean droplet-to-cell distances leading to type C, type B, and type A were 3.8±1.7, 9.9±1.9, and 16.9±7.4 μm, respectively (each p<0.05). For 1.5 μm droplets under 8 MPa US sonication, the mean droplet-to-cell distances producing type C, type B, and type A effects were 3.3±1.4, 11.3±3.5, and 28.4±10.5 μm, respectively (each p<0.05). This trend was also observed for 2.25 μm (radius) droplets at 5 and 8 MPa. However, different types of bio-effects occurred randomly and unpredictably even for droplets with 3 μm radius and 8 MPa US sonication (type C: 8.4±5.3 μm; type B: 12.9±6.3 μm; type A: 5.4±2.5 μm; each p>0.05). This might result from the US-induced translation of large particles via the primary acoustic radiation force. The situation is highly dependent on the acoustic parameters (pressure, pulse repetition frequency, and frequency) and the characteristics of the particles (particle size, shell stiffness, and shell viscosity) [31-33]. These results demonstrate that the ADV-induced cellular bio-effects seem dependent on the distance between the droplet and the cell, and that there is a threshold distance for activating cell death or reversible membrane permeability enhancement, which increases with the radius of the droplets and applied acoustic pressure, with the exception of the 8MPa, 3μm group.
Influence of droplet-to-cell distance on the cell types for different parameters. *: p<0.05. Data are presented as mean ± SD.
The droplet radius dynamic during ADV
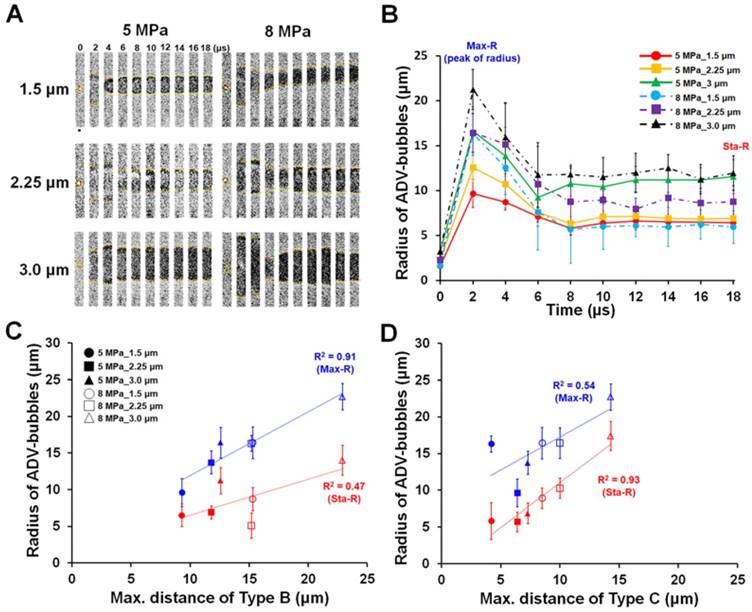
During ADV, the volume of the droplet transiently enlarges within a few microseconds due to the violent liquid-to-gas transition. The affected region of droplet vaporization should be proportional to the radius change of the droplet. We therefore utilized a high-speed bright-field microscopic imaging system to monitor the transient dynamic behavior of droplet vaporization to analyze the aforementioned phenomenon. The bright-field images indicated that after receiving US energy, droplets show a characteristic transient over-expansion (t = 2-4 μs) with a maximum radius (Max-R) and subsequent oscillatory settling to a stable bubble radius (t >8 μs, Sta-R) smaller than the maximum size reached during the initial expansion phase (Fig. 4A-B). Previous reports had indicated that the radius dynamic during ADV probably results from the momentum of droplet expansion leading to an overshoot in the final diameter and oscillatory return to the final bubble size [27, 28]. The Max-R was not significantly different between 1.5 and 2.25 μm droplets at each acoustic pressure (5 MPa: 11.5±2.6 μm vs. 12.6±1.6 μm; 8 MPa: 16.3±1.1 μm vs. 16.4±2.2 μm; each p>0.05), but significantly increased as the radius of the droplet increased from 2.25 μm up to 3 μm (5 MPa: 12.6±1.6 μm to 16.7±2.0 μm; 8 MPa: 16.4±2.2 μm to 21.0±2.0 μm, each p<0.05). The Sta-R also demonstrated a similar trend with the radius of droplets. In 5 and 8 MPa, there was no significant difference between 1.5 and 2.25 μm droplets in Sta-R at each acoustic pressure (5 MPa: 6.4±1.5 μm vs. 6.9±0.5 μm; 8 MPa: 6.0±1.7 μm vs. 8.6±1.6 μm; each p>0.05). After discovering the dynamic radius change of the droplet during vaporization (Max-R and Sta-R), we investigated the relationship between the radius change of the droplet and the droplet-induced cellular bio-effects. The results illustrated that the maximum distances of type B and type C bioeffects were highly correlated with the observed distance of Max-R (R2=0.97) and Sta-R (R2=0.93), respectively (Fig. 4C-D).
The radius change of droplets during ADV. (A) High-speed microscopic images (500 kfps) acquired during droplet vaporization with different parameters. (B) Radius-time change curve during droplet vaporization (N=10 in each condition). The relation between radius of ADV-bubbles and maximum distance of type B (C), and type C (D) effects. Scale bar: 5 μm. Data are presented as mean ± SD.
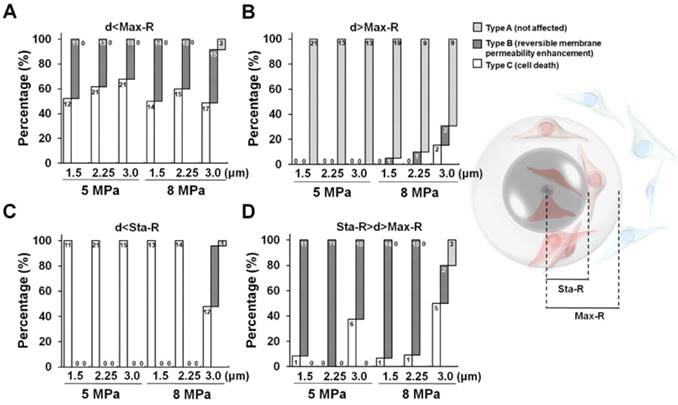
The spatial distribution of ADV-induced cellular bio-effects depends on the radius of the ADV bubble
In order to further confirm that the Max-R and Sta-R were responsible for the threshold of type B and type C, we analyzed the occurrence of the observed cellular bio-effects within the Max-R and Sta-R distances. Figure 5(A) demonstrates that most type B and type C effects appeared at a droplet-to-cell distance that was within the Max-R distance. In contrast, type A was mainly observed outside of the Max-R distance (~90%), suggesting that the Max-R distance was the area of maximal effect for droplet vaporization (Fig. 5B). We further noted that most of type C appeared (100%) when the droplet-to-cell distance was smaller than Sta-R, except for the case of droplets with 3 μm radius and 8 MPa US sonication (48%) (Fig. 5C). Type B mainly appeared at the droplet-to-cell distance between Max-R and Sta-R (>62.5%), except for 8MPa, 3μm group (30%) (Fig. 5D). These data revealed that the distance thresholds for ADV-induced cell death (type C) and reversible membrane permeability enhancement (type B) were probably the radius of the ADV-bubble (Sta-R) and maximum distance of droplet expansion (Max-R), respectively. Since the acoustic parameters applied in this study are constant (3 cycles, 8 MPa), the acoustic radiation force on the droplet was dependent on the radius of droplet. Therefore, the large size of droplets are more intensely affected by the acoustic radiation force, which leads them to suffer distinct translation resulting in unpredictable bioeffects [31-33].
The occurrence of ADV-induced bio-effects at the droplet-to-cell distance at (A) within Max-R, (B) outside Max-R, (C) within Sta-R, and (D) between Sta-R and Max-R. The corresponding cell numbers are labeled in each bar for the different droplet-cell distances.
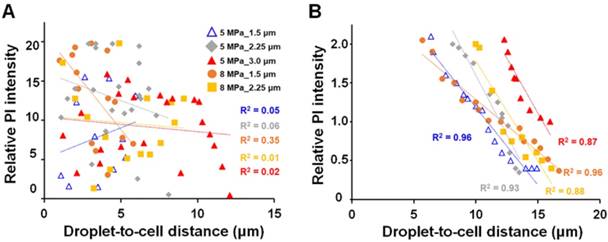
After discovering that the spatial distribution of ADV-induced bio-effects could be characterized by Sta-R and Max-R, we noticed that there were no obvious trends between the PI intensity and droplet-to-cell distance within Sta-R according in the investigated US parameters. However, in the region of Max-R, the degree of membrane permeability decreased with the droplet-to-cell distance at the investigated size of droplets (except 8MPa_3.0μm (Fig. 6)).
The correlation between PI intensity and droplet-to-cell distance within Sta-R (A); between Sta-R and Max-R (B).
The ADV bubble can tear the membrane of the attached cells and induce substance leakage from cytoplasm
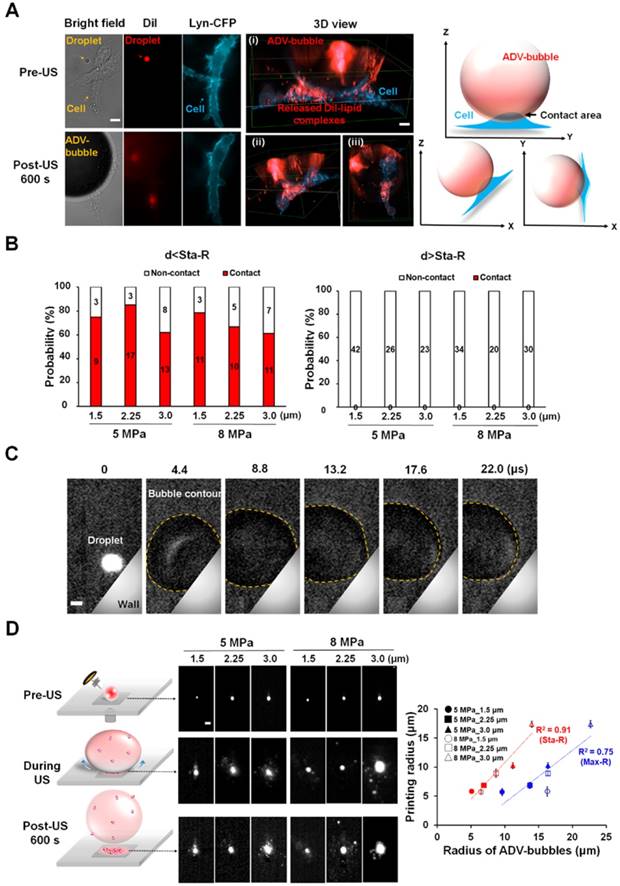
Next, we observed the cellular morphology after ADV via 3D microscopic imaging to uncover the potential mechanisms of ADV-induced cellular death. The cells were transfected with membrane-tethering fluorescence protein (Lyn-CFP) before performing an experiment to identify the location of the cells. After ADV, the droplet-generated gas bubble directly contacted the nearby cell (Fig. 7A) and deposited a massive DiI-lipid complex onto the cellular membrane (see Supplementary Video 1). Quantitative assessment found that the phenomena of bubble attachment to cells only occurred within Sta-R for each of the parameters (>60%) (Fig. 7B). In contrast, this phenomenon was not observed outside Sta-R (Fig. 7C). This can be explained by the fact that droplet-generated bubbles probably strongly press downward onto nearby cells during ADV, leading to cellular death. To confirm this hypothesis, we designed a tube experiment with a high-speed fluorescence microscopic imaging system that applied acoustic radiation forces to move droplets to the side surface of the tube, permitting the optical focal plane to be nearly perpendicular to the wall during the droplet-to-bubble transition (5 MPa with 3.0 μm radius of droplet). The acquired images showed that the bubble initially expanded and the bottom of bubble attached onto the wall during the expansion (Fig. 7C). At the end of the contraction at t = 13.2 μs, the bubble started detaching from the wall (see Supplementary Video 2). Fig. 7D demonstrates the clear visualization of DiI-lipid complexes immediately appearing at the site of the droplet during ADV because droplets are directly printed in patches on to the glass during the attachment. These DiI-lipid complexes were nano-scaled vesicles (see Supplementary Figure 2). Therefore, it is reasonable to deduce that the distribution of DiI-lipid complexes could be where ADV bubbles press downward onto the glass during ADV. We further quantified the total area of the printing region in each case and estimated the printing radius (Pri-R) by πr2. The statistical results suggest the Pri-R of released DiI-lipid complexes is more correlated with the Sta-R (R2=0.91) than Max-R (R2=0.75), suggesting that the cellular death in Sta-R probably was mainly due to the strong downward pressure of the droplet.
The attachment of ADV bubbles onto adjacent cells. (A) After droplet vaporization, ADV-bubbles were found to directly contact and release DiI-lipid complexes onto nearby cells (see Supplementary Video 1); Left: Bright-field and florescence images before and after droplet ADV; middle: 3D images after droplet ADV; right: illustration of ADV-bubble contact onto cells. Scale bar: 10 μm. (B) The occurrence of ADV-bubble attachment onto cells when the droplet-to-cell distance was within Sta-R (left) and beyond Sta-R (right). (C) Side-view images captured at 225 kfps of a single bubble produced under the 5 MPa with 3.0 μm radius of droplet (see Supplementary Video 2). Scale bar: 3 μm. (D) Left: fluorescence microscopic images revealed the droplets directly pressed downward onto the glass and deposited the DiI-lipid complexes in patches onto the glass after ADV; right: The correlation of the printing radius, Max-R and Sta-R. Scale bar: 10 μm. Data are presented as mean ± SD.
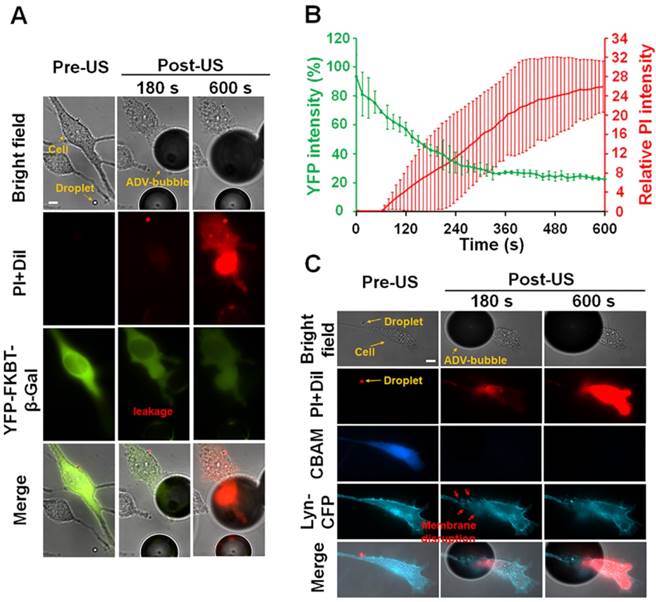
One of the possible causes of cellular death after the attachment of ADV bubble is the occurrence of intracellular organelles leakage. To confirm this hypothesis, the C6 cells were transfected with intracellular fluorescence protein (YFP-FKBP-β-Gal, molecular weight: 651 kDa, radius: 7.9 nm). The size of this protein was similar with ribosome [34]. As revealed in the microscopic imaging, YFP-FKBP-β-Gal leaked after the cell contacted the ADV bubbles (Fig. 8A) (see Supplementary Video 3). Furthermore, the high uptake of PI indicates cell death (Fig. 8A-B). A reasonable explanation is that the cellular membrane was disrupted after the attachment of ADV bubbles, not only resulting extracellular influx but also leakage of intracellular substance. In order to address this hypothesis, the C6 cells were transfected with DNA constructs encoding membrane-tethering fluorescence protein (Lyn-YFP). The shape of the cell membrane was blurred at the ADV-bubble attachment area. We also observed PI influx from the ADV bubble attachment site (Fig. 8C), suggesting that the ADV-generated bubbles produced irreversible injury to the membrane of adjacent cells (see Supplementary Video 4). Previous work has reported that the cellular membrane could not reseal once the wound area in the cellular membrane was larger than 100 μm2 [35], and endothelial cells could elicit transient influx of calcium and death by air bubble contact [36, 37].
After ADV-bubbles attach to the cells, the ADV-bubble induces substance leakage from cytoplasm (A-B) (see Supplementary Video 3), and the membranes of the cells are torn off (C) (see Supplementary Video 4). Scale bar: 10 μm. Data are presented as mean ± SD.
Discussion
Previous studies had proven that acoustic droplet vaporization with ultrasound sonication can be used for medical applications such as ultrasound contrast imaging and therapeutic delivery. However, few studies have elaborated on the mechanisms of droplet-induced bioeffects. In addition, the observations from this study provide valuable information for predicting the area affected by the droplets, potentially improving the safety of acoustic droplet-related therapy.
It has been shown in a previous study that droplets (nanometer in size) with ultrasound could be used to induce irreversible and reversible membrane permeabilization (called as sonoporation) [20]. The research indicated that the ADV mainly resulted in irreversible rather than reversible sonoporation and gave another option to understanding ADV-induced irreversible sonoporation. The rate of irreversible sonoporation was correlated with droplets concentration, ultrasound intensity, and pulse length of ultrasound. The longer pulse of ultrasound (20 μs) would enlarge the displacement of ADV bubbles, producing cellular membrane deformation and higher irreversible sonoporation rate.
A previous study had reported that the microbubbles size and microbubble-to-cell distance would correlate with the outcome of membrane permeabilization (reversible or irreversible sonoporation) [33]. Small bubbles (diameter, D < 5.5 μm) led to predictable sonoporation, the degree of which depended on the bubble-to-cell distance (d). No sonoporation was observed when d/D > 1, whereas reversible sonoporation occurred when d/D < 1. Large bubbles (D > 5.5 μm) exhibited translational movement over large distances, resulting in variable and unpredictable sonoporation for all microbubble-to-cell distance (0-4.5 μm). In our study, no sonoporation was observed when d/D > 4, whereas irreversible sonoporation appeared when d/D < 1.4 for all size of droplets. Reversible sonoporation occurred when 1.4<d/D<4. In each acoustic pressure, the droplet-cell distance for causing reversible sonoporation increased with the size of droplet decrease. For the aspect of drug delivery, the droplet could affect farther distant cells than microbubbles, increasing the area of drug delivery. However, the drawback of using droplets for drug delivery was that the droplet would induce irreversible sonoporation to nearby cells.
Our results demonstrate that ADV-generated bubbles can induce cellular death within the type C range. Although the underlying mechanism is still unclear, previous reports have also indicated that air bubbles that attach to endothelial cells in vitro can produce an interaction between the air-liquid interface and the endothelial surface layer, leading to mechanical deformation of the cells. The air-liquid interface can rapidly adsorb the cellular membrane-bound proteins into the bubble surface, causing protein denaturation and a thickening of the endothelial surface layer [38, 39]. In addition, the contact of the air bubble can produce a transient influx of intracellular calcium via a TRPV family channel, inducing mitochondrial depolarization and dysfunction [40]. The consequences of these behaviors induces cell apoptosis and cell death. During ADV, the dramatic enlargement of droplets considerably reduces the density of surfactant molecules on the shell, which indicates that the generating bubbles are easily to further changes, including coalescence into larger size bubbles when they contact each other or generation of the air-liquid interface to absorb the nearby cellular membranes [41]. On the other hand, previous reports have suggested that the surfactant treatment can ameliorate the bio-effects of air bubble contact [42], indicating that the safety of droplet-associated treatment could be improved through combination with surfactant therapy.
A previous study had indicated that once ADV is introduced, then droplet quickly grow in volume with a high wall velocity, producing stress distribution around the droplet [43] and potentially causing mechanical bio-effects including cellular damage and pore formation. The shear stress resulting from the ADV droplet should theoretically decrease with the droplet-to-cell distance increase. Previous efforts have shown that the degree of shear stress-induced cellular membrane permeability enhancement was correlated to the intracellular PI fluorescence intensity [44]. In our data, the degree of membrane permeability decreased with the droplet-to-cell distance at all parameters within the region of Max-R (Fig. 6), suggesting that the shear stress was probably responsible for ADV-induced cellular membrane permeability enhancement, but not cellular death.
Our results showed that droplet vaporization increased cellular membrane permeability within a certain range without direct contact with cells. During ADV, the quickly expansion of droplet can generate a wall velocity (tens to hundreds of m/s), and associated shear stress [27, 43, 45-48]. The amplitude of peak shear stress is strongly influenced by the size of droplet. A simulation study showed that a droplet with 7.8 μm diameter would produce 30-40 dyne/cm2 of shear stress [43]. Previous studies have reported that the lipid bilayer membrane rupture threshold value is σmax ≈1 · 10-2 N/m [49, 50]. In addition, the shear stress within the arteries of human during basal conditions are 2-20 dynes/cm2, with localized rises to 30-100 dynes/cm2 close arterial branches [51]. This indicates that the site of droplet ADV probably affect the tendency to result in bioeffects within vessel.
A limitation to this study was the high-speed fluorescence microscopic system, which uses a 532 nm laser as a light source. As a result, other color fluorescence probes (i.e., green and blue) could not be used since these probes will not be excited by this laser. We therefore could not directly monitor the droplet vaporization and cellular bio-effects simultaneously. In addition, the configuration of the microscopic system was not suitable for observation in a situation where the ADV bubble attaches to the membrane of cell because their adherence is shaded by the ADV bubble. Therefore, the chamber should be further modified to enable observation from a lateral direction for clearly assess the interactions between droplets and cells.
Based on our results, the droplet-to-cell distance between Max-R and Sta-R is most beneficial for application of drug delivery because this settings induced relatively high amounts of membrane permeability enhancement and minimal cell death (Fig. 4B). For therapeutic applications where high amounts of cell death is required, e.g., cancer therapies, a short distance between the droplet and target cell should be applied (<Sta-R). On the other hand, we also observed a massive drop off of DiI-lipid complex at the droplet location during the droplet vaporization (Fig. 7A), suggesting the potential application of locally enhanced transport of shell material especially in the vascular targeting scenario.
Conclusion
In this study, we controlled single-cell membrane permeability enhancement and cellular death by selective ultrasound excitation of acoustic droplets. High-speed microscopic imaging enabled visualization of the droplet vaporization behaviors during ADV such as the transient size change and downward press. The mechanisms underlying ADV-induced cellular membrane permeability enhancement and cellular death probably involve shear stress and downward press, respectively. The spatial distribution of ADV-induced bioeffects could be well mapped with the physical dynamics of droplets vaporization. This study provides valuable information for the prediction and optimization of ADV-associated therapy.
Acknowledgements
The authors gratefully acknowledge the support of the Ministry of Science and Technology, Taiwan under Grant No. MOST 107-2627-M-007-005, 107-2221-E-007-002, 107-2627-M-007-005 and National Tsing Hua University (Hsinchu, Taiwan) under Grant No. 107Q2717E1.
Supplementary Material
Supplementary figures.
Vedio S1.
Vedio S2.
Vedio S3.
Vedio S4.
Competing Interests
The authors have declared that no competing interest exists.
References
1. Lane TA. Perfluorochemical-based artificial oxygen carrying red cell substitutes. Transfus Sci. 1995;16:19-31
2. Habler OP, Messmer KF. Tissue perfusion and oxygenation with blood substitutes. Adv Drug Deliv Rev. 2000;40:171-84
3. Grayburn P. Perflenapent emulsion (EchoGen): a new long-acting phase-shift agent for contrast echocardiography. Clin Cardiol. 1997;20:I12-8
4. Rapoport N, Nam KH, Gupta R, Gao Z, Mohan P, Payne A. et al. Ultrasound-mediated tumor imaging and nanotherapy using drug loaded, block copolymer stabilized perfluorocarbon nanoemulsions. J Controlled Release. 2011;153:4-15
5. Kripfgans OD, Fowlkes JB, Miller DL, Eldevik OP, Carson PL. Acoustic droplet vaporization for therapeutic and diagnostic applications. Ultrasound Med Biol. 2000;26:1177-89
6. Vlaisavljevich E, Durmaz YY, Maxwell A, Elsayed M, Xu Z. Nanodroplet-mediated histotripsy for image-guided targeted ultrasound cell ablation. Theranostics. 2013;3:851-64
7. Dayton PA, Zhao S, Bloch SH, Schumann P, Penrose K, Matsunaga TO. et al. Application of ultrasound to selectively localize nanodroplets for targeted imaging and therapy. Mol Imaging. 2006;5:160-74
8. Sheeran PS, Luois S, Dayton PA, Matsunaga TO. Formulation and acoustic studies of a new phase-shift agent for diagnostic and therapeutic ultrasound. Langmuir. 2011;27:10412-20
9. Samuel S, Duprey A, Fabiilli ML, Bull JL, Fowlkes JB. In vivo microscopy of targeted vessel occlusion employing acoustic droplet vaporization. Microcirculation. 2012;19:501-9
10. Radhakrishnan K, Holland CK, Haworth KJ. Scavenging dissolved oxygen via acoustic droplet vaporization. Ultrason Sonochem. 2016;31:394-403
11. Chen CC, Sheeran PS, Wu SY, Olumolade OO, Dayton PA, Konofagou EE. Targeted drug delivery with focused ultrasound-induced blood-brain barrier opening using acoustically-activated nanodroplets. J Controlled Release. 2013;172:795-804
12. Chen WT, Kang ST, Lin JL, Wang CH, Chen RC, Yeh CK. Targeted tumor theranostics using folate-conjugated and camptothecin-loaded acoustic nanodroplets in a mouse xenograft model. Biomaterials. 2015;53:699-708
13. Airan RD, Meyer RA, Ellens NP, Rhodes KR, Farahani K, Pomper MG. et al. Noninvasive Targeted Transcranial Neuromodulation via Focused Ultrasound Gated Drug Release from Nanoemulsions. Nano Lett. 2017;17:652-9
14. Moncion A, Lin M, O'Neill EG, Franceschi RT, Kripfgans OD, Putnam AJ. et al. Controlled release of basic fibroblast growth factor for angiogenesis using acoustically-responsive scaffolds. Biomaterials. 2017;140:26-36
15. Ho YJ, Chang YC, Yeh CK. Improving Nanoparticle Penetration in Tumors by Vascular Disruption with Acoustic Droplet Vaporization. Theranostics. 2016;6:392-403
16. Thakkar D, Gupta R, Monson K, Rapoport N. Effect of ultrasound on the permeability of vascular wall to nano-emulsion droplets. Ultrasound Med Biol. 2013;39:1804-11
17. Aydin O, Vlaisavljevich E, Yuksel Durmaz Y, Xu Z, ElSayed ME. Noninvasive Ablation of Prostate Cancer Spheroids Using Acoustically-Activated Nanodroplets. Mol Pharm. 2016;13:4054-65
18. Burgess MT, Porter TM. Acoustic Cavitation-Mediated Delivery of Small Interfering Ribonucleic Acids with Phase-Shift Nano-Emulsions. Ultrasound Med Biol. 2015;41:2191-201
19. Seda R, Li DS, Fowlkes JB, Bull JL. Characterization of Bioeffects on Endothelial Cells under Acoustic Droplet Vaporization. Ultrasound Med Biol. 2015;41:3241-52
20. Qin D, Zhang L, Chang N, Ni P, Zong Y, Bouakaz A. et al. In situ observation of single cell response to acoustic droplet vaporization: Membrane deformation, permeabilization, and blebbing. Ultrason Sonochem. 2018;47:141-50
21. Ho YJ, Yeh CK. Theranostic Performance of Acoustic Nanodroplet Vaporization-Generated Bubbles in Tumor Intertissue. Theranostics. 2017;7:1477-88
22. Nyankima AG, Rojas JD, Cianciolo R, Johnson KA, Dayton PA. In Vivo Assessment of the Potential for Renal Bio-Effects from the Vaporization of Perfluorocarbon Phase-Change Contrast Agents. Ultrasound Med Biol. 2018;44:368-76
23. Reznik N, Shpak O, Gelderblom EC, Williams R, de Jong N, Versluis M. et al. The efficiency and stability of bubble formation by acoustic vaporization of submicron perfluorocarbon droplets. Ultrasonics. 2013;53:1368-76
24. Ishijima A, Tanaka J, Azuma T, Minamihata K, Yamaguchi S, Kobayashi E. et al. The lifetime evaluation of vapourised phase-change nano-droplets. Ultrasonics. 2016;69:97-105
25. Kang ST, Lin YC, Yeh CK. Mechanical bioeffects of acoustic droplet vaporization in vessel-mimicking phantoms. Ultrason Sonochem. 2014;21:1866-74
26. Fix SM, Novell A, Yun Y, Dayton PA, Arena CB. An evaluation of the sonoporation potential of low-boiling point phase-change ultrasound contrast agents in vitro. J Ther Ultrasound. 2017;5:7
27. Qamar A, Wong ZZ, Fowlkes JB, Bull JL. Dynamics of acoustic droplet vaporization in gas embolotherapy. Appl Phys Lett. 2010;96:143702
28. Sheeran PS, Matsunaga TO, Dayton PA. Phase change events of volatile liquid perfluorocarbon contrast agents produce unique acoustic signatures. Phys Med Biol. 2014;59:379-401
29. Chang TL, Kang ST, Yeh CK. High-speed fluorescence imaging of ultrasound-triggered drug release from phase-change droplets. 2014 IEEE International Ultrasonics Symposium (IUS). 2014:17-20
30. Kang ST, Chang TL, Yeh CK. High-speed fluorescence microscopy of near-wall shedding of drug-lipid complexes from phase-change droplets. 2015 IEEE International Ultrasonics Symposium (IUS). 2015:1-4
31. Dayton PA, Morgan KE, Klibanov AL, Brandenburger GH, Ferrara KW. Optical and acoustical observations of the effects of ultrasound on contrast agents. IEEE Trans Ultrason Ferroelectr Freq Control. 1999;46:220-32
32. Goertz DE, de Jong N, van der Steen AF. Attenuation and size distribution measurements of Definity and manipulated Definity populations. Ultrasound Med Biol. 2007;33:1376-88
33. Qin P, Xu L, Han T, Du L, Yu AC. Effect of non-acoustic parameters on heterogeneous sonoporation mediated by single-pulse ultrasound and microbubbles. Ultrason Sonochem. 2016;31:107-15
34. Lin YC, Niewiadomski P, Lin B, Nakamura H, Phua SC, Jiao J. et al. Chemically inducible diffusion trap at cilia reveals molecular sieve-like barrier. Nat Chem Biol. 2013;9:437-43
35. Hu Y, Wan JM, Yu AC. Membrane perforation and recovery dynamics in microbubble-mediated sonoporation. Ultrasound Med Biol. 2013;39:2393-405
36. Sobolewski P, Kandel J, Eckmann DM. Air bubble contact with endothelial cells causes a calcium-independent loss in mitochondrial membrane potential. PloS One. 2012;7:e47254
37. Kobayashi S, Crooks SD, Eckmann DM. In vitro surfactant mitigation of gas bubble contact-induced endothelial cell death. Undersea Hyperb Med. 2011;38:27-39
38. Liao Z, Lampe JW, Ayyaswamy PS, Eckmann DM, Dmochowski IJ. Protein assembly at the air-water interface studied by fluorescence microscopy. Langmuir. 2011;27:12775-81
39. Sobolewski P, Kandel J, Klinger AL, Eckmann DM. Air bubble contact with endothelial cells in vitro induces calcium influx and IP3-dependent release of calcium stores. Am J Physiol Cell Physiol. 2011;301:C679-86
40. Rapoport NY, Efros AL, Christensen DA, Kennedy AM, Nam KH. Microbubble Generation in Phase-Shift Nanoemulsions used as Anticancer Drug Carriers. Bubble Sci Eng Technol. 2009;1:31-9
41. Eckmann DM, Zhang J, Lampe J, Ayyaswamy PS. Gas embolism and surfactant-based intervention: implications for long-duration space-based activity. Ann N Y Acad Sci. 2006;1077:256-69
42. Kripfgans OD, Fabiilli ML, Carson PL, Fowlkes JB. On the acoustic vaporization of micrometer-sized droplets. J Acoust Soc Am. 2004;116:272-81
43. Qamar A, Wong ZZ, Fowlkes JB, Bull JL. Evolution of acoustically vaporized microdroplets in gas embolotherapy. J Biomech Eng. 2012;134:031010
44. Helfield B, Chen X, Watkins SC, Villanueva FS. Biophysical insight into mechanisms of sonoporation. Proc Natl Acad Sci U S A. 2016;113:9983-8
45. Shpak O, Stricker L, Versluis M, Lohse D. The role of gas in ultrasonically driven vapor bubble growth. Phys Med Biol. 2013;58:2523-35
46. Wong ZZ, Kripfgans OD, Qamar A, Fowlkes JB, Bull JL. Bubble evolution in acoustic droplet vaporization at physiological temperature via ultra-high speed imaging. Soft Matter. 2011;7:4009-16
47. Doinikov AA, Sheeran PS, Bouakaz A, Dayton PA. Vaporization dynamics of volatile perfluorocarbon droplets: a theoretical model and in vitro validation. Med Phys. 2014;41:102901
48. Sheeran PS, Matsunaga TO, Dayton PA. Phase-transition thresholds and vaporization phenomena for ultrasound phase-change nanoemulsions assessed via high-speed optical microscopy. Phys Med Biol. 2013;58:4513-34
49. Needham D, Hochmuth RM. Electro-mechanical permeabilization of lipid vesicles. Role of membrane tension and compressibility. Biophys J. 1989;55:1001-9
50. Marmottant P, Hilgenfeldt S. Controlled vesicle deformation and lysis by single oscillating bubbles. Nature. 2003;423:153-6
51. Dewey CF Jr, Bussolari SR, Gimbrone MA Jr, Davies PF. The dynamic response of vascular endothelial cells to fluid shear stress. J Biomech Eng. 1981;103:177-85
Author contact
![]() Corresponding author: Department of Biomedical Engineering and Environmental Sciences, National Tsing Hua University, No. 101, Section 2, Kuang-Fu Road, Hsinchu, Taiwan 30013, R.O.C. Tel: +886-3-571-5131, ext. 34234; Fax: +886-3-571-8649; E-mail address: ckyehnthu.edu.tw (C.-K. Yeh)
Corresponding author: Department of Biomedical Engineering and Environmental Sciences, National Tsing Hua University, No. 101, Section 2, Kuang-Fu Road, Hsinchu, Taiwan 30013, R.O.C. Tel: +886-3-571-5131, ext. 34234; Fax: +886-3-571-8649; E-mail address: ckyehnthu.edu.tw (C.-K. Yeh)