Impact Factor
- Issue 14; 2026
- Issue 13; 2026
- Issue 12; 2026
- Issue 11; 2026
- Issue 10; 2026
- Volume 16; 2026
- Advance Articles
- Past Issues
- Cover Images
- Cover Suggestion
- Index & Coverage
- Special Issues
Introduction
Methods
Results
Discussion
Conclusions
Abbreviations
Supplementary Material
Acknowledgements
References
International Journal of Biological Sciences
International Journal of Medical Sciences
 Global reach, higher impact

Theranostics 2018; 8(20):5593-5609. doi:10.7150/thno.27425 This issue Cite
Research Paper
miR-125a-5p ameliorates hepatic glycolipid metabolism disorder in type 2 diabetes mellitus through targeting of STAT3
Lina Xu, Yue Li, Lianhong Yin, Yan Qi, Huijun Sun, Pengyuan Sun, Ming Xu, Zeyao Tang, Jinyong Peng ![]()
College of Pharmacy, Dalian Medical University, Western 9 Lvshunnan Road, Dalian 116044, China.
Received 2018-5-23; Accepted 2018-10-12; Published 2018-11-9
Abstract

Glycolipid metabolic disorder is an important cause for the development of type 2 diabetes mellitus (T2DM). Clarification of the molecular mechanism of metabolic disorder and exploration of drug targets are crucial for the treatment of T2DM.
Methods: We examined miR-125a-5p levels in palmitic acid-induced AML12 cells and the livers of type 2 diabetic rats and mice, and then validated its target gene. Through gain- and loss-of-function studies, the effects of miR-125a-5p via targeting of STAT3 on regulating glycolipid metabolism were further illustrated in vitro and in vivo.
Results: We found that miR-125a-5p was significantly decreased in the livers of diabetic mice and rats, and STAT3 was identified as the target gene of miR-125a-5p. Overexpression of miR-125a-5p in C57BL/6 mice decreased STAT3 level and downregulated the expression levels of p-STAT3 and SOCS3. Consequently, SREBP-1c-mediated lipogenesis pathway was inhibited, and PI3K/AKT pathway was activated. Moreover, silencing of miR-125a-5p significantly increased the expression levels of STAT3, p-STAT3 and SOCS3, thus activating SREBP-1c pathway and suppressing PI3K/AKT pathway. Therefore, hyperglycemia, hyperlipidemia and decreased liver glycogen appeared in C57BL/6 mice. In palmitic acid-induced AML12 cells, miR-125a-5p mimic markedly increased glucose consumption and uptake and decreased the accumulation of lipid droplets by regulating STAT3 signaling pathway. Consistently, miR-125a-5p overexpression obviously inhibited STAT3 expression in diabetic KK-Ay mice, thereby decreasing blood glucose and lipid levels, increasing hepatic glycogen content, and decreasing accumulation of hepatic lipid droplets in diabetic mice. Furthermore, inhibition of miR-125a-5p in KK-Ay mice aggravated glycolipid metabolism dysfunction through regulating STAT3.
Conclusions: Our results confirmed that miR-125a-5p should be considered as a regulator of glycolipid metabolism in T2DM, which can inhibit hepatic lipogenesis and gluconeogenesis and elevate glycogen synthesis by targeting STAT3.
Keywords: type 2 diabetes mellitus, metabolic disorder, microRNA, miR-125a-5p, STAT3
Introduction
Type 2 diabetes mellitus (T2DM) is a complex metabolic disorder disease that is increasing in prevalence throughout the world [1]. The liver plays a central role in maintaining glucose and lipid homeostasis throughout the body [2]. In hepatocytes, glucose is metabolized into pyruvate through glycolysis, and glycolytic products are used to synthesize fatty acids through de novo lipogenesis [3]. Triglycerides (TGs), phospholipids, and cholesterol esters are incorporated and stored in lipid droplets or secreted into the circulation. The liver can also secrete glucose through both glycogen breakdown and gluconeogenesis [4]. Therefore, liver dysfunction can cause hepatic glycolipid metabolism disorder and accelerate the progression of T2DM [5].
MicroRNAs (miRNAs) achieve their biological function through binding the 3' untranslated region (3'UTR) of target genes and regulating the expression levels of protein-coding genes [6]. Recent studies have shown that miRNAs participate in the pathogenesis of many diseases [7]. Meanwhile, much progress has been achieved in understanding the roles of miRNAs, and several miRNAs have been indicated to contribute to metabolic diseases [8]. miR-125a, with ubiquitous expression in tissue, participates in endothelial cell-mediated angiogenesis of aging mice and vasomotor homeostasis of stroke-prone spontaneously hypertensive rats [9-11]. More importantly, miR-125a was found to be downregulated in T2DM patients [12] and has been identified as a direct regulator of interleukin 6 receptor in the development of diabetic nephropathy [13]. However, the role of miR-125a-5p in controlling hepatic glycolipid metabolism associated with T2DM remains unknown.
Recently, a growing number of studies have indicated that one miRNA can regulate more than one target gene, and target genes can be regulated by various miRNAs. It has been reported that the expression level of miR-125b is negatively adjusted by signal transducer and activator of transcription 3 (STAT3) in osteosarcoma cells [14]. Meanwhile, activating STAT3 phosphorylation can increase the mRNA level of suppressor of cytokine signaling 3 (SOCS3) [15], and STAT3- SOCS3 pathway regulates the signal transduction of many factors related to insulin sensitivity and glycolipid metabolism [16,17]. In regulating lipid metabolism, SOCS3 can increase hepatic sterol regulatory element binding protein-1c (SREBP-1c) expression and then stimulate the transcription of many lipogenetic genes to promote de novo lipogenesis [18]. Additionally, SOCS3 can inhibit PI3K/AKT phosphorylation in insulin signaling pathway to reduce hepatic insulin sensitivity [19], consequently suppressing forkhead transcription factor 1 (FoxO1) phosphorylation and promoting hepatic glucose production via increasing transcription of gluconeogenic enzymes [20]. Reduced AKT phosphorylation also downregulates the phosphorylation of glycogen synthase kinase-3β (GSK-3β) [21]. Although Makwana et al. found that hepatic miR-125a-5p-dependent STAT3 downregulation contributes to calorie restriction-mediated delay of aging [22], whether miR-125a-5p can target STAT3 to regulate hepatic glycolipid metabolism in T2DM has not been reported. Therefore, we sought to investigate the role of miR-125a-5p in regulating hepatic glycolipid metabolic disorder in T2DM via targeting of STAT3, which will provide a better understanding of T2DM and its mechanisms.
Methods
Chemicals and materials
Blood glucose ACCU-CHEK touch test papers were purchased from Roche (Roche Diagnostic, Gemany). Insulin was supplied by Wanbang Institute of Biotechnology (Jiangsu, China). Total cholesterol (TC), triglyceride (TG), high density lipoproteins (HDL), low density lipoproteins (LDL), and free fatty acids (FFA) detection kits were all purchased from Nanjing Jiancheng Institute of Biotechnology (Nanjing, China). Enhanced bicinchoninic acid (BCA) protein assay kit was obtained from Beyotime Institute of Biotechnology (Jiangsu, China). Glucose oxidase method detection kit was purchased from Applygen Technologies Inc. (Beijing, China). Liver glycogen detection kit, and PAS and Oil Red O staining kits were supplied by Solarbio Science & Technology Co., Ltd. (Beijing, China). Tissue protein extraction kit was purchased from Key GEN Biotech. Co., Ltd. (Nanjing, China). RNAiso Plus, TransScript All-in-One First-Strand cDNA Synthesis SuperMix for qPCR, TransStart Top Green qPCR SuperMix, protein marker, EasySee Western blot kit, and double-luciferase reporter assay kit were purchase from TransGen Biotech Ltd. (Beijing, China). Streptozotocin (STZ), hydroxymethyl aminomethane and sodium dodecyl sulfate (SDS) were purchased from Sigma (St. Louis, MO, USA). Dulbecco's Modified Eagle's medium (DMEM), Ham's F12 medium, fetal bovine serum (FBS), transferrin, selenium, and dexamethasone were purchased from Gibco (USA). 2-deoxy-2-[(7-nitro-2,1,3-benzoxadiazol-4-yl) amino]-D-glucose (2-NBDG) was purchased from Cayman Chemical Co., Ltd. (USA), and lipofectamine 2000 was supplied by Invitrogen (USA). miR-125a-5p mimic, inhibitor, agomir, antagomir and their negative control (NC) oligos, wild-type STAT3 (STAT3-WT) and 3'UTR-mutated STAT3 (STAT3-MUT) luciferase reporter plasmids were constructed by Guangzhou RiboBio Co., Ltd. (Guangdong, China). The primers of miR-125a-5p and U6 were constructed by Sangon Biotech Co., Ltd. (Shanghai, China), and the other primers used in this study were supplied by Invitrogen™ (Shanghai, China). SanPrep Column microRNA Extraction Kit, miRNA First Strand cDNA Synthesis (tailing reaction), microRNAs qPCR Kit (SYBR green method), full length STAT3 and the 3'UTR-mutated STAT3 cDNA were purchased from Sangon Biotech Co., Ltd. (Shanghai, China).
Cell culture, model establishment and transfection
HepG2 cells (Shanghai Institute of Biochemistry and Cell Biology, China) were cultured in DMEM supplemented with 10% FBS. Alpha mouse liver 12 (AML12) cells (Shanghai Institute of Biochemistry and Cell Biology, China) were cultured in DMEM and Ham's F12 medium with 5 μg/mL of insulin, 5 μg/mL of transferrin, 5 ng/mL of selenium, 40 ng/mL of dexamethasone and 10% fetal bovine serum. Cultures were maintained at 37°C in humidified air containing 5% CO2 for experiments.
To induce metabolic disorder, AML12 cells were incubated with 0.1 mM palmitic acid for 24 h. AML-12 cells were transfected with miR-125a-5p mimic (50 nM), inhibitor (100 nM) or negative control (NC) oligos using Lipofectamine 2000 for 24 h. In another set of cells, STAT3 was overexpressed through transfection with full-length STAT3 cDNA, and the miR-125a-5p mimic or NC oligos were cotransfected together with STAT3 cDNA. The TG content, glycogen content, and glucose consumption and uptake were measured, and Oil Red O staining was performed to analyze lipid accumulation.
Animals and the T2DM model
Male Wistar rats weighing 180-220 g were purchased from the Institute of Genome Engineered Animal Models for Human Disease of Dalian Medical University (SCXK (Liao) 2013-0003). Six-week-old male KK-Ay mice were obtained from Beijing Huafukang Bioscience Co. Inc (SCXK (Jing) 2014-0004). Male C57BL/6 mice at the age of 6 weeks were obtained from Liaoning Changsheng Biotechnology Co. LTD (SCXK (Liao) 2015-0001). All animal experiments were performed according to the guidelines of the Institutional Animal Ethical Committee. Animals were housed in a room under the conditions of constant temperature (22 ± 3°C) and humidity (60%), a 12 h light/dark schedule, and free access to food and water. All animal care and experimental procedures were carried out in accordance with legislation regarding the Use and Care of Laboratory Animals (People's Republic of China) and approved by the Animal Care and Use Committee of Dalian Medical University.
Rats in the model group were fed a high-fat diet (HFD, consisting of 10% fat, 20% sucrose, 2.5% cholesterol, 1% cholate, 1% egg, 30% bean sprout and 35.5% chow diet) for 4 weeks [23], and then given a single intraperitoneal streptozotocin (STZ) injection at 30 mg/kg in 0.1 M acetate buffer (pH = 4.5). Three days later, the rats with a random blood glucose level > 16.7 mM were considered to be T2DM model rats and were fed an HFD for 8 consecutive weeks. The rats in the control group received an intraperitoneal injection of an equivalent volume of 0.1 M citric acid-sodium citrate buffer at the end of 4 weeks of feeding, and then fed a normal chow diet (no. 1022, Huafukang Bioscience, China) for the same period as the model group. KK-Ay mice were fed an HFD consisting of 48% carbohydrates, 17% protein, 34% fat, 1% fiber, minerals, and vitamins (no. 1042, Huafukang Bioscience, China) [24], and those with a random blood glucose level > 16.7 mM were considered T2DM mice. Then, KK-Ay mice were fed an HFD for 8 consecutive weeks. Male C57BL/6 mice fed a normal chow diet (no. 1022, Huafukang Bioscience Co. Inc, China) for the same period were used as control mice.
Dual luciferase reporter assay
STAT3 cDNAs containing the putative (wild-type, STAT3-WT) or mutated binding site for miR-125a-5p were synthesized and then cloned into a pmiR-report vector. Mutations in the miR-125a-5p binding site were generated from 5'-CTCA GGGA-3' to 5'-GAGTCCCT-3' (Stat3-Mut1), 5'-CTCGGG-3' to 5'-GAGTCCC-3' (Stat3-Mut2) or at both binding sites (Stat3-Mut3). For the luciferase assay, AML-12 cells were transfected with a luciferase reporter construct together with miR-125a-5p mimic or negative control oligos [25]. Cells were cotransfected with a reporter plasmid encoding firefly luciferase for normalization purposes. The cells were collected 24 h after transfection and assayed with a luminometer (LB960; Berthold Technologies, Germany).
Glucose metabolism test
In vivo experiments: Oral glucose tolerance test (OGTT) and insulin tolerance test (ITT) were performed. In OGTT, the animals were fasted for 6 h and orally administrated glucose at a dose of 2 g/kg [26]. In ITT, the animals were intraperitoneally injected with insulin at 0.4 IU/kg. Blood samples were taken from the tail vein at 0, 30, 60, 90 and 120 min after glucose or insulin administration, and blood glucose levels were measured. The content of liver glycogen was measured by kits according to protocols.
In vitro experiments: The level of glucose consumption and cellular glycogen content were measured using assay kits according to their protocols. Cell glucose consumption was evaluated by incubating cells with 0.1 mM fluorescent glucose analog 2-NBDG for 20 min. After incubation, free 2-NBDG was washed out from cultures and the remaining fluorescence in cells was observed by fluorescence microscopy (Olympus, Tokyo, Japan).
Lipid metabolism test
In vivo experiments: The levels of TG, TC, LDL, HDL and FFA in serum were measured by kits according to their protocols.
In vitro experiments: TG content in cells was measured using a kit according to its protocol.
PAS and Oil Red O staining
After in vivo experiments, liver tissues were removed and fixed in 10% polyoxymethylene solution for more than 24 h. Then, the livers were embedded in paraffin wax and sectioned for PAS staining to evaluate hepatic glycogen content. Frozen liver sections were stained with Oil Red O to evaluate lipid droplets in the liver. For in vitro experiments, Oil Red O staining was executed to examine cellular lipid accumulation. Cells were washed with PBS and fixed with 10% polyoxymethylene solution for 1 h. After that, cells were stained with Oil Red O for 30 min and then washed with 60% isopropanol and PBS in turn. Cell imaging was performed with a Nikon Eclipse TE2000-U microscope (NIKON, Japan).
qRT-PCR assay
Total RNA was extracted from livers or cells using RNAiso Plus. Total miRNA was extracted using a SanPrep Column Micro-RNA Mini-Prep kit. cDNA was synthesized from 2 μg of total RNA using a MicroRNA First Strand cDNA Synthesis Kit for miR-125a-5p and a PrimeScript® RT Reagent Kit with gDNA Eraser for mRNAs. Total RNA was reverse transcribed using a miR-125a-5p-specific stem-loop primer or mRNA primer. qRT-PCR was performed on a CFX96 PCR system (Bio-Rad Laboratories, USA) with SYBR Green Master Mix. The levels of mRNA and miR-125a-5p were normalized to those of β-actin and U6, respectively, and the relative level was analyzed using the 2-△△Ct method. Primer sequences are listed in Table S1.
Western blotting assay
Western blotting was performed according to standard protocols. Protein from liver tissue and cells was extracted using a protein extraction kit. Proteins were separated on a 10% SDS-PAGE gel and transferred to a PVDF membrane. The membrane was blocked with 5% nonfat milk and incubated with the appropriate primary antibody overnight at 4°C. After extensive washing, a goat anti-mouse secondary antibody was added. Target protein expression was detected via an enhanced chemiluminescence method and normalized to β-actin expression, and the results were photographed with a ChemiDoc™XRS Imaging System (Bio-Rad Laboratories, USA). The primary antibodies are listed in Table S2.
Silencing and overexpression of miR-125a-5p in mice
In experiment 1, C57BL/6 mice were injected with a miR-125a-5p agomir (5 mg/kg in 0.2 mL saline) through the tail vein three times on alternate days to overexpress miR-125a-5p (n = 6) according to a previous study with slight modification [27]. C57BL/6 mice injected with agomir NC oligos were used as the NC group (n = 6).
In experiment 2, C57BL/6 mice were injected with a miR-125a-5p antagomir (40 mg/kg) three times on alternate days to diminish the expression of miR-125a-5p (n = 6) [27]. C57BL/6 mice injected with antagomir NC oligos (antagomir-NC) were used as the NC group (n = 6). In another set, C57BL/6 mice received scrambled short-hairpin RNA (sh-NC), and antagomir-NC mice were used as the NC group; mice injected with shRNA-NC and the miR-125a-5p antagomir (40 mg/kg) were used as the Antagomir+sh-NC group, while mice injected with sh-STAT3 (1×10⁹ PFU/g) and the miR-125a-5p antagomir (40 mg/kg) served as the Antagomir+sh-STAT3 group. Adenovirus expressing sh-NC or sh-STAT3 was injected into mice through the tail vein for 5 days [28].
In experiment 3, KK-Ay mice were injected intravenously with the miR-125a-5p agomir (5 mg/kg) twice a week for four consecutive weeks to overexpress miR-125a-5p (n = 6) according to a previously described method [29-31]. Another group of KK-Ay mice injected with agomir NC oligos was used as the model group (n = 6). Meanwhile, C57BL/6 mice injected with agomir NC oligos were employed as the control group, and mice injected with the agomir (5 mg/kg) served as the C57+Agomir group (n = 6).
In experiment 4, KK-Ay mice were injected intravenously with miR-125a-5p antagomir (20 mg/kg) twice a week for four consecutive weeks to overexpress miR-125a-5p (n = 6) [29-31]. Another group of KK-Ay mice injected with antagomir NC oligos was used as the model group (n = 6). Meanwhile, C57BL/6 mice injected with antagomir NC oligos served as the control group, and mice injected with the antagomir (20 mg/kg) served as the C57+Antagomir group.
At the end period of each experiment, OGTT and ITT were carried out. Then, the animals were sacrificed, and the blood and liver tissues were collected and stored for further analysis.
Statistical analyses
The data are presented as mean ± SD. Statistical analysis was performed using Prism software (GraphPad). The statistical significance of differences among groups was analyzed via one-way ANOVA, followed by Newman-Keuls test. Comparisons between two groups were performed using an unpaired Student's t-test. P < 0.05 was considered statistically significant.
Results
miR-125a-5p level is decreased in livers of type 2 diabetic rats and mice
High-fat diet (HFD) and STZ-induced T2DM rats and KK-Ay mice were used as model animals in this study, and body weights are shown in Figure S1A-B. As shown in Figure 1A, the hepatic level of miR-125a-5p was markedly decreased in KK-Ay mice compared with C57BL/6 mice, which was also markedly reduced in the livers of type 2 diabetic rats compared with control rats.
Decreased level of miR-125a-5p in livers of T2DM mice and rats. The level of miR-125a-5p in livers of HFD-STZ-induced T2DM and chow-fed control rats, KK-Ay and C57BL/6 mice (A), and the expression level of STAT3 in liver tissues examined by qRT-PCR and Western blot assays (B). (C) The expression level of STAT3 in HepG2 and AML12 cells transfected with miR-125a-5p mimic or inhibitor for 24 h. (D) Luciferase activities in AML12 cells cotransfected with luciferase reporter constructs containing the wild-type or mutated 3'UTR of STAT3 mRNA (STAT3-WT, STAT3-MUT1, STAT3-MUT2 or STAT3-MUT3) and miR-125a-5p mimic or its negative control oligos (NC). (E) The expression level of STAT3 in HepG2 and AML12 cells transfected with STAT3-WT overexpression vector alone or together with miR-125a-5p mimic by qRT-PCR and Western blot assays. (F) The expression level of STAT3 in HepG2 and AML12 cells transfected with mutated 3'UTR STAT3 overexpression vector alone or together with miR-125a-5p mimic by qRT-PCR and Western blot assays. Data are expressed as mean ± SD (n = 5). **p<0.01, NS means no statistical difference.
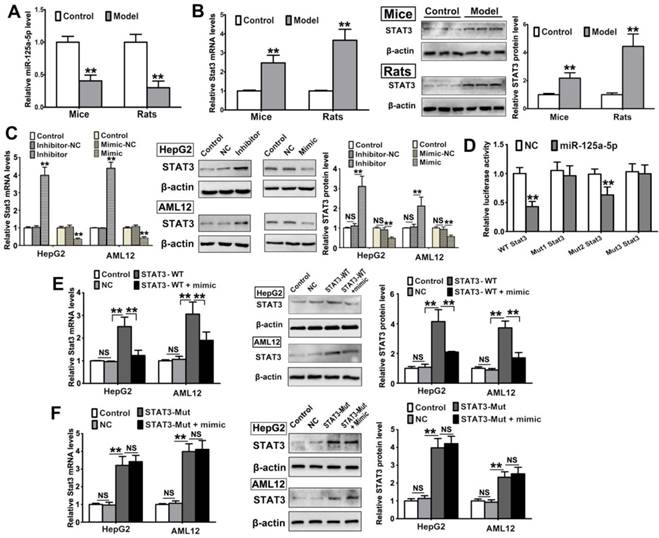
STAT3 is a direct target gene of miR-125a-5p
To address whether miR-125a-5p is involved in T2DM, two different computational programs, TargetScan (http://www.targetscan.org) and miRanda (http://www.microrna.org), were used to screen the target mRNAs of miR-125a-5p. A large number of mRNAs were found as predictive target genes. Among them, STAT3, which has important roles in diabetes, caught our attention. The Stat3 3'UTR contains two binding sites for miR-125a-5p: a site spanning 1107-1114 and a site at 1700-1706. The first binding site, spanning 1107-1114 (mouse), is conserved across humans (1515-1521) (Figure S2). We found that the expression levels of STAT3 in livers were significantly increased in T2DM rats and mice (Figure 1B). Moreover, inhibiting miR-125a-5p markedly upregulated STAT3 expression level and miR-125a-5p mimic reduced STAT3 expression level (Figure 1C). These data demonstrated a negative correlation between miR-125a-5p and STAT3.
To establish the effect of miR-125a-5p on the 3'UTR of STAT3, a dual luciferase assay was performed. As shown in Figure 1D, upon cotransfection of AML12 cells with a STAT3-WT reporter vector and miR-125a-5p using Lipofectamine 2000, the luciferase activity was dramatically decreased. The luciferase activity in cells transfected with a binding site 2 mutant (STAT3-Mut2) was similar to that in cells transfected with STAT3-WT. Mutation of binding site 1 (STAT3-Mut1) and of both binding sites (STAT3-Mut3) completely reversed the inhibitory effect of miR-125a-5p. Similar results also indicated that cotransfection with STAT3-Mut and miR-125a-5p reduced the effect of miR-125a-5p on STAT3 expression compared with STAT3-WT and miR-125a-5p cotransfection (Figure 1E-F) of HepG2 and AML12 cells. Although HepG2 cells are human hepatocellular carcinoma cells, their bioactivities are similar to those of normal hepatocytes, and they have been widely used in a variety of studies on metabolic diseases, such as type 2 diabetes [32,33]. These results indicated that miR-125a-5p targeted the 3'UTR of STAT3, and specifically regulated its expression in hepatocytes.
Disorders of STAT3 pathway and glycolipid metabolism in T2DM rats and mice
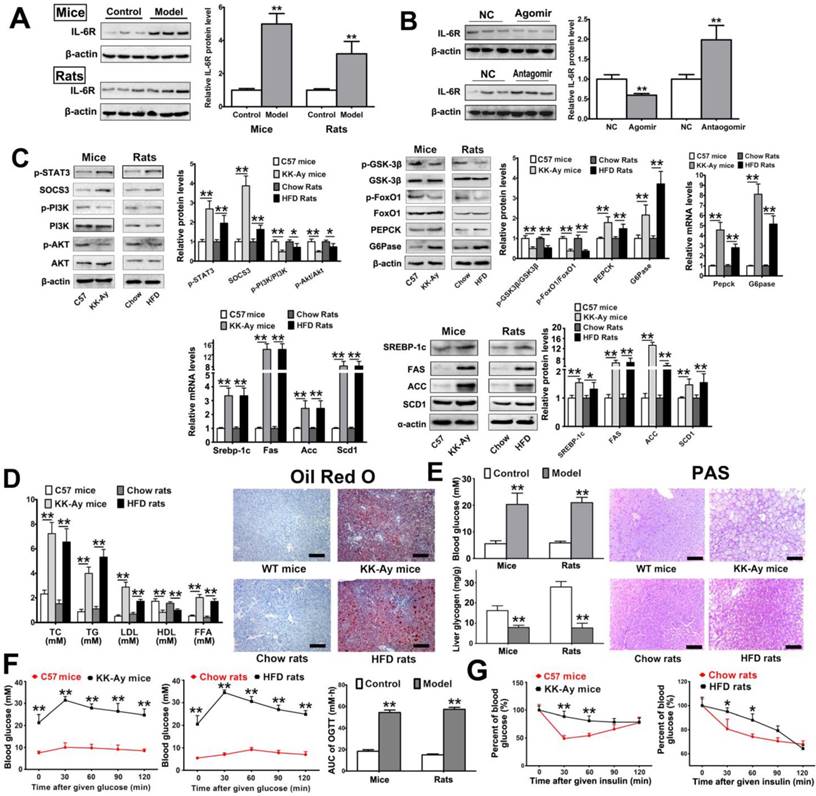
Given that STAT3 is a major molecule in glycolipid metabolism, we assessed the expression levels of certain proteins and genes associated with STAT3 pathway. The activation of STAT3 can be induced by interleukin-6 (IL-6) via binding IL-6 receptor (IL-6R). We evaluated the hepatic expression level of IL-6R and found that it was significantly increased in diabetic mice and rats (Figure 2A). The data indicated that overexpression of miR-125a-5p markedly downregulated the expression level of IL-6R, while silencing of miR-125a-5p significantly increased hepatic IL-6 level in C57 BL/6 mice (Figure 2B). Given that STAT3 is a major molecule in glycolipid metabolism, the expression levels of p-STAT3 and SOCS3 were upregulated in liver tissues of T2DM mice and rats, while the levels of p-PI3K/PI3K and p-AKT/AKT were decreased (Figure 2C). Due to the reduction in PI3K/AKT, the phosphorylation levels of GSK-3β and FoxO1 were both decreased, and the levels of gluconeogenic enzymes, including phosphoenolpyruvate carboxykinase (PEPCK) and glucose 6-phosphatase (G6Pase), were accordingly increased (Figure 2C). Meanwhile, the expression levels of proteins and genes associated with lipogenesis, including SREBP-1c, fatty acid synthase (FAS), acetyl-CoA carboxylase (ACC) and stearoyl-CoA desaturase-1 (SCD1), were all increased (Figure 2C). In addition, the total cholesterol (TC), TG, low-density lipoprotein (LDL) and free fatty acid (FFA) levels in serum were all increased, and the level of high-density lipoprotein (HDL) was decreased (Figure 2D). Abundant lipid droplets and elevated lipid accumulation were found in the model group based on Oil Red O staining (Figure 2D). Meanwhile, increased blood glucose levels and decreased liver glycogen content were found in T2DM mice and rats (Figure 2E). Compared with control groups, the animals in model groups showed poor glucose tolerance and insulin sensitivity based on oral glucose tolerance tests (OGTTs) and insulin tolerance tests (ITTs) (Figure 2F-G). Therefore, with the reduced inhibitory effect of miR-125a-5p on STAT3, the signaling pathways associated with lipogenesis and gluconeogenesis were upregulated, and glycogen synthesis was downregulated. Ultimately, hyperglycemia and hyperlipidemia appeared.
Glycolipid metabolism disorders in T2DM mice and rats. (A) The hepatic expression levels of IL-6R in diabetic mice and rats. C57 mice (C57BL/6) and chow rats (chow diet) were used as control animals, while KK-Ay mice and HFD rats (STZ and high-fat diet induced rats) were used as the T2DM model group (n = 8). (B) The hepatic expression levels of IL-6R in C57BL/6 mice treated with miR-125a-5p agomir (10 mg/kg) or antagomir (40 mg/kg) (n = 6). Mice injected with agomir/antagomir control oligos was used as NC group. (C) The hepatic expression levels of proteins and genes involved in glycolipid metabolism measured by qRT-PCR and Western blot assays (n = 5). (D) The levels of TC, TG, LDL, HDL and FFA in serum and Oil Red O staining of liver tissues. (E) The blood glucose level, liver glycogen content and PAS staining of liver tissue. (F) Oral glucose tolerance test (OGTT) in mice and rats. The blood glucose-time curves and AUC0-120 min of mice and rats from OGTT (n = 8). (G) The changed ratios of blood glucose-time curves of mice and rats from insulin tolerance test (ITT). Data are listed as mean ± SD (n = 8). ** p < 0.01 and * p < 0.05, compared with control group. Scale bar = 100 μm.
Overexpression or silencing of miR-125a-5p causes hepatic glycolipid metabolic disorder in C57BL/6 mice
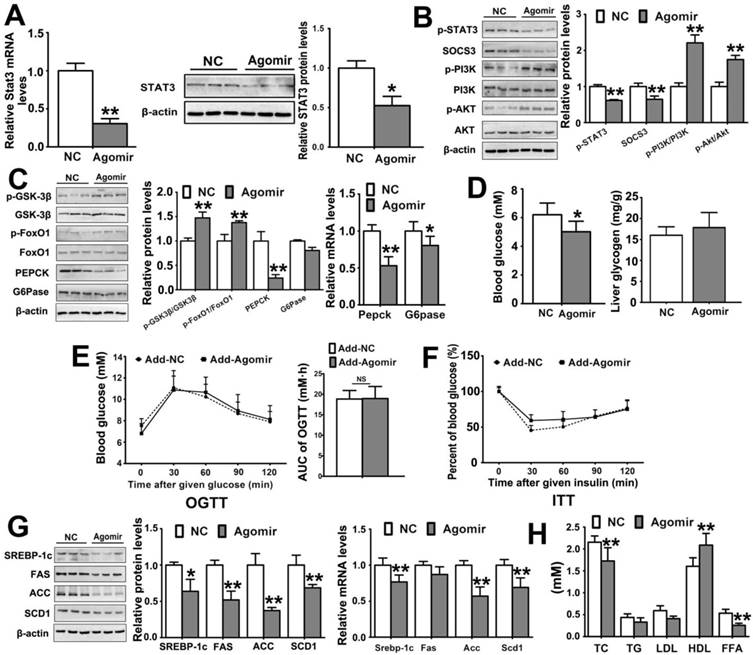
To demonstrate whether miR-125a-5p is involved in regulating glucose and lipid metabolism through targeting of STAT3, we examined the effects of miR-125a-5p on the expression levels of genes and proteins associated with glycogen synthesis, gluconeogenesis and lipogenesis after agomir-mediated miR-125a-5p overexpression in C57BL/6 mice (body weights of the mice are shown in Figure S1C). We found that overexpression of miR-125a-5p reduced the expression level of STAT3 (Figure 3A), and decreased STAT3 phosphorylation and SOCS3 expression (Figure 3B). SOCS3, a negative regulator of cytokine signaling, can suppress PI3K/Akt activation [34]. In the present work, as shown in Figure 3B, the phosphorylation levels of PI3K and AKT were all increased by miR-125a-5p agomir treatment. In addition, we found that miR-125a-5p overexpression significantly increased the phosphorylation levels of GSK-3β and FoxO1 (Figure 3C), which are two major downstream target genes of PI3K/AKT and two important proteins that affect hepatic glucose production. Increased hepatic expression levels of G6Pase and PEPCK induced by miR-125a-5p were also found, and the blood glucose level was reduced (Figure 3D). OGTT and ITT results showed that there was no significant difference in glucose and insulin tolerance between C57BL/6 mice injected with miR-125a-5p agomir and those injected with the NC (Figure 3E-F). The increased liver glycogen content was not significant (Figure 3D). Recent studies have shown that increased SOCS3 level can enhance SREBP1 expression, a key regulator of fatty acid synthesis in the liver [35,36]. In the present work, we found that the expression and transcription levels of SREBP-1c were all decreased in miR-125a-5p agomir-treated C57BL/6 mice (Figure 3G). The expression levels of the genes and proteins downstream of SREBP-1c, including FAS, ACC and SCD1 associated with fatty acid synthesis, were also decreased (Figure 3G). The serum TC and FFA levels were decreased, and HDL level was increased in mice injected with agomir (Figure 3H), suggesting that miR-125a-5p negatively regulated lipogenetic pathway and partly reduced lipidemia by inhibiting STAT3. These results preliminarily indicated that miR-125a-5p affected hepatic glucose production by targeting STAT3.
Overexpression of miR-125a-5p with an agomir regulates STAT3 pathway and affects glycolipid metabolism in C57BL/6 mice. C57BL/6 mice were injected with miR-125a-5p agomir (10 mg/kg) or agomir control oligos (NC) via tail vein (n = 6). (A) The expression level of STAT3 in liver of mice. (B) The expression levels of some downstream proteins including p-STAT3, SOCS3, PI3K, p-PI3K, AKT and p-AKT in liver tissues of mice. The expression levels of some downstream proteins and genes associated with glucose metabolism (C), and blood glucose and liver glycogen contents (D) of mice. The blood glucose levels and areas under the curves of blood glucose versus time (AUC) were calculated from OGTT (E), which were used to evaluate the glucose tolerance of mice. The ratios of blood glucose changes in ITT are listed in (F), which can evaluate the insulin sensitivity of mice. (G) The expression levels of some downstream proteins and genes associated with lipogenesis. (H) The levels of TC, TG, LDL, HDL and FFA in serum. Values are listed as the mean ± SD. *p < 0.05, **p<0.01 compared with C57BL/6 mice in NC group.
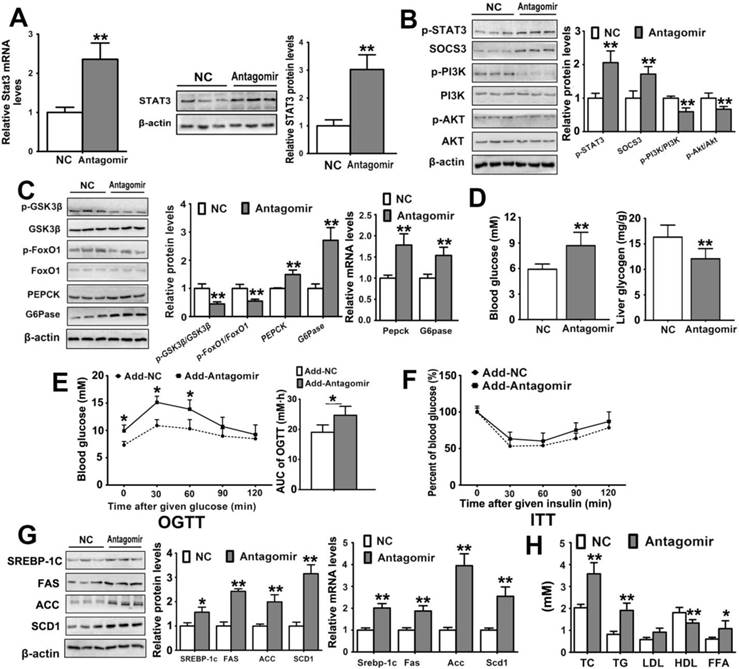
To further investigate the underlying function of miR-125a-5p in glycolipid metabolism, we also examined the alterations in miR-125a-5p/STAT3 pathway after miR-125a-5p silencing. Antagomirs are RNA-like oligonucleotides that can improve pharmacologic properties and efficiently silence target miRNAs in most tissues in vivo [37,38]. After silencing of miR-125a-5p with an antagomir, qPCR was performed to verify the silencing efficiency in liver tissue (Figure S3A). The results showed that miR-125a-5p antagomir significantly increased hepatic STAT3 gene and protein levels in mice (Figure 4A) and upregulated the expression levels of p-STAT3 and SOCS3 (Figure 4B). As a result, increased SOCS3 expression significantly suppressed the phosphorylation levels of PI3K and AKT (Figure 4B), and consequently reduced p-GSK-3β and p-FoxO1 levels (Figure 4C). Thus, the levels of PEPCK and G6Pase were also increased in the liver tissue of mice treated with miR-125a-5p antagomir (Figure 4C). The blood glucose level was increased, and the level of liver glycogen was reduced (Figure 4D). Body weights of the mice are shown in Figure S1D. These results indicated that the decreased inhibitory effect of miR-125a-5p on STAT3 significantly increased hepatic gluconeogenesis, decreased glycogen synthesis, and induced hyperglycemia in C57BL/6 mice. The miR-125a-5p antagomir heightened the blood glucose levels of mice at 0, 30 and 60 min after glucose administration in OGTTs and elevated the AUC0-120 min values of OGTT (p < 0.05) but did not alter the ITT results (Figure 4E-F). Meanwhile, the expression levels of the genes and proteins including SREBP-1c, FAS, ACC and SCD1 associated with hepatic lipogenesis were dramatically increased (Figure 4G). The serum TC, TG, and FFA levels were increased, and the level of HDL was decreased (Figure 4H), which revealed that inhibition of miR-125a-5p significantly increased hepatic lipogenesis in C57BL/6 mice.
Silencing miR-125a-5p with an antagomir regulates STAT3 pathway and causes hyperglycemia and hyperlipidemia in C57BL/6 mice. C57BL/6 mice were injected with miR-125a-5p antagomir (40 mg/kg) via tail vein three times every two days (n = 6). (A) The hepatic expression levels of STAT3 by qRT-PCR and Western blot assays. (B) Western blot assays of p-STAT3, SOCS3, PI3K, p-PI3K, AKT and p-AKT in liver tissue of mice. (C) The hepatic expression levels of proteins and genes associated with gluconeogenesis and glycogen synthesis in mice, including p-FoxO1, FoxO1, p-GSK-3β, GSK-3β, PEPCK and G6Pase, by qRT-PCR and Western blot assays. (D) The levels of blood glucose and liver glycogen in mice. The blood glucose levels and areas under the curves of blood glucose versus time (AUC) were calculated in OGTT (E), which were used to evaluate the glucose tolerance of mice. The ratios of blood glucose changes in ITT are listed in (F), which can evaluate the insulin sensitivity of mice. (G) The hepatic expression levels of genes and proteins associated with SREBP-1c-mediated lipogenesis pathway by qRT-PCR and Western blot assays. (H) The levels of TC, TG, LDL, HDL and FFA in serum. Values are listed as the mean ± SD. *p < 0.05, **p < 0.01 compared with NC group.
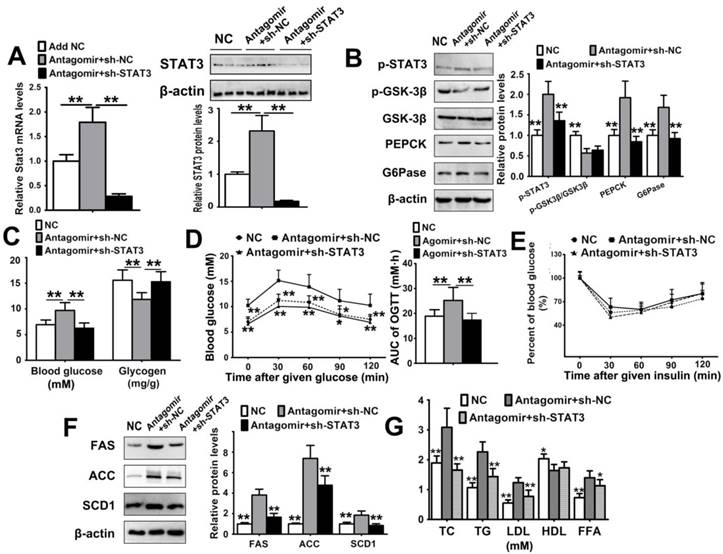
To verify the regulatory role of miR-125a-5p in glycolipid metabolic through targeting of STAT3, we silenced STAT3 in mice administered antagomir (Figure 5A). After STAT3 silencing, the increased STAT3, p-STAT3, PEPCK and G6Pase expression levels caused by miR-125a-5p antagomir were dramatically reduced, and the expression level of p-GSK-3β was also attenuated by STAT3 inhibition (Figure 5B). As a result, the elevated blood glucose and suppressed hepatic glycogen content were also relieved by STAT3 silencing (Figure 5C). Furthermore, the increased AUC0-120 min value of the OGTT was also reduced by silencing of STAT3 (Figure 5D), but STAT3 silencing did not affect the ITT results (Figure 5E). We also found that silencing STAT3 in mice treated with miR-125a-5p antagomir significantly reduced the expression levels of FAS, ACC and SCD1 (Figure 5F) and ameliorated hyperlipidemia (Figure 5G). Taken together, these results indicated that reduction of miR-125a-5p can increase hepatic gluconeogenesis, decrease glycogen synthesis and increase lipogenesis through STAT3.
Silencing STAT3 attenuates glycolipid metabolism disorder caused by inhibiting miR-125a-5p expression in C57BL/6 mice. Mice were injected with miR-125a-5p antagomir (40 mg/kg) via the tail vein three times every two days (n = 6), and infected with adenoviruses expressing STAT3 shRNA (sh-STAT3) or control sequence (sh-NC) for 5 days. Mice in the NC group were injected with antagomir control oligos and sh-NC simultaneously. (A) The hepatic expression level of STAT3 by qRT-PCR and Western blot assays. (B) Western blot assays of p-STAT3, p-GSK-3β, GSK-3β, PEPCK and G6Pase in liver tissue of mice. (C) The levels of blood glucose and liver glycogen in mice. (D) The blood glucose levels and areas under the curves of blood glucose versus time (AUC) were calculated in OGTT. (E) The ratios of blood glucose changes in ITT. (F) Western blot assays of FAS, ACC and SCD1 in liver tissue of mice. (G) The levels of TC, TG, LDL, HDL and FFA in serum. Values are listed as the mean ± SD. *p < 0.05, **p < 0.01 compared with Antagomir+sh-NC group.
miR-125a-5p ameliorates glucose and lipid metabolic disorders in vitro by inhibiting STAT3 pathway
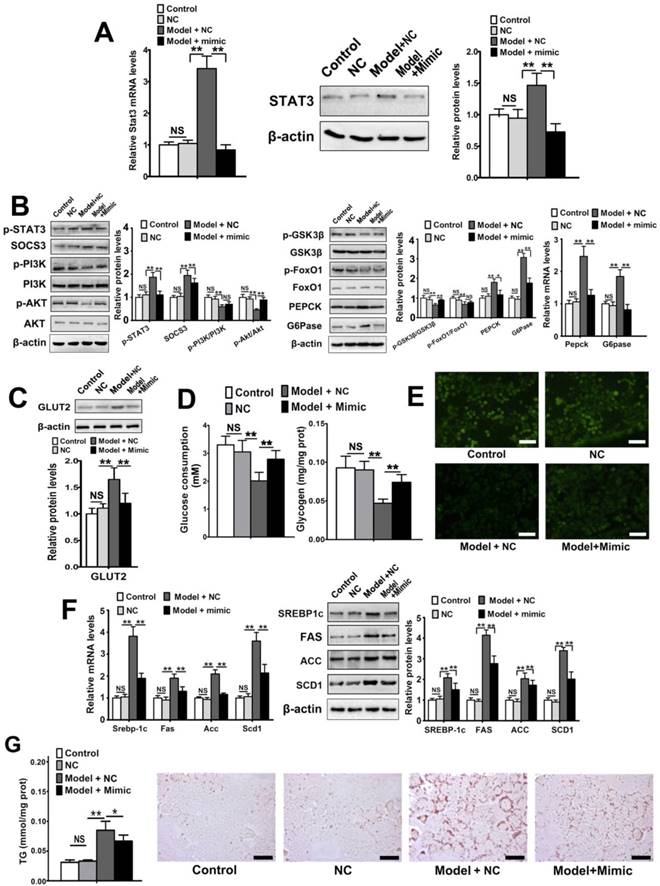
We subsequently explored the regulatory effect of miR-125a-5p on metabolic disorder in AML12 cells induced by palmitic acid. The expression level of miR-125a-5p was significantly decreased (Figure S4) and the level of STAT3 was elevated in model cells compared with normal cells, while miR-125a-5p addition significantly lowered STAT3 expression in model cells (Figure 6A). Next, we explored alterations in the downstream pathway and glycolipid metabolism in AML12 cells. STAT3 phosphorylation and SOCS3 expression level were upregulated compared with normal cells, while a miR-125a-5p mimic reduced their expression levels (Figure 6B). Consequently, the phosphorylation levels of PI3K, AKT, GSK-3β and FoxO1 were downregulated, and the expression levels of PEPCK and G6Pase were upregulated due to the decreased level of miR-125a-5p in model AML12 cells (Figure 6B). The miR-125a-5p mimic also reversed the changes in the expression levels of the proteins mentioned above compared with model cells (Figure 6B). Due to low affinity and high capacity, glucose transporter 2 (GLUT2) ensures large bidirectional fluxes of glucose in and out of liver cells. Overexpression of GLUT2 has been found in hepatocytes of diabetic animals [39,40], which can increase glucose efflux because of insulin resistance-induced metabolic alterations. Our results found that the expression level of GLUT2 was increased in metabolic disordered AML12 cells (Model + NC group) but was reduced by miR-125a-5p overexpression (Model+Mimic group). Moreover, glucose consumption and glycogen content were all increased by miR-125a-5p addition (Figure 6D), and glucose uptake was also increased in miR-125a-5p mimic-transfected cells (Figure 6E) compared with model cells. Furthermore, SREBP-1c-mediated lipogenetic pathway was consequently activated in model cells due to the increased expression of SOCS3, but miR-125a-5p mimic transfection significantly suppressed SREBP-1c-mediated lipogenetic pathway compared with model cells (Figure 6F). Moreover, miR-125a-5p mimic reduced TG levels and lipid accumulation in model AML12 cells (Figure 6G). These results demonstrated that miR-125a-5p overexpression suppressed STAT3, resulting in remission of glycolipid metabolism disorder in AML12 cells.
miR-125a-5p overexpression ameliorated palmitic acid-induced glycolipid metabolism disorder of AML12 cells via regulating STAT3 pathway. AML12 cells were transfected with miR-125a-5p mimic (50 nM) for 24 h, and then palmitic acid (0.1 mM) for 24 h was used to induce glycolipid metabolism disorder. (A) STAT3 mRNA and protein levels were examined by qRT-PCR and Western blot assays. (B) qRT-PCR and Western blot assays of the expression levels of some proteins and genes associated with glucose metabolism in AML12 cells. (C) The expression levels of GLUT2 and GLUT4 in AML12 cells by Western blot assay. (D) Glucose consumption and glycogen content in AML12 cells. (E) The glucose uptake in AML12 cells was evaluated by 2-NBDG staining. Cells were incubated with 0.1 mM 2-NBDG for 20 min. Then, the cells were washed with PBS and observed by fluorescence microscopy. Scale bar = 100 μm. (F) qRT-PCR and Western blot assays of the genes and proteins associated with SREBP-1c-mediated lipogenesis pathway in AML12 cells. (G) TG content and lipid accumulation based on Oil Red O staining of cells. After being washed and fixed, the cells were staining with Oil Red O for 30 min, then washed and observed. Scale bar = 50 μm. Values are listed as the mean ± SD. *p < 0.05, **p<0.01, NS means no statistical difference.
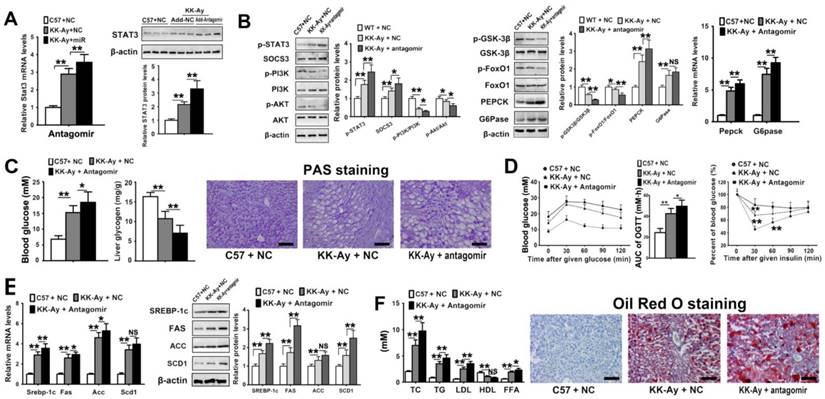
Inhibiting miR-125a-5p exacerbates glucose and lipid metabolic disorders via suppression of STAT3 pathway in KK-Ay mice
Although the in vivo and in vitro results demonstrated that miR-125-5p modulated glycolipid metabolism in C57BL/6 mice and hepatic AML12 cells, we also investigated the effect of miR-125a-5p on ameliorating glycolipid metabolism disorder in T2DM mice. First, we examined the hepatic expression level of STAT3 in KK-Ay mice, and the results indicated that the gene and protein expression levels of STAT3 were markedly higher in KK-Ay mice than in C57BL/6 mice (Figure 7A), which were in accordance with the results of our previous experiments (Figure 1B). After treatment with miR-125a-5p antagomir (silencing efficiency results are shown in Figure S3B), the hepatic level of STAT3 was further increased in both KK-Ay mice (Figure 7A) and C57BL/6 mice (Figure S5A). Due to the elevated hepatic level of STAT3 caused by miR-125a-5p antagomir, the hepatic expression levels of p-STAT3 and SOCS3 were also markedly elevated in KK-Ay mice (Figure 7B). Their downstream proteins including phosphorylated PI3K, AKT, GSK-3β and FoxO1 and PEPCK and G6Pas associated with gluconeogenic and glycogen synthetic pathways were markedly changed compared with those of the model group (Figure 7B). As a consequence, elevated blood glucose level and decreased liver glycogen content were found in miR-125a-5p antagomir-treated KK-Ay mice (Figure 7C). Body weights of the mice are shown in Figure S1E. The OGTT and ITT results indicated that glucose tolerance and insulin sensitivity were further impaired by the antagomir in KK-Ay mice (Figure 7D). We also examined the effect of miR-125a-5p antagomir on lipid metabolism in KK-Ay mice. As shown in Figure 7E, miR-125a-5p antagomir further aggravated the expression levels of the proteins associated with SREBP-1c-mediated lipogenesis in STAT3 pathway, and markedly increased serum TC, TG, LDL and FFA levels compared with model mice (Figure 7F). Oil Red O staining indicated increased accumulation of lipid droplets in the liver tissue of KK-Ay mice injected with miR-125a-5p antagomir (Figure 7F). Meanwhile, in C57BL/6 mice injected with the antagomir for 4 weeks, glucose homeostasis disruption and hyperlipidemia were observed (Figure S5), similar to those of diabetic mice. However, these disorders in mice in the C57+Antagomir group were worse than those in C57BL/6 mice treated three times (Figure 4), perhaps due to the longer antagomir treatment period. Taken together, these data demonstrated that miR-125a-5p inhibition exacerbated hyperglycemia and hyperlipidemia, enhanced hepatic lipogenesis and gluconeogenesis, and suppressed glycogen synthesis through up-regulation of STAT3.
Silencing of miR-125a-5p aggravated glycolipid metabolism disorder via regulating STAT3 pathway in diabetic mice. C57BL/6 mice were injected with negative control oligos (C57 + NC), and KK-Ay mice were injected with NC (KK-Ay + NC) or miR-125a-5p antagomir (20 mg/kg, KK-Ay + antagomir) twice a week for 4 continuous weeks (n = 6). The expression level of STAT3 (A) and downstream proteins and genes associated with glucose metabolism (B) in liver tissue of mice measured by qPT-PCR and Western blot assays. The levels of blood glucose and liver glycogen, and PAS staining of liver tissue in mice (C). (D) The blood glucose-time curves and AUC0-120 min OGTT and the changed ratio of blood glucose-time curves of ITT in mice. (E) qRT-PCR and Western blot assays of the genes and proteins associated with SREBP-1c-mediated lipogenesis pathway in livers of mice. (F) The levels of TC, TG, LDL, HDL and FFA in serum, and Oil Red O staining of liver tissue of mice. Values are listed as the mean ± SD. *p < 0.05, **p<0.01, NS means no statistical difference. Scale bar = 100 μm.
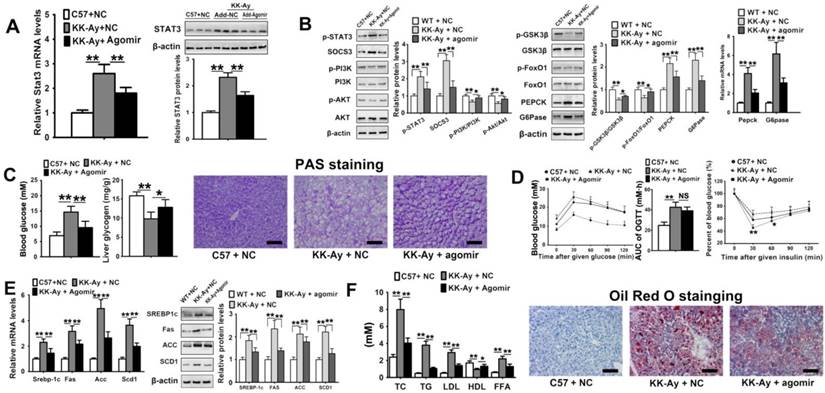
miR-125a-5p ameliorates glucose and lipid metabolic disorders by inhibiting STAT3 pathway in KK-Ay mice
Because hepatic miR-125a-5p was decreased in diabetic mice, we explored whether glucose and lipid metabolic disorder could be ameliorated by miR-125a-5p overexpression in KK-Ay mice. The hepatic STAT3 expression levels were reduced by miR-125a-5p agomir treatment in both KK-Ay mice (Figure 8A) and C57BL/6 mice (Figure S5A). The hepatic levels of p-STAT3 and SOCS3 were decreased by agomir intervention to attenuate the decreased hepatic phosphorylation levels of PI3K, AKT, GSK-3β and FoxO1 (Figure 8B). The increased levels of PEPCK and G6Pase were reduced in diabetic KK-Ay mice injected with miR-125a-5p agomir (Figure 8B). As a result, hyperglycemia in KK-Ay mice was attenuated by e miR-125a-5p agomir, and liver glycogen content was increased (Figure 8C). Body weights of the mice are shown in Figure S1F. Meanwhile, the OGTT and ITT results indicated that miR-125a-5p overexpression also ameliorated glucose tolerance and insulin sensitivity in KK-Ay mice (Figure 8D). The SREBP-1c-mediated lipogenetic pathway was also suppressed in KK-Ay mice treated with miR-125a-5p agomir (Figure 8E). The increased serum TC, TG, LDL and FFA levels were reduced, and the decreased HDL level was elevated by agomir treatment (Figure 8F). The accumulation of lipid droplets was significantly decreased (Figure 8F). After injection with agomir for 4 weeks, increased hepatic glycogen level and decreased serum levels of TC and FFA in C57BL/6 mice were found (Figure S5), which were similar to those in the C57BL/6 mice treated with agomir 3 times (Figure 3). Collectively, these results demonstrated that elevation of miR-125a-5p in diabetic mice can decrease hyperglycemia and hyperlipidemia through inhibition of STAT3-mediated hepatic lipogenesis, gluconeogenesis and glycogen synthesis.
Overexpression of miR-125a-5p ameliorated glycolipid metabolism disorder via regulating STAT3 pathway in diabetic mice. C57BL/6 mice were injected with negative control oligos (C57 + NC), and KK-Ay mice were injected with NC (KK-Ay + NC) or miR-125a-5p agomir (5 mg/kg, KK-Ay + agomir) twice a week for 4 continuous weeks (n = 6). The expression level of STAT3 (A) and the downstream proteins and genes associated with glucose metabolism (B) in liver tissue of mice measured by qPT-PCR and Western blot assays. The levels of blood glucose and liver glycogen, and PAS staining of liver tissue of mice (C). (D) The blood glucose-time curves and AUC0-120 min OGTT and the changed ratio of blood glucose-time curves of ITT in mice. (E) qRT-PCR and Western blot assays of the genes and proteins associated with SREBP-1c-mediated lipogenesis pathway in livers of mice. (F) The levels of TC, TG, LDL, HDL and FFA in serum, and Oil Red O staining of liver tissue of mice. Values are listed as the mean ± SD. *p < 0.05, **p<0.01, NS means no statistical difference. Scale bar = 100 μm.
Discussion
It has been widely reported that T2DM is a complex pathological process, and a number of miRNAs are related to the disease. miR-122, an abundant and conserved hepatic miRNA, has been reported to be related to hepatic insulin resistance, while its upregulation can reverse insulin resistance [41]. However, due to the complexity of T2DM, it is also critical to seek miRNAs involved in glycolipid metabolism regulation. In the present study, we provided evidence to support the critical role for the reduced expression of hepatic miR-125a-5p in the glycolipid metabolic disorder associated with T2DM. A reduced miR-125a-5p level was found in liver tissues from diabetic rats and mice and in metabolic disordered hepatocytes induced by palmitic acid. We found that silencing of miR-125a-5p aggravated hyperglycemia and hyperlipidemia in both normal and diabetic mice. However, an improvement in metabolic disorder was also found with miR-125a-5p overexpression in vitro and in vivo. Studies have suggested that overexpression of miR-125a-5p can reduce lipid accumulation [42], which is consistent with our findings. These results supported the idea that miR-125a-5p contributes to glycolipid metabolism in T2DM.
There are a few reports showing altered expression of miR-125a-5p in T2DM and other metabolic diseases. Herrera et al. reported that the miR-125a level was reduced in the liver of spontaneously diabetic Goto Kakizaki (GK) rats compared with Brown-Norway (BN) rats [43], which is contrary to our results. However, GK and BN rats are genetically different strains, and it is therefore possible that strain differences unrelated to T2DM could contribute to the altered expression of the miRNA. GK rats are a nonobese T2DM model characterized by hyperglycemia, impaired insulin secretion and increased hepatic glucose production but without hyperlipidemia and accumulation of fat in hepatocytes. In this study, we observed decreased hepatic expression of miR-125a-5p in both HFD/STZ induced rats and spontaneously diabetic KK-Ay mice. The model rats induced with HFD/STZ have the same genetic background as the normal rats. This model involved combination of an HFD to induce hyperlipidemia, hyperinsulinemia, and glucose intolerance followed by treatment with STZ, which results in a reduction in functional β-cells. Together, HFD/STZ-induced rats are designed to mimic the pathology of type 2 diabetes but on a shorter timescale than that found in the human condition [44]. Therefore, this model is more credible for evaluating the effect of miR-125a-5p on glycolipid disorder. However, considering destruction to pancreatic islets caused by STZ, although HFD/STZ is a reasonable animal model of T2DM, it mainly represents the later stage of the disease depending on the amount of residual β-cell mass [44]. Moreover, in accordance with our observations, Tessitore et al. have indicated that hepatic miR-125a-5p expression can be downregulated in HFD-induced NAFLD mice who possess hepatic lipid accumulation, obesity and insulin resistance simultaneously [45]. These findings indicated a possible mechanism of miR-125a-5p associated with glycolipid disorder and insulin resistance in metabolic diseases.
In a subsequent study, we found that hepatic miR-125a-5p and STAT3 showed an inverse pattern of expression in T2DM animals, and we identified STAT3 as a target gene of miR-125a-5p. In agreement with our data, hepatic STAT3 expression was reduced and was inversely correlated with miR-125a-5p expression in calorie restriction-mediated delay of aging mice [22]. Of note, STAT3 was verified as a target gene of miR-125a-5p by a dual luciferase assay in the current study, which confirmed their relationship more objectively. Aging is accompanied by various age-associated pathologies, such as metabolic diseases, while calorie restriction is known to delay aging and ameliorate insulin resistance in diabetes. In concordance with our observations, Makwana et al. have revealed that calorie restriction can significantly upregulate the expression level of miR-125a-5p, suppress STAT3 expression, and delay the aging of mice [22]. We also observed that overexpression of miR-125a-5p can significantly inhibit STAT3 activity and ameliorate the status of diabetic mice.
Activation of STAT3 has been reported to be involved in the development of diabetic insulin resistance. Kim et al. have demonstrated that metformin can ameliorate hepatic insulin resistance by regulating STAT3-dependent pathway, gluconeogenesis and insulin sensitivity [46]. The mechanisms of insulin sensitization and the lipid profile effects of bromocriptine, a novel therapeutic option for type 2 diabetes, are related to inhibition of the JAK/STAT3/SOCS3 axis [47]. These studies revealed that drugs can achieve their anti-diabetic effects by regulating STAT3, which can act as a therapeutic target in T2DM. An elevated SOCS3 level is accompanied by STAT3 activation in obese and diabetic animals [48-50]. However, the role of SOCS3 in the liver is controversial. Indeed, overexpression of SOCS3 in the liver can cause insulin resistance, whereas suppression of SOCS3 in obese diabetic mice can improve insulin resistance [51,52]. Of note, it has also been indicated that hepatocyte-specific SOCS3-deficient mice exhibit obesity and systemic insulin resistance with age [53], and SOCS3 also increases the risk of increased lipogenesis, NAFLD and inflammation [54]. Our data showed that the expression levels of STAT3 and SOCS3 were simultaneously increased in contrast with miR-125a-5p level in livers of diabetic mice and rats. To intervene in the targeted downregulation of STAT3 by miR-125a-5p, we treated mice with miR-125a-5p antagomir and found that silencing of miR-125a-5p increased the expression levels of STAT3 and SOCS3 in mouse livers. Moreover, our findings demonstrated that the hepatic expression levels of the proteins downstream of miR-125a-p/STAT3/SOCS3 signaling, including PEPCK, G6Pase, FAS, SCD1 and ACC, were deregulated, leading to improvement of lipogenesis and gluconeogenesis and reduction of glycogen synthesis in diabetic animals. Furthermore, miR-125a-5p overexpression significantly inhibited STAT3 and the signal transduction of its downstream pathway in normal mice and reversed their expression changes in diabetic mice. While miR-125a-5p inhibition upregulated STAT3 level and then exacerbated the abnormal changes of the proteins in the downstream pathway in diabetic mice. These results supported the critical role of miR-125a-5p in regulating the glycolipid metabolism pathway.
T2DM has been considered as a chronic inflammation disease, and proinflammatory factors promote occurrence and development of insulin resistance. IL-6 activates STAT3 via binding to IL-6R, and then mediates the conduction of insulin signaling [55]. Li and Lei indicated that miR-125a is a direct regulator of IL-6R, and patients with diabetic nephropathy have been found with significant downregulation of miR-125a-5p [13]. Therefore, we examined hepatic expression levels of IL-6R, and found that the expression level of IL-6R was significantly increased in diabetic animals, which was negatively correlated with miR-125a-5p level. Furthermore, the disorders of glucose and lipid metabolism caused by inhibiting miR-125a-5p in mice were significantly attenuated by silencing STAT3, suggesting that the effect of miR-125a-5p on hepatic gluconeogenesis, glycogen synthesis and lipogenesis in mice treated with antagomir was achieved through STAT3.
Circulating miRNAs are remarkably stable and circulate in the bloodstream, which can make them highly attractive agents as communicators and diagnostic biomarkers for predicting their dysfunctions. Changes in the abundance and profile of circulating miRNAs reveal the development of various chronic diseases by differentiating normal activity from abnormal functions, including obesity, diabetes and other metabolic diseases [56,57]. In fact, the serum levels of miR-125a-5p have also been described in liver diseases [58]. Ortega et al. assessed the genome-wide circulating miRNA profile cross-sectionally and found a marked decrease of miR-125 in morbidly obese patients [12]. Moreover, miR-125 has also been identified as a decreased miRNA in T2DM patients through circulating miRNA profiling [56]. However, it is likely that circulating miRNAs can be detected owing to various transport mechanisms [59], which are not fully understood. In addition, circulating miRNAs not only correlate with tissue damage degree but also may reflect other secondary processes [60]. Despite these weak points, there is still much enthusiasm for detecting the profiles and levels of circulating miRNAs as diagnostic biomarkers of diabetes.
Regulation of miRNAs via viral-based and reagent-based transfection has been successfully achieved in animal experiments. However, accumulating evidence has shown that different miRNAs in T2DM have tissue-specific roles, which means that targeting miRNAs should be done in a specific, local manner [61]. Of note, although decreased miR-125a-5p level has been observed in diabetic patients, deregulation of the miR-125 family also has been conformed in other diseases [9,62]. It has been reported that miR-125a-5p is upregulated in liver fibrosis, while its downregulation inhibits hepatic stellate cell activation [63]. miR-125a-5p contributes to autoimmune diseases by stabilizing Treg-mediated immune homeostasis [64,65]. Furthermore, one miRNA can potentially target several genes, and manipulating microRNAs to gain a certain function can cause side effects in other important biochemical pathways. Thus, it is challenging to develop miRNA-specific therapeutics because of potential off-target effects. Therefore, this approach requires careful deliberation prior to clinical application and needs to be further investigated. Nevertheless, it has been indicated that some chemical compounds can disturb miRNAs implicated in the pathogenesis of diseases to achieve their therapeutic effects [66,67], which might be an alternative approach to effectively target miRNAs and prevent the progression of T2DM.
Conclusions
In this study, we provided new evidence for the decreased expression of hepatic miR-125-a-5p in the pathogenesis of T2DM and found that miR-125a-5p can regulate hepatic lipogenesis, gluconeogenesis and glycogen synthesis by targeting STAT3. Our studies reinforced that promoting miR-125a-5p expression is beneficial for glycolipid metabolism homeostasis in diabetes and thus constitutes a promising approach to combat metabolic disease.
Abbreviations
ACC: acetyl-CoA carboxylase; AKT: protein kinase B; FAS: fatty acid synthase; FFA: free fatty acid; FoxO1: forkhead transcription factors 1; G6Pase: glucose 6-phosphatase; GSK-3β: glycogen synthase kinase-3β; HDL: high density lipoprotein; HFD: high-fat diet; IL-6: interleukin-6; IL-6R: interleukin-6 receptor; ITT: insulin tolerance test; LDL: low density lipoprotein; miRNAs: microRNAs; MUT: mutate type; OGTT: oral glucose tolerance test; NC: negative control; NS: no significance; PEPCK: phosphoenolpyruvate carboxykinase; PI3K: phosphatidylinositol 3-kinase; qRT-PCR: quantitative reverse transcriptase polymerase chain reaction; SCD1: stearoyl-CoA desaturase-1; SOCS3: suppressor of cytokine signaling 3; STAT3: signal transducer and activator of transcription 3; SREBP-1c: sterol regulatory element binding protein-1c; STZ: streptozotocin; T2DM: type 2 diabetes mellitus; TC: total cholesterol; TG: triglyceride; UTR: untranslated region; WT: wild type.
Supplementary Material
Supplementary figures and tables.
Acknowledgements
This work was supported by the Key Research and Development Project of Liaoning Province (2017225090), the Project of Liaoning BaiQianWan Talents Program (2015-65), the Special Grant for Translational Medicine, Dalian Medical University (2015004) and the Basic Scientific Research Projects of Liaoning University (No. LF2017010).
Author Contributions
Lina Xu and Jinyong Peng designed experiments and wrote the final version of the manuscript. Lina Xu, Yue Li and Lianhong Yin performed experiments. Yan Qi and Zeyao Tang analyzed the data. Pengyuan Sun and Ming Xu performed the qRT-PCR. Huijun Sun assisted with study design and manuscript editing.
Competing Interests
The authors have declared that no competing interest exists.
References
1. Wild S, Roglic G, Green A, Sicree R, King H. Global prevalence of diabetes: estimates for the year 2000 and projections for 2030. Diabetes Care. 2004;27:1047-53
2. Rui L. Energy metabolism in the liver. Compr Physiol. 2014;4:177-97
3. Harada N, Oda Z, Hara Y, Fujinami K, Okawa M, Ohbuchi K. et al. Hepatic de novo lipogenesis is present in liver-specific ACC1-deficient mice. Mol Cell Biol. 2007;27:1881-8
4. Agius L. Glucokinase and molecular aspects of liver glycogen metabolism. Biochem J. 2008;414:1-18
5. Koliaki C, Roden M. Hepatic energy metabolism in human diabetes mellitus, obesity and non-alcoholic fatty liver disease. Mol Cell Endocrinol. 2013;379:35-42
6. Filipowicz W, Bhattacharyya SN, Sonenberg N. Mechanisms of post- transcriptional regulation by microRNAs: are the answers in sight? Nat Rev Genet. 2008;9:102-14
7. Wang J, Chen J, Sen S. MicroRNA as biomarkers and diagnostics. J Cell Physiol. 2016;231:25-30
8. Stêpieñ E£, Durak-Kozica M, Kamiñska A, Targosz-Korecka M, Libera M, Tylko G. et al. Circulating ectosomes: Determination of angiogenic microRNAs in type 2 diabetes. Theranostics. 2018;8:3874-90
9. Yin H, Sun Y, Wang X, Park J, Zhang Y, Li M. et al. Progress on the relationship between miR-125 family and tumorigenesis. Exp Cell Res. 2015;339:252-60
10. Che P, Liu J, Shan Z, Wu R, Yao C, Cui J. et al. miR-125a-5p impairs endothelial cell angiogenesis in aging mice via RTEF-1 downregulation. Aging Cell. 2014;13:926-34
11. Li D, Yang P, Xiong Q, Song X, Yang X, Liu L. et al. MicroRNA-125a/b-5p inhibits endothelin-1 expression in vascular endothelial cells. J Hypertens. 2010;28:1646-54
12. Ortega FJ, Mercader JM, Catalán V, Moreno-Navarrete JM, Pueyo N, Sabater M. et al. Targeting the circulating microRNA signature of obesity. Clin Chem. 2013;59:781-92
13. Li C, Lei T. Rs12976445 Polymorphism is associated with risk of diabetic nephropathy through modulating expression of microrna-125 and interleukin-6R. Med Sci Monit. 2015;21:3490-7
14. Liu LH, Li H, Li JP, Zhong H, Zhang HC, Chen J. et al. miR-125b suppresses the proliferation and migration of osteosarcoma cells through down-regulation of STAT3. Biochem Biophys Res Commun. 2011;416:31-8
15. Wang C, Dai J, Yang M, Deng G, Xu S, Jia Y. et al. Silencing of FGF-21 expression promotes hepatic gluconeogenesis and glycogenolysis by regulation of the STAT3-SOCS3 signal. FEBS J. 2014;281:2136-47
16. Senn JJ, Klover PJ, Nowak IA, Zimmers TA, Koniaris LG, Furlanetto RW. et al. Suppressor of cytokine signaling-3 (SOCS-3), a potential mediator of interleukin-6-dependent insulin resistance in hepatocytes. J Biol Chem. 2003;278:13740-6
17. Mashili F, Chibalin AV, Krook A, Zierath JR. Constitutive STAT3 phosphorylation contributes to skeletal muscle insulin resistance in type 2 diabetes. Diabetes. 2013;62:457-65
18. Kohjima M, Enjoji M, Higuchi N, Kato M, Kotoh K, Yoshimoto T. et al. Re-evaluation of fatty acid metabolism-related gene expression in nonalcoholic fatty liver disease. Int J Mol Med. 2007;20:351-8
19. Wan J, Che Y, Kang N, Wu W. SOCS3 blocks HIF-1α expression to inhibit proliferation and angiogenesis of human small cell lung cancer by downregulating activation of Akt, but not STAT3. Mol Med Rep. 2015;12:83-92
20. Zhang H, Ge Z, Tang S, Meng R, Bi Y, Zhu D. Erythropoietin ameliorates PA-induced insulin resistance through the IRS/AKT/FOXO1 and GSK-3β signaling pathway, and inhibits the inflammatory response in HepG2 cells. Mol Med Rep. 2017;16:2295-301
21. Collino M, Aragno M, Castiglia S, Tomasinelli C, Thiemermann C, Boccuzzi G. et al. Insulin reduces cerebral ischemia/reperfusion injury in the hippocampus of diabetic rats: a role for glycogen synthase kinase-3beta. Diabetes. 2009;58:235-42
22. Makwana K, Patel SA, Velingkaar N, Ebron JS, Shukla GC, Kondratov RVKV. Aging and calorie restriction regulate the expression of miR-125a-5p and its target genes Stat3, Casp2 and Stard13. Aging. 2017;9:1825-37
23. Yu H, Zheng L, Xu L, Yin L, Lin Y, Li H. et al. Potent effects of the total saponins from Dioscorea nipponica Makino against streptozotocin-induced type 2 diabetes mellitus in rats. Phytother Res. 2015;29:228-40
24. Xiao Y, Wang X, Wang B, Liu X, Xu X, Tang R. Long-term effect of biomineralized insulin nanoparticles on type 2 diabetes treatment. Theranostics. 2017;7:4301-12
25. Zhao L, Qi Y, Xu L, Tao X, Han X, Yin L. et al. MicroRNA-140-5p aggravates doxorubicin-induced cardiotoxicity by promoting myocardial oxidative stress via targeting Nrf2 and Sirt2. Redox Biol. 2018;15:284-96
26. Liu Q, Zhang FG, Zhang WS, Pan A, Yang YL, Liu JF. et al. Ginsenoside Rg1 inhibits glucagon-induced hepatic gluconeogenesis through Akt-FoxO1 interaction. Theranostics. 2017;7:4001-12
27. Kaur K, Vig S, Srivastava R, Mishra A, Singh VP, Srivastava AK. et al. Elevated hepatic miR-22-3p expression impairs gluconeogenesis by silencing the Wnt-responsive transcription factor Tcf7. Diabetes. 2015;64:3659-69
28. Zhuo S, Yang M, Zhao Y, Chen X, Zhang F, Li N. et al. MicroRNA-451 negatively regulates hepatic glucose production and glucose homeostasis by targeting glycerol kinase-mediated gluconeogenesis. Diabetes. 2016;65:3276-88
29. Zhang Y, Li C, Li H, Song Y, Zhao Y, Zhai L. et al. miR-378 activates the pyruvate-PEP futile cycle and enhances lipolysis to ameliorate obesity in mice. EBioMedicine. 2016;5:93-104
30. Rayner KJ, Sheedy FJ, Esau CC, Hussain FN, Temel RE, Parathath S. et al. Antagonism of miR-33 in mice promotes reverse cholesterol transport and regression of atherosclerosis. J Clin Invest. 2011;121:2921-31
31. Distel E, Barrett TJ, Chung K, Girgis NM, Parathath S, Essau CC. et al. miR33 inhibition overcomes deleterious effects of diabetes mellitus on atherosclerosis plaque regression in mice. Circ Res. 2014;115:759-69
32. Xiao Y, Wang X, Wang B, Liu X, Xu X, Tang R. Long-term effect of biomineralized insulin nanoparticles on type 2 diabetes treatment. Theranostics. 2017;7:4301-12
33. Liu Q, Zhang FG, Zhang WS, Pan A, Yang YL, Liu JF. et al. Ginsenoside Rg1 inhibits glucagon-induced hepatic gluconeogenesis through Akt-FoxO1 interaction. Theranostics. 2017;7:4001-12
34. Jorgensen SB, O'Neill HM, Sylow L, Honeyman J, Hewitt KA, Palanivel R. et al. Deletion of skeletal muscle SOCS3 prevents insulin resistance in obesity. Diabetes. 2013;62:56-64
35. Ueki K, Kadowaki T, Kahn CR. Role of suppressors of cytokine signaling SOCS-1 and SOCS-3 in hepatic steatosis and the metabolic syndrome. Hepatol Res. 2005;33:185-92
36. Tan P, Peng M, Liu D, Guo H, Mai K, Nian R. et al. Suppressor of cytokine signaling 3 (SOCS3) is related to pro-inflammatory cytokine production and triglyceride deposition in turbot (Scophthalmus maximus). Fish Shellfish Immunol. 2017;70:381-90
37. Krutzfeldt J, Rajewsky N, Braich R, Rajeev KG, Tuschl T, Manoharan M. et al. Silencing of microRNAs in vivo with 'antagomirs'. Nature. 2005;438:685-9
38. Azzouzi H, Leptidis S, Dirkx E, Hoeks J, van Bree B, Brand K. et al. The hypoxia-inducible microRNA cluster miR-199a~214 targets myocardial PPARδ and impairs mitochondrial fatty acid oxidation. Cell Metab. 2013;18:341-54
39. Matsuzaka T, Shimano H, Yahagi N, Amemiya-Kudo M, Okazaki H, Tamura Y. et al. Insulin-independent induction of sterol regulatory element-binding protein-1c expression in the livers of streptozotocin-treated mice. Diabetes. 2004;53:560-9
40. Narasimhan A, Chinnaiyan M, Karundevi B. Ferulic acid regulates hepatic GLUT2 gene expression in high fat and fructose-induced type-2 diabetic adult male rat. Eur J Pharmacol. 2015;761:391-7
41. Chen H, Lan HY, Roukos DH, Cho WC. Application of microRNAs in diabetes mellitus. J Endocrinol. 2014;222:1
42. Ji HL, Song CC, Li YF, He JJ, Li YL, Zheng XL. et al. miR-125a inhibits porcine preadipocytes differentiation by targeting ERRá. Mol Cell Biochem. 2014;395:155-65
43. Herrera BM, Lockstone HE, Taylor JM, Wills QF, Kaisaki PJ, Barrett A. et al. MicroRNA-125a is over-expressed in insulin target tissues in a spontaneous rat model of Type 2 Diabetes. BMC Med Genomics. 2009;2:54
44. Skovsø S. Modeling type 2 diabetes in rats using high fat diet and streptozotocin. J Diabetes Investig. 2014;5:349-58
45. Tessitore A, Cicciarelli G, Del Vecchio F, Gaggiano A, Verzella D, Fischietti M. et al. MicroRNA expression analysis in high fat diet-induced NAFLD-NASH-HCC progression: study on C57BL/6J mice. BMC Cancer. 2016;16:3
46. Kim YD, Kim YH, Cho YM, Kim DK, Ahn SW, Lee JM. et al. Metformin ameliorates IL-6-induced hepatic insulin resistance via induction of orphan nuclear receptor small heterodimer partner (SHP) in mouse models. Diabetologia. 2012;55:1482-94
47. Reda E, Hassaneen S, El-Abhar HS. Novel trajectories of bromocriptine antidiabetic action: Leptin-IL-6/JAK2/p-STAT3/SOCS3, p-IR/p-AKT/GLUT4, PPAR-γ/adiponectin, Nrf2/PARP-1, and GLP-1. Front Pharmacol. 2018;9:771
48. Ernst MB, Wunderlich CM, Hess S, Paehler M, Mesaros A, Koralov SB. et al. Enhanced Stat3 activation in POMC neurons provokes negative feedback inhibition of leptin and insulin signaling in obesity. J Neurosci. 2009;29:11582-93
49. Serrano-Marco L, Rodríguez-Calvo R, El Kochairi I, Palomer X, Michalik L, Wahli W. et al. Activation of peroxisome proliferator-activated receptor-β/-δ (PPAR-β/-δ) ameliorates insulin signaling and reduces SOCS3 levels by inhibiting STAT3 in interleukin-6-stimulated adipocytes. Diabetes. 2011;60:1990-9
50. Wunderlich CM, Hövelmeyer N, Wunderlich FT. Mechanisms of chronic JAK-STAT3-SOCS3 signaling in obesity. JAKSTAT. 2013;2:e23878
51. Ueki K, Kondo T, Kahn CR. Suppressor of cytokine signaling 1 (SOCS-1) and SOCS-3 cause insulin resistance through inhibition of tyrosine phosphorylation of insulin receptor substrate proteins by discrete mechanisms. Mol Cell Biol. 2004;24:5434-46
52. Ueki K, Kondo T, Tseng YH, Kahn CR. Central role of suppressors of cytokine signaling proteins in hepatic steatosis, insulin resistance, and the metabolic syndrome in the mouse. Proc Natl Acad Sci USA. 2004;101:10422-7
53. Torisu T, Sato N, Yoshiga D, Kobayashi T, Yoshioka T, Mori H. et al. The dual function of hepatic SOCS3 in insulin resistance in vivo. Genes Cells. 2007;12:143-54
54. Sachithanandan N, Fam BC, Fynch S, Dzamko N, Watt MJ, Wormald S. et al. Liver-specific suppressor of cytokine signaling-3 deletion in mice enhances hepatic insulin sensitivity and lipogenesis resulting in fatty liver and obesity. Hepatology. 2010;52:1632-42
55. Inoue H, Ogawa W, Asakawa A, Okamoto Y, Nishizawa A, Matsumoto M. et al. Role of hepatic STAT3 in brain-insulin action on hepatic glucose production. Cell Metab. 2006;3:267-75
56. Ortega FJ, Mercader JM, Moreno-Navarrete JM, Rovira O, Guerra E, Esteve E. et al. Profiling of circulating microRNAs reveals common microRNAs linked to type 2 diabetes that change with insulin sensitization. Diabetes Care. 2014;37:1375-83
57. Zhu H, Leung SW. Identification of microRNA biomarkers in type 2 diabetes: a meta-analysis of controlled profiling studies. Diabetologia. 2015;58:900-11
58. Zheng J, Zhou Z, Xu Z, Li G, Dong P, Chen Z. et al. Serum microRNA-125a-5p, a useful biomarker in liver diseases correlates with disease progression. Mol Med Rep. 2015;12:1584-90
59. Boon RA, Vickers KC. Intercellular transport of microRNAs. Arterioscler Thromb Vasc Biol. 2013;33:186-92
60. Kato M, Castro NE, Natarajan R. MicroRNAs: potential mediators and biomarkers of diabetic complications. Free Radic Biol Med. 2013;64:85-94
61. Prattichizzo F, Giuliani A, De Nigris V, Pujadas G, Ceka A, La Sala L. et al. Extracellular microRNAs and endothelial hyperglycaemic memory: a therapeutic opportunity? Diabetes Obes Metab. 2016;18:855-67
62. Shaham L, Binder V, Gefen N, Borkhardt A, Izraeli S. MiR-125 in normal and malignant hematopoiesis. Leukemia. 2012;26:2011-8
63. Li G, Li J, Li C, Dong P, Zheng J, Yu F. MicroRNA-125a-5p contributes to hepatic stellate cell activation through targeting FIH1. Cell Physiol Biochem. 2016;38:1544-52
64. Pan W, Zhu S, Dai D, Liu Z, Li D, Li B. et al. MiR-125a targets effector programs to stabilize Treg-mediated immune homeostasis. Nat Commun. 2015;6:7096
65. Sun YM, Lin KY, Chen YQ. Diverse functions of miR-125 family in different cell contexts. J Hematol Oncol. 2013;6:6
66. Yang YM, Seo SY, Kim TH, Kim SG. Decrease of microRNA-122 causes hepatic insulin resistance by inducing protein tyrosine phosphatase 1B, which is reversed by licorice flavonoid. Hepatology. 2012;56:2209-20
67. Zhao L, Tao X, Qi Y, Xu L, Yin L, Peng J. Protective effect of dioscin against doxorubicin-induced cardiotoxicity via adjusting microRNA-140-5p-mediated myocardial oxidative stress. Redox Biol. 2018;16:189-98
Author contact
![]() Corresponding author: Dr. Jinyong Peng, College of Pharmacy, Dalian Medical University, Dalian, China. Tel.: +86 411 8611 0411 Fax: +86 411 8611 0411 Email: jinyongpeng2005com
Corresponding author: Dr. Jinyong Peng, College of Pharmacy, Dalian Medical University, Dalian, China. Tel.: +86 411 8611 0411 Fax: +86 411 8611 0411 Email: jinyongpeng2005com