Impact Factor
- Issue 14; 2026
- Issue 13; 2026
- Issue 12; 2026
- Issue 11; 2026
- Issue 10; 2026
- Volume 16; 2026
- Advance Articles
- Past Issues
- Cover Images
- Cover Suggestion
- Index & Coverage
- Special Issues
Introduction
Methods
Results
Discussion
Conclusion
Abbreviations
Supplementary Material
Acknowledgements
References
International Journal of Biological Sciences
International Journal of Medical Sciences
 Global reach, higher impact

Theranostics 2018; 8(19):5400-5418. doi:10.7150/thno.25572 This issue Cite
Research Paper
Identification of new molecular targets for PET imaging of the microglial anti-inflammatory activation state
Alessandro Villa1 ![]() #, Barbara Klein2,3#, Bieneke Janssen4#, Jordi Pedragosa5, Giovanna Pepe1, Bastian Zinnhardt6, Danielle J. Vugts4, Paolo Gelosa7, Luigi Sironi1,7, Wissam Beaino4, Annelaure Damont8, Frédéric Dollé8, Benoit Jego8, Alexandra Winkeler8, Dieter Ory9, Olof Solin10, Johnny Vercouillie11, Uta Funke4,12, Sandra Laner-Plamberger3,13, Linda V. Blomster14, Palle Christophersen14, Elisabetta Vegeto1, Ludwig Aigner2,3, Andreas Jacobs6, Anna M. Planas5, Adriana Maggi1*, Albert D. Windhorst4*
#, Barbara Klein2,3#, Bieneke Janssen4#, Jordi Pedragosa5, Giovanna Pepe1, Bastian Zinnhardt6, Danielle J. Vugts4, Paolo Gelosa7, Luigi Sironi1,7, Wissam Beaino4, Annelaure Damont8, Frédéric Dollé8, Benoit Jego8, Alexandra Winkeler8, Dieter Ory9, Olof Solin10, Johnny Vercouillie11, Uta Funke4,12, Sandra Laner-Plamberger3,13, Linda V. Blomster14, Palle Christophersen14, Elisabetta Vegeto1, Ludwig Aigner2,3, Andreas Jacobs6, Anna M. Planas5, Adriana Maggi1*, Albert D. Windhorst4*
1. Center of Excellence on Neurodegenerative Diseases and Department of Pharmacological and Biomolecular Sciences, University of Milan, Milan, Italy.
2. Institute of Molecular Regenerative Medicine, Paracelsus Medical University, Salzburg, Austria.
3. Spinal Cord Injury and Tissue Regeneration Center (SCI-TReCS), Paracelsus Medical University, Salzburg, Austria.
4. Department of Radiology & Nuclear Medicine, Amsterdam Neuroscience, VU University Medical Center, Amsterdam, the Netherlands.
5. Institut d'Investigacions Biomèdiques Agustí Pi i Sunyer, Barcelona, Spain.
6. European Institute for Molecular Imaging (EIMI), University of Münster, Münster, Germany.
7. Centro Cardiologico Monzino IRCCS, Milan, Italy.
8. IMIV, Service Hospitalier Frédéric Joliot, CEA, Inserm, Université Paris Sud, CNRS, Université Paris-Saclay, Orsay, France.
9. Laboratory for Radiopharmacy, Department of Pharmaceutical and Pharmacological Sciences, KU Leuven, Leuven, Belgium.
10. Radiopharmaceutical Chemistry Laboratory, Turku PET Centre, University of Turku, Turku, Finland.
11. UMRS Inserm U930 - Université de Tours, Tours France
12. BV Cyclotron VU, Amsterdam, the Netherlands.
13. University Clinic for Blood Group Serology and Transfusion Medicine, Paracelsus Medical University, Salzburg, Austria.
14. Saniona A/S, Ballerup, Denmark
# Share the first authorship
*Share the last authorship
Received 2018-2-17; Accepted 2018-8-27; Published 2018-10-27
Abstract

Microglia are potential targets for therapeutic intervention in neurological and neurodegenerative diseases affecting the central nervous system. In order to assess the efficacy of therapies aimed to reduce the tissue damaging activities of microglia and/or to promote the protective potential of these cells, suitable pre-clinical and clinical tools for the in vivo analysis of microglia activities and dynamics are required. The aim of this work was to identify new translational markers of the anti-inflammatory / protective state of microglia for the development of novel PET tracers.
Methods: New translational markers of the anti-inflammatory/protective activation state of microglia were selected by bioinformatic approaches and were in vitro and ex vivo validated by qPCR and immunohistochemistry in rodent and human samples. Once a viable marker was identified, a novel PET tracer was developed. This tracer was subsequently confirmed by autoradiography experiments in murine and human brain tissues.
Results: Here we provide evidence that P2RY12 expression increases in murine and human microglia following exposure to anti-inflammatory stimuli, and that its expression is modulated in the reparative phase of experimental and clinical stroke. We then synthesized a novel carbon-11 labeled tracer targeting P2RY12, showing increased binding in brain sections of mice treated with IL4, and low binding to brain sections of a murine stroke model and of a stroke patient.
Conclusion: This study provides new translational targets for PET tracers for the anti-inflammatory/protective activation state of microglia and shows the potential of a rationale-based approach. It therefore paves the way for the development of novel non-invasive methodologies aimed to monitor the success of therapeutic approaches in various neurological diseases.
Keywords: neuroinflammation, microglia, translational markers, radiochemistry, PET tracers.
Introduction
Microglia are the resident macrophages of the central nervous system (CNS). They play a major role in maintaining CNS homeostasis by constantly monitoring the brain parenchyma to remove cell debris, remodeling extracellular matrix, and reshaping synapses and neuronal connectivity [1]. Microglia are the first responders in case of brain injury or infection in which, in the majority of cases, they act by eliminating the noxious stimuli via phagocytosis in order to prevent damage to the neural tissue. Moreover, microglia responses involve the secretion of pro- and/or anti-inflammatory cytokines. Thus, the activation of microglia upon insult is associated with significant morphological and immunological changes. Microglial “activation states” are grouped into three main categories: the resting/surveilling state, the pro-inflammatory, and the anti-inflammatory activation states [2]. The pro-inflammatory activation state is characterized by the production of e.g. interleukin (IL) 1β, tumor necrosis factor (TNF) and IL6. It is well-described in acute infections, in acute CNS lesions such as stroke and in chronic neurodegenerative diseases such as Parkinson's (PD), Alzheimer's (AD), and amyotrophic lateral sclerosis (ALS) [3-5]. Less is known on the anti-inflammatory activation state, which is associated with attenuated responses to pro-inflammatory stimuli, metabolic alterations, promotion of tissue repair, extracellular matrix (ECM) reconstruction and with neuroprotection [6]. These anti-inflammatory features, however, appear to be of utmost importance, particularly in neuroinflammation-driven pathologies, in which microglia potentially have a significant protective function [7-11]. As a result, several groups have suggested microglia as a potential target for therapeutic intervention in neurological and neurodegenerative diseases with immunomodulatory drugs facilitating microglia transition from a pro-inflammatory to an anti-inflammatory activation state [12, 13]. A major obstacle in the development of such drugs is the lack of efficient tools to measure the dynamic changes of microglia activity, especially in human CNS pathologies or animal models of disease. Such tools are crucial to understand the exact role of neuroinflammation in acute CNS diseases and, more importantly, in the onset and development of chronic CNS disorders [10, 11].
An excellent imaging technique to study dynamic functional changes in vivo is positron emission tomography (PET). Currently PET imaging of neuroinflammation is hampered by technical (e.g. the sensitivity and specificity of the available radioligands), and conceptual factors (lack of specific markers for microglia activation states). Nonetheless, PET imaging of activated microglia, targeting the 18 kDa translocator protein (TSPO) [14] has provided improved understanding of microglial changes in the course of pathologies [15], such as neurodegenerative diseases [16-19], and mild cognitive impairment in specific subsets of patients [19, 20]. Development of novel tracers for monitoring of specific microglia activation states would be a major advance in the field.
Recent studies in mouse models of neuroinflammation [13, 21, 22] have focused on the molecular characteristics of anti-inflammatory microglia, thus providing novel targets potentially applicable to non-invasive preclinical imaging [23]. Unfortunately, so far most of the markers identified in murine models lack human homologs (e.g., Ym1 and Fizz1) [24] or are regulated in a species-specific manner (e.g., Arg1) [24]. Among the few biomarkers of anti-inflammatory activation that are shared by humans and rodents (e.g., CD163, Mrc1 and Tgm2), only transglutaminase 2 (TG2) seemed to be a good candidate for PET imaging of neuroinflammation, and was therefore investigated in detail for the development of novel PET tracers [25, 26]. However, TG2 does not appear to be suitable for imaging of neuroinflammation because of its wide-spread expression in many tissues [27].
The aim of the current study was to identify and validate specific molecular markers of anti-inflammatory activated microglia for the development of novel PET tracers. These novel imaging tools will ultimately be used to investigate the role of neuroinflammation in neurological diseases for diagnostic and prognostic purposes and for the development of novel immunomodulatory treatments.
Methods
Reagents for biology
Human, mouse and rat recombinant IL4 (rIL4) were obtained from PeproTech. Lipopolysaccharide (LPS) (isotype 0.111:B4) was obtained from Sigma-Aldrich. Unless otherwise specified, chemicals were purchased from Merck.
Reagents and methods for chemistry
Chemicals were obtained from commercial sources and used without further purification. Solvents were purchased from Sigma-Aldrich and Biosolve and used as received unless stated otherwise. Acetonitrile (MeCN) was dried over 3Å molecular sieves. Tetrahydrofuran (THF) was first distilled from LiAlH4 and then stored on 3Å molecular sieves. Reactions were performed at room temperature unless stated otherwise. Reaction progress was monitored by thin layer chromatography (TLC) on pre-coated silica 60 F254 aluminum plates (Merck). Spots were visualized by UV light or staining with ninhydrine or KMnO4. Evaporation of solvents was performed under reduced pressure at 40 °C using a rotary evaporator. Flash column chromatography was performed manually on Silica gel 60 Å (Merck) or on a Büchi Sepacore system (comprising a C-620 control unit, a C-660 fraction collector, two C-601 gradient pumps and a C-640 UV detector) equipped with Büchi Sepacore prepacked flash columns. Nuclear magnetic resonance (NMR) spectroscopy was performed on a Bruker Avance 250 (250.13 MHz for 1H and 62.90 MHz for 13C) or a Bruker Avance 500 (500.23 MHz for 1H and 125.78 MHz for 13C) with chemical shifts (δ) reported in parts per million (ppm) relative to the solvent (CDCl3, 1H 7.26 ppm, 13C 77.16 ppm; dimethyl sulfoxide (DMSO)-d6, 1H 2.50 ppm, 13C 39.52 ppm). Electrospray ionization high resolution mass spectrometry (ESI-HRMS) was carried out using a Bruker microTOF-Q instrument in positive ion mode (capillary potential of 4500 V). Analytical isocratic high-performance liquid chromatography (HPLC) was performed on a Jasco PU-1580 or PU2080i Plus station equipped with a Platinum C18 5 µm (250 × 4.6 mm) column (Grace) using MeCN/H2O/trifluoroacetic acid (TFA) (45:55:0.1, v/v/v) as eluent at a flow rate of 1 mL/min (method A), a Jasco UV-2075 Plus UV detector (254 nm) and a NaI radioactivity detector (Raytest). Chromatograms were acquired with Raytest GINA Star software (version 5.8). Semi-preparative isocratic HPLC was performed on a Jasco PU-1587 station equipped with an Alltima C18 5 µm (250 × 10 mm) column (Grace) using MeCN/H2O/TFA (55:45:0.1, v/v/v) as eluent at a flow rate of 4 mL/min (method B), a Jasco UV-2075 UV detector (254 nm), a custom-made radioactivity detector and Jasco ChromNAV CFR software (version 1.14.01). Analytical HPLC for metabolite analysis was performed with Dionex UltiMate 3000 HPLC equipment with Chromeleon software (version 6.8) on a Gemini C18 5-µm (10 × 250 mm) column (Phenomenex) with gradient and a mixture of MeCN (A) and 0.1% TFA in water (B) as eluent according to the following scheme (method C): 0 min, 90% B at 0.25 mL/min; 0.5 min, 90% B at 4 mL/min; 9.0 min, 30% B at 4 mL/min; 13.0 min, 30% B at 4 mL/min; 14.0 min. 90% B at 4.0 mL/min; and 15 min, 90% B at 0.25 mL/min.
Primary human macrophage cultures
Given the lack of gold standard protocols for anti-inflammatory activation on human cells in vitro, we polarized human macrophages using different protocols and characterized resulting activation states in terms of target-gene expression. i) Human monocytes were isolated from 3 different healthy donors by 2-step gradient centrifugation, and macrophages were obtained by spontaneously differentiating monocytes in RPMI 1640 with 10% FCS for 7 days. Macrophages were stained positively for intracellular CD68, whereas cell surface CD68 was detected in only 10% of cells, indicating a low basal activation state (not shown). Resting macrophages were incubated with LPS/IFN-γ (1 µg/mL), or rIL4 (20 ng/mL) and IL13 (5 ng/mL) for 48 h, and then processed for RNA preparation. ii) Human monocytes were isolated from buffy coats from 3 different healthy donors using gradient centrifugation followed by plastic adhesion. For differentiation into macrophages, the cells were cultivated for 6 days in RPMI1640 containing 10% fetal bovine serum (FBS) and supplemented for a pro-inflammatory activation with granulocyte macrophage colony-stimulating factor (GM-CSF) (100 ng/mL) (Gibco) or for an anti-inflammatory activation with macrophage colony-stimulating factor (M-CSF) (100 ng/mL) (Gibco). The actual polarization into a pro- or anti-inflammatory activation type was done for 48 h in RPMI (2.5% FBS) with GM-CSF + 10 ng/µL LPS (Sigma-Aldrich) or with M-CSF + 20 ng/µL rIL4 (Gibco). Cells were then processed for RNA preparation.
Primary human microglia cultures
The temporal neocortex was obtained from four epilepsy patients undergoing anterior temporal lobectomies. During the operation, part of the temporal neocortex was removed before performing an amygdalohippocampectomy. In all subjects, the amygdala and hippocampus were determined to be the epileptogenic zone during the epilepsy surgery evaluation. Histopathological preparations of neocortex were normal in all subjects. Written informed consent was obtained from all patients before the surgery. All studies were in accordance with the protocol approved by the Rigshospitalet's Ethical Committee in the Capital Region of Denmark (H‐2‐2011‐104). Following surgical resection, tissue was transported to the research facility. Approximately 1-2 g of tissue was washed in Hank's Balanced Salt Solution (HBSS), and meninges and visible blood vessels were removed. Tissue was diced into pieces of approximately 1 mm3 using a sterile scalpel and transferred to a 50 mL falcon tube containing 10 mL enzyme dissociation mix (10 U/mL DNase (Invitrogen) and 2.5 U/mL papain (Worthington) in Hibernate-A medium (Gibco) per gram of tissue for 10 min at 37 °C with gentle rotation. The tissue was removed from the incubator, gently triturated to aid digestion and returned to the incubator for 10 min. Dissociation was slowed by adding an equal volume of Dulbecco's Modified Eagle Medium (DMEM): Nutrient mixture F-12 (DMEM/F12; Gibco) with 1% B27 (Gibco) and the cell suspension was passed through a 70 μm cell strainer (Bector Dickinson). Cells were centrifuged at 160 ×g for 10 min, the supernatant discarded and resuspended in 20 mL neural precursor cell (NPC) proliferation media (DMEM/F12 with 1% B27, 1% GlutaMAX (Gibco,), 1% penicillin-streptomycin-glutamine (PSG; Gibco), 40 ng/mL fibroblast growth factor-2 (FGF-2; Peprotech), 40 ng/mL epidermal growth factor (EGF; Peprotech) and 2 μg/mL heparin (Sigma). The cell suspension was transferred to 24-well plates (Nunc) and incubated overnight at 37 °C with 95% air/5% CO2. The following day, the plates were tapped firmly to remove non-adherent or loosely-adherent cells. The adherent primary human microglia were cultured in high glucose DMEM containing 2 mM glutamine, 1 mM pyruvate and 10% FBS. Stimulation with 1 µg/mL LPS or 20 ng/mL IL4 and 5 ng/mL IL13 was started on day 6 post-isolation. The old medium in all wells was completely removed and fresh medium was added containing the desired amount of each stimulant. The cells used as controls received the regular medium without any stimuli. The cells were harvested 48 h later in 350 µL RLT buffer (Qiagen) for RNA preparation.
Microglia sorting from murine tissue
After 16 h of rIL4 or vehicle treatment, brains were dissected and washed in HBSS (Life Technologies); after removing the meninges, cortices from five mice were pooled as a single experimental group. Enzymatic cell dissociation was performed using Neural Tissue Dissociation Kit P (Miltenyi Biotec), following a modified version of the protocol supplied by the manufacturer. Briefly, after enzymatic digestion with papain, samples were dissociated mechanically, homogenized, and filtered through a 40-μm cell strainer. After extensive washes in HBSS, myelin was removed by centrifuging the dissociated brain cells, which had previously been suspended in 10 mL of cold 0.9 M sucrose solution, at 850 ×g and 4 °C for 10 min without braking. Floating myelin and the supernatant were discarded, and cells were processed for microglia magnetic sorting by incubating with CD11b MicroBeads (diluted 1:10 in PBS + 0.05% bovine serum albumin (BSA); Miltenyi Biotec) for 15 min at 4 °C. After washings, cells were suspended in 500 μL of PBS + 0.05% BSA and applied to a magnetic column to purify CD11b+ cells, namely microglia. Immediately after isolation of microglia, cells were processed for RNA preparation. Incubations with FITC-antiCD11b antibody (Miltenyi Biotec) and flow cytometric analyses were performed separately on dissociated brain cells as well as on CD11b-immunosorted cells to calculate recovery and purity. The protocol allowed us to obtain 80 to 85% recovery of CD11b-positive microglial cells, that is, 10-12% of the total brain cell population after tissue dissociation and myelin removal, with 90 to 95% purity after magnetic immunosorting.
RNA and cDNA preparation
Cortex, hippocampus and hypothalamus were dissected from the mouse brain and processed for RNA purification. The brain areas were homogenized using steel beads and a TissueLyser (Qiagen) at 28 Hz for three cycles of 20 s, followed by 30 s on ice and in RLT buffer. Then total RNA was purified using an RNeasy Mini Kit (Qiagen) according to the manufacturer's instructions including a step with deoxyribonuclease incubation. Thereafter, 1 μg RNA was used for cDNA preparation using 8 U/μL of Moloney murine leukemia virus reverse transcriptase (Promega) in a final volume of 25 μL; the reaction was performed at 37 °C for 1 h, and the enzyme inactivated at 75 °C for 5 min. Isolated murine microglia, human macrophages and human microglial cells were homogenized in RLT buffer and total RNA was purified using an RNeasy Mini Kit (Qiagen) according to the manufacturer's instructions including a step with deoxyribonuclease incubation. Thereafter, 500 ng RNA was used for cDNA preparation using 8 U/μL of Moloney murine leukemia virus reverse transcriptase (Promega) in a final volume of 25 μL; the reaction was performed at 37 °C for 1 h, and the enzyme inactivated at 75 °C for 5 min. Control reactions without the addition of the reverse transcription enzyme were performed (data not shown).
Real-time PCR
A 1:16 cDNA dilution was amplified using SYBR technology. The PCR was carried out in triplicate on a 96-well plate using GoTaq®qPCR Master Mix technology (Promega) according to the manufacturer's protocol using 7900HT fast real time PCR system (Applied Biosystems, Life Technologies) with the following thermal profile: 2 min at 95 °C; 40 cycles, 15 s at 95 °C, 15 s at 60 °C. Gene expression of target genes was assessed for murine chitinase-like 3 (Chi3l3, or Ym1; forward primer, 5′-GAAGGAGCCACTGAGGTCTG-3′; reverse primer, 5′-GAGCCACTGAGCCTTCAAC-3′), murine P2ry12 (forward primer, 5′-AACTCGCAGGTTCTGGCTGG-3′; reverse primer, 5′-AAGCCCCGAGTCCTAGGTT-3′), human P2RY12 (forward primer, 5′-TTCAGCTATTGGACGCGAGG-3′; reverse primer, 5′-GAATCTGACACCCAGCGGAA-3′), murine Ramp1 (forward primer, 5′-ACCAACTATTGCTTCAGCTTCAGCTCCAC-3′; reverse primer, 5′-GATCCACTTCCAACCCAGGTC-3'), human RAMP1 (forward primer, 5′-TGCCACCTTTTGACAGTGATG-3′; reverse primer, 5′-GCTGCGAGATTTGAAGCTGG-3′), murine Calcrl (forward primer, 5′-CCTATGTCTCAGCCTCTTCTC-3′; reverse primer 5′-CTCTTGCTTATCCCCTCTTCC-3′), human CALCRL (forward primer, 5′-GACCACGGAGGCAGGGACAC-3′; reverse primer 5′-CTTCCCGTTGGGTGCTCGGC-3′) and for the reference gene 36B4 (forward primer, 5′-GGCGACCTGGAAGTCCAACT-3′; reverse primer, 5′-CCATCAGCACCACGGCCTTC-3′). The reactions were carried out according to the manufacturer's protocol using a 7900HT fast real time PCR system (Applied Biosystems), and the results were analyzed using the 2-ΔΔCt method. For the samples of GM/M-CSF-treated human macrophages, TaqMan RT-PCR was used for quantitative gene expression analyses. RNA was isolated with an RNeasy Mini Plus Kit (Qiagen) and transcribed to cDNA with a Reverse Transcription System (Promega). Amplification of technical duplicates (each containing 10 ng reverse transcribed RNA) was done using the GoTAQ Probe qPCR Master Mix (Promega) with a two-step cycling protocol (95 °C for 15 s, 60 °C for 60 s; 40 cycles) in a Bio-Rad CFX 96 Cycler. The following gene expression assays (all from Integrated DNA Technologies) were used: P2RY12 (Hs.PT.58.39733142), RAMP1 (Hs.PT.58.3071042), and CALCRL (Hs.PT.58.24834078); and the housekeeping genes UBC (Hs.PT.39a.22214853) and POLR2A (Hs.PT.39a.19639531) for data normalization. Normalized relative quantities of RNA were calculated with qBase Plus (Biogazelle) using geNorm algorithms for multi-reference gene normalization.
Animals
C57BL/6 male mice with an age of 4 months were supplied by Charles River Laboratories. Healthy male Wistar and Sprague-Dawley rats were obtained from Harlan and Janvier Labs, respectively. All animals were allowed free access to food and water and were kept in temperature-controlled facilities on a 12-h light and dark cycle at constant temperature (23 °C) and relative humidity (40%). Mice were group-housed in the animal care facility of the Department of Pharmacological and Biomolecular Sciences at the University of Milan and the European Institute for Molecular Imaging of the University Hospital Münster. Rats were group-housed in the animal care facility of the Department of the Radionuclide Center of the VU University Medical Center Amsterdam. Animal studies were approved by the animal ethics committees of local authorities and were conducted in accordance with the Directives of the European Union on animal ethics and welfare.
Intracerebroventricular injections
Intracerebroventricular (icv) injections in C57BL/6 male mice with an age of 4 months were made as previously described [28]. Briefly, mice were deeply anesthetized with a subcutaneous injection of a mixture of ketamine and xylazine (78 and 6 mg/kg, respectively) placed on a warming pad and positioned on a stereotactic frame for surgery. Injections in the third cerebral ventricle (icv) were performed according to specific stereotaxic coordinates (bregma, -0.25 mm; lateral, 1 mm; depth, 2.25 mm), as previously described [28]. During this procedure rIL4 was injected solved in 3 μL of 0.9% NaCl using a 26S-gauge Hamilton syringe. Infusions were made at a rate of 0.1 μL/3 s. The needle was kept in place for 30 s after the injection and then removed slowly. Animals injected with the same volume of vehicle (0.9% NaCl) alone were used as controls. The skin incision was closed with a suture and animals were allowed to recover for 16 h before sacrifice by a lethal ketamine and xylazine solution (150 and 12 mg/kg, respectively). For RNA quantification (NaCl-injected, n = 3; IL4-injected, n = 3), the right cerebral cortex, hippocampus and hypothalamus, contralateral to the injection site, were collected, immediately frozen on dry ice, and stored at -80 °C until RNA preparation. For autoradiography (NaCl-injected, n = 4; IL4-injected, n = 4), whole brains were snap-frozen in liquid nitrogen and stored at -80 °C.
Middle cerebral artery occlusion in rats
Male Sprague-Dawley rats (n = 6) weighing 200-250 g underwent permanent middle cerebral artery occlusion (pMCAO), as previously described [29]. Briefly, rats were intraperitoneally anesthetized with ketamine (90 mg/kg) and xylazine (10 mg/kg) and the temporalis muscle was dissected; after craniectomy, the right middle cerebral artery (MCA) was exposed and coagulated by means of microbipolar coagulation (SAMED MB122) to occlude it permanently from its stem to the lenticulostriate branch. It was then divided to ensure successful occlusion. The retracted temporalis muscle was allowed to fall back into place and sutured. Rats were allowed to recover from anesthesia in warmed cages for 2 h to hold the body temperature at 37 °C. After 48 h, rats were anaesthetized and transcardially perfused first with phosphate-buffered saline (PBS) and then with 4% para-formaldehyde (PFA). Brains were collected, shortly post-fixed in 4% PFA, cryoprotected in 30% sucrose until precipitation at 4 °C and then frozen at -80 °C.
Middle cerebral artery occlusion in mice
Male C57BL/6 (n = 6) mice underwent transient middle cerebral artery occlusion (tMCAO), as previously described [30]. In brief, mice were anesthetized with 1.5% isoflurane (Abbott Animal Health) in a 2:1 air and oxygen mixture. A 7-0 monofilament (tip diameter 190 to 200 μm, coating length 2 to 3 mm, 70SPRePK5, Doccol), was inserted into the common carotid artery, positioned at the MCA for 30 min and carefully retracted afterwards. Successful occlusion and reperfusion was monitored intraoperatively using a Laser Doppler probe (Perimed Instruments). During the procedures, body temperature was maintained at physiological levels with a custom-built heating pad. 3, 7, 10 days (n = 2/time point) after stroke induction mice were sacrificed and brains harvested as described above.
Magnetic resonance imaging analysis
Brain infarct size was visualized by T2-weighted MR imaging at 48 h after MCAO using a 4.7 T, vertical super wide bore magnet of a Bruker Avance II spectrometer with micro imaging accessory. Rats were anesthetized with 1.5% isoflurane in 2 L/min of a mixture of N2/O2 (70%/30%), fixed on the holder and placed into the 6.4 cm diameter birdcage coil. A 3-orthogonal-plane, gradient echo scout acted as a geometric reference for locating the olfactory bulb. The T2W images were obtained with a RARE sequence with an equivalent TE of 80 ms, a TR of 3 s, a refocusing flip angle of 180°, and a FOV of 4.0 × 4.0 cm2; 16 contiguous coronal slices with a thickness of 1.0 mm, a matrix size of 128 × 128, and 12 signal averages were recorded for a total scan time of 4 min and 48 s. Lesions were identified as areas of high signal intensity [31].
Intrastriatal injections of rat IL4
Healthy male Wistar rats (350 ± 89 g, 7-9 weeks old) were anaesthetized with 2.5% isoflurane in 100% O2 and positioned in a stereotactic frame for injection of 1 μg rat rIL4 (1 µg/µL in PBS); n = 3) or vehicle (PBS only; n = 3). Injection was done into the right striatum (bregma: +1.0 mm, lateral: 3.0 mm, depth: 5.0 mm from the surface of the brain) using a 1 µL Hamilton microsyringe and a micropump (Micro4 Controller; WPI). The infusion rate was set to 500 nL/min and the syringe was left in place after injection for 10 min before it was retracted slowly. The site of incision was then cleaned and sutured using 4.0 braided silk before being disinfected. Animals were maintained normothermic during the surgery using a heating blanket (Homeothermic Blanket Control Unit; Harvard Apparatus). Animals were euthanized one day after intrastriatal rIL4 injection. Brains were rapidly excised and frozen in isopentane pre-cooled in liquid nitrogen (-50 °C) and then stored at -80 °C until use.
Human brain tissue
The brain of a patient who died 18 days after stroke onset at the Stroke Unit of the Hospital Clinic of Barcelona was used after obtaining written consent from the relatives or legal representatives for tissue removal after death at the Neurological Tissue Bank of the Biobank-Hospital Clinic-Institut d'Investigacions Biomèdiques August Pi i Sunyer (IDIBAPS). The Ethics Committee of this Hospital approved the study.
Immunohistochemistry
Immunohistochemistry staining on rat brain sections was performed at day 1 after rIL4 administration. Animals were euthanized and their brains rapidly excised and frozen in isopentane pre-cooled in liquid nitrogen (-50 °C) and then stored at -80 °C until use. 10 µm-thick frozen transversal brain sections were cut at -20 °C using a cryostat (Leica). Rat brain sections were fixed in 4% PFA for 15 min. PFA blockage was performed with NH4Cl (50 mmol/L) in PBS for 5 min and tissue permeabilization was performed with methanol-acetone 1:1 (-20 °C) and 0.1% Triton in PBS for 5 min at room temperature. Sections were washed with PBS after every step. The sections were saturated with a solution of 5% BSA/0.5% Tween in PBS for 15 min at room temperature to block nonspecific binding. Sections were incubated for 1 h at room temperature with primary antibodies in 5% BSA/0.5% Tween in PBS. Sections were stained for P2RY12 with rabbit anti-P2RY12 (1:100; AnaSpec, #55043A), for CD11b with mouse anti-CD11b (1:100; Serotec, #MCA275R), for Iba1 with goat anti-Iba1 (1:100, Abcam, #5076) and for mannose receptor with rabbit anti-CD206 (1:100, Abcam, #64693). The sections were then washed (3 × 5 min) in PBS and incubated for 30 min at room temperature with secondary antibodies Alexa Fluor 488 nm donkey anti-rabbit IgG, Alexa Fluor 546 nm donkey anti mouse, and Alexa Fluor 546 nm donkey anti-goat IgG (1:1000; Invitrogen, #A-21206, #A-10036 and #A-11056, respectively) in 5%BSA/0.5% Tween 0.5% in PBS, and then washed again (3 × 5 min) in PBS. Specificity of the CD206 and P2RY12 antibodies was tested using controls omitting the first antibodies. Sections were mounted with a 4,6-diamidino-2-phenylindole (DAPI) Prolong Antifade Kit (Molecular Probes, Life Technologies,).
Chemistry
Ethyl 6-(3-((tert-butoxycarbonyl)amino)azetidin-1-yl)-5-cyano-2-methylnicotinate (2)
Ethyl 6-chloro-5-cyano-2-methylnicotinate (1; 0.33 g, 1.49 mmol) and 3-(Boc-amino)-azetidine (0.31 g, 1.80 mmol) were dissolved in 1,2-dichloroethane (4 mL) and N,N-diisopropylethylamine (DiPEA; 0.6 mL, 3.4 mmol) was added. After stirring at 60 °C for 1 h, the reaction mixture was concentrated in vacuo and the residue was dissolved in ethyl acetate (EtOAc; 10 mL) and washed twice with saturated aqueous NaHCO3 (8 mL). The organic layer was dried over Na2SO4 and concentrated in vacuo. Flash column chromatography (EtOAc/n-hexane 1:6) was performed to obtain ethyl 6-(3-((tert-butoxycarbonyl)amino)azetidin-1-yl)-5-cyano-2-methylnicotinate (2) in 32% yield (0.17 g, 0.47 mmol).
Rf value: 0.14 (EtOAc/n-hexane 1:6), 0.64 (CH2Cl2/MeOH 95:5); 1H NMR (250.13 MHz, CDCl3) δ 8.27 (s, 1H, CHAr), 5.28-5.33 (m, 1H, CHazetidine), 4.68-4.75 (m, 2H, CH2 (azetidine)), 4.31 (q, 2H, J = 7.1 Hz, CH2 (ester)), 4.21-4.27 (m, 2H, CH2 (azetidine)), 2.71 (s, 3H, CH3 (pyridine)), 1.48 (s, 9H, 3x CH3), 1.39 (t, 3H, J = 7.1 Hz, CH3 (ester)); 13C NMR (125.80 MHz, CDCl3) δ 208.68, 165.38, 164.86, 161.23, 164.86, 146.20, 117.17, 104.83, 86.65, 60.89, 59.25, 41.40, 28.29, 25.72, 14.29; ESI-HRMS: calculated for C18H24N4O4: 360.18; found 383.1712 [M+Na]+.
Ethyl 6-(3-aminoazetidin-1-yl)-5-cyano-2-methylnicotinate (3)
Ethyl 6-(3-((tert-butoxycarbonyl)amino)azetidin-1-yl)-5-cyano-2-methylnicotinate (2; 1.3 g, 3.6 mmol) was dissolved in CH2Cl2 (24 mL). A 4 M solution of HCl in 1,4-dioxane (18 mL, 72 mmol) was added slowly and the reaction mixture was stirred for 30 min. The reaction mixture was then concentrated in vacuo to afford a white solid, which was dissolved in CH2Cl2 (10 mL) and washed with 1 M aqueous NaHCO3 (15 mL). The organic layer was separated and the water layer was extracted with CH2Cl2 (3 × 15 mL). Combined organic layers were dried over Na2SO4 and concentrated in vacuo. Flash column chromatography was performed (2-4% MeOH in CH2Cl2) to obtain ethyl 6-(3-aminoazetidin-1-yl)-5-cyano-2-methylnicotinate (3) in 87% yield (0.8 g, 3.1 mmol).
Rf value: 0.34 (CH2Cl2/MeOH 95:5); 1H NMR (500.23 MHz, CDCl3) δ 8.25 (s, 1H, CHAr), 4.66 (m, 2H, CH2 (azetidine)), 4.32 (q, 2H, J = 6.9 Hz, CH2 (ester)), 3.98-4.05 (m, 3H, CH2 + CHazetidine), 2.70 (s, 3H, CH3 (pyridine)), 1.38 (t, 3H, J = 7.2 Hz, CH3 (ester)); 13C NMR (125.80 MHz, CDCl3) δ 165.38, 164.94, 157.95, 146.29, 117.43, 113.72, 86.41, 61.82, 60.84, 43.48, 25.78, 14.34; ESI-HRMS: calculated for C13H16N4O2: 260.13; found 261.1410 [M+H]+.
Ethyl 6-(3-(3-((5-chlorothiophen-2-yl)sulfonyl)ureido)azetidin-1-yl)-5-cyano-2-methylnicotinate (5)
Chlorosulfonyl isocyanate (0.3 mL, 4.4 mmol) was added to a solution of 5-chlorothiophene-2-sulfonamide (0.5 g, 2.5 mmol) in anhydrous 1,2-dichlorobenzene (20 mL) under an argon atmosphere and the reaction mixture was stirred at 160 °C for 3 h. Thereafter, the reaction mixture was cooled to room temperature, decanted and concentrated in vacuo at 70 °C. The oily residue was dissolved in anhydrous acetonitrile (MeCN, 20 mL) and added as obtained to a solution of ethyl 6-(3-aminoazetidin-1-yl)-5-cyano-2-methylnicotinate (3; 0.55 g; 2.11 mmol) in anhydrous MeCN (20 mL) and subsequently stirred for 16 h. The precipitate was then collected by filtration and washed with MeCN, MeOH and n-hexane to obtain ethyl 6-(3-(3-((5-chlorothiophen-2-yl)sulfonyl)ureido)azetidin-1-yl)-5-cyano-2-methylnicotinate (5) in 45% as a light grey solid (0.49 g, 0.94 mmol).
Rf value: 0.23 (CH2Cl2/MeOH 95:5); 1H NMR (500.23 MHz, DMSO-d6) δ 11.44 (br s, 1H, NH), 8.29 (s, 1H, CHAr), 7.63 (d, 1H, J = 4.1 Hz, CHthiophene), 7.46 (br s, 1H, NH), 7.27 (d, 1H, J = 4.1 Hz, CHthiophene), 4.46-4.55 (m, 3H, CH + CH2 (azetidine)), 4.25 (q, 2H, J = 7.2 Hz, CH2 (ester)), 4.13-4.17 (m, 2H, CH2 (azetidine)), 2.61 (s, 3H, CH3 (pyridine)), 1.30 (t, 3H, J = 7.2 Hz, CH3 (ester)); 13C NMR (125.80 MHz, DMSO-d6) δ 164.48, 164.31, 157.86, 151.30, 146.02, 138.94, 136.20, 133.36, 127.67, 117.06, 113.52, 86.30, 60.74, 40.48, 25.51, 14.25; ESI-HRMS: calculated for C18H18ClN5O5S2: 483.04; found 484.0542 [M+H]+.
5-chlorothiophene-2-sulfonyl azide (6)
Sodium azide (6.4 g, 99 mmol) was dissolved in H2O/CH2Cl2 (2:3, 10 mL) and cooled to 0 °C. Trifluoromethanesulfonic anhydride (3.4 mL, 20 mmol) was slowly added. After 3 h, the organic layer was separated and the water layer was extracted twice with CH2Cl2 (4 mL). The combined organic layers were washed with saturated aqueous Na2CO3 (2 × 10 mL) and added to a solution of 5-chlorothiophene-2-sulfonamide (0.98 g, 4.9 mmol), potassium carbonate (1.37 g, 9.9 mmol) and copper(II)sulfate (0.07 g, 0.30 mmol) in H2O/MeOH (1:2, 9 mL). After stirring for 16 h, the reaction mixture was concentrated in vacuo. H2O (10 mL) was added and upon acidification of the solution with concentrated HCl to pH 1, the solution turned from light blue to colorless. The solution was extracted with EtOAc (4 × 10 mL). The combined organic layers were dried over Na2SO4 and concentrated in vacuo. Flash column chromatography was performed (0.1% MeOH in CH2Cl2) to obtain 5-chlorothiophene-2-sulfonyl azide (6) as a brown oil in 88% yield (0.98 g, 4.4 mmol).
Rf value: 0.93 (CH2Cl2/MeOH 99:1); 1H NMR (500.23 MHz, CDCl3) δ 7.63 (d, 1H, J = 4.1 Hz, CH), 7.06 (d, 1H, J = 4.1 Hz, CH); 13C NMR (125.80 MHz, CDCl3) δ 141.12, 135.70, 134.33, 127.46
Radiochemistry
Ethyl 6-(3-(3-((5-chlorothiophen-2-yl)sulfonyl)[11C]ureido)azetidin-1-yl)-5-cyano-2-methylnicotinate ([11C]5)
[11C]CO2 was produced by a 14N(p,α)11C nuclear reaction performed in a 0.5% O2/N2 gas mixture using an IBA Cyclone 18/9 cyclotron (IBA). [11C]CO2 was passed over a gas purifier column (400 × 4 mm, silica gel, 100/80 mesh) using helium flow (20 mL/min) and subsequently reduced to [11C]CO by passing over molybdenum (Sigma Aldrich, < 150 µm, 99.99%) at 850 °C. Unreacted [11C]CO2 was trapped on an ascarite column and [11C]CO was trapped on a silica trap (1 mg silica gel, 100/80 mesh) at -196 °C. To release [11C]CO, the trap was heated and [11C]CO was subsequently transferred to a capped reaction vial containing precursor 3 (5 mg, 19 µmol), precursor 6 (2.5 µL, 19 µmol), chloro(1,5-cyclooctadiene)rhodium(I) dimer (1 mg, 2 µmol) and triphenylphosphine (3 mg, 11 µmol) in 0.7 mL of dry THF, using xenon (2 mL/min) as carrier gas [32]. The reaction mixture was heated at 100 °C for 5 min, after which remaining azide precursor 6 was instantly reduced by addition of a solution of tris(2-carboxyethyl)phosphine (TCEP; 10 mg, 40 µmol) in water (0.1 mL). THF was evaporated by heating the reaction mixture to 120 °C for 2 min. The reaction mixture was then diluted with 2 mL of eluent (MeCN/H2O/TFA, 55:45:0.1, v/v/v) and purified by semi-preparative HPLC (method B). The fraction containing [11C]5 (tR = 16 min) was collected, diluted with 40 mL of water and trapped on a Sep-Pak Plus tC18 cartridge (Waters), preconditioned with 1 mL of ethanol and 10 mL of water. The cartridge was washed with 20 mL of water and subsequently [11C]5 was eluted with 1 mL of EtOH and diluted with 5 mL of 7.09 mM NaH2PO4 in saline. For in vivo studies, formulated [11C]5 was diluted further with saline to contain ≤ 10% of EtOH. [11C]5 was obtained in a decay-corrected radiochemical yield (RCY) of 10 ± 2% (n = 6) from end of bombardment (EOB) with a radiochemical purity > 98%, a molar activity (Am) of 79 ± 32 GBq/µmol (n = 6) at end of synthesis and an overall synthesis time of 45-50 min. The identity of the product was confirmed with analytical HPLC by co-injection of the product and non-labeled 5 (method A, tR = 12 min).
Determination of LogDoct,7.4
The distribution of [11C]5 between 1-octanol and 0.2 M phosphate buffer (pH = 7.4) was measured at room temperature. Briefly, 1 mL of a 20 MBq/mL solution of [11C]5 in 0.2 M phosphate buffer (pH = 7.4) was mixed with 1 mL of 1-octanol for 1 min using a vortex mixer. After a settling period of 30 min, three samples of 100 μL were taken from both layers. To determine the recovery (> 97%), three samples of 100 μL were taken from the 20 MBq/mL solution. All samples were counted for radioactivity Wallac Universal Gammacounter 1282 (PerkinElmer). The LogDoct,7.4 value was calculated according to LogDoct,7.4 = 10Log(Aoct/Abuffer), where Aoct and Abuffer represent average radioactivity counts of the three 1-octanol and the three buffer samples. Results are presented as mean ± standard deviation (SD).
In vitro autoradiography
Snap-frozen icv-injected and MCAO mouse brains were cut on a Leica CM3050 S cryostat (Leica Biosystems) at -19 °C in sections of 20 µm, thaw-mounted on SuperFrostTM Plus (Thermo Fisher Scientific) object glasses, dried overnight on silica at 4 °C and then stored at -20 °C until use. Snap frozen human post-mortem brain tissue was cut on a cryostat at -15 °C in sections of 20 µm, thaw-mounted on SuperFrostTM Plus Gold (Thermo Fisher Scientific) object glasses and left in a storage box containing silica at room temperature for 1 h before drying overnight on silica at 4 °C, after which the sections were stored at -20 °C until use. Upon use, sections were thawed to room temperature for 1 h before washing the sections in 5 mM Tris-HCl buffer (pH 7.4) at room temperature (3 × 5 min). Sections were dried in a cold stream of air before incubation (30 min) with 5 mM Tris-HCl buffer (pH 7.4) containing either [11C]5 (10 nM) alone or [11C]5 (10 nM) and Ticagrelor (10 µM). After incubation, sections were washed (3 × 1.5 min) in ice-cold 5 mM Tris-HCl buffer (pH 7.4) followed by a dip in ice-cold demineralized water. Sections were dried in a stream of air and then exposed to a storage phosphor screen (BAS-IP SR 2040 E, GE Healthcare Europe) and the screen was read out on a Typhoon FLA 7000 phosphor imager (GE Healthcare Europe). After exposure, sections were stored at -80 °C for immunohistochemical staining (IHC). Obtained images were analyzed and quantified using ImageQuantTL Analysis Toolbox (version 8.1, GE Healthcare). A region of interest (ROI) was defined around the entire section, except for the MCAO mouse brains, where a ROI was defined around each hemisphere. Statistical analysis of quantified autoradiography (unpaired t test, two-tailed) was performed with GraphPad Prism (Version 5.02, GraphPad Software). For immunofluorescence staining on MCAO mouse brain sections and human post-mortem sections used for autoradiography, slides were dried and kept at -80 °C until staining. Slides were brought to room temperature and fixed with cold acetone for 10 min. Then sections were blocked with PBS/1% BSA for 1 h at room temperature and incubated with rabbit anti-P2RY12 (Anaspec) and mouse anti-MHCII (clone LN3, Thermofisher) in PBS/1% BSA overnight at 4 °C. Slides were washed 3 × 5 min with PBS/0.05% Tween-20 and incubated with goat anti-rabbit IgG-Alexa488, goat anti-mouse IgG-Alexa555 and DAPI in PBS/1% BSA for 1 h at room temperature. Sections were then washed 3 × 5 min with PBS/0.05% Tween-20 and coverslips were mounted with Mowiol mounting media. Fluorescence images were acquired using a Leica DM6000 microscope equipped with a motorized stage. Whole-slide low-zoom images were acquired using ×10 objective and merged by tile stitching to get the final image. For fluorescence quantification and comparison, sections were stained in a single run and images were collected in a single session with the same exposure time between different areas and different slides. Images were analyzed using Leica LAS AF. Multiple regions of interest were draw on the sections and fluorescence intensity was quantified. Areas with obvious non-specific binding (folding of the section) were excluded from quantification.
Ex vivo biodistribution
Healthy male Wistar rats (210-275 g, 6-8 weeks old, obtained from Harlan) were injected with 30 ± 13 MBq (at start of the experiment) of [11C]5 (corresponds with 0.24 ± 0.07 µg of non-labeled 5) in the tail vein under isoflurane anesthesia. Rats were sacrificed and dissected at 5 and 15 min post injection (n = 4 for 5 min, n = 3 for 15 min). Blood, heart, lungs, liver, kidneys, spleen and brain were collected, weighed and counted for radioactivity in a Wallac Universal Gammacounter 1282 (PerkinElmer). Biodistribution data were expressed as percentage injected dose per gram tissue (%ID/g).
Metabolite analysis
Healthy male Wistar rats (230-250 g, 6-8 weeks old, obtained from Harlan) were injected with 51 ± 2 MBq (at start of experiment) of [11C]5 in the tail vein under isoflurane anesthesia. Rats were sacrificed at 15 min (n =3) after tracer injection. Blood samples were obtained, and the brain was removed. Blood samples were collected in heparin tubes (BD Vacutainer NH 119 I.U., 7 mL, BD Vacutainer Systems) and centrifuged at 2,600 rcf for 5 min at 4 °C (Hettich Universal 32). The brain was put in a falcon tube containing saline (5 mL) and homogenized with a disperser (IKA T18 B Ultra-Turrax, IKA®-Werke) before centrifugation (5 min, 2,600 rcf, 20 ºC, Hettich Universal 32). Plasma and brain supernatant were separated from blood cells and brain precipitate, respectively. Plasma was loaded onto a tC18 Sep-Pak (Waters), followed by washing with 10 mL of water to obtain the polar fraction. The non-polar fraction was then eluted with 1.5 mL of MeOH and 1.5 mL of water. All separate fractions were counted for radioactivity in a Wizard Gammacounter 1470 or 2480 (Wallac/PerkinElmer) and the non-polar fraction of plasma and brain supernatant was further analyzed by HPLC using method C. Percentages are expressed as mean ± SD.
Statistical evaluation
All groups were randomly assigned, and data analysis was done in a blinded fashion. Unless otherwise stated, all values are expressed as mean ± standard error of the mean (SEM) of n observations. Unless otherwise stated, the results were analyzed by ANOVA followed by a Bonferroni post-hoc test for multiple comparisons using GraphPad Prism 6 software. A value of P < 0.05 was considered significant.
Results
Selection of genes encoding candidate targets
First, we identified genes of interest that are associated with the anti-inflammatory activation state of microglia. Candidate genes were selected based on the following three selection criteria: i) the level of expression of the candidate mRNA in the anti-inflammatory state had to be at least two-fold higher compared to the resting/surveilling state and to the pro-inflammatory activation state; ii) the genes had to be similarly regulated in rodents and humans; and iii) the genes had to be preferentially expressed in microglia. Genome-wide mRNA expression data published in the NCBI Gene Expression Omnibus database [33] (GSE5099 [34], GSE35449 [35], GSE57614 [36], GSE36537 [37], GSE32164 [38], and GSE64498) were used to generate co-expression networks using the weighted correlation network analysis (WGCNA) package for R [39], a software package widely applied to evaluate common denominators in meta-analyses or disease models [33] and a powerful tool to integrate immunology with bioinformatics [40].
We identified a set of genes expressed in human and murine samples and characterized by: 1) low expression in unstimulated conditions and following pro-inflammatory (LPS) stimuli, and 2) high expression induced by anti-inflammatory stimuli (IL4, IL13). The genes were sorted based on the Log2-fold change in the expression (Log2FC) following the anti-inflammatory stimuli vs. the other treatments, and the 100 genes characterized by the highest Log2FC were further screened to select those meeting the following features: 3) cell surface expression rather than intracellular expression; 4) higher expression in microglia vs. macrophages (or other neural cell types); 5) available literature on small molecule compounds binding the encoded proteins (to be used for the development of a PET tracer). Based on these criteria, 15 genes (Table 1) were selected, which were then further evaluated and ranked with a qualitative weight ranging from (+++) to (--) taking the chemical features of the proteins encoded by the 15 genes into consideration (availability of selective ligands with high affinity that are amenable to labeling with carbon-11 or fluorine-18) as well as their biological properties (membrane localization, expression levels in anti-inflammatory microglia vs. other brain cells, expression in murine and human microglia). Three priority groups (Tiers) were identified, and the genes in Tier 1 (P2ry12, Ramp1, and Calcrl) (Table 1) were validated in vitro and ex vivo in human and murine samples.
List of 15 selected targets/genes
| Tier | Rank | Gene | Membrane localization | Microglia-specific expression | Availability of selective ligands | Described function in microglia | Ref |
|---|---|---|---|---|---|---|---|
| 1 | 1 | P2RY12/P2ry12 | + | +++ | ++ | Involved in microglial chemotaxis. Expression is enhanced in human microglia under anti-inflammatory activation conditions. Expression on human microglia is modulated in neuroinflammatory diseases. | [62] [56] [53] |
| 2 | RAMP1/Ramp1 | + | + | ++ | Exerts a potent inhibitory effect on LPS-induced microglia activation in vitro. Ramp1 deficiency dampens microgliosis in an ALS mouse model. | [63] [64] | |
| 3 | CALCRL/Calcrl | + | + | ++ | Exerts a potent inhibitory effect on LPS-induced microglia activation in vitro. | [63] | |
| 2 | 4 | QPCT/Qpct | - | ++ | ++ | Qpct inhibition results in a reduced microglial activation around amyloid plaques in transgenic AD Tg2576 mice. | [65] |
| 5 | P2RY14/P2ry14 | + | - | + | UDP-activated receptor. | [66] | |
| 6 | HMOX1/Hmox1 | - | ++ | + | Dampens inflammatory reactions. | [67] | |
| 7 | CXCR4/Cxcr4 | + | + | + | Involved in microglia migration. | [68] | |
| 8 | HRH1/Hrh1 | + | - | +++ | H1R signaling in CD11b+ cells can modulate cytokine production by macrophages upon LPS stimulation. | [69] | |
| 9 | MMP12/Mmp12 | (+) ECM | + | + | MMP12 deficiency increases the inflammatory activity of adult brain-derived microglia. | [41] | |
| 10 | PTGER2/Ptger2 | + | -- | - | PGE2-activated Ptger2 regulates innate immunity in the CNS. | [70] | |
| 11 | PPP1R14A/Ppp1r14a | - | -- | - | Upregulated in human Th2-polarized T helper cells. | [71] | |
| 3 | 12 | TBXAS1/Tbxas1 | + | ++ | -- | ||
| 13 | GPD1L/Gpd1l | - | + | -- | |||
| 14 | ABAT/Abat | - | -- | -- | |||
| 15 | HS2ST1/Hs2st1 | + | - | -- |
Legend of symbols. Membrane localization: +, yes; -, no. Microglia-specific expression (vs. other CNS cells): +, > 2-fold expression; ++, > 5-fold expression; +++, > 10-fold expression; -, no differences; --, under-expressed. Availability of selective ligands: +, ligands already available; ++, different options already available; +++, many ligands available; -, no viable ligands available; --, no ligands available.
Candidate target validation in human samples
Human primary macrophage and microglia cultures were used to investigate the responsiveness of the selected markers to a 48 h exposure to anti-inflammatory (IL4, 20 ng/mL) and pro-inflammatory (LPS, 1 µg/mL) stimuli (Figure 1A). In the macrophages, under all conditions, P2RY12 expression was below the lower limit of detection of the qPCR assay. This is in line with recent reports showing that P2RY12 expression distinguishes human microglia from peripheral monocytes, macrophages, and other immune cells [41, 42]. Nevertheless, as Martinez et al. [34] and Beyer et al. [35] demonstrated that P2RY12 expression is induced in human macrophages upon GM-CSF or M-CSF stimulation, we tested GM-CSF and M-CSF (in a concentration of 100 ng/mL) after 48 h in the presence or absence of LPS (10 ng/mL) or rIL4 (20 ng/mL). Figure S1 shows that the culture conditions including GM-CSF or M-CSF led to detectable levels of P2RY12 mRNA in unstimulated cells, and upon stimulation with rIL4, levels of P2RY12 mRNA increased significantly (35-fold). Regarding the other candidate genes, RAMP1 expression was significantly induced only following rIL4 treatment (40-fold and 15-fold, Figure 1A and Figure S1). Moreover, a slight, but significant, increase (3-fold) in CALCRL mRNA was measured in rIL4-stimulated human macrophages (Figure 1A). In M-CSF-treated human macrophages, however, the observed increase of CALCRL was not significant (Figure S1).
Evaluation of P2RY12, RAMP1, and CALCRL mRNAs in human samples. (A) qPCR analysis of P2RY12, RAMP1, and CALCRL mRNA accumulation in primary human macrophage cultures, 48 h post vehicle, LPS, or rIL4 treatments. Data are expressed as 2-ΔΔCt using the 36B4 transcript as an internal reference standard. Bars represent the mean ± SEM of 3 independent experiments done in triplicate. N.D., not determined. (B) qPCR analysis of P2RY12, RAMP1, and CALCRL mRNA accumulation in primary cultures of human microglia, 48 h post vehicle, LPS, or rIL4 treatments. Data are expressed as 2-ΔΔCt using the 36B4 transcript as an internal reference standard. Bars represent the mean ± SEM of 3 independent experiments done in triplicate. *, P < 0.05; ***, P < 0.001 by two-way ANOVA vs. vehicle.
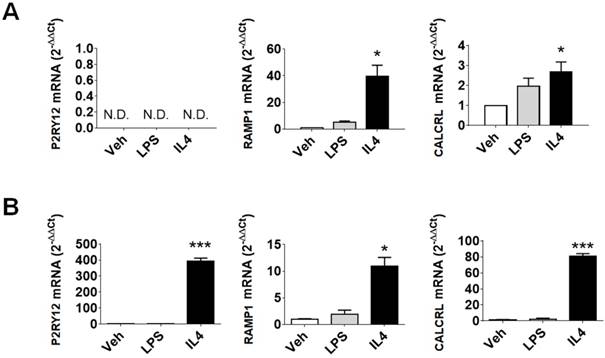
In primary human microglia cells (Figure 1B), LPS stimulation had no effect on the expression of the selected markers. On the other hand, rIL4 induction led to a remarkable increase in P2RY12 (393-fold) and CALCRL (81-fold) mRNAs levels. These data provide evidence that the investigated genes are good indicators of anti-inflammatory microglia activation in human samples.
In vivo induction of the microglial anti-inflammatory activation state
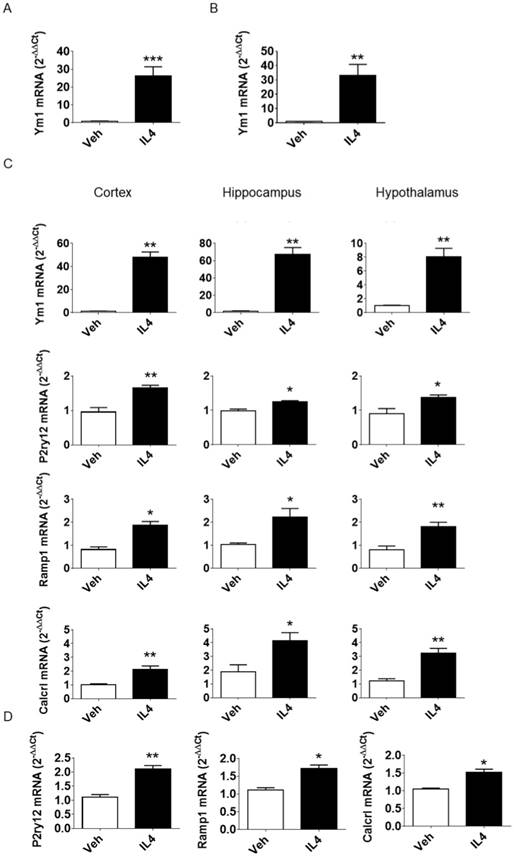
To induce the anti-inflammatory activation state in microglial cells in vivo, murine rIL4 (100 ng) in saline (3 µL) was injected icv in adult male mice. The effectiveness of the treatment was confirmed 16 h after injection by measuring Ym1 mRNA, a well-known marker of anti-inflammatory microglia in mice [22]. A 28-fold increase in Ym1 mRNA expression was measured in whole brain lysates (see Figure 2A) in icv rIL4-injected mice compared to vehicle-injected mice. Further analysis of microglial cells sorted from adult (3-month-old) mice showed that the Ym1 induction (33-fold) took place in CD11b-positive cells (Figure 2B). In contrast, brain cells other than microglia showed very low levels of Ym1 mRNA prior to and after rIL4 treatment (Figure S2), further demonstrating that Ym1 mRNA in microglia was expressed at much higher concentrations than in other neural cells. Thus, the induction of Ym1 observed in the whole brain samples after IL4 icv treatment is attributable to microglia with an anti-inflammatory activation state. Measurement of Ym1 mRNA in specific brain areas (cortex, hippocampus, and hypothalamus, Figure 2C) showed that the rIL4 icv injection induced the anti-inflammatory activation of microglia in the selected brain areas, resulting in a very strong increase of Ym1 in both cortex (48-fold) and hippocampus (67-fold), and a mild induction in the hypothalamus (8-fold). Based on these results, the same protocol was applied in the subsequent experiments.
Evaluation of P2ry12, Ramp1, and Calcrl mRNAs in murine samples. (A) qPCR analysis of Ym1 mRNA expression 16 h post icv injection of rIL4. C57BL/6 mice (n = 3) were injected with 100 ng mouse rIL4 or vehicle. mRNA expression of Ym1 in whole brain lysates was measured by quantitative RT-PCR and data are expressed as 2-ΔΔCt using the 36b4 transcript as an internal reference standard. Bars represent mean ± SEM of 3 independent experiments done in triplicate. (B) Ym1 mRNA was measured in microglia acutely isolated from whole brains of C57BL/6 mice (n = 3) 16 h after rIL4 (IL4, 100 ng) or vehicle (veh) icv injection; data were calculated and are expressed as in the previous figure. Bars represent the mean ± SEM of 3 independent experiments done in triplicate. (C) C57BL6 mice (n = 3) were injected with 100 ng mouse rIL4 or vehicle. Ym1, P2ry12, Ramp1, and Calcrl mRNA content of lysates from three brain areas (cortex, left panel; hippocampus, central panel; hypothalamus, right panel) was measured by quantitative RT-PCR and data are expressed as 2-ΔΔCt using the 36B4 transcript as an internal reference standard. Bars represent the mean ± SEM of 3 independent experiments done in triplicate. *, P < 0.05; **, P < 0.01 by two-way ANOVA vs. vehicle. (D) P2ry12, Ramp1, and Calcrl mRNAs were measured in microglia acutely isolated from whole brains of C57BL/6 mice (n = 3) mice 16 h after rIL4 (IL4, 100 ng) or vehicle icv injection. mRNA content of whole brain lysates was measured by quantitative RT-PCR and data are expressed as 2-ΔΔCt using the 36B4 transcript as an internal reference standard. Bars represent the mean ± SEM of 3 experiments done in triplicate. *, P < 0.05; **, P < 0.01 by two-way ANOVA vs. vehicle.
Candidate target validation in the mouse brain
Next, the expression of the first tier of genes identified by the computational analysis (Table 1) was verified in the aforementioned model. Consistent with the findings of the whole genome analyses, the levels of these genes appeared to be induced/increased after the icv rIL4 treatment, with different expression profiles depending on the considered brain area (Figure 2C). In detail, P2ry12 was maximally induced in the cortex (1.65-fold), Calcrl in the hippocampus (4.13-fold) and Ramp1 was induced similarly in the three analyzed brain regions (cortex, 1.87-fold; hippocampus, 2.21-fold; hypothalamus, 1.81-fold). These results demonstrate that the selected genes are sensitive to rIL4 treatment in vivo and are useful as markers for the anti-inflammatory activation state of microglia in adult mice. Under basal conditions, the content of P2ry12 mRNA was higher (35-fold) in freshly isolated adult microglia than in other brain cells. In contrast, the amounts of Ramp1 and Calcrl mRNAs were comparable in isolated microglia and in brain cells depleted of microglia (Figure S3). Upon icv injection of rIL4, the mRNA expression of the three candidate markers was increased in microglia (Figure 2D; 2.11-fold P2ry12; 1.71-fold Ramp1; 1.51-fold Calcrl).
The high specificity for microglial cells vs. other brain cells and macrophages, and the high and consistent induction in mouse in vivo and in human microglia in vitro suggested P2ry12/P2RY12 as a promising translational target for PET imaging of the anti-inflammatory activation state of microglia. Therefore, subsequent experiments focused on further validation of this marker and additionally on the development of novel PET tracers for application in pre-clinical and clinical in vivo imaging.
Validation of P2RY12 in the rat brain
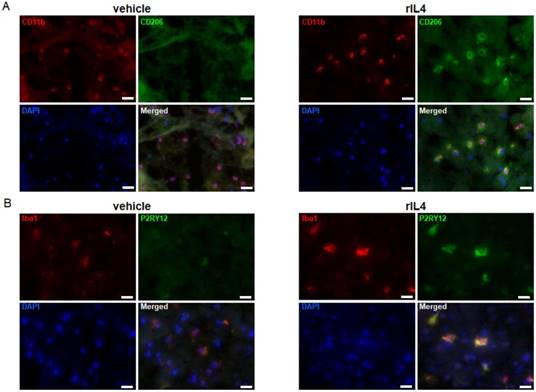
To extend the study to other pre-clinical animal models, P2RY12 expression was also studied in rat microglia. To this purpose, vehicle or rat rIL4 (1 µg) were injected into the striatum of male Wistar rats. The expression levels of CD11b, Iba1, CD206 (a prototypical marker for the anti-inflammatory activation state), and P2RY12 were determined by IHC in brain sections collected 1 day post-injection. The specificity of the antibodies labeling CD206 and P2RY12 was confirmed by a negative control staining (without the first antibodies) in sections of rIL4-injected rats (Figure S4). CD11b and Iba1 positive cells were found in both rIL4-treated and sham-operated rats (Figure 3A-B). IHC for CD206 showed a clear signal on the ipsilateral site in rIL4-injected animals, but not in sham-operated animals, thus confirming that the treatment induced the expected microglial activation state in different species (Figure 3A). IHC for P2RY12 in the same rIL4-treated and sham-operated animals showed a strong staining in the brains of rIL4 animals (ipsi- and to a lesser extent contra-lateral). A faint signal was detected in the brains of sham-operated animals (Figure 3B). Nearly all P2RY12-positive cells also stained positively for Iba1. These results substantiate the hypothesis that increased P2RY12 expression can be considered as a reliable and translational marker for the anti-inflammatory activation state of microglia.
rIL4 induces P2RY12 expression in the rat brain. (A) IHC staining in the rat striatum for CD11b (red), CD206 (green), and DAPI (blue) following treatments with vehicle (left panel) or rIL4 (right panel). Representative images of n = 3 experiments are shown. Magnification: 20x. (B) IHC staining in the rat striatum for Iba1 (red), P2RY12 (green), and DAPI (blue) following treatments with vehicle (left panel) or rIL4 (right panel). Representative images of n = 3 experiments are shown. Magnification: 20x. Scale bars: 20 µm.
Evaluation of P2RY12 expression in rodent and human brain after stroke
Inflammation is considered as a key factor involved in brain tissue damage in response to stroke [43, 44]. Increasing evidence suggests that following the inflammatory phase induced by the ischemia, myeloid cells acquire an anti-inflammatory activation state that is believed to play a role in the tissue repair process [43, 45]. Experimental evidence showed that microglia start expressing anti-inflammatory markers as early as 24 h after pMCAO [46]. At later times, the expression of most pro-inflammatory markers is reduced, while the expression of anti-inflammatory markers increases in parallel with tissue repair [46]. Accordingly, mice that lack appropriate signals for anti-inflammatory induction have worse outcomes after experimental cerebral ischemia [47]. With this in mind, we investigated the expression of P2ry12 in the infarct region of mice subjected to MCAO, thus detecting a decrease in its expression in the affected hemisphere compared with the unaffected hemisphere (Figure S5). Analogously, in rats, IHC stainings performed on brain tissue collected 48 h after pMCAO surgery show that immunoreactivity of P2RY12 was constitutively present in the unaffected areas (Figure 4A). Consistently with the reported evidence of an upregulation of anti-inflammatory activation markers, P2RY12 expression was higher in ramified microglia located at the border of the damaged area than those present in the core of infarction (Figure 4A). Since IHC results were comparable in both species after pMCAO further experiments were focused on one rodent species (mice).
P2RY12 expression is induced after ischemic stroke. (A) Immunostaining of P2RY12 (in green) and DAPI (in blue). Upregulation of P2RY12 expression in ipsilateral brain section surrounding the ischemic core (dotted line). Forty-eight h after pMCAO surgery, P2RY12 expression is increased in the outer border of the ischemic lesion (asterisk), while it is downregulated in the core of the ischemic lesion (pound sign). Scale bar: 1 mm. Inlet: T2W MRI taken at the same anatomic level. (B) Immunostaining of P2RY12 (in green) and TO-PRO-3 (in blue). P2RY12 expression in the infarct region (left panel) or in the non-affected region (right panel) of post-mortem tissue sections of stroke patients deceased 15 days after stroke. Representative images of n = 2 experiments are shown. Top: 20x magnification, scale bar: 30 µm. Bottom: 63x magnification, scale bar: 10 µm.
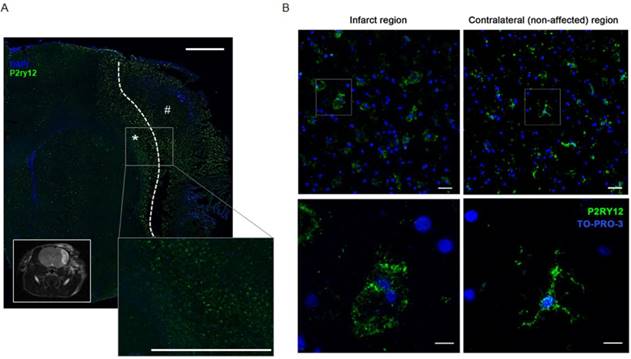
To verify P2RY12 expression in response to stroke in human, tissue sections of stroke patients were collected post-mortem in a time window from 6 to 18 days after stroke. P2RY12 was expressed in human microglia of control tissues. Consistent with prior observations in the rat model, in the core of the infarction site, containing round myeloid cells, P2RY12 immunoreactivity was lower than in the ramified microglia located at the border of the lesion (Figure 4B). These results further support P2RY12 as a potential marker for the anti-inflammatory activation state, characteristic of the recovery phases of stroke in both murine and human brains. The body of evidence collected led us to proceed with the design and development of a novel PET tracer targeting P2RY12.
Development of a PET tracer targeting P2RY12
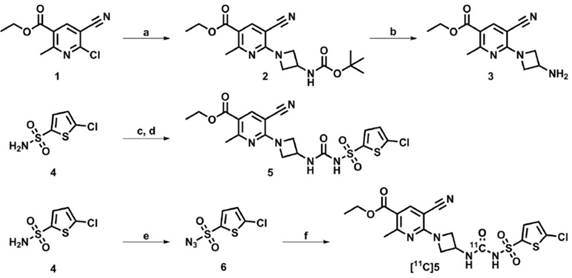
Following a literature search for compounds with high affinity towards P2RY12, a compound (5, IC50 of 6 nM, Figure 5) amenable to radiolabeling with carbon-11, was selected from a series of highly potent P2RY12 antagonists reported by Bach et al. [48]. Precursor 3 was synthesized as described by Bach et al. (Figure 5); sulfonylurea 5 was obtained by in situ formation of the sulfonylisocyanate starting from sulfonamide 4, and the subsequent addition of azetidine-amine 3. Sulfonylazide precursor 6 was obtained by reaction of sulfonamide 4 with freshly prepared triflyl azide. [11C]5 was obtained from precursors 3 and 6 via a rhodium-mediated carbon-11 carbonylation reaction [49, 50] in THF, using [Rh(COD)Cl]2 as rhodium source and triphenylphosphine as ligand. Azide 6 co-eluted with [11C]5 on semi-preparative high performance liquid chromatography (HPLC), therefore, remaining azide 6 was reduced to sulfonamide 4 using ≥ 2 equivalents of tris(2-carboxyethyl)phosphine (TCEP), to facilitate a less complicated purification. The quenched reaction mixture was subjected to semi-preparative HPLC and the collected fraction was formulated to obtain [11C]5 (705-1160 MBq) with sufficient radiochemical purity (> 98%) and molar activity (79 ± 32 GBq/μmol; n = 6) to be evaluated in vitro and in vivo. Formulated [11C]5 was determined to be stable up to 2 h after synthesis by analytical HPLC.
Development of a novel PET tracer targeting P2RY12. Synthesis route towards P2RY12 antagonist 5, precursors 3 and 6, and [11C]5. Reagents and conditions: a) 3-(Boc-amino)azetidine, DiPEA, 1,2-dichloroethane, 60 °C, 1 h, 32%; b) HCl (4 M in 1,4-dioxane), CH2Cl2, 30 min, 87%; c) Chlorosulfonyl isocyanate, 1,2-dichlorobenzene, 160 °C, 2 h; d) 3, MeCN, 16 h, 45% (over 2 steps); e) TfN3, K2CO3, CuIISO4, CH2Cl2/MeOH/H2O, 16 h, 88%; f) 3, [11C]CO, [Rh(COD)Cl]2, PPh3, THF, 100 °C, 5 min, 10 ± 2% (radiochemical yield, decay corrected).
Validation of novel PET tracer [11C]5
Determination of LogDoct,7.4
The LogDoct,7.4 of [11C]5 was determined to be 1.93 ± 0.02 using the shake-flask method (partitioning between 1-octanol and 0.2 M phosphate buffer; pH 7.4).
Ex vivo biodistribution
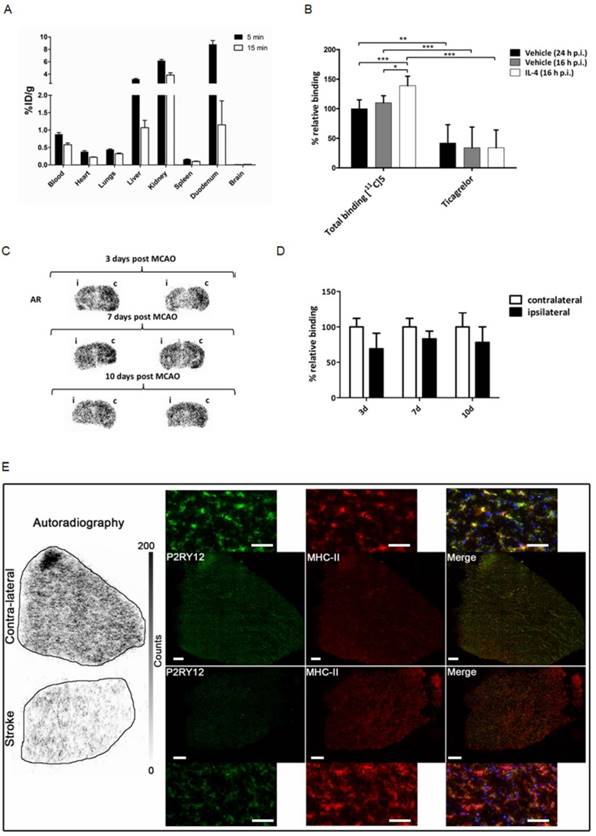
Healthy male Wistar rats were injected with 30 ± 13 MBq of [11C]5, and subsequently sacrificed at 5 min (n = 4) or 15 min (n = 3) after tracer injection to study the distribution of the tracer in vivo (Figure 6A), with a main focus on tracer uptake in the brain. Although P2RY12 is expressed on blood platelets, which could hamper microglia imaging, [11C]5 showed little retention in the blood. [11C]5 showed no abnormalities in peripheral biodistribution; clearance occurred via kidney and liver. However, no brain uptake of [11C]5 was observed (< 0.03% ID/g), likely due to poor passage across the blood-brain barrier (BBB).
Validation of a novel PET tracer targeting P2RY12. (A) Ex vivo biodistribution following intravenous injection of about 30 MBq of P2RY12 PET tracer [11C]5 in healthy male Wistar rats (n = 4 for 5 min; n = 3 for 15 min). Data are expressed as percentage injected dose per gram of tissue (%ID/g). (B) Percentages of [11C]5 binding, relative to binding to brain tissue of vehicle injected mice (sacrificed 16 h p.i.). [11C]5 binding was shown to be 1.4-fold higher on average (n = 4). Binding could be blocked significantly with a non-structurally related P2RY12 antagonist (ticagrelor, 10 µM), indicating specific binding of [11C]5 to P2RY12. *, P < 0.05; **, P < 0.01; ***, P < 0.001 (unpaired t-test, two-tailed). (C) Autoradiograms of mouse brains 3, 7 and 10 days post unilateral tMCAO procedure with affected ipsilateral (i) and unaffected contralateral (c) hemisphere indicated. Sections are from 2 different mice per time point. (D) Quantification of [11C]5 binding in AR experiments. Binding is expressed as percentage relative to tracer binding in the contralateral (c), unaffected hemisphere. Bars represent the mean ± SD of 2 different mice per time point, 5 sections per condition. (E) Human stroke and contralateral tissues stained post-autoradiography with rabbit anti-P2Y12 antibody (green), mouse anti-MHCII (clone LN3) (red), and DAPI (blue). Merge shows co-localization of P2RY12 with microglia stained with anti-MHCII.
Metabolite analysis
To assess the in vivo stability of [11C]5, 51 ± 2 MBq of the tracer was administered to healthy male Wistar rats (n = 3) and 15 min after tracer injection, blood was drawn, and brains were excised. The amount of intact [11C]5 was 27% in plasma, at 15 min after injection (Table 2). Only a low percentage of polar metabolites was found, and HPLC analysis showed one major non-polar metabolite, which is believed to be the carboxylic acid, as esterases are known to rapidly cleave the ester moiety in vivo [51]. Metabolites in brain could not be determined due to lack of brain uptake of [11C]5.
Metabolite analysis results of [11C]5 in plasma (n = 3).
| 15 min (%) | |
|---|---|
| Intact tracer | 27 ± 11 |
| Non-polar metabolite(s) | 70 ± 10 |
| Polar metabolites | 3 ± 1 |
In vitro autoradiography
To validate the binding of [11C]5 to P2RY12, sections of both vehicle-injected mouse brain and rIL4-injected mouse brain (sacrificed 16 h post injection) were incubated with a buffer solution of [11C]5 (10 nM), as well as with the same tracer solution containing the non-structurally related P2RY12 antagonist ticagrelor (10 µM). Specific binding to P2RY12 was observed, as binding could be blocked significantly with ticagrelor in all brain sections (Figure 6B). Binding of [11C]5 was 1.4-fold higher in the rIL4-injected mouse brains compared with vehicle-injected mouse brains, confirming the upregulation of P2RY12 in these conditions. Autoradiography experiments were also performed on mouse brain sections of mice unilaterally subjected to tMCAO. Relative binding of [11C]5 was found to be significantly decreased in the affected hemisphere compared with the unaffected hemisphere at all time points after the procedure (3 d: 69 ± 22%; 7 d: 83 ± 11%; 10 d: 78 ± 22%) (Figure 6C-D).
In addition, a similar autoradiography experiment was performed on post-mortem human brain sections of a stroke patient. [11C]5 showed less binding in the stroke core compared with the contralateral tissue. Immunofluorescence staining was performed on the same tissue after autoradiography to evaluate P2RY12 expression and microglia activation. Immunostaining showed higher expression of P2RY12 on microglia in contralateral tissue compared with stroke core tissue, which correlates with the binding of [11C]5 observed in autoradiography (Figure 6E and Figure S6).
Discussion
Because of its major involvement in several neurological and neuropsychiatric disorders, the function of microglia in neuroinflammation raised considerable interest in recent years. The lack of suitable tools to study these multifaceted cells currently represents a major obstacle for the progression of the understanding of the exact role played by these cells in healthy and diseased people and, therefore, their potential as a therapeutic target. The aim of this work was to identify and validate novel markers that allow for studying the anti-inflammatory activation state of microglia, which is believed to be associated with the ability of microglia to conclude the inflammatory phase and to exert reparative functions. We identified three genes encoding for the proteins P2RY12, RAMP1 and CALCRL, which may represent novel and translational markers, since they are specifically expressed in microglial cells and regulated by anti-inflammatory stimuli both in humans and rodents.
P2RY12 was found to be of particular interest due to its high and restrictive expression in microglia in the CNS, which provides the ability to distinguish microglia from other peripheral immune cells [41, 42, 52, 53]. P2RY12 is a G-protein-coupled purinergic receptor originally discovered in platelets [54], where it is involved in aggregate formation in response to vessel injury [55]. Therefore, multiple compounds with high affinity for P2RY12, originally developed as anticoagulants, have been reported, which could serve as a starting point for the development of novel molecular imaging agents. P2RY12 is downregulated in the pro-inflammatory activation state of microglia [56], which is in line with our findings showing that the expression of P2RY12 is very low when microglia are treated with the inflammatory stimulus LPS. Here we provide evidence that P2RY12 expression is associated with the exposure to anti-inflammatory stimuli in cells of human and murine origin and, more importantly, that P2RY12 protein expression is modulated in the reparative phase of experimental and clinical stroke. Our study significantly extends what was published by Moore et al. [56] on P2RY12 responsiveness to M-CSF, IL4, and IL13. In conclusion, P2RY12 is a potential novel target for quantitative PET imaging allowing analysis of the dynamics of anti-inflammatory microglia activity in living subjects.
As a first attempt towards our aim of developing PET tracers for imaging anti-inflammatory microglia, we successfully synthesized the first PET tracer targeting P2RY12, [11C]5, which enabled us to visualize the binding of the tracer to its target with less than 1 h exposure compared to tritium-labeled radiotracers that require 6-8 weeks of film emulsion exposure or 5-7 days exposure for phosphor imaging. In spite of the relatively low resolution of the carbon-11 labeled ligand, we were able to show a significant increase of [11C]5 binding to brain sections of mice treated icv with IL4 and low binding of [11C]5 to human brain sections of a patient deceased after stroke. These results correlate well with the [11C]5 binding observed in a stroke model in mice, where a decreased binding was observed at all time points (3, 7 and 10 days) after tMCAO in the lesioned hemisphere, which was most pronounced at 3 days after tMCAO. The binding of [11C]5 observed in all tissues was blocked by co-incubation with ticagrelor, indicating specific binding of [11C]5 to P2RY12. Although the increase in P2RY12 induced by anti-inflammatory treatment with IL4 was on the lower side, the possibility to show this increase using tracer binding in autoradiography experiments holds promise for future tracer applications. Even though an increase in P2RY12 signal was shown at the border of the stroke lesion using IHC, we were unable to show this effect in autoradiography studies due to restrictions in signal resolution of this technique in mouse brains and limited availability of suitable tissue sections from humans. Therefore, further experiments are required to determine whether the increase in P2RY12 expression at the stroke border region is sufficient to detect with PET imaging in vivo in human patients. Since P2RY12 is also downregulated under pro-inflammatory conditions, as we consistently detected in the stroke core in rodent and human tissue, an alternative would be to quantify the decrease in P2RY12 signal in the affected regions. Because of its opposite regulation by pro- and anti-inflammatory stimuli, we expect to be able to quantify differences in P2RY12 tracer uptake in different brain regions in human CNS pathologies; this, however, has to be tested in future experiments. Interestingly, a modulation in P2RY12/P2ry12 expression has been reported in the brain of Alzheimer's disease animal models [57] and multiple sclerosis animal models as well as patients [58], and a reduction in its expression levels has recently been linked to a particular microglial phenotype, specifically associated with neurodegenerative diseases [59]: this body of evidence supports the relevance of a P2RY12 tracer for the study of neurodegenerative diseases.
Unfortunately, in vivo studies did not show presence or accumulation of the tracer in the rat brain which indicates that the tracer did not cross the BBB. The lipophilicity (LogDoct,7.4 = 1.93 ± 0.02), of this tracer is compatible with passive diffusion through the BBB; however, it is likely that [11C]5 is too polar to allow for this, and, in addition, it could be speculated that this tracer is a substrate for the brain efflux transporter P-glycoprotein (P-gp). This hypothesis is supported by the high uptake of [11C]5 in duodenum, where P-gp actively transports substrates from the blood into the intestine [60, 61]. Moreover, we found that the metabolic stability of [11C]5 was not optimal for a PET tracer since only 27% of intact compound was still available in the blood after 15 min. Thus, we can conclude that [11C]5 is not suited for in vivo PET imaging, and it would be advisable to look into a different class of compounds for this purpose. However, the developed tracer may still be useful for in vitro studies, and the first results with [11C]5 in post-mortem human brain warrant the pursuing of the P2RY12 receptor as a target for PET imaging of neuroinflammation.
Conclusion
This study shows the potential of a rationale-based approach for the identification of new targets that can be used to design PET tracers. We believe that the value of the present study is to prove the validity of a methodology that can be applied to the rapid analysis of data available in the literature for the identification of novel biomarkers. In addition, we believe that our study will serve an important function in the field of neuroinflammation by providing novel and translational biomarkers for the generation of PET tracers of the anti-inflammatory activation state of microglia. Pre-clinical and clinical implementation of these new tracers will certainly improve our knowledge of the dynamics of the neuroinflammatory processes in aging and neurodegenerative diseases, and will provide new specific, measurable endpoints for the early assessment of therapeutic efficacy in various neurological diseases.
Abbreviations
AD: Alzheimer's disease; ALS: amyotrophic lateral sclerosis; BBB: blood-brain barrier; CNS: central nervous system; ECM: extracellular matrix; GM-CSF granulocyte macrophage colony-stimulating factor; IHC: immunohistochemistry; IL: interleukin; M-CSF: macrophage colony-stimulating factor; PD: Parkinson's disease; PET: positron emission tomography; pMCAO: permanent middle cerebral artery occlusion; rIL4: recombinant interleukin-4; TG2: transglutaminase; tMCAO: transient middle cerebral artery occlusion; TNF: tumor necrosis factor; TSPO: translocator protein; WGCNA: weighted correlation network analysis.
Supplementary Material
Supplementary figures and tables.
Acknowledgements
This work was supported by grants from the European Union's Seventh Framework Programme (FP7/2007-2013) under grant agreement number 278850 (INMiND), the European Union's grant ERC-2012-ADG322977-Ways, the CARIPLO Foundation Italy (2013-0786), and the Neuroscience Campus Amsterdam (NCA IPB-SE-16-RNG).
Competing Interests
The authors have declared that no competing interest exists.
References
1. Colonna M, Butovsky O. Microglia Function in the Central Nervous System During Health and Neurodegeneration. Annu Rev Immunol. 2017;35:41-4
2. Walker FR, Beynon SB, Jones KA, Zhao Z, Kongsui R, Cairns M. et al. Dynamic structural remodelling of microglia in health and disease: a review of the models, the signals and the mechanisms. Brain Behav Immun. 2014;37:1-14
3. Gao HM, Hong JS. Why neurodegenerative diseases are progressive: uncontrolled inflammation drives disease progression. Trends Immunol. 2008;29:357-65
4. Glass CK, Saijo K, Winner B, Marchetto MC, Gage FH. Mechanisms underlying inflammation in neurodegeneration. Cell. 2010;140:918-34
5. Minghetti L. Role of inflammation in neurodegenerative diseases. Curr Opin Neurol. 2005;18:315-21
6. Colton CA. Heterogeneity of microglial activation in the innate immune response in the brain. J Neuroimmune Pharmacol. 2009;4:399-418
7. Shimizu E, Kawahara K, Kajizono M, Sawada M, Nakayama H. IL-4-induced selective clearance of oligomeric beta-amyloid peptide(1-42) by rat primary type 2 microglia. J Immunol. 2008;181:6503-13
8. Neumann J, Gunzer M, Gutzeit HO, Ullrich O, Reymann KG, Dinkel K. Microglia provide neuroprotection after ischemia. The FASEB journal. 2006;20:714-6
9. Blank T, Prinz M. Microglia as modulators of cognition and neuropsychiatric disorders. Glia. 2013;61:62-70
10. Hanisch UK, Kettenmann H. Microglia: active sensor and versatile effector cells in the normal and pathologic brain. Nat Neurosci. 2007;10:1387-94
11. Wyss-Coray T, Mucke L. Inflammation in neurodegenerative disease-a double-edged sword. Neuron. 2002;35:419-32
12. Peña-Altamira E, Prati F, Massenzio F, Virgili M, Contestabile A, Bolognesi ML. et al. Changing paradigm to target microglia in neurodegenerative diseases: from anti-inflammatory strategy to active immunomodulation. Expert Opin Ther Targets. 2016;20:627-40
13. Tang Y, Le W. Differential Roles of M1 and M2 Microglia in Neurodegenerative Diseases. Mol Neurobiol. 2015;53:1181-94
14. Scarf AM, Kassiou M. The translocator protein. J Nucl Med. 2011;52:677-80
15. Cagnin A, Kassiou M, Meikle SR, Banati RB. Positron emission tomography imaging of neuroinflammation. Neurotherapeutics. 2007;4:443-52
16. Rapic S, Backes H, Viel T, Kummer MP, Monfared P, Neumaier B. et al. Imaging microglial activation and glucose consumption in a mouse model of Alzheimer's disease. Neurobiol Aging. 2013;34:351-4
17. Edison P, Archer HA, Gerhard A, Hinz R, Pavese N, Turkheimer FE. et al. Microglia, amyloid, and cognition in Alzheimer's disease: An [11C](R)PK11195-PET and [11C]PIB-PET study. Neurobiol Dis. 2008;32:412-9
18. Lyoo CH, Ikawa M, Liow JS, Zoghbi SS, Morse CL, Pike VW. et al. Cerebellum Can Serve As a Pseudo-Reference Region in Alzheimer Disease to Detect Neuroinflammation Measured with PET Radioligand Binding to Translocator Protein. J Nucl Med. 2015;56:701-6
19. Fan Z, Harold D, Pasqualetti G, Williams J, Brooks DJ, Edison P. Can Studies of Neuroinflammation in a TSPO Genetic Subgroup (HAB or MAB) Be Applied to the Entire AD Cohort? J Nucl Med. 2015;56:707-13
20. Okello A, Edison P, Archer HA, Turkheimer FE, Kennedy J, Bullock R. et al. Microglial activation and amyloid deposition in mild cognitive impairment: a PET study. Neurology. 2009;72:56-62
21. Villa A, Rizzi N, Vegeto E, Ciana P, Maggi A. Estrogen accelerates the resolution of inflammation in macrophagic cells. Sci Rep. 2015;5:15224
22. Pepe G, Calderazzi G, De Maglie M, Villa AM, Vegeto E. Heterogeneous induction of microglia M2a phenotype by central administration of interleukin-4. J Neuroinflammation. 2014;11:211
23. Walker DG, Lue LF. Immune phenotypes of microglia in human neurodegenerative disease: challenges to detecting microglial polarization in human brains. Alzheimers Res Ther. 2015;7:56
24. Raes G, Van den Bergh R, De Baetselier P, Ghassabeh GH, Scotton C, Locati M. et al. Arginase-1 and Ym1 are markers for murine, but not human, alternatively activated myeloid cells. J Immunol. 2005;174:6561 author reply -2
25. van der Wildt B, Lammertsma AA, Drukarch B, Windhorst AD. Strategies towards in vivo imaging of active transglutaminase type 2 using positron emission tomography. Amino Acids. 2016;49:585-95
26. van der Wildt B, Wilhelmus MM, Bijkerk J, Haveman LY, Kooijman EJ, Schuit RC. et al. Development of carbon-11 labeled acryl amides for selective PET imaging of active tissue transglutaminase. Nucl Med Biol. 2016;43:232-42
27. Petryszak R, Burdett T, Fiorelli B, Fonseca NA, Gonzalez-Porta M, Hastings E. et al. Expression Atlas update-a database of gene and transcript expression from microarray- and sequencing-based functional genomics experiments. Nucleic Acids Res. 2014;42:D926-32
28. Vegeto E, Belcredito S, Etteri S, Ghisletti S, Brusadelli A, Meda C. et al. Estrogen receptor-alpha mediates the brain antiinflammatory activity of estradiol. Proc Natl Acad Sci U S A. 2003;100:9614-9
29. Tamura A, Graham DI, McCulloch J, Teasdale GM. Focal cerebral ischaemia in the rat: 1. Description of technique and early neuropathological consequences following middle cerebral artery occlusion. J Cereb Blood Flow Metab. 1981;1:53-60
30. Zinnhardt B, Viel T, Wachsmuth L, Vrachimis A, Wagner S, Breyholz HJ. et al. Multimodal imaging reveals temporal and spatial microglia and matrix metalloproteinase activity after experimental stroke. J Cereb Blood Flow Metab. 2015;35:1711-21
31. Gelosa P, Pignieri A, Gianazza E, Criniti S, Guerrini U, Cappellini MD. et al. Altered iron homeostasis in an animal model of hypertensive nephropathy: stroke-prone rats. J Hypertens. 2013;31:2259-69
32. Eriksson J, Hoek J, Windhorst AD. Transition metal mediated synthesis using [11C]CO at low pressure - a simplified method for 11C-carbonylation. J Labelled Comp Radiopharm. 2012;55:223-8
33. Barrett T, Wilhite SE, Ledoux P, Evangelista C, Kim IF, Tomashevsky M. et al. NCBI GEO: archive for functional genomics data sets-update. Nucleic Acids Res. 2013;41:D991-5
34. Martinez FO, Gordon S, Locati M, Mantovani A. Transcriptional profiling of the human monocyte-to-macrophage differentiation and polarization: new molecules and patterns of gene expression. J Immunol. 2006;177:7303-11
35. Beyer M, Mallmann MR, Xue J, Staratschek-Jox A, Vorholt D, Krebs W. et al. High-resolution transcriptome of human macrophages. PLoS One. 2012;7:e45466
36. Derlindati E, Dei Cas A, Montanini B, Spigoni V, Curella V, Aldigeri R. et al. Transcriptomic analysis of human polarized macrophages: more than one role of alternative activation? PLoS One. 2015;10:e0119751
37. Mehraj V, Textoris J, Ben Amara A, Ghigo E, Raoult D, Capo C. et al. Monocyte responses in the context of Q fever: from a static polarized model to a kinetic model of activation. J Infect Dis. 2013;208:942-51
38. Pello OM, De Pizzol M, Mirolo M, Soucek L, Zammataro L, Amabile A. et al. Role of c-MYC in alternative activation of human macrophages and tumor-associated macrophage biology. Blood. 2012;119:411-21
39. Langfelder P, Horvath S. WGCNA: an R package for weighted correlation network analysis. BMC Bioinformatics. 2008;9:559
40. Kidd BA, Peters LA, Schadt EE, Dudley JT. Unifying immunology with informatics and multiscale biology. Nat Immunol. 2014;15:118-27
41. Butovsky O, Jedrychowski MP, Moore CS, Cialic R, Lanser AJ, Gabriely G. et al. Identification of a unique TGF-beta-dependent molecular and functional signature in microglia. Nat Neurosci. 2014;17:131-43
42. Bennett ML, Bennett FC, Liddelow SA, Ajami B, Zamanian JL, Fernhoff NB. et al. New tools for studying microglia in the mouse and human CNS. Proc Natl Acad Sci U S A. 2016;113:E1738-46
43. Hu X, Li P, Guo Y, Wang H, Leak RK, Chen S. et al. Microglia/macrophage polarization dynamics reveal novel mechanism of injury expansion after focal cerebral ischemia. Stroke. 2012;43:3063-70
44. Gabriel C, Justicia C, Camins A, Planas AM. Activation of nuclear factor-kappaB in the rat brain after transient focal ischemia. Brain Res Mol Brain Res. 1999;65:61-9
45. Miro-Mur F, Perez-de-Puig I, Ferrer-Ferrer M, Urra X, Justicia C, Chamorro A. et al. Immature monocytes recruited to the ischemic mouse brain differentiate into macrophages with features of alternative activation. Brain Behav Immun. 2016;53:18-33
46. Lee Y, Lee SR, Choi SS, Yeo HG, Chang KT, Lee HJ. Therapeutically targeting neuroinflammation and microglia after acute ischemic stroke. Biomed Res Int. 2014;2014:297241
47. Perez-de Puig I, Miro F, Salas-Perdomo A, Bonfill-Teixidor E, Ferrer-Ferrer M, Marquez-Kisinousky L. et al. IL-10 deficiency exacerbates the brain inflammatory response to permanent ischemia without preventing resolution of the lesion. J Cereb Blood Flow Metab. 2013;33:1955-66
48. Bach P, Boström J, Brickmann K, van Giezen JJJ, Groneberg RD, Harvey DM. et al. Synthesis, structure-property relationships and pharmacokinetic evaluation of ethyl 6-aminonicotinate sulfonylureas as antagonists of the P2Y12 receptor. Eur J Med Chem. 2013;65:360-75
49. Åberg O, Långström B. Synthesis of substituted [11C] ureas and [11C] sulphonylureas by Rh (I)-mediated carbonylation. J Labelled Comp Radiopharm. 2011;54:38-42
50. Doi H, Barletta J, Suzuki M, Noyori R, Watanabe Y, Langstrom B. Synthesis of 11C-labelled N,N'-diphenylurea and ethyl phenylcarbamate by a rhodium-promoted carbonylation via [11C]isocyanatobenzene using phenyl azide and [11C]carbon monoxide. Org Biomol Chem. 2004;2:3063-6
51. Williams FM. Serum enzymes of drug metabolism. Pharmacol Ther. 1987;34:99-109
52. Sasaki Y, Hoshi M, Akazawa C, Nakamura Y, Tsuzuki H, Inoue K. et al. Selective expression of Gi/o-coupled ATP receptor P2Y12 in microglia in rat brain. Glia. 2003;44:242-50
53. Mildner A, Huang H, Radke J, Stenzel W, Priller J. P2Y12 receptor is expressed on human microglia under physiological conditions throughout development and is sensitive to neuroinflammatory diseases. Glia. 2017;65:375-87
54. Hollopeter G, Jantzen HM, Vincent D, Li G, England L, Ramakrishnan V. et al. Identification of the platelet ADP receptor targeted by antithrombotic drugs. Nature. 2001;409:202-7
55. Dorsam RT, Kunapuli SP. Central role of the P2Y12 receptor in platelet activation. J Clin Invest. 2004;113:340-5
56. Moore CS, Ase AR, Kinsara A, Rao VT, Michell-Robinson M, Leong SY. et al. P2Y12 expression and function in alternatively activated human microglia. Neurol Neuroimmunol Neuroinflamm. 2015;2:e80
57. Friedman BA, Srinivasan K, Ayalon G, Meilandt WJ, Lin H, Huntley MA. et al. Diverse Brain Myeloid Expression Profiles Reveal Distinct Microglial Activation States and Aspects of Alzheimer's Disease Not Evident in Mouse Models. Cell Rep. 2018;22:832-47
58. Beaino W, Janssen B, Kooij G, van der Pol SMA, van Het Hof B, van Horssen J. et al. Purinergic receptors P2Y12R and P2X7R: potential targets for PET imaging of microglia phenotypes in multiple sclerosis. J Neuroinflammation. 2017;14:259
59. Keren-Shaul H, Spinrad A, Weiner A, Matcovitch-Natan O, Dvir-Szternfeld R, Ulland TK. et al. A Unique Microglia Type Associated with Restricting Development of Alzheimer's Disease. Cell. 2017;169:1276-90 e17
60. Chan LM, Cooper AE, Dudley AL, Ford D, Hirst BH. P-glycoprotein potentiates CYP3A4-mediated drug disappearance during Caco-2 intestinal secretory detoxification. J Drug Target. 2004;12:405-13
61. MacLean C, Moenning U, Reichel A, Fricker G. Closing the gaps: a full scan of the intestinal expression of p-glycoprotein, breast cancer resistance protein, and multidrug resistance-associated protein 2 in male and female rats. Drug Metab Dispos. 2008;36:1249-54
62. Haynes SE, Hollopeter G, Yang G, Kurpius D, Dailey ME, Gan WB. et al. The P2Y12 receptor regulates microglial activation by extracellular nucleotides. Nat Neurosci. 2006;9:1512-9
63. Consonni A, Morara S, Codazzi F, Grohovaz F, Zacchetti D. Inhibition of lipopolysaccharide-induced microglia activation by calcitonin gene related peptide and adrenomedullin. Mol Cell Neurosci. 2011;48:151-60
64. Ringer C, Tune S, Bertoune MA, Schwarzbach H, Tsujikawa K, Weihe E. et al. Disruption of calcitonin gene-related peptide signaling accelerates muscle denervation and dampens cytotoxic neuroinflammation in SOD1 mutant mice. Cell Mol Life Sci. 2017;74:339-58
65. Schilling S, Zeitschel U, Hoffmann T, Heiser U, Francke M, Kehlen A. et al. Glutaminyl cyclase inhibition attenuates pyroglutamate Abeta and Alzheimer's disease-like pathology. Nat Med. 2008;14:1106-11
66. Harden TK, Sesma JI, Fricks IP, Lazarowski ER. Signalling and pharmacological properties of the P2Y14 receptor. Acta Physiol (Oxf). 2010;199:149-60
67. Chora AA, Fontoura P, Cunha A, Pais TF, Cardoso S, Ho PP. et al. Heme oxygenase-1 and carbon monoxide suppress autoimmune neuroinflammation. J Clin Invest. 2007;117:438-47
68. Wang X, Li C, Chen Y, Hao Y, Zhou W, Chen C. et al. Hypoxia enhances CXCR4 expression favoring microglia migration via HIF-1alpha activation. Biochem Biophys Res Commun. 2008;371:283-8
69. Saligrama N, Noubade R, Case LK, Poynter ME, Teuscher C. H(1)R expression by CD11B(+) cells is not required for susceptibility to experimental allergic encephalomyelitis. Cell Immunol. 2012;278:27-34
70. Quan Y, Jiang J, Dingledine R. EP2 receptor signaling pathways regulate classical activation of microglia. J Biol Chem. 2013;288:9293-302
71. Aijo T, Edelman SM, Lonnberg T, Larjo A, Kallionpaa H, Tuomela S. et al. An integrative computational systems biology approach identifies differentially regulated dynamic transcriptome signatures which drive the initiation of human T helper cell differentiation. BMC Genomics. 2012;13:572
Author contact
![]() Corresponding author: alessandromaria.villait
Corresponding author: alessandromaria.villait