13.3
Impact Factor
Theranostics 2018; 8(19):5200-5212. doi:10.7150/thno.27806 This issue Cite
Research Paper
Down-regulation of OGT promotes cisplatin resistance by inducing autophagy in ovarian cancer
1. Department of Gynecology and Obstetrics, Xijing Hospital, Fourth Military Medical University, Xi'an, Shaanxi 710032, China;
2. State Key Laboratory of Military Stomatology & National Clinical Research Center for Oral Diseases & Shaanxi International Joint Research Center for Oral Diseases, Center for Tissue Engineering, School of Stomatology, Fourth Military Medical University, Xi'an, Shaanxi 710032, China;
3. Department of Pharmacy, the 456th Hospital of the People's Liberation Army, Jinan Shandong 250031, China;
4. Department of Traditional Chinese Medicine, Xijing Hospital, Fourth Military Medical University, Xi'an, Shaanxi 710032, China;
5. Department of Radiology, Xijing Hospital, Fourth Military Medical University, Xi'an, Shaanxi 710032, China.
#These authors contributed equally to this work.
Received 2018-6-11; Accepted 2018-9-3; Published 2018-10-6
Abstract

Cisplatin resistance significantly affects the survival rate of patients with ovarian cancer. However, the main mechanism underlying cisplatin resistance in ovarian cancer remains unclear.
Methods: Immunohistochemistry was used to determine the expression of OGT, OGA and O-GlcNAc in chemoresistant and chemosensitive ovarian cancer tissues. Functional analyses (in vitro and in vivo) were performed to confirm the role of OGT in cisplatin resistance. Autophagy-related proteins were tested by western blot. Transmission electron microscopy and mRFP-GFP-LC3 adenovirus reporter were used for autophagy flux analysis. Immunoprecipitation assay was utilized to detect protein-protein interactions.
Results: We found that O-GlcNAc and O-GlcNAc transferase (OGT) levels were significantly lower in chemoresistant ovarian cancer tissues than in chemosensitive tissues, whereas O-GlcNAcase (OGA) levels did not differ. The down-regulation of OGT increased cisplatin resistance in ovarian cancer cells but had no effect on the efficacy of paclitaxel. The down-regulation of OGT improved tumor resistance to cisplatin in a mouse xenograft tumor model. OGT knockdown enhanced cisplatin-induced autophagy, which reduced apoptotic cell death induced by cisplatin, and promoted autolysosome formation. A reduction in O-GlcNAcylated SNAP-29 levels caused by the down-regulation of OGT promoted the formation of the SNARE complex and autophagic flux.
Conclusion: Our findings suggest that down-regulation of OGT enhances cisplatin-induced autophagy via SNAP-29, resulting in cisplatin-resistant ovarian cancer. OGT may represent a novel target for overcoming cisplatin resistance in ovarian cancer.
Keywords: autophagy, chemoresistance, OGT, ovarian cancer, SNARE.
Introduction
Ovarian cancer seriously threatens the health of women [1-3]. Owing to a lack of reliable early detection methods, about 70% patients are initially diagnosed as stage III or IV [4-7]. At present, the standard treatment plan for patients with ovarian cancer is aggressive surgical debulking followed by platinum-based chemotherapy. Progress in radical surgery and chemotherapy has improved the treatment of ovarian cancer [8]. However, the intrinsic or acquired chemotherapy resistance of cancer cells is an important factor affecting the efficacy of chemotherapy, resulting in recurrence, metastasis, and mortality; this is a major issue for clinical treatment [9, 10]. Therefore, determining the mechanism underlying chemotherapy resistance and developing effective preventive and therapeutic measures have become top priorities in studies of ovarian cancer.
Cisplatin is a first-line chemotherapeutic agent for ovarian cancer; it induces cell apoptosis primarily by inducing cellular DNA damage [11]. Although cisplatin-based chemotherapy is very effective for ovarian cancer, drug resistance greatly reduces its efficacy. Recent studies have shown that autophagy plays a crucial role in chemotherapy resistance [12-14]. Autophagy is a self-protection mechanism that occurs as an emergency response but can cause cell death [15-17]. It is precisely this self-protection ability that increases the resistance of cancer cells to chemotherapeutic drugs. Autophagy consists of the formation of autophagosomes and later stages of autolysosomes, which mainly include the fusion of autophagosomes and lysosomes and the degradation of autophagosome contents [18]. The SNARE complex, composed of Syntaxin 17 (Stx17), SNAP-29, and VAMP8, is involved the autophagosome-endosome/lysosome fusion process [19, 20]. Previous studies have shown that Stx17, which is recruited by autophagosomes, interacts with SNAP-29 in the cytoplasm and further combines with VAMP7 or VAMP8 on the lysosomal membrane to promote the fusion of autophagosomes and lysosomes [21]. However, the regulatory mechanism of SNARE proteins is not clear.
O-GlcNAcylation is a post-translational modification that transfers β-linked N-acetylglucosamine (GlcNAc) to the serine or threonine residues by O-GlcNAc transferase (OGT). In contrast, O-GlcNAcase (OGA) can remove O-GlcNAc from proteins, thus the whole process is reversible and dynamic [22, 23]. O-GlcNAcylation plays an important role in maintaining the normal physiological functions of cells [24]. Many tumor-associated proteins are modified by O-GlcNAcylation and accordingly it has a pivotal role in both tumor progression and prognosis [25-28]. In this study, the role of OGT in cisplatin-induced drug resistance and its relationship with autophagy were examined.
Methods
Clinical materials and immunohistochemistry
Paraffin-embedded tissues were obtained from patients diagnosed with ovarian cancer from 2011 to 2013. All patients underwent primary surgery followed by completed cisplatin-based chemotherapy. Patient characteristics are listed in Table 1. Patients were divided into two groups, chemoresistant and chemosensitive, defined as follows. Chemoresistant: in the course of postoperative chemotherapy, the disease continued to progress; CA125 did not fall to the normal range after 6 courses of chemotherapy; or patients suffered recurrence within 6 months after the primary chemotherapy. Chemosensitive: patients suffered recurrence beyond 6 months or no recurrence occurred. Before the investigation, the participants were informed about the objectives of this study and signed informed consent forms. Ethics approval was obtained from the Institutional Review Board at Xijing Hospital, Fourth Military Medical University.
The tissue microarray was incubated with antibodies after deparaffinization, rehydration, antigen retrieval, and quenching of endogenous peroxidase. The slides were incubated with anti-OGT (1:100, Abcam, ab96718), anti-O-GlcNAc (1:100, Abcam, ab2739) or anti-OGA (1:100, SIGMA, SAB4200267) overnight at 4 °C. After washing with PBS thrice, slides were incubated with biotinylated secondary antibodies for 1 h at room temperature, and then, antibody labeling was visualized with diaminobenzidine. Finally, the tissue microarray was scanned by tissue microscopy (Pannoramic MIDI, 3D HISTECH, Budapest), and the histochemistry score (H-SCORE) was obtained from Quant center analysis. Statistical analysis was performed according to the H-SCORE.
Patient characteristics.
| Characteristic | Chemotherapy | P-value | |
|---|---|---|---|
| Sensitive (n=27) | Resistant (n=18) | ||
| Age (years) | 53.41±1.355 | 50.61±3.316 | 0.3819 |
| Clinical Stage | |||
| Ⅰ | 4 | 1 | |
| Ⅱ | 3 | 1 | 0.2067 |
| Ⅲ | 19 | 12 | |
| Ⅳ | 1 | 4 | |
| Histology | |||
| Serous | 25 | 15 | 0.3329 |
| Mucinous | 2 | 3 | |
Cell culture
A2780 and SKOV3 were obtained from the Shanghai Cell Collection (Shanghai, China) and were maintained in RPMI 1640 (Hyclone, SH30809.01) and McCoy 5A medium (Gibco, 16600082), supplemented with 10% fetal bovine serum (Tianhang, 11012-8611) at 37 °C and 5% CO2.
Cell viability assays
Equal numbers of the two cell lines (5,000 cells per well for A2780 and 8,000 cells per well for SKOV3) were added to 96-well plates. Cells were treated with cisplatin at a concentration gradient (6 replicates for each concentration) for 48 h before harvesting. Cell counting kit-8 (CCK-8, Bestbio, BB-4202) reagent was added to the cells according to the manufacturer's instructions and incubated for 2 h. The spectrophotometric absorbance of the samples was measured using Infinite M200PRO (Tecan, USA) at 450 nm.
Western blotting analysis
Western blotting was performed as previously described [29]. Briefly, after protein extraction and denaturation, an appropriate SDS-PAGE protocol (15% SDS-PAGE for VAMP8; 12% SDS-PAGE for LC3, SNAP-29 and Stx17; 10% SDS-PAGE for O-GlcNAc and p62; 8% SDS-PAGE for OGT) was selected according to the molecular weight of the protein. The primary antibody was incubated at the appropriate concentration overnight at 4 °C. The membranes were then incubated with secondary antibodies conjugated with horseradish peroxidase for 2 h at room temperature and visualized using ECLTM Western Blotting Detection Reagent (Bio-Rad, USA). The antibodies used in this study were as follows: OGT (1:1,000, Abcam, ab96718), LC3 (1:1,000, CST, 2775s), p62 (1:1,000, Abcam, ab56416), O-GlcNAcylation (1:1,000, Abcam, ab2739), SNAP-29 (1:1,000, Abcam, ab138500), Stx17 (1:1,000, MBL, PM045), VAMP8 (1:5,000, Abcam, ab76021), Actin (1:2,000, CWBIO, CW0096A).
Generation of stable cell lines and transient transfection
A2780 (50,000 cells/well) and SKOV3 (80,000 cells/ well) cells were cultured in 6-well plates for 18 h before being treated with lentiviral vectors for 8 h. The cells were incubated further in normal culture medium for 48 h, and then, puromycin was added for 3-4 weeks to establish stable cell lines. The cDNA encoding SNAP-29, SNAP-29 (Mut) and LC3 were cloned in pcDNA3.1, pEGFP-N1 or pmCherry-C1 vectors. The cells were transfected with Lip2000 (Invitrogen, 11668019). The siRNA sequences were: SNAP-29, 5'-AGACAGAAAUUGAGGAGCA-3'; Stx17, 5'- CCGAAAGGAUGACCUAGUA-3'; VAMP8, 5'-GCAACAAGACAGAGGAUCU- 3'. The siRNA was delivered into cells with Lipo2000 according to the instructions of the manufacturer.
Apoptosis analysis
The percentage of cells that underwent apoptosis or necrosis was determined using the ANXA5-FITC and propidium iodide (PI) analysis kit (Beyotime, C1062). Twenty-four hours after treatment with cisplatin (5 µg/mL), cells were harvested, washed once in PBS, and resuspended at a final concentration of 1×10⁶ cells/mL. ANXA5 and PI staining was performed according to the manufacturer's instructions. Samples were analyzed by a flow cytometer (Cytomics FC 500; Beckman-Coulter, Danvers, MA) equipped with CXP 2.1 software.
Immunocytochemistry
A2780 (5,000 cells/well) and SKOV3 (8,000 cells/well) were added on a Millicell EZ slide (Millipore, PEZGS0816). After culturing for 12 h, cells were treated with cisplatin for 24 h. Cells were washed with PBS three times and fixed with 4% paraformaldehyde for 20 min at room temperature and then treated with 0.1% Triton X-100 for 20 min. Cells were blocked with 0.1% BSA for 1 h at room temperature and subsequently incubated with anti-LC3 (1:100, CST, 2775s) and Lamp1 (1:200, Abcam, ab25630) at 4 °C overnight. After washing three times with PBS, the cells were incubated with the secondary antibody for 1 h and DAPI for 30 min at room temperature. The slides were washed 3 times in PBS and then examined under a fluorescence microscope (Olympus BX51TF, Japan).
Autophagic flux analysis
As previously described [30], cells in the confocal dishes were transfected with mRFP-GFP-LC3 adenovirus (Hanbio, China) at a multiplicity of infection of 80. Twenty-four hours after transfection, cells were cultured for 24 h with or without cisplatin. Then, cells were scanned with a confocal microscope (FV10i, Olympus, Japan). The number of RFP and GFP puncta were calculated in 5 fields, and no fewer than 50 cells in each group were counted.
Transmission electron microscopy
As previously described [30], cells were fixed with phosphate buffer containing 2.5% glutaraldehyde and 2% paraformaldehyde solution for 2 h. After washing with PBS three times, cells were post-fixed with 1% osmium tetroxide for 2 h. The specimens were then dehydrated and embedded in Araldite 812 and cut with a Leica EM UC7 (Leica, Solms, Germany) ultra-microtome. Ultra-thin sections were stained with 1% uranyl acetate and 1% lead citrate. The specimens were observed with a Tecnai G2 Spirit (FEI, Eindhoven, Netherland) transmission electron microscope operating at 120 kV.
Coimmunoprecipitation
Cells were lysed on ice with lysis buffer (20 mM Tris pH 7.5, 150 mM NaCl, 1% Triton X-100, and protein inhibitor) for 20 min. The extracts were centrifuged at 12,000×g for 20 min at 4 °C. After preclearing with protein A/G (7seabiotech, P001-3), the supernatants were incubated with primary antibody and rocked at 4 °C overnight. Then, protein A/G was added and cells were incubated at 4 °C on a rocker platform for 1 h. The beads were washed with lysis buffer 4 times and then subjected to immunoblotting analysis.
Tumor xenograft assay
Five-week-old female BALB/c nude mice (Vital River Laboratories, China) were raised in pathogen-free conditions. SKOV3 cells stably transfected LV-OGT-RNAi or LV-Control-RNAi were resuspended in sterilized PBS. A total 1×10⁶ cells in 200 µL PBS were injected subcutaneously into the flank of nude mice. Cisplatin treatment was initiated on the 23rd day after subcutaneous cell injection; mice in each group were injected with cisplatin (3 mg/kg) or PBS in the abdominal cavity 3 times a week for 2 weeks. Every other day, the tumor volume was measured with a caliper, and the weight of the nude mice was recorded. The formula volume = width × length2 × 0.5 was used to calculate the tumor volumes. All study protocols were approved by the Animal Care and Use Committee of The Forth Military Medical University.
Statistical analysis
Results are presented as the mean ± SD. Statistical significance was assessed using a 2-tailed Student's t-test or chi-squared test. P < 0.05 was considered statistical significance.
Results
Reductions in OGT and O-GlcNAc are associated with chemoresistance in ovarian tumors
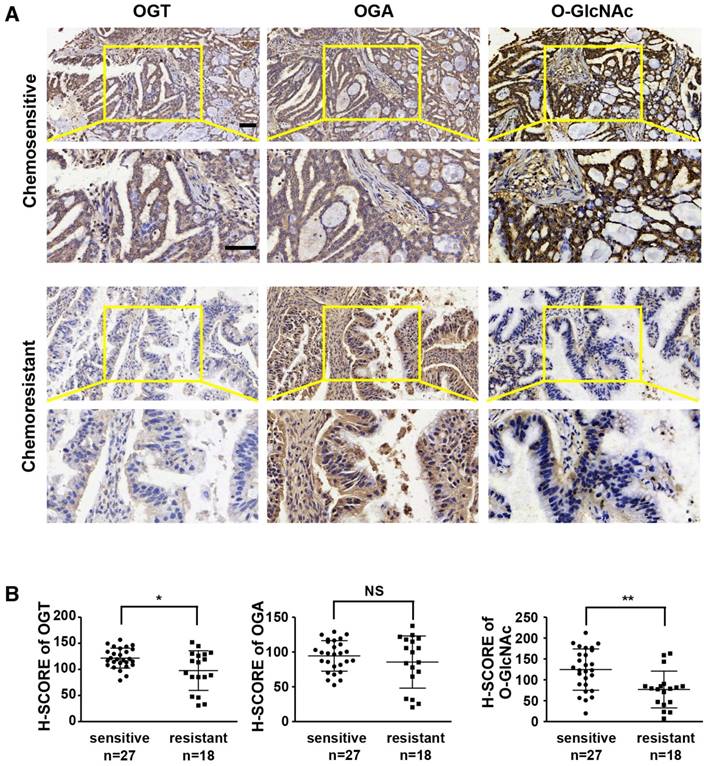
Previous studies have shown that aberrant levels of OGT are associated with tumor development and poor prognosis [23, 31, 32]. We investigated the expression levels of OGT, OGA, and O-GlcNAc in chemoresistant and chemosensitive ovarian cancer tissues by immunohistochemistry (Table 1 and Figure 1). The levels of OGT and O-GlcNAc were significantly lower in tissues from chemoresistant patients than in chemosensitive ovarian cancer tissues (Figure 1A-B). The histochemistry scores (H-SCORE) for OGT and O-GlcNAc were significantly lower in chemoresistant ovarian cancer samples than in chemosensitive samples (P < 0.05; Figure 1B). However, the level of OGA did not differ appreciably between the two groups. (P = 0.3231; Figure 1A-B).
Down-regulation of OGT reduces the efficacy of cisplatin in ovarian cancer cells
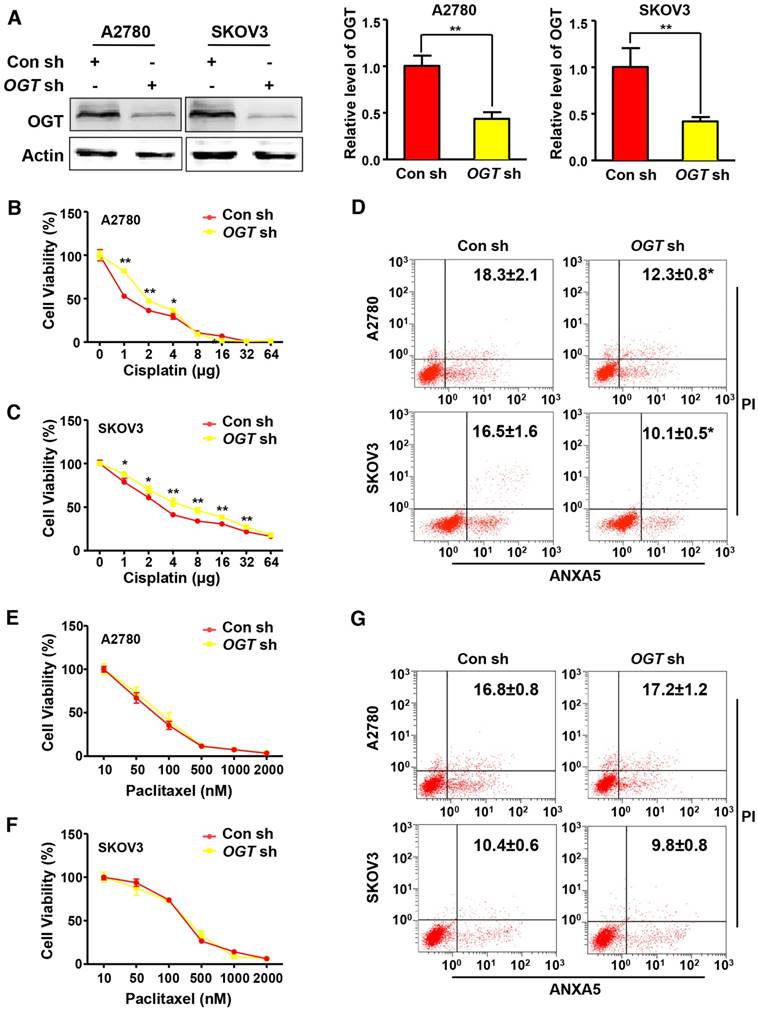
Cisplatin and paclitaxel are first-line chemotherapy drugs for the treatment of ovarian cancer. We examined the effects of two different chemotherapy drugs on OGT-knockdown ovarian cancer cell lines. We generated stable OGT-deficient A2780 and SKOV3 cell lines using OGT-specific small hairpin RNA (shRNA). The protein level of OGT was reduced in both LV-OGT-RNAi-infected ovarian cancer cell lines compared to control cells (Figure 2A). We found that OGT knockdown did not affect cell proliferation or apoptosis (Figure S1A-B). Then, we treated A2780 and SKOV3 cells with cisplatin in OGT-knockdown and control cells to evaluate cell proliferation. As shown in Figure 2B-C, compared with the control cells, OGT knockdown significantly improved the viability of cisplatin-treated ovarian cancer cells. Furthermore, flow cytometry was performed by ANXA5 and PI staining to evaluate cisplatin-induced apoptosis in OGT-knockdown and control cells. OGT knockdown significantly decreased cisplatin-induced apoptosis in the two ovarian cancer cells (Figure 2D). Then, we examined the effects of altered OGT expression on paclitaxel sensitivity in A2780 and SKOV3 cells. The down-regulation of OGT did not lead to a decrease in paclitaxel sensitivity in either cell line (Figure 2E-F). Based on flow cytometry, the down-regulation of OGT did not reduce apoptosis induced by paclitaxel (Figure 2G). These results indicate that the down-regulation of OGT reduces the sensitivity of ovarian cancer cells to cisplatin but has no effect on paclitaxel sensitivity.
OGT knockdown improves ovarian tumor cisplatin resistance in vivo
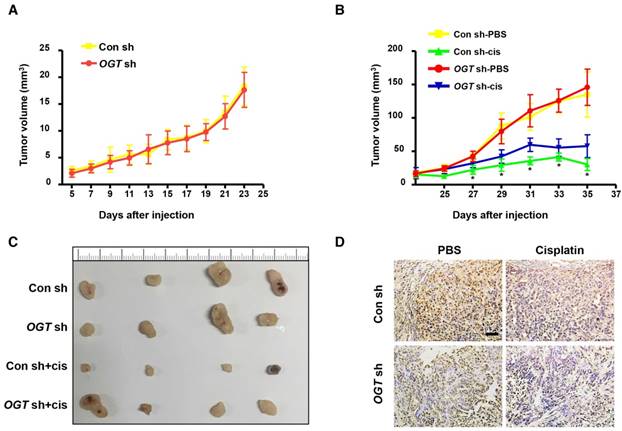
Next, we investigated the effect of OGT on tumor formation in mice using a xenograft model. Either control (Con-sh) or OGT-deficient (OGT-sh) SKOV3 cells were implanted subcutaneously in the flanks of female nude mice. After 5 days, mice injected with SKOV3-control cells and SKOV3-deficient cells began to form tumors and the tumor volume did not differ significantly between the two groups (Figure 3A). As shown by IHC staining, the expression of OGT in the OGT-sh group was less than that of the Con-sh group (Figure 3D). Then, we investigated whether the down-regulation of OGT improves cisplatin resistance in vivo. After 23 days, we treated tumor-bearing mice with cisplatin or PBS and found that the tumor size in cisplatin-treated groups was significantly reduced compared with that in the PBS-treated groups. Moreover, the tumors size in the OGT cisplatin-treated (OGT sh+cis) group was significantly larger than that of the control cisplatin-treated (Con sh+cis) group (Figure 3B-C).
OGT and O-GlcNAc are decreased in chemoresistant ovarian cancer tissues. Immunohistochemical staining of OGT, O-GlcNAc and OGA were carried out on chemoresistant and chemosensitive ovarian cancer tissue sections. (A) Stained tissues are shown at 200× and 400× magnifications. Scale bar represent 50 μm. (B) H-SCORE of the two groups. **P < 0.01, *P < 0.05.
Cisplatin resistance due to down-regulation of OGT is associated with autophagy
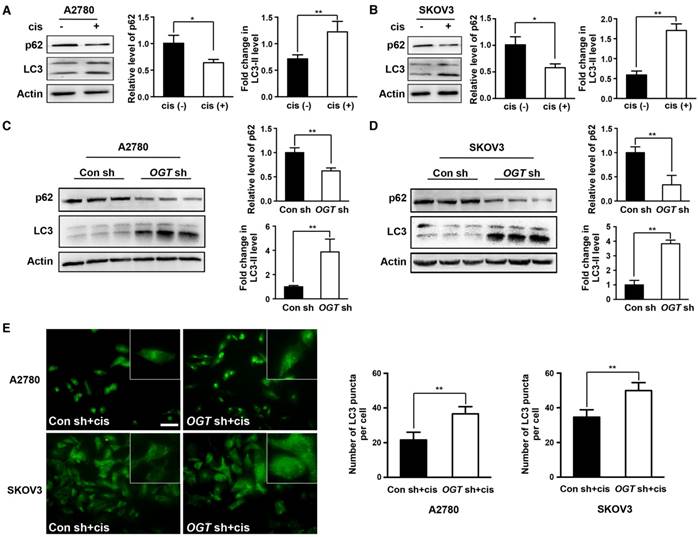
Previous studies have shown that cisplatin can induce autophagy activation [13, 14], which has a protective role in cells. Therefore, autophagy may be related to cisplatin resistance. We next investigated whether cisplatin induces autophagy in ovarian cancer cells. We found that cisplatin significantly increased the ratio of LC3-II to LC3-I (Figure 4A-B). We also examined the expression of p62, a well-known substrate of autophagy, and found that the cisplatin-treated group exhibited significantly reduced p62 expression (Figure 4A-B). We next explored whether the down-regulation of OGT enhances the autophagy induced by cisplatin. The ratio of LC3-II to LC3-I was further increased in OGT-deficient cells compared to that in control cells with or without cisplatin treatment (Figure 4C-D and Figure S2A). Moreover, we examined the number of LC3 puncta in A2780 and SKOV3 cells by immunofluorescence and found that OGT shRNA markedly increased the number of LC3 puncta (Figure 4E and Figure S2B). We also observed that the addition of cisplatin after OGT knockdown could further increase the autophagy level of ovarian cancer cells (Figure 4C-E).
Down-regulation of OGT enhances cisplatin resistance in ovarian cancer cell lines. (A) A2780 and SKOV3 were transfected with control or OGT shRNA to establish stable OGT-deficient cell lines. Western blotting was used to test the expression of OGT in control and OGT-deficient cells. (B-C) Control and OGT-deficient cells were treated with different concentrations of cisplatin for 48 h. The cell viability of A2780 (B) and SKOV3 (C) were measured by CCK-8 after cisplatin treatment. (D) Control and OGT-deficient cells were treated with cisplatin (5 µg/mL) for 24 h. Apoptotic cells were measured by ANXA5 and PI staining. The numbers shown are the sum of ANXA5-positive and double-positive cells. (E-F) Control and OGT-deficient cells were treated with different concentrations of paclitaxel for 48 h. The cell viability of A2780 (E) and SKOV3 (F) were measured by CCK-8 after paclitaxel treatment. (G) Control and OGT-deficient cells were treated with paclitaxel (100 nM) for 24 h. Apoptotic cells were measured by ANXA5 and PI staining. The numbers shown are the sum of ANXA5-positive and double-positive cells. The values are presented as a mean ± SD (n = 3). **P < 0.01, *P < 0.05.
OGT deficiency leads to the development of cisplatin resistance in vivo. (A) SKOV3 control and OGT-deficient cells were injected in the flanks of BALB/c nude mice. Tumor volume was measured every other day. Data are shown as mean ± SEM (n = 16). (B) Twenty-three days after cell injection, mice were injected intraperitoneally with PBS or cisplatin (3 mg/kg) 3 times per week for 2 weeks. Tumor volume was measured every other day. Data are shown as mean ± SEM (n = 8). *P < 0.05 vs Con sh-PBS, OGT sh-PBS, or OGT sh-cis group. (C) Representative tumors. (D) Expression of OGT in tumors tested by IHC. Scale bar represent 50 μm.
Down-regulation of OGT enhances autophagy induced by cisplatin in ovarian cancer cells. (A-B) A2780 and SKOV3 cells were treated with or without cisplatin (5 µg/mL) for 24 h. The expression levels of LC3 and p62 were tested by western blotting. (C-D) Control and OGT-deficient ovarian cancer cells were treated with cisplatin (5 µg/mL) for 24 h. LC3 and p62 expression levels were determined by western blotting. (E) Control and OGT-deficient ovarian cancer cells were cultured with cisplatin (5 µg/mL) for 24 h. LC3 puncta were detected by anti-LC3 by fluorescence microscopy. Scale bar represent 50 μm. The values are presented as mean ± SD (n = 3). **P < 0.01, *P < 0.05.
Down-regulation of OGT enhances cisplatin-induced autophagy by inducing autolysosome formation
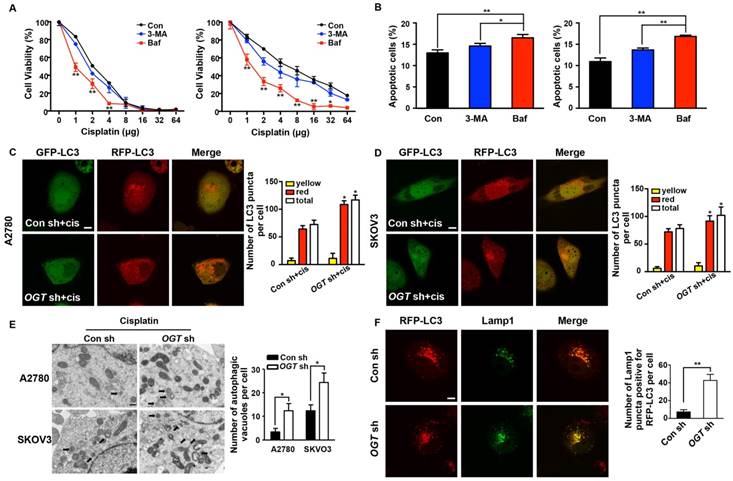
To further examine whether autophagy plays a role in cisplatin resistance caused by OGT knockdown, we inhibited autophagy using 3-methyladenine (3-MA) and bafilomycin A1 (Baf), which prevent the formation and fusion of autophagosomes, respectively (Figure S3C). Neither 3-MA or Baf affected cell proliferation and apoptosis (Figure S3A-B). After the addition of Baf, the viability of cisplatin-treated cells decreased significantly, but only slightly decreased after the addition of 3-MA (Figure 5A). Furthermore, flow cytometry showed that Baf led to a stronger increase in the sensitivity of OGT-deficient cells to cisplatin and induced more cell apoptosis than did 3-MA (Figure 5B). Thus, we consider that OGT mediate cell autophagy by affecting the fusion of autophagosomes. Subsequently, we monitored autophagy flux using an mRFP-GFP-LC3 adenovirus reporter. Because GFP is sensitive to acidic conditions, when autophagosomes fuse with lysosomes, GFP fluorescence is quenched and only red fluorescence can be detected [15]. When GFP and RFP fluorescence appear simultaneously, it indicates that the autophagosomes have not combined with lysosomes, e.g., the phagophore or autophagosome. The red puncta, which exhibited no or weak GFP signals, were obviously increased in OGT-deficient ovarian cancer cells compared to control cells (Figure 5C-D and Figure S2C). The total autophagic structures (GFP-RFP+ and GFP+RFP+ LC3 puncta) also increased in the two cell lines. However, the down-regulation of OGT did not lead to a change in the yellow puncta (RFP+GFP+ LC3) in the two cell lines (Figure 5C-D). Morphological analysis by transmission electron microscopy revealed that the number of autophagic vacuoles per cell increased significantly in OGT-deficient cells after cisplatin treatment (Figure 5E). In addition, we compared the number of RFP-LC3 signals that co-localized with Lamp1, a late endosome-lysosome marker, and found that there were more mRFP signals co-localized with Lamp1 in OGT-deficient cells (Figure 5F). Thus, the down-regulation of OGT promotes the fusion of autophagosomes and lysosomes.
Down-regulation of OGT promotes the formation of autolysosome induced by cisplatin. (A) OGT-deficient A2780 and SKOV3 cells were cultured in different concentrations of cisplatin with 3-MA (3 mM) or Baf (200 nM) for 48 h. Cell viability was measured by CCK-8. (B) OGT-deficient A2780 and SKOV3 cells were treated with 3-MA (3 mM) or Baf (200 nM) in the presence of cisplatin (5 µg/mL) for 24 h. Apoptotic cells were identified by ANXA5 and PI staining. (C-D) Control and OGT-deficient A2780 (C) and SKOV3 (D) cells were transfected with mRFP-GFP-LC3 vector for 24 h and then treated with cisplatin (5 µg/mL) for 24 h. Representative images of fluorescent LC3 puncta are shown. The mean number of yellow puncta representing autophagosomes and the mean number of red puncta representing autolysosomes are plotted. *P < 0.05 compared with Con sh+cis group. Scale bar represent 10 μm. (E) Control and OGT-deficient A2780 and SKOV3 cells were treated with cisplatin for 24 h and then analyzed by transmission electron microscopy. Scale bars represent 500 nm. (F) OGT-deficient SKOV3 cells were transfected with RFP-LC3 plasmids and then treated with cisplatin (5 µg/mL) for 24 h. Lamp1 puncta were detected by anti-Lamp1. Scale bar represent 10 μm. The values are presented as mean ± SD (n = 3). **P < 0.01, *P < 0.05.
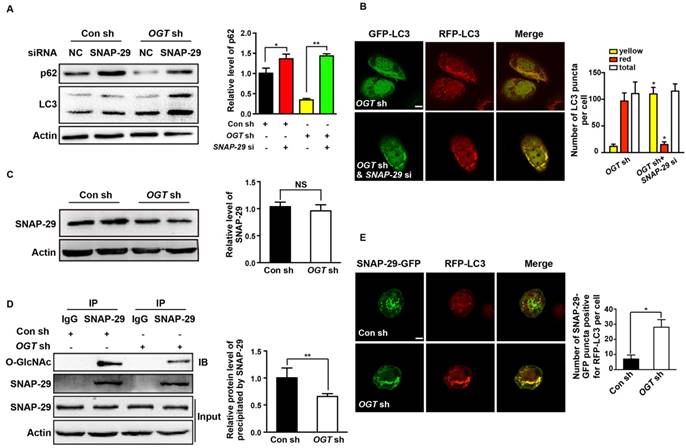
The O-GlcNAcylation level of SNAP-29 is associated with autophagy activity induced by cisplatin. (A) Control and OGT-deficient SKOV3 cells were transfected with NC siRNA or SNAP-29 siRNA and then treated with cisplatin (5 µg/mL) for 24 h. The expression levels of LC3 and p62 were examined by western blotting. (B) OGT-deficient SKOV3 cells were transfected with mRFP-GFP-LC3 vector for 24 h and then transfected with NC siRNA or SNAP-29 siRNA. After culturing in cisplatin (5 µg/mL) for 24 h, cells were imaged with a confocal microscope. Representative images of fluorescent LC3 puncta are shown. *P < 0.05 compared with OGT sh group. Scale bar represent 10 μm. (C) SKOV3 cells stably expressing control shRNA or OGT shRNA were treated with cisplatin (5 µg/mL) for 24 h and then the expression of SNAP-29 was tested by western blotting. (D) After being treated with cisplatin (5 µg/mL) for 24 h, the control and OGT-deficient SKOV3 cell extracts were immunoprecipitated with anti-SNAP-29 and the resulting precipitants were immunoblotted against O-GlcNAc. Whole-cell lysates were tested for SNAP-29 and actin. (E) Control and OGT-deficient SKOV3 cells were transfected with SNAP-29-GFP and RFP-LC3 vector and then treated with cisplatin (5 µg/mL) for 24 h. Colocalization of SNAP-29 and LC3 was determined by confocal fluorescence microscopy. Scale bar represent 10 μm. The values are presented as mean ± SD (n = 3). **P < 0.01, *P < 0.05.
Aberrant autophagy induced by OGT deregulation is associated with O-GlcNAcylation of SNAP-29
Many autophagy-related proteins could be modified by O-GlcNAcylation, including SNAP-29, which is involved in the fusion of autophagosomes and lysosomes [33, 34]. When si-SNAP-29 was added to SKOV3 cells, LC3 accumulated and the expression of p62 increased after cisplatin treatment. This phenomenon was not reversed by OGT knockdown (Figure 6A). The addition of si-SNAP-29 reduced the number of red puncta induced by the down-regulation of OGT but increased the yellow puncta (Figure 6B). Compared with control cells, the down-regulation of OGT had no effect on the expression of SNAP-29 (Figure 6C). However, O-GlcNAcylation levels of SNAP-29 were lower in OGT-deficient cells than in control cells (Figure 6D). In addition, the co-localization of SNAP-29 and LC3 in OGT-deficient cells was significantly increased based on the result of immunofluorescence (Figure 6E). Therefore, the enhanced autophagy caused by the down-regulation of OGT depends on the O-GlcNAcylation levels of SNAP-29.
Inhibition of O-GlcNAcylation of SNAP-29 promotes autophagy flux in ovarian cancer cells
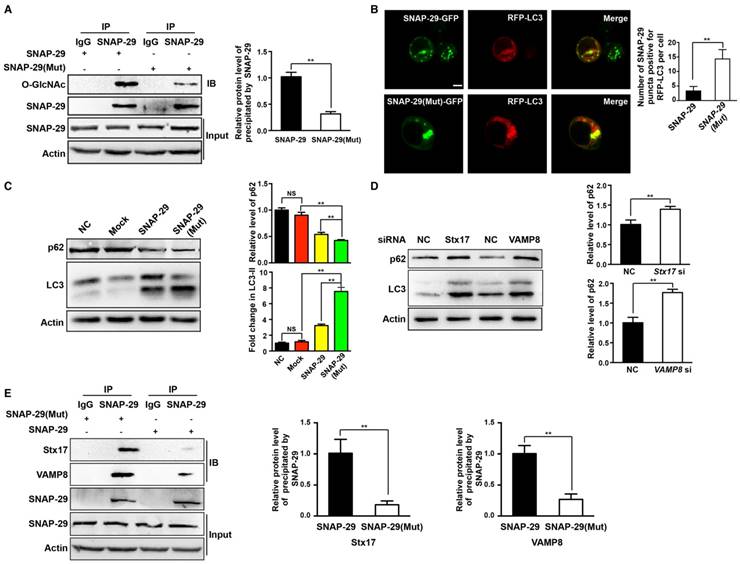
To further establish the relationship between autophagy and O-GlcNAc-modification of SNAP-29, we determined the level of intracellular autophagy after SNAP-29 glycosylation site mutation. Compared with cells transfected with the wild-type SNAP-29 plasmid, the O-GlcNAcylation level of SNAP-29 was significantly reduced in cells transfected with the SNAP-29 (Mut) mutant plasmid (Figure 7A). We further examined the co-localization of SNAP-29 and LC3 after cisplatin treatment and found that the co-localization of SNAP-29 and LC3 increased in cells expressing SNAP-29 (Mut) (Figure 7B). Western blots also showed that the ratio of LC3-II to LC3-I increased in SNAP-29 (Mut) cells, while the expression of p62 decreased after cisplatin treatment. Furthermore, we found that the level of autophagy increased in the cisplatin-treated cells transfected with the SNAP-29 wild-type plasmid, but the effect of cisplatin was significantly weaker than that in SNAP-29 (Mut) cells (Figure 7C). The SNARE complex, including SNAP-29, VAMP8, and Stx17, mediates the fusion of autophagosomes and lysosomes. When si-Stx17 and si-VAMP8 were added to OGT-deficient cells, LC3 accumulated and the expression of p62 increased after cisplatin treatment, indicating that the autophagic flux was inhibited (Figure 7D). Coimmunoprecipitation showed that the down-regulation of OGT increased the levels of Stx17 and VAMP8 co-precipitated by SNAP-29 after treatment with cisplatin (Figure 7E). These results suggest that following treatment with cisplatin, the down-regulation of OGT induces the formation of the SNAP29-Stx17-VAMP8 complex, resulting in promotion of the autophagic flux.
Discussion
Ovarian cancer is still one of the most fatal gynecological malignancies. After treatment with cisplatin-based chemotherapeutic drugs, the immediate remission rate of advanced ovarian cancer can reach more than 80%, but most patients relapse within 2-3 years, and almost all recurrent ovarian cancers are resistant to chemotherapy [35, 36]. Chemotherapy resistance has become a major challenge for sustainable treatment and new strategies are needed. The formation of drug resistance involves a variety of factors, particularly the acquisition of mutations that result in increased cell resistance to apoptosis induced by chemotherapy drugs [37, 38]. An understanding of the molecular mechanisms underlying chemotherapy resistance may provide a basis for the development of treatments for ovarian cancer. Our results provide the first evidence that OGT expression is decreased in chemoresistant tissues, and this reduction in OGT increases the resistance of ovarian cancer cells to cisplatin and promotes cisplatin-induced autophagy to form drug resistance.
O-GlcNAcylation of SNAP-29 regulates the interaction of SNAP-29 with Stx17 and VAMP8. (A) SKOV3 cells were transfected with SNAP-29 and SNAP-29 (Mut) vectors and then treated with cisplatin (5 µg/mL) for 24 h. The O-GlcNAcylation levels of SNAP-29 were tested by co-immunoprecipitation. (B) SKOV3 cells were transfected with SNAP-29-GFP, SNAP-29 (Mut)-GFP and RFP-LC3 vectors and then treated with cisplatin (5 µg/mL) for 24 h. Colocalization of SNAP-29 and LC3 was determined by confocal fluorescence microscopy. Scale bar represent 10 μm. (C) SKOV3 cells were transfected with control, SNAP-29 or SNAP-29 (Mut) vectors and then treated with cisplatin (5 µg/mL) for 24 h. The expressions of LC3 and p62 were measured by western blotting. (D) The expressions of LC3 and p62 in SKOV3 cells that were transfected with si Stx17 or si VAMP8 and treated with cisplatin (5 µg/mL) for 24 h. (E) SKOV3 cell were transfected with SNAP-29 or SNAP-29 (Mut) vectors and then treated with cisplatin (5 µg/mL) for 24 h. Then, cell extracts were immunoprecipitated with anti-SNAP-29 and the resulting precipitants were immunoblotted against Stx17 and VAMP8. Whole-cell lysates were tested for SNAP-29 and actin. The values are presented as mean ± SD (n = 3). **P < 0.01, *P < 0.05.
OGT exists extensively in the nucleus and cytoplasm and can participate in the regulation of gene expression, metabolic reactions, cellular stress responses, and other reactions related to the cell nutritional status [39]. The deregulation of OGT is associated with a variety of human diseases, including cancer, cardiovascular disease, diabetes, and Alzheimer's disease [22, 31, 40]. Previous studies have focused on differences in OGT levels between normal and tumor tissues, and relatively few studies have examined changes of OGT in chemotherapy resistance tissues. In our study, we found that OGT and O-GlcNAc levels were significantly lower in chemoresistant ovarian cancer tissues than in chemosensitive tissues. Previous studies have shown that OGT levels are elevated in tumors and are related to malignancy [41, 42], but our results indicated that OGT expression in drug-resistant tissues was reduced. An explanation for this difference is that OGT promotes the occurrence and development of tumors and a reduction in OGT helps cancer cells respond to the harsh environment. OGT is involved in the post-translational modification of various proteins, we evaluated whether changes in OGT are a cause of chemoresistance in ovarian cancer. We found that the down-regulation of OGT reduced cisplatin-induced apoptosis and increased cell viability. However, no changes were observed with down-regulation of OGT in paclitaxel-treated cells. Cisplatin mainly inhibits cell division by damaging DNA whereas paclitaxel, as a cell cycle inhibitor, mainly combines with intracellular microtubule protein to prevent the proliferation of cancer cells. The different effects of OGT down-regulation may be due to the different anti-tumor mechanisms of the two drugs. OGT knockdown had no effect on tumor growth in the mouse xenograft tumor model but promoted tumor resistance to cisplatin. Therefore, the down-regulation of OGT may be associated with cisplatin resistance in ovarian cancer.
Previous studies have shown that OGT is involved in the regulation of autophagic activity. Park et al. found that the overexpression of OGT reduces autophagy via Akt/dFOXO signaling [43]. Guo et al. reported that OGT regulates autophagy by mediating the O-GlcNAcylation level of the SNARE protein SNAP-29 in Caenorhabditis elegans and HeLa cells [21]. To investigate whether autophagy is involved in cisplatin resistance induced by OGT deregulation, we evaluated the expression of LC3 and p62. The autophagy marker protein LC3 exhibited elevated expression and p62 exhibited reduced expression in OGT-deficient cells in the presence of cisplatin. Autophagy is a self-degradation process, phagocytosing cytoplasmic proteins or organelles and fusing with lysosomes, therefore meeting the basic metabolic needs of cells. The strong protective effect mediated by autophagy enables cells to respond to various intrinsic or extrinsic stimuli [18]. We found that chemotherapy can activate autophagy, and the activation of autophagy may help cells resist drug toxicity and develop resistance [13, 14]. We found that cisplatin induced autophagy in ovarian cancer cells, and the inhibition of autophagy increased cisplatin-induced apoptosis (data not shown). These results suggest that the down-regulation of OGT increases cisplatin-induced autophagy, and this enhanced autophagy promotes cell resistance to cisplatin toxicity.
Autophagic flux includes the following steps: induction and autophagosome formation, autolysosome formation, and degradation. Our findings showed that OGT knockdown induces autolysosome formation, which promotes autophagic flux. Previous studies have indicated that autophagosomes fuse with lysosomes in a manner dependent on the Rab protein family and the SNARE protein family. Morelli et al. found that a lack of SNAP-29, one of the SNARE proteins, induces the accumulation of autophagosomes, highlighting a major role of SNAP-29 in autolysosome formation [44]. Guo et al. found that SNAP-29 is O-GlcNAcylated and the O-GlcNAcylation of SNAP-29 regulates the formation of a complex comprising SNAP-29, autophagosome-localized Stx17, and lysosomal VAMP8 [21]. In this study, we found that LC3 accumulated and the expression of p62 increased when SNAP-29 was downregulated. P62, a ubiquitin and LC3 binding protein, is a selective autophagy substrate and cargo receptor for degradation of ubiquitinated substrates by autophagy. Since p62 is degraded during autophagy, after we down-regulated SNAP-29 to prevent the fusion of autophagosomes, p62 could not be degraded and then aggregated in cells. Moreover, the effect of OGT knockdown on cisplatin-induced autophagy was abolished after addition of si-SNAP-29. As the sole transferase for O-GlcNAc modification, changes in the expression of OGT directly affect the level of O-GlcNAcylation of intracellular proteins. We downregulated OGT and found that the O-GlcNAcylation of SNAP-29 was significantly reduced, consistent with previous results [21]. Moreover, the co-localization of intracellular SNAP-29 and LC3 increased after OGT knockdown, indicating that the inhibition of the O-GlcNAc-modification of SNAP29 promotes the fusion of autophagosomes and lysosomes.
We previously found that increasing O-GlcNAc-modified β-catenin prevented it from combining with the destruction complex [29]. Other studies have also shown that the O-GlcNAc modification competitively inhibits phosphorylation [39]. Therefore, we evaluated whether the O-GlcNAc modification of SNAP29 prevents its interaction with Stx17 and VAMP8, thereby preventing fusion of autophagosomes and lysosomes, resulting in obstruction of autophagy. When the SNAP-29 glycosylation site was mutated, not only the level of autophagy was increased, but also the combination of SNAP-29 with Stx17 and VAMP8 was increased. Moreover, the effect of downregulation of OGT on cisplatin-induced autophagy was attenuated by si-Stx17 and si-VAMP8. Therefore, down-regulation of OGT causes a reduction in SNAP-29 O-GlcNAcylation, which promotes SNAP-29 interactions with Stx17 and VAMP8 and autophagic flux.
In conclusion, our results indicate that OGT plays an essential role in cisplatin resistance in ovarian cancer. Down-regulation of OGT reduced O-GlcNAc modification of SNAP-29 and subsequently promoted SNAP29-Stx17-VAMP8 complex formation and autophagy, thereby contributing to cisplatin resistance. Our findings suggest that OGT is a new molecular marker for chemotherapy resistance and provide new clinical targets for chemotherapy.
Abbreviations
3-MA: 3-Methyladenine; ANXA5: annexin A5; Baf: bafilomycin A1; O-GlcNAc: O-linked β-N-acetylglucosamine; OGA: O-GlcNAcase; OGT: O-GlcNAc transferase; SDS-PAGE: sodium dodecyl sulfate polyacrylamide gel electrophoresis; SNAP-29: synaptosomal-associated protein 29 kDa; SNARE: soluble NSF attachment protein receptor; Stx17: syntaxin 17; VAMP8: vesicle-associated membrane protein 8.
Supplementary Material
Supplementary figures.
Acknowledgements
The authors gratefully acknowledge the Shaanxi Key Lab of Free Radical Biology and Medicine for providing experimental conditions.
Funding
This work was supported by NSFC (National Science Foundation of China) (No.81672583, No.81672828, No. 81402133).
Competing Interests
The authors have declared that no competing interest exists.
References
1. Chornokur G, Amankwah EK, Schildkraut JM. et al. Global ovarian cancer health disparities. J Gynecol Oncol. 2013;129:258-64
2. Krzystyniak J, Ceppi L, Dizon DS. et al. Epithelial ovarian cancer: the molecular genetics of epithelial ovarian cancer. Ann Oncol. 2016;27(Suppl 1):i4-i10
3. Siegel RL, Miller KD, Jemal A. Cancer Statistics, 2017. CA Cancer J Clin. 2017;67:7-30
4. Kobayashi H, Yamada Y, Sado T. et al. A randomized study of screening for ovarian cancer: a multicenter study in Japan. Int J Gynecol Cancer. 2008;18:414-20
5. Buys SS, Partridge E, Black A. et al. Effect of screening on ovarian cancer mortality: the Prostate, Lung, Colorectal and Ovarian (PLCO) Cancer Screening Randomized Controlled Trial. JAMA. 2011;305:2295-303
6. van Nagell JR Jr, Miller RW, DeSimone CP. et al. Long-term survival of women with epithelial ovarian cancer detected by ultrasonographic screening. Gynecol Obstet. 2011;118:1212-21
7. Jacobs IJ, Menon U, Ryan A. et al. Ovarian cancer screening and mortality in the UK Collaborative Trial of Ovarian Cancer Screening (UKCTOCS): a randomised controlled trial. Lancet. 2016;387:945-56
8. Benedet JL, Bender H, Jones H 3rd. et al. FIGO staging classifications and clinical practice guidelines in the management of gynecologic cancers. Int J Gynaecol Obstet. 2000;70:209-62
9. Kleppe M, van der Aa MA, Van Gorp T. et al. The impact of lymph node dissection and adjuvant chemotherapy on survival: A nationwide cohort study of patients with clinical early-stage ovarian cancer. Eur J Cancer. 2016;66:83-90
10. Cocco E, Deng Y, Shapiro EM. et al. Dual-targeting nanoparticles for in vivo delivery of suicide genes to chemotherapy-resistant ovarian cancer cells. Mol Cancer Ther. 2017;16:323-33
11. Pavan S, Olivero M, Cora D. et al. IRF-1 expression is induced by cisplatin in ovarian cancer cells and limits drug effectiveness. Eur J Cancer. 2013;49:964-73
12. Wang J, Wu GS. Role of autophagy in cisplatin resistance in ovarian cancer cells. J BIOL CHEM. 2014;289:17163-73
13. He J, Yu JJ, Xu Q. et al. Downregulation of ATG14 by EGR1-MIR152 sensitizes ovarian cancer cells to cisplatin-induced apoptosis by inhibiting cyto-protective autophagy. Autophagy. 2015;11:373-84
14. Kim M, Jung JY, Choi S. et al. GFRA1 promotes cisplatin-induced chemoresistance in osteosarcoma by inducing autophagy. Autophagy. 2017;13:149-68
15. Klionsky DJ, Abeliovich H, Agostinis P. et al. Guidelines for the use and interpretation of assays for monitoring autophagy in higher eukaryotes. Autophagy. 2008;4:151-75
16. Levine B, Kroemer G. Autophagy in the pathogenesis of disease. CELL. 2008;132:27-42
17. Nakatogawa H, Suzuki K, Kamada Y. et al. Dynamics and diversity in autophagy mechanisms: lessons from yeast. Nat Rev Mol Cell Biol. 2009;10:458-67
18. Feng Y, He D, Yao Z. et al. The machinery of macroautophagy. CELL RES. 2014;24:24-41
19. Hegedus K, Takats S, Kovacs AL. et al. Evolutionarily conserved role and physiological relevance of a STX17/Syx17 (syntaxin 17)-containing SNARE complex in autophagosome fusion with endosomes and lysosomes. Autophagy. 2013;9:1642-6
20. Shen HM, Mizushima N. At the end of the autophagic road: an emerging understanding of lysosomal functions in autophagy. Trends Biochem Sci. 2014;39:61-71
21. Guo B, Liang Q, Li L. et al. O-GlcNAc-modification of SNAP-29 regulates autophagosome maturation. Nat Cell Biol. 2014;16:1215-26
22. Slawson C, Copeland RJ, Hart GW. O-GlcNAc signaling: a metabolic link between diabetes and cancer? Trends Biochem Sci. 2010;35:547-55
23. Fardini Y, Dehennaut V, Lefebvre T. et al. O-GlcNAcylation: A new cancer hallmark? Front Endocrinol. 2013;4:99
24. Slawson C, Hart GW. O-GlcNAc signalling: Implications for cancer cell biology. Nat Rev Cancer. 2011;11:678-84
25. Gu Y, Mi W, Ge Y. et al. GlcNAcylation plays an essential role in breast cancer metastasis. CANCER RES. 2010;70:6344-51
26. Mi W, Gu Y, Han C. et al. O-GlcNAcylation is a novel regulator of lung and colon cancer malignancy. Biochim Biophys Acta. 2011;1812:514-9
27. Yang YR, Jang HJ, Yoon S. et al. OGA heterozygosity suppresses intestinal tumorigenesis in Apc(min/+) mice. Oncogenesis. 2014;3:e109
28. Yang YR, Kim DH, Seo YK. et al. Elevated O-GlcNAcylation promotes colonic inflammation and tumorigenesis by modulating NF-kappaB signaling. Oncotarget. 2015;6:12529-42
29. Zhou F, Huo J, Liu Y. et al. Elevated glucose levels impair the WNT/beta-catenin pathway via the activation of the hexosamine biosynthesis pathway in endometrial cancer. J Steroid Biochem Mol Biol. 2016;159:19-25
30. Zhao H, Zhang M, Zhou F. et al. Cinnamaldehyde ameliorates LPS-induced cardiac dysfunction via TLR4-NOX4 pathway: The regulation of autophagy and ROS production. J Mol Cell Cardiol. 2016;101:11-24
31. Ma Z, Vosseller K. Cancer metabolism and elevated O-GlcNAc in oncogenic signaling. J BIOL CHEM. 2014;289:34457-65
32. Singh JP, Zhang K, Wu J. et al. O-GlcNAc signaling in cancer metabolism and epigenetics. Cancer Lett. 2015;356:244-50
33. Wang P, Hanover JA. Nutrient-driven O-GlcNAc cycling influences autophagic flux and neurodegenerative proteotoxicity. Autophagy. 2013;9:604-6
34. Fahie K, Zachara NE. Molecular functions of glycoconjugates in autophagy. J MOL BIOL. 2016;428:3305-24
35. Ledermann JA, Marth C, Carey MS. et al. Role of molecular agents and targeted therapy in clinical trials for women with ovarian cancer. Int J Gynecol Cancer. 2011;21:763-70
36. van Jaarsveld MT, van Kuijk PF, Boersma AW. et al. miR-634 restores drug sensitivity in resistant ovarian cancer cells by targeting the Ras-MAPK pathway. Mol Cancer. 2015;14:196
37. Holohan C, Van Schaeybroeck S, Longley DB. et al. Cancer drug resistance: an evolving paradigm. Nat Rev Cancer. 2013;13:714-26
38. Ali AY, Farrand L, Kim JY. et al. Molecular determinants of ovarian cancer chemoresistance: new insights into an old conundrum. Ann N Y Acad Sci. 2012;1271:58-67
39. Levine ZG, Walker S. The bochemistry of O-GlcNAc transferase: which functions make it essential in mammalian cells? Annu Rev Biochem. 2016;85:631-57
40. Shi Y, Tomic J, Wen F. et al. Aberrant O-GlcNAcylation characterizes chronic lymphocytic leukemia. Leukemia. 2010;24:1588-98
41. Itkonen HM, Minner S, Guldvik IJ. et al. O-GlcNAc transferase integrates metabolic pathways to regulate the stability of c-MYC in human prostate cancer cells. CANCER RES. 2013;73:5277-87
42. Zhu Q, Zhou L, Yang Z. et al. O-GlcNAcylation plays a role in tumor recurrence of hepatocellular carcinoma following liver transplantation. MED ONCOL. 2012;29:985-93
43. Park S, Lee Y, Pak JW. et al. O-GlcNAc modification is essential for the regulation of autophagy in Drosophila melanogaster. Cell Mol Life Sci. 2015;72:3173-83
44. Morelli E, Ginefra P, Mastrodonato V. et al. Multiple functions of the SNARE protein Snap29 in autophagy, endocytic, and exocytic trafficking during epithelial formation in Drosophila. Autophagy. 2014;10:2251-68
Author contact
![]() Corresponding author: Biliang Chen, Email: cblxjhedu.cn; Jia Li, Email: lijia219net.
Corresponding author: Biliang Chen, Email: cblxjhedu.cn; Jia Li, Email: lijia219net.
 Global reach, higher impact