Impact Factor
- Issue 14; 2026
- Issue 13; 2026
- Issue 12; 2026
- Issue 11; 2026
- Issue 10; 2026
- Volume 16; 2026
- Advance Articles
- Past Issues
- Cover Images
- Cover Suggestion
- Index & Coverage
- Special Issues
Introduction
Methods
Results
Discussion
Conclusion
Abbreviations
Supplementary Material
Acknowledgements
References
International Journal of Biological Sciences
International Journal of Medical Sciences
 Global reach, higher impact

Theranostics 2018; 8(17):4856-4869. doi:10.7150/thno.24252 This issue Cite
Research Paper
Evaluation of antibody fragment properties for near-infrared fluorescence imaging of HER3-positive cancer xenografts
Ayman El-Sayed1, Wendy Bernhard1, Kris Barreto1, Carolina Gonzalez1, Wayne Hill1, Landon Pastushok1, Humphrey Fonge2,3 ![]() , C. Ronald Geyer1
, C. Ronald Geyer1 ![]()
1. Department of Pathology, University of Saskatchewan, Saskatoon, Canada
2. Department of Medical Imaging, University of Saskatchewan, Saskatoon, Canada
3. Department of Medical Imaging, Royal University Hospital Saskatoon, Canada
Received 2017-12-7; Accepted 2018-7-10; Published 2018-9-9
Abstract

In vivo imaging is influenced by the half-life, tissue penetration, biodistribution, and affinity of the imaging probe. Immunoglobulin G (IgG) is composed of discrete domains with known functions, providing a template for engineering antibody fragments with desired imaging properties. Here, we engineered antibody-based imaging probes, consisting of different combinations of antibody domains, labeled them with the near-infrared fluorescent dye IRDye800CW, and evaluated their in vivo imaging properties. Antibody-based imaging probes were based on an anti-HER3 antigen binding fragment (Fab) isolated using phage display.
Methods: We constructed six anti-HER3 antibody-based imaging probes: a single chain variable fragment (scFv), Fab, diabody, scFv-CH3, scFv-Fc, and IgG. IRDye800CW-labeled, antibody-based probes were injected into nude mice bearing FaDu xenografts and their distribution to the xenograft, liver, and kidneys was evaluated.
Results: These imaging probes bound to recombinant HER3 and to the HER3-positive cell line, FaDu. Small antibody fragments with molecular weight <60 kDa (scFv, diabody, and Fab) accumulated rapidly in the xenograft (maximum accumulation between 2-4 h post injection (hpi)) and cleared primarily through the kidneys. scFv-CH3 (80 kDa) had fast clearance and peaked in the xenograft between 2-3 hpi and cleared from xenograft in a rate comparable to Fab and diabody. IgG and scFv-Fc persisted in the xenografts for up to 72 hpi and distributed mainly to the xenograft and liver. The highest xenograft fluorescence signals were observed with IgG and scFv-Fc imaging probes and persisted for 2-3 days.
Conclusion: These results highlight the utility of using antibody fragments to optimize clearance, tumor labeling, and biodistribution properties for developing anti-HER3 probes for image-guided surgery or PET imaging.
Keywords: antibody fragments, near-infrared fluorescence imaging, HER3, ErbB3, IRDye800CW
Introduction
Antibodies are a well-established class of biologic affinity reagents with a range of therapeutic applications against cancer, and infectious and inflammatory diseases [1]. The selective, high affinity binding of antibodies to their targets makes them attractive as nuclear or image-guided surgery probes upon conjugation to a radioisotope [2] or a near infrared (NIR) fluorescent dye [3], respectively. Antibodies have a long circulation time due to the interaction of their crystallizable fragment (Fc) with the neonatal Fc receptor (FcRn) on endothelial cells and pH-dependent recycling of antibodies back to circulation [4,5]. This long circulation time makes antibodies optimally-suited for therapeutic applications. Labeling a therapeutic antibody allows real-time tracking of its biodistribution, which can be used to predict therapeutic response. For example, objective responses to trastuzumab therapy were reported in patients who showed intense tumor uptake of 111In-trastuzumab [6], and 89Zr-lumretuzumab was used to determine biodistribution in patients before and after receiving a pharmacodynamic-active unlabeled lumretuzumab dose [7]. Using antibodies for imaging applications often requires probes with faster clearance and tissue penetration to increase imaging contrast. Extensive research on antibody structure and function has provided a wealth of knowledge on how to engineer antibodies with unique properties that are more suitable for imaging applications [8]. Antibodies can be re-engineered into various-sized fragments with or without the Fc domain to overcome some of the limitations in using them as imaging probes. Antibody fragments that lack an Fc domain have shorter blood circulation times and avoid the Fc-mediated immune effector function [9]. Antibody size can be reduced to promote clearance through the kidney [10] and to increase tissue penetration in solid tumors [9]. Computational studies comparing tumor uptake of sets of antibody fragments show a complex relationship between antibody fragment size and tumor targeting where fragments ~25 kDa have the lowest tumor uptake, with smaller and larger fragments having higher tumor uptake [11]. Several groups have shown similar results experimentally for small sets of different-sized fragments [12-20].
A number of studies have been published that directly compare specific antibody fragments. Fabs have been compared to IgGs, showing that Fabs have lower binding affinity and faster blood clearance [12-14]. Monovalent single-chain variable fragments (scFvs) have been compared to the bivalent diabody; results indicated that the increased valency results in higher avidity and tumor localization [15-17]. The diabody has been compared to the bivalent scFv-CH3, in these studies both antibody fragments accumulated in xenografts with scFv-CH3 giving higher tumor signal than the diabody [18,19]. scFv-Fc with a mutated Fc domain that facilitates rapid clearance relative to scFv-Fc has been compared to scFv-CH3 and the mutated scFv-Fc showed improved tumor targeting and less kidney distribution [20].
Here, we examined the effect of size, valency, and the presence of an Fc domain on tumor accumulation and imaging parameters using a set of six anti-human epidermal growth factor receptor 3 (HER3) antibody-derived imaging probes. HER3 overexpression is correlated with poor survival of patients with solid tumors [21], particularly in gastric cancer [22], colorectal cancer [23], ovarian cancer [24], and non-small cell lung carcinomas [25]. HER2/HER3 heterodimer is associated with resistance to anti-HER2 therapies [26,27]. HER3 imaging probes are needed for detecting HER3 expression, detecting resistance to anti-HER2 therapeutics, identifying patients eligible for combination therapy of HER receptor inhibitors, and predicting patient survival.
Currently there are no HER3 imaging probes in the clinic. A few imaging probes are under development and are at various stages of pre-clinical research or clinical trials. A phase one clinical trial has concluded for GSK2849330, an anti-HER3 monoclonal antibody, labeled with 89Zr to investigate its biodistribution in patients with HER3-positive solid tumors using positron emission tomography (PET) scans (NCT02345174) [28]. Similarly, the biodistribution of 89Zr-labeled lumretuzumab (RG7116, RO5479599), a glycoengineered antibody against HER3, has been tested in patients with metastatic and/or locally advanced malignant HER3-expressing solid tumors of epithelial origin by PET scans (NCT01482377) [7]. A phase one clinical trial of patritumab (U3-1287), an anti-HER3 monoclonal antibody, conjugated to 64Cu-DOTA in subjects with advanced solid tumors had to be terminated due to relatively low tumor uptake (NCT01479023) [29]. Pre-clinical studies are ongoing to develop anti-HER3 imaging probes, including 89Zr-labeled Mab#58, which shows accumulation in xenografts expressing HER3 in mice [30]. These HER3 imaging probes in preclinical studies or in clinical trials use antibodies, which suffer from the imaging limitations described above.
Several smaller antibody fragments are being developed for imaging HER3. An anti-HER3 99mTc-labeled affibody shows some accumulation in colorectal carcinoma LS174T xenografts expressing HER3 [31]. 68Ga-labeled anti-HER3 affibody shows some xenograft accumulation at early time points in mice bearing BT474 breast cancer xenografts [32]. An anti-HER3 affibody labeled with aluminum 18F shows accumulation in HER3-expressing MCF-7 breast cancer xenografts in mice at 1 hour post injection (hpi) [33]. Affibodies tend to accumulate in xenografts at very early time points (1-3 hpi) when the kidney excretion is at its maximum (at least twenty-fold higher percent injected dose per gram (%ID/g) in kidneys compared to xenograft). Additionally, the %ID/g that accumulates in xenografts is usually less than 5%ID/g [31-33].
To address the current lack of HER3 imaging probes in the clinic and the limited variety of imaging probes at the preclinical stage, we engineered an anti-HER3 Fab [34] into the following five antibody-based imaging probes of varying sizes: scFv (26.4 kDa), diabody (51.6 kDa), scFv-CH3 (80.2 kDa), scFv-Fc (105.0 kDa), and IgG (150.6 kDa). We carried out a direct comparison of these fragments as fluorescent imaging probes for HER3-expressing xenografts. We labeled antibody fragments with NIR IRDye800CW and compared their biodistribution in mice bearing HER3-expressing xenografts. The results suggest that antibody fragments can be engineered with properties tailored for image-guided surgery and PET/SPECT imaging.
Methods
Conversion of Anti-HER3 Fab to scFv
To assemble the variable domains of the anti-HER3 Fab [34] into antibody fragments, we used the Gene Splicing by Overlap Extension or “gene SOEing” polymerase chain reaction (PCR) method [35]. Anti-HER3 VL and VH genes were PCR-amplified and assembled by gene SOEing to produce an scFv with a 15 amino acid linker (GGGGS)3 [36] in the VL-VH orientation. To produce the diabody fragment, we used a short 5 amino acid linker (GGGGS) between the VL and VH domains [37]. scFv and diabody were cloned into pCW-LIC vector for bacterial expression under the influence of upstream StII (heat-stable enterotoxin 2) secretion sequence [38].
Expression and purification of Anti-HER3 Fab, scFv and diabody
pCW-LIC vectors expressing anti-HER3 Fab, scFv, and diabody were transformed into BL21 (DE3) E. coli by electroporation. Anti-HER3 Fab, scFv, and diabody were expressed and purified as described previously [34]. Purified antibody fragments were sterilized by filtration through a 0.22 μm sterile syringe filter and stored at 4 °C for short-term storage or at -80 °C for long term storage. Antibody fragment concentration was quantified by measuring absorbance at 280 nm and verified using the BCA protein assay kit (Pierce, Rockford, IL). The extinction coefficient was determined using the Expasy protparam tool available on the web (www.expasy.org/tools/protparam.html). Amino acid sequences of antibody fragments are listed in Table S1.
Conversion of Anti-HER3 scFv to scFv-Fc, scFv-CH3, and IgG
The CH3 domain with hinge region (CH3-hinge) or CH3-CH2-hinge (Fc) from human IgG1 were PCR amplified from pFUSEss-CHIg-hG1 mammalian expression vector (InvivoGen, San Diego, CA) using primers that contain overlapping sequences with anti-HER3 scFv and then assembled into scFv-CH3 or scFv-Fc using gene SOEing [35]. Amplicons were cloned into pFUSEss-CHIg-hG1 vector digested with EcoRI and Nsi (Thermo Fisher Scientific) using Gibson Assembly™ master mix (New England Biolabs, Inc., Ipswich, MA). Anti-HER3 IgG1 expression vector was constructed by PCR amplifying VH and VL sequences and cloning them into EcoRI/NheI and EcoRI/BsiWI restriction sites in pFUSEss-CHIg-hG1 and pFUSE2ss-CLIg-hk (InvivoGen, San Diego, CA), respectively using Gibson Assembly™ protocol.
Expression and purification of Anti-HER3 scFv-CH3, scFv-Fc, and IgG1
Expi293F cells (Life Technologies Corporation, Carlsbad, CA) were cultured in Expi293 Expression Medium (Life Technologies Corporation, Grand Island, NY). Expi293F cells were transfected using an Expifectamine 293 Transfection kit (Gibco, Carlsbad, CA), following the manufacturer's protocol. Cells were cultured for 5 days after transfection by shaking at 250 rpm in a 37 °C incubator with 8% CO2. IgG and antibody fragments were harvested from supernatant by centrifugation at 3,000 ×g for 20 min and filtered using a 0.45 μm filter. scFv-CH3 was purified using GE Healthcare AKTA FPLC system with HiTrap Protein L column (GE healthcare, Sweden). scFv-Fc and IgG1 were purified using HiTrap MabSelect SuRe column (GE healthcare, Sweden). Further purification was performed as described for antibody fragments expressed in E. Coli. Protein sequences of antibody fragments are listed in Table S1.
Capillary electrophoresis analysis of Anti-HER3 IgG and antibody fragments
Chip-based capillary electrophoresis-sodium-dodecyl sulfate (CE-SDS) analysis was used to analyze purified fragments using the Agilent 2100 Bioanalyzer with the Agilent High Sensitivity Protein 250 Kit (cat # 5067-1575) under reducing conditions. Samples were diluted to 1 mg/mL and analyzed following the manufacturer's protocol. The size and relative peak area were calculated using Agilent 2100 Expert software.
Binding kinetics of Anti-HER3 IgG and antibody fragments to recombinant HER3
Binding kinetics were measured using an Octet Red instrument (ForteBio, Menlo Park, CA), following the manufacturer's protocol. Binding assays were performed in 96-well microtiter plates at 30 °C with sample plate orbital motion agitation at 1000 rpm. All washes, dilutions, and measurements were performed in phosphate buffered saline (PBS), pH 7.4. The IgG and antibody fragments were immobilized on amine-reactive second generation (AR2G) sensors using the manufacturer's protocol at pH 5 followed by quenching with 1 M ethanolamine, pH 8.5. Recombinant human HER3-Fc chimera protein target (R&D Systems, Minneapolis, MN) was serially diluted between 10-263 nM in PBS and placed in different wells. Binding was monitored by placing sensors into wells for 5 min, followed by dissociation in PBS for 10 min. KD, kON, and kOFF were determined with ForteBio Data Analysis software v7.1.0.33 through locally fitting the processed data using a 1:1 binding model.
Labeling of IgG and antibody fragments
Antibody fragments were labeled with IRDye800CW-NHS (LI-COR Biosciences, Lincoln, NE), following the manufacturer's protocol. Briefly, the IgG and antibody fragments in PBS, pH 7.4 were mixed with 5-fold molar excess of IRDye800CW-NHS in DMSO and reacted for 2 h at 20 °C, followed by overnight incubation at 4 °C protected from light. Excess unbound dye was removed using Zeba Spin Desalting Columns, 5 mL, 7k MWCO (Thermo Scientific). After the free dye was removed, the dye to protein ratio was determined by measuring the labeled protein absorbance in PBS at 280 nm and 774 nm as per the manufacturer's recommendation [39]. Samples were sterilized by filtration and stored protected from light at 4 °C for short-term storage or at -80 °C for long-term storage.
Cell lines
The HER3-positive human hypopharyngeal squamous cell carcinoma FaDu cell line (ATCC #HTB-43) was propagated by serial passage in MEM/EBSS medium (HyClone Laboratories, Logan UT) supplemented with 10% fetal bovine serum. Trastuzumab-resistant human breast cancer cell line (TrR1) derived from MDA-MB-231 that stably expresses HER2 was obtained from Dr. Robert Kerbel, Sunnybrook and Women's College Health Sciences Centre in Toronto, Ontario, Canada [40]. TrR1 cells were cultured in Dulbecco's minimal essential medium (DMEM) supplemented with 10% fetal bovine serum (Sigma-Aldrich). Both cell lines were grown at 37 °C in a humidified atmosphere of 5% CO2.
Flow cytometry
The binding affinity of labeled anti-HER3 IgG and antibody fragments to FaDu cells was determined by flow cytometry. 1×10⁵ FaDu cells were incubated with IRDye800CW-labeled IgG or antibody fragments at a concentration of 0.5 µM for 60 min at room temperature, protected from light, followed by three washes with ice-cold PBS, pH 7.4. FaDu cells were then analyzed using a Gallios flow cytometer (Beckman Coulter, Inc.) using Ex 640 nm and Em 745-825 nm (FL8). Live cells were gated on forward and side scatter and 10,000 viable cells were analyzed. IRDye800CW-labeled control IgG or antibody fragments generated against the unrelated maltose-binding protein (MBP) were tested on FaDu cells at 0.1, 0.3, and 1 µM concentrations to confirm that IgG and antibody fragment do not nonspecifically accumulate in the xenograft and to monitor biodistribution. Binding of IRDye800CW-labeled anti-HER3 IgG, Fab, diabody, and scFv-Fc was measured on TrR1 cells (HER3-negative) at 0.1, 0.3, and 1 µM concentrations as a cell line negative control. Flow cytometry data were analyzed using FlowJo software, V10.1 (FlowJo, LLC).
In vivo animal imaging
All animals used in imaging experiments were cared for and maintained under the supervision and guidelines of the University of Saskatchewan Animal Care Committee. Female CD-1 nude mice were obtained from Charles River Canada (St-Constant, Quebec, Canada) at 4 weeks of age and housed in a 12 h light, 12 h dark cycle in a temperature and humidity controlled vivarium. Animals had ad libitum access to mouse diet (Lab Diet, St. Louis, Missouri) and water. After one week of acclimatization, mice were subcutaneously injected with a suspension of 107 FaDu or TrR1 cells in 100 μL of a 1:1 mixture of serum-free medium and Matrigel matrix basement membrane (Discovery Laboware, Inc. Bedford, MA) at the hind limb of each mouse. Tumor growth was followed by measuring the greatest length and the greatest width of each tumor using an external caliper. Then, tumor volume was calculated using the formula: tumor volume = length × width2 × 0.5 [41]. When xenografts measured 150-300 mm3 in volume, each mouse was injected intravenously with 0.5 nmol of labeled anti-HER3 or control IgG or antibody fragment through the tail vein. Mice were anesthetized with 2.5% isoflurane and imaged at 1, 2, 3, 4, 6, 24, 48, 72 hpi and up to 168 hpi for scFv-Fc and IgG using the Pearl Impulse Imager (LI-COR). The excitation/emission settings were 785/820 nm. The fluorescence signal was overlaid with the white light image captured by a CCD camera of the imager. Images were analyzed using Image Studio Software (version 3.1). Regions of interest (ROI) for xenografts, liver, kidneys, contralateral side and muscle background were selected from equivalent-sized areas containing the same number of pixels. Three ROIs were quantified per organ for each mouse and three mice were imaged per fragment. Antibody fragments raised against maltose-binding protein and labeled with IRDye800CW served as non-specific control in the imaging experiments.
Statistical analysis
To compare mean fluorescence intensity in different organs we used two-way analysis of variance (ANOVA) with multiple comparisons using Prism6 version 6. All error bars are standard error of the mean (sem) unless otherwise noted.
Results
Expression and purification of anti-HER3 antibody fragments
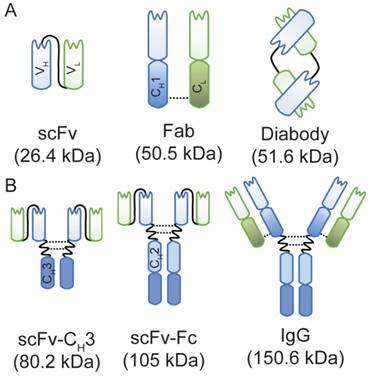
We previously developed an anti-HER3 Fab using phage display and showed that it binds human HER3 both in vitro and in vivo [34]. Using this anti-HER3 Fab, we designed an additional four anti-HER3 antibody fragments and an IgG. These were expressed and purified in either E. coli BL21 (DE3) (Figure 1A) or in mammalian Expi293F cells (Figure 1B). The size and integrity of the IgG and antibody fragments were confirmed using capillary electrophoresis (Figure S1). Yields for small fragments expressed in E. coli ranged from 2 mg/L for diabody to 5 mg/L for scFv and Fab. Mammalian cell expression of larger fragments from one plasmid yielded 39 mg/L and 49 mg/L of scFv-CH3 and scFv-Fc, respectively. Expression of IgG from co-transfection with two plasmids resulted in a lower yield of 4 mg/L. Fragments were obtained with purities ranging from 75-96% (Figure S1).
A schematic representation of anti-HER3 IgG and antibody fragments with their calculated molecular weights. (A) Anti-HER3 antibody fragments expressed in bacteria (scFv, Fab, and diabody). (B) Anti-HER3 IgG and fragments expressed in mammalian cells (scFv-CH3, scFv-Fc, and IgG). CH1, constant heavy domain 1; CH2, constant heavy domain 2; CH3, constant heavy domain 3; CL, constant light domain; VH, variable heavy domain; VL, variable light domain, dotted line indicates disulphide bond.
Affinity of anti-HER3 antibody fragments to recombinant HER3
We used biolayer interferometry to measure the binding of the IgG and antibody fragments to recombinant human HER3 (Figure S2A). The dissociation constants (KD) decreased as the valency of fragments increased for scFv fragments (scFv (20 nM) > diabody (3.0 nM) > scFv-Fc (0.6 nM) > scFv-CH3 (0.5 nM)) and for the Fab versus IgG (Fab (3.5 nM) > IgG (0.3 nM)) (Table 1). The monovalent Fab bound stronger than the monovalent scFv due to a higher off rate (kOFF) for the scFv, suggesting the scFv structure was less stable. The diabody bound weaker than other divalent fragments and its KD was similar to the Fab, suggesting scFv moiety binding was not stable or that scFv was not oriented optimally to simultaneously engage recombinant HER3. Bivalent scFv-CH3, scFv-Fc, and IgG bound similarly with subnanomolar KD. The anti-HER3 IgG preferentially bound human HER3 with 100-fold higher affinity over murine HER3 (Figure S2B and Table 1).
Anti-HER3 IgG and antibody fragments binding kinetics.
| Antibody Format | Valency | Average Expression Yield (mg/L) | Average KD (nM) | Average kON (×104 M-1 s-1) | Average kOFF (×10-4 s-1) | Average KD of IRDye800CW -labeled antibody (nM) |
|---|---|---|---|---|---|---|
| scFv | Monovalent | 5 | 20 ± 1.4 | 3.3 ± 0.1 | 5.4 ± 0.3 | 29 ± 3.7 |
| Fab | Monovalent | 5 | 3.5 ± 0.1 | 4.9 ± 0.1 | 1.7 ± 0.1 | 3.2 ± 0.1 |
| diabody | Bivalent | 2 | 3.0 ± 0.2 | 15 ± 0.1 | 4.4 ± 0.3 | 2.4 ± 0.2 |
| scFv-CH3 | Bivalent | 39 | 0.5 ± 0.1 | 9.6 ± 0.1 | 0.5 ± 0.1 | 2.1 ± 0.1 |
| scFv-Fc | Bivalent | 49 | 0.6 ± 0.1 | 7.8 ± 0.2 | 0.5 ± 0.1 | 0.9 ± 0.1 |
| IgG | Bivalent | 4 | 0.3 ± 0.1 (31.8 ± 0.5)* | 2.6 ± 0.1 (0.5 ± 0.1)* | 0.10 ± 0.01 (1.7 ± 0.1)* | 0.5 ± 0.1 |
* Anti-HER3 IgG binding kinetics to murine HER3
Binding of anti-HER3 antibody fragments to FaDu and TrR1 cell lines
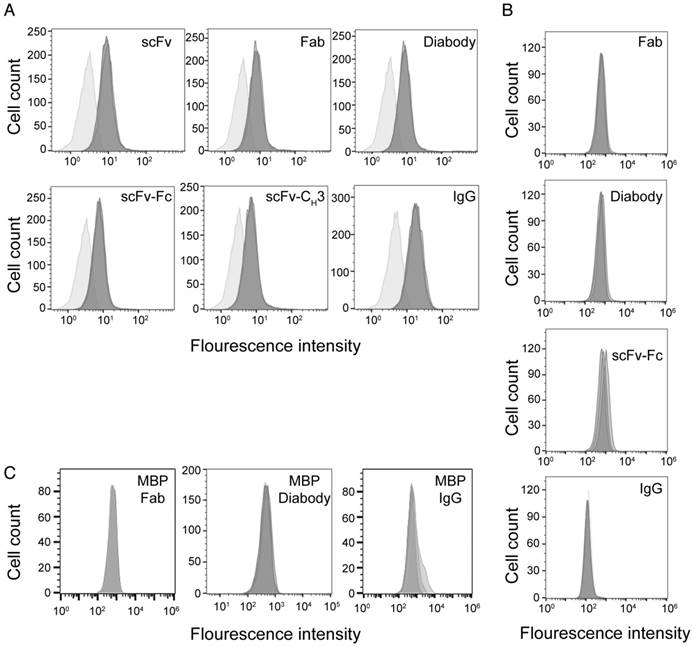
We used flow cytometry to measure the binding of anti-HER3 IgG and antibody fragments to endogenous HER3 expressed on FaDu cells, a model of squamous cell carcinoma of the head and neck that expresses HER3 [42,43]. IgG and antibody fragments were labeled with IRDye800CW, which has an absorption maximum of 774 nm and an emission maximum of 789 nm. We labeled antibody fragments at a ratio between 1-2 IRDye800CW molecules per antibody fragment. Labeling the IgG and antibody fragments with IRDye800CW had little effect on their KD (Table 1). The KD of scFv-CH3 was affected the most, increasing from 0.5 to 2.1 nM. We measured binding of antibody fragments to FaDu cells at a concentration of 0.5 µM (Figure 2A). At this saturating concentration, all antibody fragments bound similarly to FaDu cells. Anti-HER3 IgG and fragments (Fab, diabody, and scFv-Fc) did not bind to HER3-negative TrR1 cells (Figure 2B). A control IgG and antibody fragments generated against maltose-binding protein and labeled with IRDye800CW at a ratio 1.1-2.0 molecules per protein did not significantly bind FaDu cells (Figure 2C).
Binding of anti-HER3 and anti-MBP probes to cell-lines. (A) Flow cytometry histograms showing the binding of anti-HER3 scFv, Fab, diabody, scFv-CH3, scFv-Fc, and IgG to FaDu cells. Light gray: unstained FaDu cells. Dark gray: FaDu cells stained with 0.5 µM (in triplicate) of IgG or antibody fragments labeled with IRDye800CW. (B) Flow cytometry histograms showing the binding of anti-HER3 Fab, diabody, scFv-Fc, and IgG to TrR1 cell line. Dark gray histogram: unstained TrR1 cells. Light gray: TrR1 cells stained with 0.1, 0.3, and 1 µM of anti-HER3 IgG or antibody fragments labeled with IRDye800CW. (C) Flow cytometry histograms showing the binding of anti-MBP control Fab, diabody, and IgG to FaDu cells. Dark gray: unstained FaDu cells. Light gray: FaDu cells stained with 0.1, 0.3, and 1 µM of IgG or antibody fragments labeled with IRDye800CW.
Fluorescence imaging of anti-HER3 antibody fragments in xenograft-bearing mice
We evaluated the effectiveness of anti-HER3 antibody fragments as fluorescent imaging probes for HER3-positive FaDu xenografts. We imaged mice injected with IRDye800CW-labeled IgG or antibody fragments intravenously at different time points (Figure 3A). Antibody fragments accumulated in xenografts at early time points with scFv and scFv-CH3 fragments showing faster clearance of background fluorescence, allowing visualization of the xenografts at 4 hpi. The scFv fragment showed high clearance through the kidneys as early as 1 hpi. By 6 hpi the fluorescence of the scFv fragment started clearing from the xenograft. Xenografts were detectable at 6 hpi with diabody, Fab, and scFv-CH3 fragments. At 24 hpi, diabody, Fab, scFv-CH3, scFv-Fc, and IgG showed accumulation in xenografts with minimal background fluorescence. By 72 hpi antibody fragments with molecular weight less than 100 kDa were mostly cleared from mice. The fluorescence of larger anti-HER3 imaging probes (scFv-Fc and IgG) persisted in xenografts up to 72 hpi. By 72 hpi no significant fluorescence was observed in liver or kidneys for the IgG or antibody fragments.
Near-infrared imaging of the anti-HER-IRDye800CW probes to murine xenograft models. Representative near-infrared posterior whole-body images merged with white light images of CD-1 nude mice bearing subcutaneous xenografts (right hind flank) at 4, 6, 24, and 72 h post-intravenous injection with 0.5 nmol of imaging probe. (A) HER3+ (FaDu) xenografts imaged with anti-HER3 scFv, Fab, diabody, scFv-CH3, scFv-Fc, and IgG labeled with IRDye800CW, or (B) HER3+ (FaDu) xenografts imaged with control anti-MBP Fab, diabody, and IgG. (C) HER3- (TrR1) xenografts imaged with anti-HER3 Fab, diabody, scFv-Fc, and IgG labeled with IRDye800CW. The fluorescence scale is shown on the right of the images. Xenografts are indicated with white arrows and kidneys (K) and background forelimb muscle (B) are indicated with arrow heads. Contralateral site (C) is indicated with dotted circles.
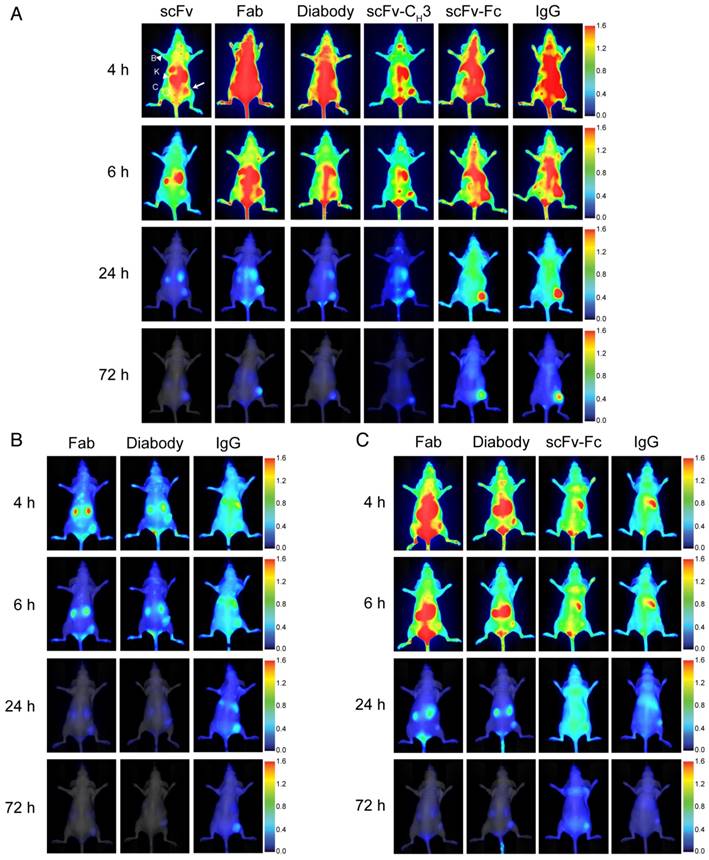
To confirm that the accumulation of the anti-HER3 IgG and antibody fragments in FaDu xenografts was selective, we imaged an IgG and two control antibody fragments generated against the unrelated maltose-binding protein (MBP) that did not bind HER3 (Figure 3B). We used anti-MBP Fab as a model for the small monovalent fragments (scFv, Fab), anti-MBP diabody as a model for the bivalent fragments that lacked the Fc domain (diabody and scFv-CH3), and anti-MBP IgG as model for the large fragments containing an Fc (scFv-Fc and IgG). Two small, anti-MBP antibody fragments were rapidly cleared from the mice through kidneys with minimal xenograft fluorescence at 6 hpi and no fluorescence at 24 hpi (Figure 3B). Fluorescence intensities of anti-HER3 scFv and Fab in xenografts were significantly higher than those of anti-MBP Fab at 4 and 6 hpi, while anti-HER3 diabody and scFv-CH3 fluorescence intensities were higher than that of the anti-MBP diabody at 4 and 6 hpi (p value <0.01) (Figure S3-S4). Anti-MBP IgG took longer to distribute and cleared from the mice at a slower rate, mainly through the liver. By 24 hpi there was low fluorescence in the FaDu xenografts (Figure 3B) in contrast to the significantly higher fluorescence observed with anti-HER3 IgG and scFv-Fc (p value <0.05) (Figure S5).
We imaged the anti-HER3 Fab, diabody, scFv-Fc and IgG in mice bearing a control HER3-negative TrR1 xenograft (Figure 3C), which showed no binding to these imaging probes by flow cytometry (Figure 2B) [34]. These imaging probes were of interest to us because they showed higher fluorescence signal in the HER3-positive xenografts than their size-equivalent anti-MBP control (Figure 3C). There was negligible accumulation of anti-HER3 IgG and antibody fragments in the control TrR1 xenografts (Figure 3C).
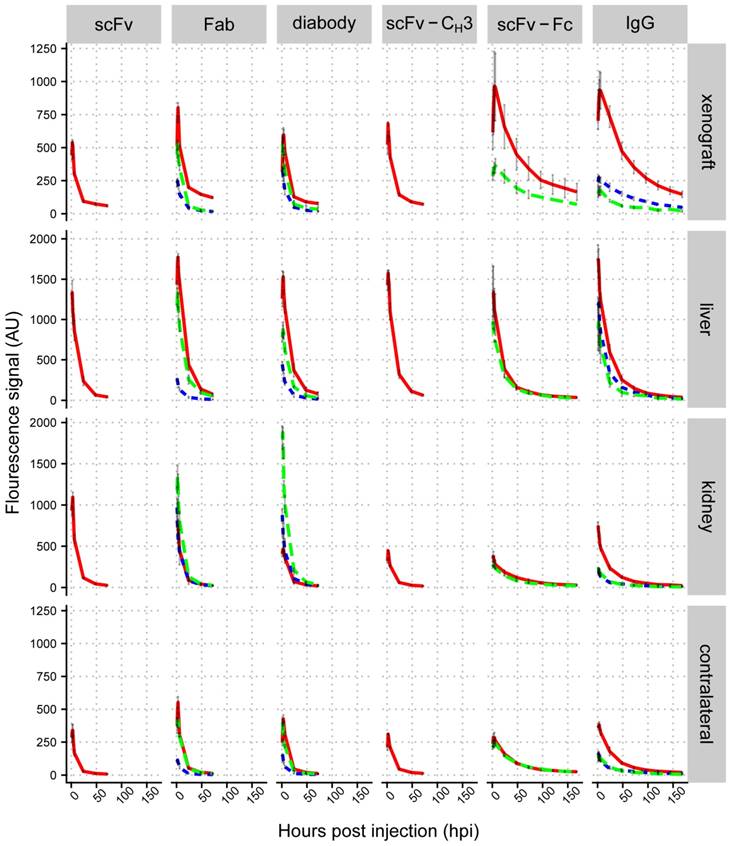
We compared the accumulation of IgG and antibody fragments in liver, kidneys, and xenografts. Liver fluorescence was quantified using ventral images of mice. Xenograft and kidney fluorescence was quantified from dorsal images of mice. We plotted mean fluorescence intensities in different organs against imaging time points (Figure 4 and Figure S3-S7), which showed that the highest fluorescence intensity in xenografts was observed with scFv-Fc and IgG, which peaked between 4-6 hpi (Figure 5A). The fluorescence intensity of the Fab and diabody peaked around 3-4 hpi, but had lower intensity than the IgG and scFv-Fc. The fluorescence of the scFv and scFv-CH3 peaked between 2-3 hpi. The anti-HER3 IgG and antibody fragments had high initial liver fluorescence that cleared within 24 hpi. IgG and larger antibody fragments (scFv-CH3 and larger) primarily clear through the liver [20], consistent with the observed liver accumulation for the anti-HER3 and anti-MBP IgGs and larger antibody fragments. Surprisingly, smaller anti-HER3 antibody fragments (scFv, Fab, diabody) showed accumulation in the liver even though they were expected to clear through the kidney [49, 50-52]. Mice have been previously shown to have HER3 expression in the liver [53], and the anti-HER3 IgG was found to bind recombinant mouse HER3 (Figure S2B), but with a higher KD than with human HER3 (31.8 nM versus 0.3 nM). Together, this suggested that the liver accumulation, particularly for small fragments, was due to endogenous HER3 expression in the liver. Capillary electrophoresis did not show any significant aggregation of labeled small anti-HER3 fragments, excluding the possibility that liver accumulation was due to higher molecular weight aggregates (data not shown). In support of this, we observed that at 6 and 24 hpi, the anti-HER3 Fab peaked at >1500 fluorescence arbitrary units (AU) in the liver, whereas the anti-MBP Fab peaked at ~250 AU and the anti-HER3 diabody peaked around 1500 AU and the anti-MBP diabody peaked around 500 AU (Figure 4). In contrast, the kidney distribution was dependent on the molecular weight of the fragment. scFv, diabody, and Fab had high kidney fluorescence, most likely due to kidney excretion of these fragments through filtration. The scFv-CH3, scFv-Fc, and IgG had minimal kidney fluorescence due to their higher molecular weights, which were above the renal molecular weight cut-off. Control small fragments, Fab and diabody, were mainly excreted through kidneys with low liver accumulation. The control IgG localized mainly to the liver with minimal kidney fluorescence.
Biodistribution analysis of IRDye800CW-labeled IgG and antibody fragments in mice bearing FaDu xenografts. Mean fluorescence signal (arbitrary units) for control anti-MBP Fab, diabody, and IgG in HER3+ (FaDu) xenograft (dotted blue lines), anti-HER3 scFv, Fab, diabody, scFv-CH3, scFv-Fc, and IgG in HER3+ (FaDu) xenograft (solid red lines), and HER3- (TrR1) xenograft (dashed green lines) in liver, kidney, and contralateral site. Data are the average from three mice and error bars represent standard error of the mean.
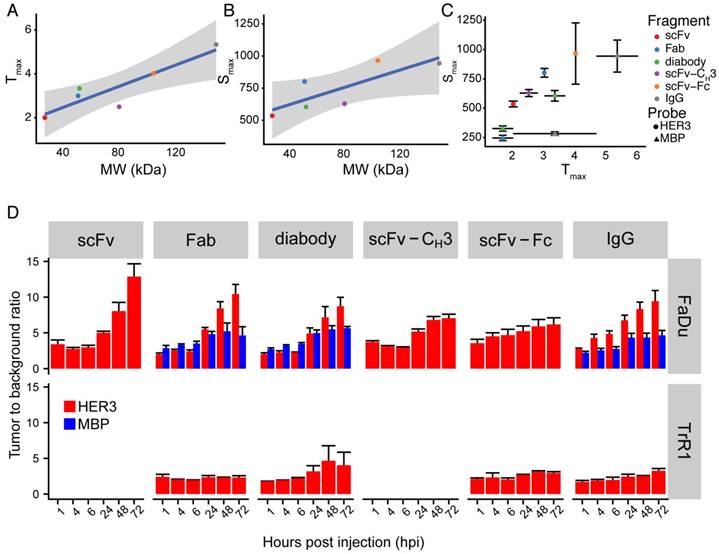
Summary of IRDye800CW-labeled IgG and antibody fragments imaging parameters. (A) Anti-HER3 IgG and antibody fragments time to reach maximum fluorescence signal in FaDu xenograft (Tmax, Y-axis), against molecular weight of the IgG and antibody fragments (MW, kDa, X-axis). (B) Anti-HER3 IgG and antibody fragments value of maximum fluorescence signal in FaDu xenograft (Smax, Y-axis), against molecular weight of the IgG and antibody fragments (MW, kDa, X-axis). Straight line is linear fitting of data points and gray zone represents 95% confidence interval of fitting. (C) The maximum fluorescence signal (Smax) in FaDu xenografts at the maximum time (Tmax) post injection of anti-HER3 IgG and antibody fragments and control anti-MBP antibody fragments labeled with IRDye800CW. (D) Tumor to background ratio of xenograft signal compared to mouse forelimb muscle signal at 1, 4, 6, 24, 48 and 72 h post-intravenous injection of 0.5 nmol of anti-HER3 or anti-MBP probe in HER3+ (FaDu) or HER3- (TrR1) xenografts. Error bars represent standard error of the mean.
We measured the fluorescence of a contralateral site on xenografted mice as a proxy measurement for background tissue levels of the IgG and antibody fragments. Anti-HER3 scFv and Fab showed the fastest clearance with contralateral fluorescence values at 24 hpi decreasing to 10% and 14% of their initial values at 1 hpi, respectively. They were followed by diabody and scFv-CH3, which decreased to 19% and 21%, respectively over the same period. On the other hand, scFv-Fc and IgG fluorescence in the contralateral site decreased to 67% and 50% respectively, and their contralateral fluorescence did not differ significantly (p value >0.05) (Figure S8). By 24 hpi the fluorescence intensities of anti-HER3 scFv-Fc and IgG in the contralateral site were at least triple those of scFv, diabody, Fab, and scFv-CH3 (p value <0.01), indicating slower clearance of scFv-Fc and IgG compared to antibody fragments lacking the Fc domain (Figure 4).
The fluorescence accumulation of the anti-HER3 fragments was also measured in a control TrR1 xenograft (Figure 4). The fluorescence signal in the TrR1 xenograft was lower than the signal in the FaDu xenograft at all time points (except the diabody at 1 hpi was slightly higher in the TrR1 xenograft). The anti-HER3 antibody fragments had similar kidney and liver distribution in mice bearing either FaDu or TrR1 xenografts (Figure 4).
There was a direct proportional correlation between size and time to reach maximum signal in the xenograft (Figure 5A) with a Pearson correlation of 0.90. Similarly, the Pearson correlation between the size of anti-HER3 IgG or antibody fragments and the maximum signal reached in the xenograft was 0.80 (Figure 5B). The anti-MBP diabody and Fab reached a maximum of less than 350 AU in less than 2 hpi, while the anti-MBP IgG maximum signal (<300 AU) was reached in less than 4 hpi (Figure 5C). The smallest antibody fragment, anti-HER3 scFv, reached a maximum signal >500 AU at 2 hpi, while anti-HER3 Fab, diabody, and scFv-CH3 all reached signals >600 AU between 2.5-3.5 hpi. Larger IgG and scFv-Fc reached signals >900 AU at 4.5 and 5.5 hpi, respectively.
Tumor to background ratio (TBR) was calculated for anti-HER3 imaging probes and non-specific anti-MBP probes using the mouse forelimb muscle fluorescence signal as background. In FaDu xenografts, the TBR of the anti-HER3 IgG and antibody fragment imaging probes was 5 or greater at 24 hpi and further increased up to 72 hpi (Figure 5D). By 72 hpi, anti-HER3 scFv and Fab fragments showed the highest TBR; however, the xenograft fluorescence signal of these imaging probes at 72 hpi was low (60-120 AU). In contrast, anti-HER3 scFv-Fc and IgG imaging probes had TBRs greater than 6 and 9, respectively, and had higher fluorescence signals of ~350 AU. Anti-MBP Fab and diabody had comparable TBRs to their anti-HER3 counterparts up to 24 hpi, but at 48 and 72 hpi TBRs were significantly higher for anti-HER3 probes. Despite comparable TBRs of non-specific tracers signal intensities were significantly higher for anti-HER3 probes at these early time points (Figure S3-S4). The signal for anti-MBP probes steadily decreased in the xenograft in contrast to anti-HER3 probes, which showed accumulation at the early time points followed by clearance later (Figure S3-S4). This fast clearance of the anti-MBP probes resulted in very low background signals, which gave high TBRs values even with the low fluorescence signal of these probes in xenografts, making them unsuited for imaging. The anti-HER3 IgG had higher TBRs than the non-specific anti-MBP IgG at all time points and anti-MBP IgG TBRs were below 5 at all time points. The TBR was calculated for Fab, diabody, scFv-Fc, and IgG imaging probes in HER3-negative TrR1 xenografts. For these imaging probes, TBRs remained less than 5. The TBR for the Fab imaging probe was significantly higher in FaDu xenografts compared to TrR1 xenografts at 24, 48, and 72 hpi (p values < 0.05, <0.0001, <0.0001, respectively). The TBR of the diabody and the scFv-Fc were significantly higher in FaDu xenografts compared to TrR1 xenografts at 72 hpi (p value < 0.05). The TBR of the IgG was significantly higher at 6, 24, 48, and 72 hpi (p values <0.05, <0.001, <0.0001, and <0.0001, respectively).
Discussion
We compared an IgG and five antibody fragments targeting human HER3 as optical imaging probes for HER3-expressing xenografts. Antibody fragments ranged in molecular weight from 25 kDa to 150 kDa and had either monovalent binding (scFv, and Fab) or bivalent binding (diabody, scFv-CH3, scFv-Fc, and IgG). Two fragments tested had an Fc domain (scFv-Fc and IgG), while one fragment had the CH3 domain of the Fc (scFv-CH3). IgG and antibody fragments were labeled with IRDye800CW, which is an ideal fluorescent dye for in vivo imaging as it avoids interference caused by the natural background fluorescence of tissues [44].
We analyzed the effect of valency on binding to recombinant HER3 and observed that the bivalent fragments bound stronger to HER3, which was consistent with increased avidity seen previously with diabody and IgGs relative to the scFv and Fab [45]. The monovalent scFv bound weaker to HER3 relative to the bivalent diabody, scFv-CH3, and scFv-Fc. Similarly, the Fab bound weaker than the IgG. The major difference in binding between the monovalent and bivalent fragments was a slower kOFF for bivalent fragments. For the monovalent fragments, the scFv had a higher KD than the Fab, with the scFv having a faster kOFF. In this case, constant domains (CH1, CL) of the Fab may play a role in stabilizing Fab binding to its target [46]. Previous reports suggested that the CH1 domain plays a role in structuring the antigen-binding site into a more kinetically competent form [47]. For the bivalent fragments, the diabody had the highest KD due to its fast kOFF. In this case, the scFv domains in the diabody may not be optimally oriented to engage two HER3 molecules, or the diabody may be less stable than the other bivalent fragments. The anti-HER3 antibody and fragments bound endogenous HER3 expressed on the FaDu cell line equally well at saturating concentrations.
We used mice engrafted with HER3-positive FaDu xenografts to characterize accumulation of the anti-HER3 IgG and antibody fragments. We observed correlations between fragment size and time required to obtain maximum xenograft fluorescence and the intensity of the xenograft fluorescence. Smaller fragments required less time to attain a maximum fluorescence signal in the xenograft and had lower xenograft fluorescence. The exception to these trends was the scFv-CH3 fragment, which had a maximum signal similar to the smaller diabody and required less time to reach its maximum signal. It is possible the scFv-CH3 was not stable in vivo [48] or the lack of a Fc domain caused it to clear similarly to the diabody.
We also compared mice engrafted with HER3-positive FaDu and HER3-negative TrR1 xenografts to characterize liver and kidney biodistribution and body clearance of the anti-HER3 IgG and its fragments. The IgG and antibody fragments accumulated in the liver at early time points. This liver distribution has been reported previously for IgG, scFv-Fc, and scFv-CH3 [20], but was not expected for fragments below 60 kDa as they were below the filtration molecular weight cut-off of the kidneys [49] and scFvs do not generally accumulate in the liver [50-52]. Liver accumulation has been reported previously for a small anti-HER3 affibody and this is proposed to be due to the interaction with endogenous HER3 expression in the liver [53] and this was likely the cause for the observed liver accumulation. Both affibody [53] and anti-HER3 antibody fragments bound murine HER3. In support of this, we did not observe significant accumulation of the anti-MBP control Fab and diabody fragments in the liver, whereas the control anti-MBP IgG showed high levels of liver accumulation.
We observed a correlation between fragment size and kidney accumulation. Smaller anti-HER3 and anti-MBP control antibody fragments with molecular weights below the renal filtration cut-off (scFv, Fab, and diabody) showed high levels of kidney accumulation at early time points. Previous studies have shown that scFvs [50-52], Fabs [54,55] and diabodies [9,52] are primarily cleared through the kidneys. The anti-MBP control IgG, anti-HER3 IgG and larger antibody fragments (scFv-CH3 and scFv-Fc) showed much lower accumulation in the kidneys. For IgGs, the anti-HER3 IgG showed higher initial kidney accumulation than the anti-MBP control IgG and the anti-HER3 scFv-CH3 and scFv-Fc; the reason for this accumulation was not clear. However, PET imaging of patients injected with another anti-HER3 IgG (89Zr-lumretuzumab) also showed high tracer accumulation in kidneys [7].
We measured the fluorescence of a contralateral site to the xenograft as a proxy measurement for background tissue levels of IgG and antibody fragments. We observed that antibody fragments lacking an Fc domain showed faster rates of fluorescence clearance from the contralateral site. The smallest fragments (scFv and Fab) showed the fastest levels of contralateral site clearance followed by the diabody and scFv-CH3. This correlation between the clearance from the contralateral site and the presence of the Fc domain was likely due to the recycling of Fc domain-containing proteins back to the circulation through FcRn receptor [4,5].
Williams et al., previously compared properties of a set of antibody fragments (scFv, diabody, scFv-CH3, F(ab´)2, and IgG) based on an anti-carcinoembryonic antigen IgG and analyzed the imaging figure of merit (IFOM), which determines how rapidly a statistically significant tumor image can be acquired [56]. IFOM values indicated the suitability of diabody antibody fragment for early imaging of xenografts at 3-5 hpi. The scFv-CH3 and F(ab´)2 gave statistically significant tumor images at later time points ranging between 10-20 hpi. IgG was suited for imaging only as time exceeded 36 hpi. The scFv resulted in the lowest IFOM values, showing the unsuitability of using scFvs to image tumors. These results indicated that the diabody, scFv-CH3, and F(ab´)2 were suited for linking to short-lived radionuclides, while IgG was suited for longer-lived radionuclides [56]. This study predicted that smaller fragments would be better for same day imaging and larger fragments for longer imaging for the anti-carcinoembryonic antigen.
We observed that the anti-HER3 IgG and antibody fragments had similar TBRs that increased over time. The absolute fluorescence intensity in the xenograft was higher for the Fc-containing imaging probes (IgG, scFv-Fc), especially at 72 hpi where the TBRs were highest. Thus, for targets like HER3, which have low receptor density [32] on the tumor and endogenous expression in tissues, imaging probes with longer circulation times are needed to provide sufficient time to accumulate at high levels in the tumor and clear from tissues. The larger Fc-containing fragments (IgG, scFv-Fc) have the required longer circulation half-lives and would be suitable for imaging-guided surgery, which is an intraoperative or endoscopic procedure where high fluorescence signal and TBR are desirable for tumor detection and margin delineation, respectively. The larger Fc-containing fragments would also be useful for PET imaging using radionuclides with long half-lives. Smaller antibody fragments would not be suitable for imaging-guided surgery as they did not have high fluorescence signals when their TBR was high: at early time points their fluorescence signal was high; however, their TBR was low at these time points. The Fab may be useful for PET imaging at early time points as it showed the highest xenograft fluorescence of the antibody fragments without an Fc domain. The Fab has the advantage of faster body clearance, which for PET would allow the use of short-lived radionuclides and reduce radiation exposure.
Conclusion
There are currently no FDA-approved imaging probes for monitoring in vivo HER3 expression in tumors. Here, we constructed a set of six imaging probes consisting of an IgG and antibody fragments, ranging in size from 25 kDa to 150 kDa with monovalent or bivalent binding, and analyzed their imaging properties. We examined their xenograft accumulation, biodistribution, and clearance properties to identify antibody fragments that showed the best properties for developing PET/SPECT and imaging-guided surgery probes. We observed a correlation between antibody fragment size and time to reach maximum signal and the value of the maximum signal. TBRs of the anti-HER3 IgG and antibody fragments increased over time with the Fc-containing imaging probes showing the highest fluorescence after 72 hpi. HER3 is expressed at low levels in the tumor and has endogenous expression in tissues. The best images of HER3-positive xenografts were obtained with HER3 imaging probes with longer circulation times. Longer circulation half-lives provide imaging probes sufficient time to accumulate in the tumor and to clear from other tissues.
Abbreviations
AU: fluorescence arbitrary units; CE-SDS: chip-based capillary electrophoresis-sodium-dodecyl sulfate; CH1: constant heavy domain 1; CH2: constant heavy domain 2; CH3: constant heavy domain 3; DMEM: Dulbecco's minimal essential medium; E. coli: Escherichia coli; Fab: antigen-binding fragment; Fc: crystallizable fragment; FcRn: neonatal Fc receptor; HER2: human epidermal growth factor receptor 2; HER3: human epidermal growth factor receptor 3; hpi: hours post-injection; IFOM: imaging figure of merit; IgG: immunoglobulins; KD: dissociation constant; MBP: maltose-binding protein; NIR: near-infrared; PBS: phosphate buffered saline; PCR: polymerase chain reaction; PET: positron emission tomography; %ID/g: percent injected dose per gram; scFv: single chain variable fragment; TBR: Tumor to background ratio; VL: variable light domain; VH: variable heavy domain.
Supplementary Material
Supplementary figures and table.
Acknowledgements
Author Contributions
A.E. designed and performed experiments (designed fragments, protein expression, labeling, kinetics, flow cytometry, xenografts, imaging), analyzed data and wrote the manuscript. W.B. designed and performed experiments (flow cytometry, cell culture, labeling). K.B. analyzed data, and reviewed and edited the manuscript, C.G. performed experiments (bioanalyzer, cell culture, protein expression and purification). W.H. performed experiments (biolayer interferometry). L.P. provided critical feedback and discussions. H.F. helped supervise the study, and reviewed and edited the manuscript. C.R.G. supervised the study, and reviewed, and edited the manuscript.
Funding
Western Economic Diversification Canada #12939, Fedoruk Centre # J2014-0025.
Competing Interests
The authors have declared that no competing interest exists.
References
1. Hudson PJ, Souriau C. Engineered antibodies. Nat Med. 2003;9:129-34
2. Van Dongen GAMS, Poot AJ, Vugts DJ. PET imaging with radiolabeled antibodies and tyrosine kinase inhibitors: Immuno-PET and TKI-PET. Tumor Biol. 2012;33:607-15
3. Vahrmeijer AL, Hutteman M, van der Vorst JR, van de Velde CJH, Frangioni J V. Image-guided cancer surgery using near-infrared fluorescence. Nat Rev Clin Oncol. 2013;10:507-18
4. Zalevsky J, Chamberlain AK, Horton HM, Karki S, Leung IWL, Sproule TJ. et al. Enhanced antibody half-life improves in vivo activity. Nat Biotechnol. 2010;28:157-9
5. Beck A, Reichert JM. Therapeutic Fc-fusion proteins and peptides as successful alternatives to antibodies. MAbs. 2011;3:415-6
6. Behr TM, Béhé M, Wörmann B. Trastuzumab and breast cancer. N Engl J Med. 2001;345:995-6
7. Bensch F, Lamberts LE, Smeenk MM, Jorritsma-Smit A, Lub-de Hooge MN, Terwisscha van Scheltinga AGT. et al. (89)Zr-lumretuzumab PET imaging before and during HER3 antibody lumretuzumab treatment in patients with solid tumors. Clin Cancer Res. 2017;23:6128-37
8. Scott AM, Wolchok JD, Old LJ. Antibody therapy of cancer. Nat Rev Cancer. 2012;12:278-87
9. Holliger P, Hudson PJ. Engineered antibody fragments and the rise of single domains. Nat Biotechnol. 2005;23:1126-36
10. Thurber GM, Schmidt MM, Wittrup KD. Antibody tumor penetration: Transport opposed by systemic and antigen-mediated clearance. Adv Drug Deliv Rev. 2008;60:1421-34
11. Schmidt MM, Wittrup KD. A modeling analysis of the effects of molecular size and binding affinity on tumor targeting. Mol Cancer Ther. 2009;8:2861-71
12. Muchekehu R, Liu D, Horn M, Campbell L, Rosario J Del, Bacica M. et al. The effect of molecular weight, PK, and valency on tumor biodistribution and efficacy of antibody-based drugs. Transl Oncol. 2013;6:562-72
13. Leelawattanachai J, Kwon KW, Michael P, Ting R, Kim JY, Jin MM. Side-by-side comparison of commonly used biomolecules that differ in size and affinity on tumor uptake and internalization. PLoS One. 2015;10:e0124440
14. Heskamp S, van Laarhoven HWM, Molkenboer-Kuenen JDM, Bouwman WH, van der Graaf WTA, Oyen WJG. et al. Optimization of IGF-1R SPECT/CT Imaging Using 111 In-Labeled F(ab′) 2 and Fab Fragments of the Monoclonal Antibody R1507. Mol Pharm. 2012;9:2314-2321
15. Wu AM, Chen W, Raubitschek A, Williams LE, Neumaier M, Fischer R. et al. Tumor localization of anti-CEA single-chain Fvs: Improved targeting by non-covalent dimers. Immunotechnology. 1996;2:21-36
16. Todorovska A, Roovers RC, Dolezal O, Kortt AA, Hoogenboom HR, Hudson PJ. Design and application of diabodies, triabodies and tetrabodies for cancer targeting. J Immunol Methods. 2001;248:47-66
17. Batra SK, Jain M, Wittel UA, Chauhan SC, Colcher D. Pharmacokinetics and biodistribution of genetically engineered antibodies. Curr Opin Biotechnol. 2002;13:603-8
18. Sundaresan G, Yazaki PJ, Shively JE, Finn RD, Larson SM, Raubitschek A a. et al. 124I-labeled engineered anti-CEA minibodies and diabodies allow high-contrast, antigen-specific small-animal PET imaging of xenografts in athymic mice. J Nucl Med. 2003;44:1962-9
19. Li K, Tavaré R, Zettlitz KA, Mumenthaler SM, Mallick P, Zhou Y. et al. Anti-MET ImmunoPET for non-small cell lung cancer using novel fully human antibody fragments. Mol Cancer Ther. 2014;13:2607-17
20. Olafsen T, Kenanova VE, Sundaresan G, Anderson A-L, Crow D, Yazaki PJ. et al. Optimizing radiolabeled engineered anti-p185HER2 antibody fragments for in vivo imaging. Cancer Res. 2005;65:5907-16
21. Ocana A, Vera-Badillo F, Seruga B, Templeton A, Pandiella A, Amir E. HER3 overexpression and survival in solid tumors: A meta-analysis. J Natl Cancer Inst. 2013;105:266-73
22. Hayashi M, Inokuchi M, Takagi Y, Yamada H, Kojima K, Kumagai J. et al. High expression of HER3 is associated with a decreased survival in gastric cancer. Clin Cancer Res. 2008;14:7843-9
23. Ledel F, Hallström M, Ragnhammar P, Öhrling K, Edler D. HER3 expression in patients with primary colorectal cancer and corresponding lymph node metastases related to clinical outcome. Eur J Cancer. 2014;50:656-62
24. Tanner B, Hasenclever D, Stern K, Schormann W, Bezler M, Hermes M. et al. ErbB-3 predicts survival in ovarian cancer. J Clin Oncol. 2006;24:4317-23
25. Müller-Tidow C, Diederichs S, Bulk E, Pohle T, Steffen B, Schwäble J. et al. Identification of metastasis-associated receptor tyrosine kinases in non-small cell lung cancer. Cancer Res. 2005;65:1778-82
26. Sergina N V, Rausch M, Wang D, Blair J, Hann B, Shokat KM. et al. Escape from HER-family tyrosine kinase inhibitor therapy by the kinase-inactive HER3. Nature. 2007;445:437-41
27. Huang X, Gao L, Wang S, McManaman JL, Thor AD, Yang X. et al. Heterotrimerization of the growth factor receptors erbB2, erbB3, and insulin-like growth factor-I receptor in breast cancer cells resistant to herceptin. Cancer Res. 2010;70:1204-14
28. Immuno positron emission tomography study of GSK2849330 in subjects with human epidermal growth factor receptor 3-positive solid tumors. https://clinicaltrials.gov/ct2/show/NCT02345174
29. Lockhart AC, Liu Y, Dehdashti F, Laforest R, Picus J, Frye J. et al. Phase 1 evaluation of [64Cu]DOTA-patritumab to assess dosimetry, apparent receptor occupancy, and safety in subjects with advanced solid tumors. Mol Imaging Biol. 2016;18:446-53
30. Yuan Q, Furukawa T, Tashiro T, Okita K, Jin ZH, Aung W. et al. Immuno-PET imaging of HER3 in a model in which HER3 signaling plays a critical role. PLoS One. 2015;10:e0143076
31. Orlova A, Malm M, Rosestedt M, Varasteh Z, Andersson K, Selvaraju RK. et al. Imaging of HER3-expressing xenografts in mice using a 99mTc(CO) 3-HEHEHE-ZHER3:08699 affibody molecule. Eur J Nucl Med Mol Imaging. 2014;41:1450-9
32. Rosestedt M, Andersson KG, Mitran B, Tolmachev V, Löfblom J, Orlova A. et al. Affibody-mediated PET imaging of HER3 expression in malignant tumours. Sci Rep. 2015;5:15226
33. Da Pieve C, Allott L, Martins CD, Vardon A, Ciobota DM, Kramer-Marek G. et al. Efficient [18F]AlF radiolabeling of ZHER3:8698 affibody molecule for imaging of HER3 positive tumors. Bioconjug Chem. 2016;27:1839-49
34. Vellalore Maruthachalam B, El-Sayed A, Liu J, Hill W, Sutherland A, Pastushok L. et al. A single-framework synthetic antibody library containing a combination of canonical and variable complementarity determining regions. Chembiochem. 2017;18:2247-2259
35. Horton RM, Cai Z, Ho SM, Pease LR. Gene splicing by overlap extension: tailor-made genes using the polymerase chain reaction. BioTechniques 8(5): 528-535 (November 1990). Biotechniques. 2013;54:129-33
36. Huston JS, Levinson D, Mudgett-Hunter M, Tai MS, Novotný J, Margolies MN. et al. Protein engineering of antibody binding sites: recovery of specific activity in an anti-digoxin single-chain Fv analogue produced in Escherichia coli. Proc Natl Acad Sci U S A. National Academy of Sciences. 1988;85:5879-83
37. Kortt AA, Lah M, Oddie GW, Gruen CL, Burns JE, Pearce LA. et al. Single-chain Fv fragments of anti-neuraminidase antibody NC10 containing five- and ten-residue linkers form dimers and with zero-residue linker a trimer. Protein Eng. 1997;10:423-33
38. Choi JH, Lee SY. Secretory and extracellular production of recombinant proteins using Escherichia coli. Appl Microbiol Biotechnol. Springer-Verlag. 2004;64:625-35
39. Oliveira S, Van Dongen GA, Stigter-Van Walsum M, Roovers RC, Stam JC, Mali W. et al. Rapid visualization of human tumor xenografts through optical imaging with a near-infrared fluorescent anti-epidermal growth factor receptor nanobody. Mol Imaging. 2012;11:33-46
40. Du Manoir JM, Francia G, Man S, Mossoba M, Medin JA, Viloria-Petit A. et al. Strategies for delaying or treating in vivo acquired resistance to trastuzumab in human breast cancer xenografts. Clin Cancer Res. 2006;12:904-16
41. Euhus DM, Hudd C, Laregina MC, Johnson FE. Tumor measurement in the nude mouse. J Surg Oncol. 1986;31:229-34
42. Garner AP, Bialucha CU, Sprague ER, Garrett JT, Sheng Q, Li S. et al. An antibody that locks HER3 in the inactive conformation inhibits tumor growth driven by HER2 or neuregulin. Cancer Res. 2013;73:6024-35
43. Terwisscha van Scheltinga AGT, Lub-de Hooge MN, Abiraj K, Schroder CP, Pot L, Bossenmaier B. et al. ImmunoPET and biodistribution with human epidermal growth factor receptor 3 targeting antibody (8)(9)Zr-RG7116. MAbs. 2014;6:1051-8
44. Kosaka N, Ogawa M, Choyke PPL, Kobayashi H. Clinical implications of near-infrared fluorescence imaging in cancer. Futur Oncol. 2009;5:1501-11
45. Klein JS, Gnanapragasam PNP, Galimidi RP, Foglesong CP, West AP, Bjorkman PJ. Examination of the contributions of size and avidity to the neutralization mechanisms of the anti-HIV antibodies b12 and 4E10. Proc Natl Acad Sci USA. 2009;106:7385-90
46. Torres M, Fernández-Fuentes N, Fiser A, Casadevall A. The immunoglobulin heavy chain constant region affects kinetic and thermodynamic parameters of antibody variable region interactions with antigen. J Biol Chem. 2007;282:13917-27
47. Pritsch O, Hudry-Clergeon G, Buckle M, Pétillot Y, Bouvet JP, Gagnon J. et al. Can immunoglobulin C(H)1 constant region domain modulate antigen binding affinity of antibodies? J Clin Invest. 1996;98:2235-43
48. Olafsen T, Tan GJ, Cheung CW, Yazaki PJ, Park JM, Shively JE. et al. Characterization of engineered anti-p185HER-2 (scFv-C H3)2 antibody fragments (minibodies) for tumor targeting. Protein Eng Des Sel. 2004;17:315-23
49. Ravn P, Stahn R, Danielczyk A, Faulstich D, Karsten U, Goletz S. The Thomsen-Friedenreich disaccharide as antigen for in vivo tumor targeting with multivalent scFvs. Cancer Immunol Immunother. 2007;56:1345-57
50. Begent RHJ, Verhaar MJ, Chester KA, Casey JL, Green AJ, Napier MP. et al. Clinical evidence of efficient tumor targetting based on single-chain Fv antibody selected from a combinatorial library. Nat Med. 1996;2:979-84
51. Pavlinkova G, Beresford GW, Booth BJ, Batra SK, Colcher D. Pharmacokinetics and biodistribution of engineered single-chain antibody constructs of MAb CC49 in colon carcinoma xenografts. J Nucl Med. 1999;40:1536-46
52. Schneider DW, Heitner T, Alicke B, Light DR, McLean K, Satozawa N. et al. In vivo biodistribution, PET imaging, and tumor accumulation of 86Y- and 111In-antimindin/RG-1, engineered antibody fragments in LNCaP tumor-bearing nude mice. J Nucl Med. 2009;50:435-43
53. Malm M, Kronqvist N, Lindberg H, Gudmundsdotter L, Bass T, Frejd FY. et al. Inhibiting HER3-mediated tumor cell growth with affibody molecules engineered to low picomolar affinity by position-directed error-prone PCR-like diversification. PLoS One. 2013;8:e62791
54. Covell DG, Barbet J, Holton OD, Black CD V, Weinstein JN, Parker RJ. Pharmacokinetics of monoclonal immunoglobulin G1, F(ab')2, and Fab' in mice. Cancer Res. 1986;46:3969-78
55. Tang Y, Wang J, Scollard DA, Mondal H, Holloway C, Kahn HJ. et al. Imaging of HER2/neu-positive BT-474 human breast cancer xenografts in athymic mice using 111In-trastuzumab (Herceptin) Fab fragments. Nucl Med Biol. 2005;32:51-8
56. Williams LE, Wu a M, Yazaki PJ, Liu a, Raubitschek a a, Shively JE. et al. Numerical selection of optimal tumor imaging agents with application to engineered antibodies. Cancer Biother Radiopharm. 2001;16:25-35
Author contact
![]() Corresponding authors: C. Ronald Geyer, PhD, Department of Pathology and Laboratory Medicine, University of Saskatchewan, Saskatoon, SK, Canada. ron.geyerca and Humphrey Fonge, PhD, Department of Medical Imaging, University of Saskatchewan, Saskatoon, SK, Canada. Humphrey.fongeca
Corresponding authors: C. Ronald Geyer, PhD, Department of Pathology and Laboratory Medicine, University of Saskatchewan, Saskatoon, SK, Canada. ron.geyerca and Humphrey Fonge, PhD, Department of Medical Imaging, University of Saskatchewan, Saskatoon, SK, Canada. Humphrey.fongeca