Impact Factor
- Issue 14; 2026
- Issue 13; 2026
- Issue 12; 2026
- Issue 11; 2026
- Issue 10; 2026
- Volume 16; 2026
- Advance Articles
- Past Issues
- Cover Images
- Cover Suggestion
- Index & Coverage
- Special Issues
Introduction
Methods
Results
Discussion
Abbreviations
Supplementary Material
Acknowledgements
References
International Journal of Biological Sciences
International Journal of Medical Sciences
 Global reach, higher impact

Theranostics 2018; 8(16):4295-4304. doi:10.7150/thno.26370 This issue Cite
Research Paper
Comparative biodistribution analysis across four different 89Zr-monoclonal antibody tracers—The first step towards an imaging warehouse
Frederike Bensch1, Michaël M. Smeenk1, Suzanne C. van Es1, Johan R. de Jong3, Carolina P. Schröder1, Sjoukje F. Oosting1, Marjolijn N. Lub-de Hooge2,3, C. Willemien Menke-van der Houven van Oordt4, Adrienne H. Brouwers3, Ronald Boellaard3, Elisabeth G.E. de Vries1 ![]()
1. Department of Medical Oncology, University of Groningen, University Medical Center Groningen, the Netherlands.
2. Department of Clinical Pharmacy and Pharmacology, University of Groningen, University Medical Center Groningen, the Netherlands.
3. Department of Nuclear Medicine and Molecular Imaging, University of Groningen, University Medical Center Groningen, the Netherlands.
4. Department of Medical Oncology, Cancer Center Amsterdam, VU University Medical Center, Amsterdam, the Netherlands.
Received 2018-3-29; Accepted 2018-6-8; Published 2018-7-30
Abstract

Rationale: Knowledge on monoclonal antibody biodistribution in healthy tissues in humans can support clinical drug development. Molecular imaging with positron emission tomography (PET) can yield information in this setting. However, recent imaging studies have analyzed the behavior of single antibodies only, neglecting comparison across different antibodies.
Methods: We compared the distribution of four 89Zr-labeled antibodies in healthy tissue in a retrospective analysis based on the recently published harmonization protocol for 89Zr-tracers and our delineation protocol.
Results: The biodistribution patterns of 89Zr-lumretuzumab, 89Zr-MMOT0530A, 89Zr-bevacizumab and 89Zr-trastuzumab on day 4 after tracer injection were largely similar. The highest tracer concentration was seen in healthy liver, spleen, kidney and intestines. About one-third of the injected tracer dose was found in the circulation, up to 15% in the liver and only 4% in the spleen and kidney. Lower tracer concentration was seen in bone marrow, lung, compact bone, muscle, fat and the brain. Despite low tracer accumulation per gram of tissue, large-volume tissues, especially fat, can influence overall distribution: On average, 5-7% of the injected tracer dose accumulated in fat, with a peak of 19% in a patient with morbid obesity.
Conclusion: The similar biodistribution of the four antibodies is probably based on their similar molecular structure, binding characteristics and similar metabolic pathways. These data provide a basis for a prospectively growing, online accessible warehouse of molecular imaging data, which enables researchers to increase and exchange knowledge on whole body drug distribution and potentially supports drug development decisions.
Keywords: PET, Zirconium-89, monoclonal antibody, biodistribution
Introduction
In the last two decades, 28 monoclonal antibodies (mAb), an important class of targeted anti-cancer therapeutics, have been approved by the FDA and EMA for cancer therapy [1-4]. The majority of these drugs were engineered to bind to a specific target. In addition, two antibody drug conjugates—mAbs loaded with a cytotoxic agent to specifically bring its cargo to cancer cells—are currently approved for use in patients. During the next decade much cancer drug development is expected to focus on antibodies or constructs based on antibodies, like antibody-drug conjugates, antibody fragments and bispecific antibodies [5]. As a result, rational drug dosing choices for mAbs are a crucial focus of clinical research, especially because the maximum tolerated doses often cannot be established.
This research can be enhanced with molecular imaging, which enables whole body assessment of drug distribution in healthy and malignant tissue over time. Moreover, molecular imaging can potentially enhance understanding of drug pharmacokinetics and support dosing decisions in early clinical drug development [6]. At present, nearly 20 mAbs have been coupled to various radionuclides and evaluated in early clinical trials using positron emission tomography (PET) [6]. Of the radionuclides currently available, zirconium-89 (89Zr) is increasingly being used to label mAbs. 89Zr is advantageous because it remains in cells after internalization of the mAb-receptor complex, which leads to improved tumor image contrast via accumulation, and its half-life of about 78 hours allows target binding over a longer period of time, which better matches the long half-lives of mAbs [7]. A head-to-head comparison of Indium-111-trastuzumab and 89Zr-trastuzumab in mice showed the favorable image quality of the 89Zr-labeled tracer and a comparable normal organ distribution, with as the only difference a higher normal bone tracer uptake at the latest scan moment for 89Zr-trastuzumab [8].
Until now, imaging trials only focused on biodistribution analysis of single agents, neglecting comparison across different antibodies. The latter, however, might be of great value during drug development, especially in the era of immune checkpoint inhibitors, as those target lymphoid (effector) tissue exclusively or in combination with tumor tissue potentially resulting in a different distribution pattern. Drug dose decisions might be optimized based on deeper knowledge of distribution, the influence of the size and/or structure of the molecule itself or the target. To discern specifics in the biodistribution of single mAbs, general knowledge about mAb distribution is required. Thereby, the administered protein dose is of special interest, as monoclonal antibodies can show different pharmacokinetic and potentially target saturation might occur after administration of therapeutic doses. Furthermore, as also engineered antibodies and other constructs like bispecific antibodies or antibody fragments with potentially different kinetics and dynamics are introduced in the clinics, more detailed information on distribution in combination with long term experience in dosing, side effects and efficacy of the currently used mAb might speed up gain of knowledge [9]. Finally, molecular PET imaging with 89Zr-mAb tracers seems to have the potential to predict response to mAb drug treatment [10].
Previous multicenter trials with fluorine-18 (18F) have shown the necessity of harmonization to reduce data variability and enable comparison of data between trials and sites, which led to development of the European Association of Nuclear medicine (EANM) guidelines and establishment of the EANM Research Ltd (EARL) accreditation [11, 12]. For 89Zr, a comparable harmonization protocol has been developed only recently [13]. Before this harmonization protocol became available, it was not possible to compare the biodistribution of 89Zr-labeled mAbs assessed by PET. Comparison between the biodistribution of antibodies was also hampered by the lack of a standard delineation protocol when performing the semi-quantitative analyses. Moreover, biodistribution of some mAbs assessed in clinical imaging studies was described as part of a detailed dosimetric analysis (e.g., [14]), whereas other imaging trials used a standardized uptake value (SUV) based description of the biodistribution (e.g., [15-18]). If we could make standardized comparisons, this would be an important step towards using molecular imaging data for optimizing rational drug development.
To support such inter-study comparisons, we decided to generate the basis of a prospectively growing mAb imaging data warehouse. To do so, we performed a comparative biodistribution analysis of four 89Zr-labeled mAbs that we previously explored in clinical studies: the anti-human epidermal growth factor receptor (HER) 2 antibody trastuzumab, the anti-HER3 antibody lumretuzumab, the anti-vascular endothelial growth factor A (VEGF-A) antibody bevacizumab and the anti-mesothelin antibody MMOT0530A [15-18]. This analysis was based on the 89Zr-harmonization protocol and was conducted according to the delineation protocol for 89Zr-tracers, which we recently established. We then deposited this data in an online warehouse.
Methods
PET scan selection
For this analysis, we selected PET scans of patients following injection of the mAb tracers 89Zr-lumretuzumab, 89Zr-MMOT0530A, 89Zr-bevacizumab or 89Zr-trastuzumab. These scans were obtained from clinical imaging trials (specified below) or from extended clinical work-ups and had been performed before start of treatment on patients with locally advanced or metastatic solid cancer. The inclusion criteria for the scans were as follows: administered tracer activity of 37 MBq (±10%), the PET scan had to be performed 4 days after tracer injection together with a low-dose computed tomography (LD CT) and the tracer had to be complemented with the previously determined optimal unlabeled imaging protein dose (100 mg lumretuzumab, 50 mg trastuzumab, 10 mg MMOT0530A or no unlabeled mAb in case of bevacizumab imaging) [17-19]. The optimal unlabeled imaging protein dose was defined as the dose required to ensure sufficient tracer in the circulation 4 days after tracer injection for adequate tumor visualization. Patients and their corresponding PET scans were excluded from the biodistribution analysis if patient-related and/or disease-related factors were identified that might have influenced the biodistribution, like recurrent pleural effusion needing continuous drainage or a history of hemihepatectomy. Patients' history, age, sex, weight and height were collected from their dossiers.
PET scans were performed in clinical imaging trials executed in the Department of Medical Oncology of the University Medical Center Groningen (UMCG, Groningen, the Netherlands) and of the VU University Medical Center (VUMC, Amsterdam, the Netherlands) [17, 18], or as part of an extended clinical work-up. All clinical trials were approved by the responsible Medical Ethics Committee, as well as the Central Committee on Research Involving Human Subjects, and registered individually or as part of the corresponding phase I trial (ClinicalTrials.gov identifiers NCT01482377, NCT01832116 and NCT01028638).
PET imaging
PET acquisition at 4 days postinjection was carried out from head to upper thigh, in bed positions of 5 minutes per bed position with a PET/CT camera (Biograph mCT, Siemens [UMCG], and Gemini TF or Ingenuity TF, Philips [VUMC]). PET scans were accompanied by a LD CT scan for attenuation correction. All PET images were reconstructed using the harmonized reconstruction algorithm recommended for multicenter 89Zr-mAb PET scan trials [13].
89Zr-mAb PET scan analysis
PET scans of all four tracers were analyzed using the software A Medical Imaging Data Examiner (AMIDE version 0.9.1; Stanford University, [20]), in a standardized manner according to our delineation protocol (Table S1). Spherical volumes of interest (VOI) with predefined sizes were drawn in healthy tissue in the brain, lung, liver, muscle, spleen, kidney, bone marrow, compact bone, fat and the intestine. A VOI in the aorta was used as readout for blood pool activity. Furthermore, all tumor lesions visible on PET and/or diagnostic CT scan were delineated per patient to estimate total tumor volume. In patients without liver metastases, the whole liver was manually delineated using the LD CT for anatomic reference to assess whole organ tracer uptake. A whole body VOI was drawn from head to the tuber ischiadicum to estimate the total amount of tracer left in the patient (excluding the legs).
For all VOIs, the percentage injected dose per kilogram (%ID/kg), normalized to calibrated dose of the 89Zr-tracer, corrected for decay at the time of scanning, was calculated (Table S1). The total tumor volume was estimated by the sum of single tumor volumes calculated based on the SUVmean40 [21]. The percentage body fat [22] multiplied by patient's weight, and the results of the delineation of the whole liver were used to calculate the activity as percentage of the injected dose (%ID) in total fat and liver, respectively (Table S1). To assess the activity (%ID) in the spleen, kidneys and total blood volume, the volumes of the spleen and the kidneys were estimated based on linear CT measurements [23, 24], and the total blood volume was calculated using Nadler's formula [25].
Statistics
Statistical analyses were performed using IBM SPSS Version 22. In case of normally distributed data, groups were compared using a one-way ANOVA with either post hoc Gabriel or Games-Howell test depending on homogeneity of variances as assessed by Levene's test. If results were not normally distributed, comparison was performed using a Kruskal-Wallis followed by a Mann-Whitney U test. P ≤ 0.05 was considered to be a significant difference. All analyses were 2-sided. Bivariate correlations were performed using Pearson correlation coefficients. Data are presented as mean ± standard deviation (SD), unless otherwise stated.
Results
Patient characteristics
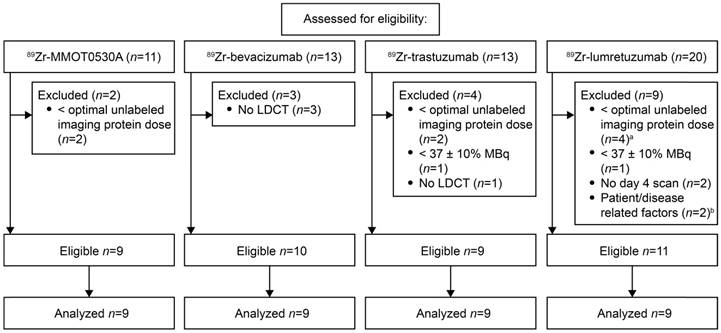
For 89Zr-lumretuzumab, 89Zr-MMOT0530A, 89Zr-bevacizumab and 89Zr-trastuzumab, scans of eleven, nine, ten and nine patients, respectively, were eligible for comparative 89Zr-tracer biodistribution analysis (Figure 1). Per tracer, we analyzed the same number of scans (n=9). If more than 9 scans were available, the first 9 of all eligible PET scans were selected. Additional information on the mAbs and the respective 89Zr-tracers are summarized in Table S2. The analyzed PET scans were performed between November 2009 and August 2014. Included patients had locally advanced or metastatic cancer, the majority of the patients had multiple metastatic sites. Patient characteristics are summarized in Table 1.
Scan selection per tracer according to predefined eligibility criteria. a, Optimal imaging dose of unlabeled lumretuzumab was considered 100 mg, scans with 10 and 50 mg were excluded. b, The scans of patients with a history of a hemihepatectomy (n=1) and recurrent pleural effusion needing continuous drainage (n=1) were excluded.
Patient characteristics.
| Characteristics | 89Zr-lumretuzumab a | 89Zr-MMOT0530A | 89Zr-bevacizumab | 89Zr-trastuzumab b |
|---|---|---|---|---|
| Age, median years (range) | 59 (48-72) | 62 (44-70) | 64 (51-68) | 47 (22-73) |
| Number of patients | 9 | 9 | 9 | 9 |
| Male | 5 (56) | 2 (22) | 5 (56) | 2 (22) |
| Female | 4 (44) | 7 (78) | 4 (44) | 7 (78) |
| Tumor type, n (%) | ||||
| Colorectal | 5 (56) | - | - | 1 (11) |
| Breast | 1 (11) | - | - | 8 (89) |
| Oropharyngeal | 1 (11) | - | - | - |
| CUP | 1 (11) | - | - | - |
| Vulvar | 1 (11) | - | - | - |
| Ovarian | - | 2 (22) | - | - |
| Pancreatic | - | 7 (78) | - | - |
| Renal cell | - | - | 9 (100) | - |
| Sites of tumor lesions, n c | ||||
| Adrenal gland | 3 | 3 | 3 | - |
| Bone | 1 | - | 40 | 121 |
| Brain | - | - | 2 | 9 |
| Breast | - | - | - | 2 |
| Intestine | 2 | - | 2 | 1 |
| Kidney | - | - | 16 | - |
| Lung | 34 | 3 | 6 | 2 |
| Liver | - | 7 | 7 | 48 |
| Lymph nodes | 10 | 6 | 9 | 27 |
| Pancreas | - | 4 | 4 | - |
| Pleura | 2 | - | 3 | - |
| Soft tissue d | 10 | 6 | 29 | 6 |
| Spleen | - | - | 1 | 1 |
| Thyroid gland | - | - | 2 | - |
| Uterus | - | 2 | - | - |
| Tumor load, mL (±SD) | 41 (± 25) | 42 (± 22) | 116 (± 67) | 99 (± 133) |
CUP, Cancer of Unknown Primary. a, 89Zr-lumretuzumab PET was performed in patients with HER3-positive disease according to study protocol (Meulendijks et al., CCR 2017). b, 89Zr-trastuzumab PET was performed in patients with HER2-postive disease as part of an extended clinical work-up. c, Sites of tumor lesions comprise sites of primary tumors and sites of metastases at the time of PET imaging. d, Soft tissue lesions include subcutaneous lesions not further specified, intramuscular lesions and abdominal soft tissue lesions.
89Zr-mAb tracer distribution in healthy tissue
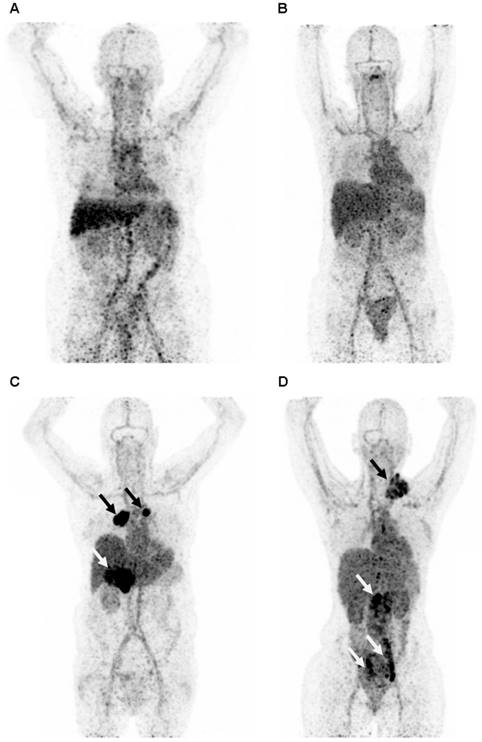
All tracers showed a comparable distribution pattern throughout the whole body with the highest tracer uptake (calculated as %ID/kg) in healthy liver tissue, as well as in the spleen, kidneys and intestines (Figure 2). Generally, lower tracer concentration was observed in the bone marrow, lung, compact bone, muscle, fat tissue and the brain (Table 2).
Representative maximum intensity projection of a PET scan 4 days after injection with 89Zr-lumretuzumab (A), 89Zr-MMOT0530A (B), 89Zr-bevacizumab (C) and 89Zr-trastuzumab (D). The patients injected with 89Zr-bevacizumab (C) and 89Zr-trastuzumab (D) show clear tumor tracer uptake (black and white arrows), whereas tumor lesions on the 89Zr-lumretuzumab PET and 89Zr-MMOT0530A were visually negative.
Normal tissue tracer uptake as percent of injected dose per kilogram bodyweight per 89Zr-monocloncal antibody tracer 4 days post tracer injection.
| Tissue | VOI (%ID/kg, ±SD) | ||||
|---|---|---|---|---|---|
| 89Zr-lumretuzumab | 89Zr-MMOT0530A | 89Zr-bevacizumab | 89Zr-trastuzumab | ANOVA/Kruskal-Wallis P | |
| Aorta | 6.2 (± 1.6) | 7.5 (± 1.3) | 7.1 (± 1.6) | 7.7 (± 2.8) | 0.35 |
| Bone marrow | 1.9 (± 0.6) | 2.9 (± 0.5) | 2.1 (± 0.7) | 2.8 (± 1.0) | 0.02 a |
| Brain | 0.1 (± 0.1) | 0.3 (± 0.2) | 0.2 (± 0.1) | 0.3 (± 0.1) | 0.09 |
| Compact bone | 0.9 (± 0.6) | 1.2 (± 0.3) | 0.6 (± 0.2) | 0.8 (± 0.4) | 0.01 b |
| Fat tissue | 0.2 (± 0.1) | 0.2 (± 0.1) | 0.2 (± 0.2) | 0.3 (± 0.1) | 0.26 |
| Intestine | 3.4 (± 1.5) | 3.9 (± 1.5) | 2.7 (± 1.5) | 5.4 (± 2.4) | 0.02 c |
| Kidney | 5.4 (± 0.6) | 7.6 (± 1.6) | 6.1 (± 1.1) | 8.7 (± 1.5) | <0.01 d |
| Liver | 7.3 (± 1.3) | 10.8 (± 3.6) | 9.9 (± 1.4) | 6.8 (± 1.6) | <0.01 e |
| Lung | 1.1 (± 0.1) | 1.7 (± 0.7) | 1.1 (± 0.2) | 1.4 (± 0.4) | 0.02 a |
| Muscle | 0.7 (± 0.2) | 0.8 (± 0.2) | 0.7 (± 0.2) | 0.8 (± 0.3) | 0.36 |
| Spleen | 5.0 (± 1.2) | 5.8 (± 1.8) | 4.6 (± 0.8) | 5.1 (± 1.6) | 0.32 |
VOI, Volume of interest. a, Post hoc analysis showed no significant difference between the four groups. b, Significant difference between 89Zr-MMOT0530A and 89Zr-bevacizumab. c, Significant difference between 89Zr-bevacizumab and 89Zr-trastuzumab. d, Significant difference between 89Zr-lumretuzumab and 89Zr-MMOT0530A, 89Zr-lumretuzumab and 89Zr-trastuzumab, 89Zr-bevacizumab and 89Zr-trastuzumab, and 89Zr-MMOT0530A. e, Significant difference between 89Zr-lumretuzumab and 89Zr-bevacizumab, 89Zr-bevacizumab and 89Zr-trastuzumab, and 89Zr-trastuzumab and 89Zr-MMOT0530A.
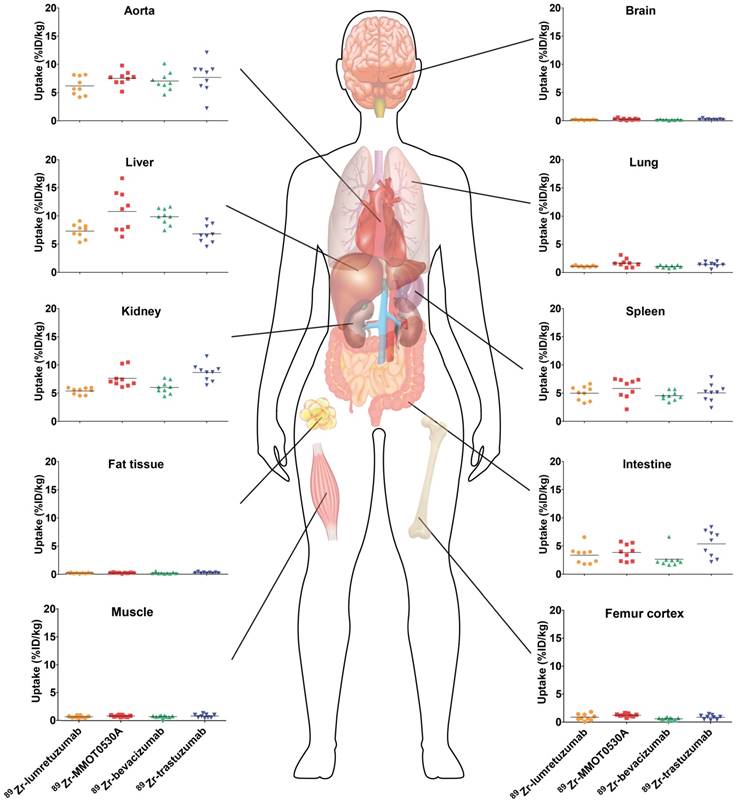
Healthy lung tracer uptake was the highest for 89Zr-MMOT0530A compared to the other tracers with a mean of 1.7 (± 0.7) %ID/kg (Figure 3 and Table 2). Furthermore, lung uptake varied most between patients injected with 89Zr-MMOT0530A (range 0.8-3.1 versus 0.9-1.3, 0.7-1.4 and 0.5-2.0 for patients injected with 89Zr-lumretuzumab, 89Zr-bevacizumab and 89Zr-trastuzumab, respectively). Also uptake in healthy liver tissue, compact bone and bone marrow was the highest for 89Zr-MMOT0530A (10.8 (± 3.6), 1.2 (± 0.3) and 2.9 (± 0.5) %ID/kg). In the intestine, likely influenced by fecal content, as well as in healthy renal tissue, the highest activity, representing at least partially excretion, was observed for 89Zr-trastuzumab (5.4 (± 2.4) and 8.7 (± 1.5) %ID/kg). For brain, spleen, muscle and fat tissue comparable uptake was observed between the four analyzed 89Zr-mAb tracers. The remaining radioactivity present in the aorta (= readout for blood pool) was similar between all 89Zr-mAb tracers as a result of the added unlabeled antibody imaging dose selected in earlier trials. Blood pool activity did not correlate with the tumor load for 89Zr-lumretuzumab, 89Zr-bevacizumab and 89Zr-MMOT0530A, and only poorly for 89Zr-trastuzumab (r2=0.46, Figure S1).
Tracer uptake (%ID/kg) per healthy tissue and in blood for 89Zr-lumretuzumab, 89Zr-MMOT0530A, 89Zr-bevacizumab and 89Zr-trastuzumab (left to right) 4 days post tracer injection. Each dot represents an individual patient; mean is plotted per tracer.
Amount of tracer in healthy tissue, as percentage of injected dose
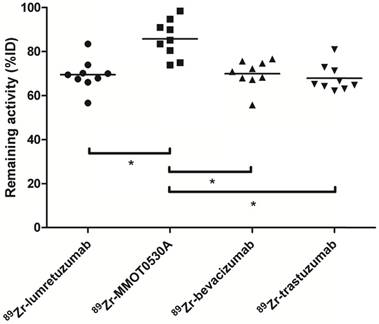
There was no difference between the total amount of 89Zr-lumretuzumab, 89Zr-bevacizumab and 89Zr-trastuzumab remaining in the body on day 4 after tracer injection (69.5 (± 7.1), 69.9 (± 6.3) and 67.9 (± 6.1) %ID, respectively). The remaining activity in patients injected with 89Zr-MMOT0530A was higher compared to the other three tracers (85.8 (± 8.5) %ID) (Figure 4).
Radioactivity as %ID left in the body (head to tuber ischiadicum) 4 days postinjection per tracer. Each dot represents individual patients and asterisk indicates differences between groups with P <0.05.
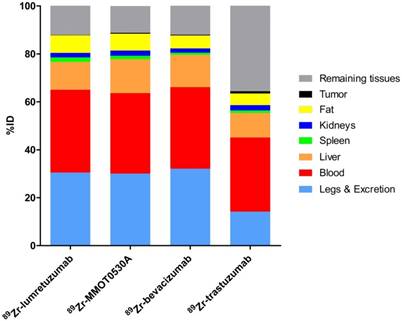
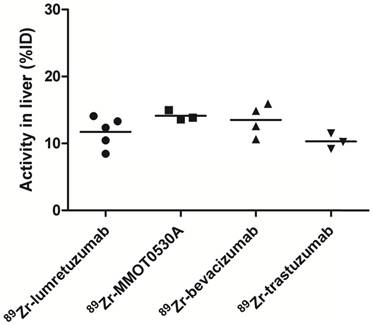
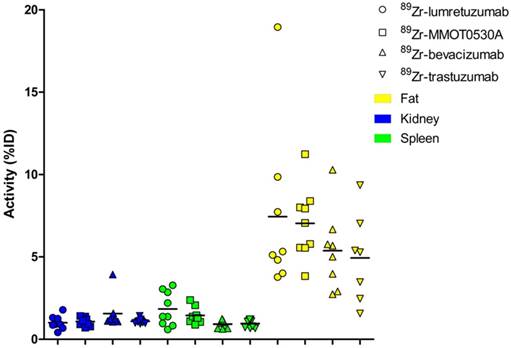
A mean of 34.5 (± 8.4), 33.5 (± 3.7), 34.0 (± 5.7) and 30.9 (± 12.5) %ID was still circulating in the blood 4 days after administration of 89Zr-lumretuzumab, 89Zr-MMOT0530A, 89Zr-bevacizumab and 89Zr-trastuzumab, respectively (Table 3 and Figure 5). In patients without liver metastases on average 10.3 (± 1.2, 89Zr-trastuzumab) %ID up to 14.0 (± 0.7, 89Zr-MMOT0530A) %ID accumulated in the liver 4 days post injection (n = 5, 3, 4 and 3 patients who received, respectively, 89Zr-lumretuzumab, 89Zr-MMOT0530A, 89Zr-bevacizumab and 89Zr-trastuzumab). The total liver uptake ranged from 8.5 %ID to 16.0 %ID (Figure 6). Despite the relatively high tracer concentration in the spleen (up to 5.8 (± 1.8) %ID/kg) and kidney (up to 8.7 (± 1.5) %ID/kg), the absolute proportion of tracer accumulating in these organs was only 0.6 to 3.3 %ID for the spleen and 0.4 to 3.9 %ID for one kidney (Figure 7). Tracer concentration in fat tissue, in contrast, was low compared to other healthy tissues: 0.2 (± 0.1), 0.2 (± 0.1), 0.2 (± 0.2) and 0.3 (± 0.1) %ID/kg for 89Zr-lumretuzumab, 89Zr-MMOT0530A, 89Zr-bevacizumab and 89Zr-trastuzumab, respectively. Despite this generally low tracer concentration in fat, when the total amount of fat tissue in the patient was considered, a substantial proportion of the injected tracer dose accumulated in fat tissue: 7.4 (± 5.4), 7.0 (± 2.2), 5.4 (± 2.6) and 4.9 (± 2.8) %ID of 89Zr-lumretuzumab, 89Zr-MMOT0530A, 89Zr-bevacizumab and 89Zr-trastuzumab, respectively; Figure 5. The estimated total amount of tracer accumulated in fat tissue ranged between 1.56 %ID and 18.95 %ID depending on the physique of the patient (Figure 7).
Activity as part of the injected dose per 89Zr-monocloncal antibody tracer 4 days post tracer injection.
| Tissue | VOI (%ID, ±SD) | |||
|---|---|---|---|---|
| 89Zr-lumretuzumab | 89Zr-MMOT0530A | 89Zr-bevacizumab | 89Zr-trastuzumab | |
| Total blood pool | 34.5 (± 8.4) | 33.5 (± 3.7) | 34.0 (± 5.7) | 30.9 (± 12.5) |
| Liver | 11.7 (± 2.3) | 14.2 (± 0.7) | 13.5 (± 2.4) | 10.3 (± 1.2) |
| Spleen | 1.8 (± 1.0) | 1.4 (± 0.5) | 0.9 (± 0.2) | 1.0 (± 0.1) |
| Kidney | 1.0 (± 0.4) | 1.1 (± 0.3) | 1.6 (± 0.9) | 1.1 (± 0.1) |
| Fat tissue | 7.4 (± 5.1) | 7.0 (± 2.2) | 5.4 (± 2.4) | 4.9 (± 2.7) |
| Tumor | 0.1 (± 0.1) | 0.4 (± 0.3) | 0.3 (± 0.2) | 0.9 (± 1.8) |
VOI, Volume of interest.
Mean uptake as %ID per 89Zr-monoclonal antibody tracer in blood, liver, spleen, kidney, fat, tumor, remaining tissues (including intestines), as well as excreted part and the legs.
Radioactivity as %ID in the liver without metastatic disease could be assessed in 5, 3, 4 and 3 patients injected with 89Zr-lumretuzumab, 89Zr-MMOT0530A, 89Zr-bevacizumab and 89Zr-trastuzumab, respectively.
Radioactivity as %ID per 89Zr-monoclonal antibody tracer in kidney, spleen and fat per patient per tracer (mean).
The median measurable tumor load was 41 (± 25) mL, 42 (± 22) mL, 116 (± 67) mL and 99 (± 133) mL for 89Zr-lumretuzumab, 89Zr-MMOT0530A, 89Zr-bevacizumab and 89Zr-trastuzumab, respectively (Table 1). In this dataset, on average per tracer less than 1 %ID accumulated in tumor lesions per patient (Table 3).
Discussion
We conducted the first comparative analysis of the healthy tissue distribution of four 89Zr-mAb tracers, based on the recently published harmonization protocol for 89Zr [13] and analyzed according to our delineation protocol for 89Zr-mAb tracers.
89Zr-lumretuzumab, 89Zr-MMOT0530A, 89Zr-bevacizumab and 89Zr-trastuzumab showed a similar healthy tissue distribution pattern, with highest uptake in the liver, spleen and kidneys and lower uptake in the bone marrow, lung, compact bone, muscle, fat tissue and the brain. Tissues with generally low uptake can also be of interest with regards to distribution if the respective tissue comprises a larger volume, potentially influencing (optimal) tumor targeting. Fat tissue, for example, had one of the lowest uptake values in our dataset. However, depending on the physique of the patient, up to 19 %ID accumulated in fat. In comparison, the liver, which often is considered as sink organ by visual analysis due to its high tracer uptake per kg tissue, contained about 10-15 %ID and the spleen and one kidney account for a maximum of 4 %ID each, whereas less than 1 %ID accumulated in tumor lesions. The observed slight differences in healthy tissue distribution between the four analyzed 89Zr-mAb tracers might be the consequence of target specific uptake, non-specific tracer accumulation and/or clearance mechanisms specific for the certain mAb.
89Zr-MMT0530A uptake, compared to the other three tracers, was higher in the lung, which might partly be explained by the expression of mesothelin in mesothelial cells e.g. in the lining of the pleura [26, 27], whereas higher uptake in the liver, compact bone and bone marrow cannot be explained by the known protein expression profile. HER2 expression in and tracer excretion via the intestinal and urinary tract, in contrast, might have influenced 89Zr-trastuzumab uptake in the respective healthy tissues [28]. Different from studies on 111Indium-trastuzumab performed shortly after cardiotoxic anthracycline treatment, in the present study cardiac HER2 expression was not visualized by 89Zr-trastuzumab PET. This was probably due to a receptor expression level that was below the PET-detectable threshold in the unstressed heart of the imaged patient population [29, 30].
The location of the target itself, either in the cell membrane or in the surroundings of the tumor, did not seem to have much influence on the healthy tissue distribution of the four analyzed tracers; 89Zr-bevacizumab, which targets a non-membrane-bound growth factor, showed the same pattern as the other three mAbs that bind to membranous receptors. Besides tumor localized target, circulating target e.g., as soluble receptor or expressed by circulating tumor cells could also influence tracer kinetics. For all four targets, circulating variants have been described, but the impact of this fraction on drug kinetics, however, is unclear [31-34]. Next to the ability of the analyzed mAbs to internalize in tumor cells, which was also indicated for bevacizumab [35], the absolute amount of target expressed, which is largely influenced by overall tumor load, might affect mAb tracer kinetics. In our dataset, however, the proportion of tracer localized at tumor sites was quite low, probably due to the low mean tumor load of the selected patients. At least for trastuzumab, it has been shown previously that tumor load clearly influences tracer and drug kinetics [36].
Tracer distribution in healthy organs might also be influenced by non-target specific factors, such as the amount of tracer available in the blood, as well as metabolism and excretion [37, 38]. Together with the 89Zr-labeled mAb, a dose of unlabeled protein, which had been determined in the previous imaging trials with the respective mAb, was injected. The unlabeled protein dose increases tracer availability over time, which is necessary with mAbs with dose-depending kinetics like trastuzumab [36, 39]. Per tracer, the optimal unlabeled protein dose for baseline imaging was selected to assure comparable activity concentration in the blood of all four tracers over time. However, with all analyzed tracers apart from 89Zr-MMOT0530A, PET imaging has also been performed after administration of pharmacodynamics-active doses or the actual therapeutic dose [15, 16, 40]. Thereby, normal organ distribution was comparable between baseline imaging and on-treatment imaging, whereas tumor uptake changed over time. Next to the unlabeled protein dose, the amount of endogenous neonatal Fc receptor (FcRn) might also influence the circulation time of therapeutic immune globulin G (IgG) molecules by protecting them from fast degradation, resulting in a long half-life of more than 20 days [41, 42]. All four mAbs are IgG1 molecules, so binding specifications to the FcRn are expected to be comparable, potentially explaining the similar biodistribution (Table S2).
Due to their size, monoclonal antibodies like the ones studied here, are metabolized first to peptides and amino acids before being re-used for protein synthesis or excreted via the kidneys [42]. Several target and non-target specific mechanisms, as well as proteolysis by the liver and the reticuloendothelial system, contribute to mAb elimination. Advanced mAb engineering such as glycosylation can increase uptake and metabolism of mAbs by hepatic nonparenchymal Kupffer cells located in the liver, which might explain the relatively higher healthy liver tracer uptake [42, 43]. After elimination, non-used remnants like the radionuclide can be excreted via the intestinal tract or potentially accumulate in compact bone or bone marrow, as visualized by PET. Furthermore, differences in tracer intactness over time might explain the differing uptake in compact bone.
The scientific community is becoming increasingly aware of the many benefits of data sharing [44]. An example of the usefulness of data sharing is provided by the RECIST criteria, which after development have been verified by a warehouse containing data from numerous trials [45]. With this first comparative analysis of four 89Zr-labeled mAb we aimed to create a basis for a prospectively growing warehouse of molecular imaging data of antibody-based tracers that will enable researchers worldwide to enhance and share their knowledge on whole body drug distribution. Therefore, all researchers in the field of molecular imaging are encouraged to add data to this developing warehouse as only expansion of the available data is expected to deliver a valuable long-term gain of knowledge. A short description on how to share or request imaging data are provided in Table S3. We aim to add data from ongoing and planned imaging trials assessing molecules belonging to another IgG subclass, with different molecule size or structure, will be added to this warehouse in the future. Potentially target saturation can occur with higher antibody doses than used for baseline imaging and changes in biodistribution might occur based on repeated therapeutic dosing. Therefore, addition and comparison of biodistribution of the same antibody with varying unlabeled antibody doses for imaging will be of interest as well.
Abbreviations
AMIDE: A medical imaging data examiner; (LD) CT: (Low dose) computed tomography; CUP: Cancer of unknown primary; EANM: European Association of Nuclear Medicine; EARL: EANM Research Ltd; FcRn: Neonatal Fc receptor; HER: Human epidermal growth factor receptor; ID: Injected dose; IgG: Immunoglobulin G; mAb: Monoclonal antibody; PET: Positron emission tomography; SD: Standard deviation; VEGF-A: Vascular endothelial growth factor A; VOI: Volume of interest: 89Zr: Zirconium-89.
Supplementary Material
Supplementary tables and figure.
Acknowledgements
We thank Paul van Snick, Johan Wiegers and Eelco Severs from the Department of Nuclear Medicine and Molecular Imaging, UMCG, for their assistance with PET data reconstruction.
Grant support
Supported by the ERC advanced grant OnQview to E.G.E. de Vries, a personnel grant from the Dutch Cancer Society to F. Bensch (RUG 2014-6625) and the Dutch Cancer Society IMPACT grant (RUG 2012-5565). Financial support for the conduct of the clinical imaging studies was provided by the Dutch Cancer Society, Genentech and F. Hoffmann-La Roche Ltd to the UMCG.
Competing Interests
The UMCG received grants form Roche and Genentech for conduct of the imaging trials. All other authors declare no competing interests.
References
1. Reichert JM. Antibodies to watch in 2016. MAbs. 2016;8:197-204
2. Reichert JM. Antibodies to watch in 2017. MAbs. 2017;9:167-181
3. Reichert JM. Marketed therapeutic antibodies compendium. MAbs. 2012;4:413-415
4. Ecker DM, Jones SD, Levine HL. The therapeutic monoclonal antibody market. MAbs. 2015;7:9-14
5. Long G. The biopharmaceutical pipeline: Innovative therapies in clinical development. Analysis Group, Inc. 2017
6. Lamberts LE, Williams SP, Terwisscha van Scheltinga AG. et al. Antibody positron emission tomography imaging in anticancer drug development. J Clin Oncol. 2015;33:1491-1504
7. Verel I, Visser GW, Boellaard R. et al. 89Zr immuno-PET: comprehensive procedures for the production of 89Zr-labeled monoclonal antibodies. J Nucl Med. 2003;44:1271-1281
8. Dijkers EC, Kosterink JG, Rademaker AP. et al. Development and characterization of clinical-grade 89Zr-trastuzumab for HER2/neu immunoPET imaging. J Nucl Med. 2009;50:974-981
9. Chen DS, Mellman I. Elements of cancer immunity and the cancer-immune set point. Nature. 2017;541:321-330
10. Gebhart G, Lamberts LE, Wimana Z. et al. Molecular imaging as a tool to investigate heterogeneity of advanced HER2-positive breast cancer and to predict patient outcome under trastuzumab emtansine (T-DM1): the ZEPHIR Trial. Ann Oncol. 2016;27:619-624
11. Boellaard R, O'Doherty MJ, Weber WA. et al. FDG PET and PET/CT: EANM procedure guidelines for tumour PET imaging: version 1.0. Eur J Nucl Med Mol Imaging. 2010;37:181-200
12. Boellaard R, Delgado-Bolton R, Oyen WJ. et al. FDG PET/CT: EANM procedure guidelines for tumour imaging: version 2.0. Eur J Nucl Med Mol Imaging. 2015;42:328-354
13. Makris NE, Boellaard R, Visser EP. et al. Multicenter harmonization of 89Zr PET/CT performance. J Nucl Med. 2014;55:264-267
14. Borjesson PK, Jauw YW, de Bree R. et al. Radiation dosimetry of 89Zr-labeled chimeric monoclonal antibody U36 as used for immuno-PET in head and neck cancer patients. J Nucl Med. 2009;11:1828-1836
15. Dijkers EC, Oude Munnink TH, Kosterink JG. et al. Biodistribution of 89Zr-trastuzumab and PET imaging of HER2-positive lesions in patients with metastatic breast cancer. Clin Pharmacol Ther. 2010;87:586-592
16. Oosting SF, Brouwers AH, van Es SC. et al. 89Zr-bevacizumab PET visualizes heterogeneous tracer accumulation in tumor lesions of renal cell carcinoma patients and differential effects of antiangiogenic treatment. J Nucl Med. 2015;56:63-69
17. Lamberts TE, Menke-van der Houven van Oordt CW, Ter Weele EJ. et al. ImmunoPET with anti-mesothelin antibody in patients with pancreatic and ovarian cancer before anti-mesothelin antibody-drug conjugate treatment. Clin Cancer Res. 2016;22:1642-1652
18. Bensch F, Lamberts LE, Smeenk MM. et al. 89Zr-lumretuzumab PET imaging before and during HER3 antibody lumretuzumab treatment in patients with solid tumors. Clin Cancer Res. 2017;23:6128-6137
19. Gaykema SB, Brouwers AH, Lub-de Hooge MN. et al. 89Zr-bevacizumab PET imaging in primary breast cancer. J Nucl Med. 2013;54:1014-1018
20. Loening AM, Gambhir SS. AMIDE: a free software tool for multimodality medical image analysis. Mol Imaging. 2003;2:131-137
21. Kruse V, Mees G, Maes A. et al. Reproducibility of FDG PET based metabolic tumor volume measurements and of their FDG distribution within. Q J Nucl Med Mol Imaging. 2015;59:462-468
22. Deurenberg P, Weststrate JA, Seidell JC. Body mass index as a measure of body fatness: age- and sex-specific prediction formulas. Br J Nutr. 1991;65:105-114
23. Breau RH, Clark E, Bruner B. et al. A simple method to estimate renal volume from computed tomography. Can Urol Assoc J. 2013;7:189-192
24. Prassopoulos P, Daskalogiannaki M, Raissaki M. et al. Determination of normal splenic volume on computed tomography in relation to age, gender and body habitus. Eur Radiol. 1997;7:246-248
25. Nadler SB, Hidalgo JH, Bloch T. Prediction of blood volume in normal human adults. Surgery. 1962;51:224-232
26. Chang K, Pastan I, Willingham MC. Isolation and characterization of a monoclonal antibody, K1, reactive with ovarian cancers and normal mesothelium. Int J Cancer. 1992;50:373-381
27. Hassan R, Bera T, Pastan I. Mesothelin: a new target for immunotherapy. Clin Cancer Res. 2004;10:3937-3942
28. Press MF, Cordon-Cardo C, Slamon DJ. Expression of the HER-2/neu proto-oncogene in normal human adult and fetal tissues. Oncogene. 1990;5:953-962
29. Perik PJ, Lub-De Hooge MN, Gietema JA. et al. Indium-111-labeled trastuzumab scintigraphy in patients with human epidermal growth factor receptor 2-positive metastatic breast cancer. J Clin Oncol. 2006;24:2276-2282
30. de Korte MA, de Vries EG, Lub-de Hooge MN. et al. 111Indium-trastuzumab visualises myocardial human epidermal growth factor receptor 2 expression shortly after anthracycline treatment but not during heart failure: a clue to uncover the mechanisms of trastuzumab-related cardiotoxicity. Eur J Cancer. 2007;43:2046-2051
31. Willett CG, Duda DG, di Tomaso E. et al. Efficacy, safety, and biomarkers of neoadjuvant bevacizumab, radiation therapy, and fluorouracil in rectal cancer: a multidisciplinary phase II study. J Clin Oncol. 2009;27:3020-3026
32. Moreno-Aspitia A, Hillman DW, Dyar SH. et al. Soluble human epidermal growth factor receptor 2 (HER2) levels in patients with HER2-positive breast cancer receiving chemotherapy with or without trastuzumab: results from North Central Cancer Treatment Group adjuvant trial N9831. Cancer. 2013;119:2675-2682
33. Grigoriu BD, Chahine B, Vachani A. et al. Kinetics of soluble mesothelin in patients with malignant pleural mesothelioma during treatment. Am J Respir Crit Care Med. 2009;179:950-954
34. Wakui H, Yamamoto N, Nakamichi S. et al. Phase 1 and dose-finding study of patritumab (U3-1287), a human monoclonal antibody targeting HER3, in Japanese patients with advanced solid tumors. Cancer Chemother Pharmacol. 2014;73:511-516
35. Ashrafi SA, Hosseinimehr SJ, Varmira K. et al. Radioimmunotherapy with 131I-bevacizumab as a specific molecule for cells with overexpression of the vascular endothelial growth factor. Cancer Biother Radiopharm. 2012;27:420-425
36. Oude Munnink TH, Dijkers EC, Netters SJ. et al. Trastuzumab pharmacokinetics influenced by extent human epidermal growth factor receptor 2-positive tumor load. J Clin Oncol. 2010;28:e355-6 e357
37. Kamath AV. Translational pharmacokinetics and pharmacodynamics of monoclonal antibodies. Drug Discov Today Technol. 2016;21:75-83
38. Ryman JT, Meibohm B. Pharmacokinetics of monoclonal antibodies. CPT Pharmacometrics Syst Pharmacol. 2017;6:576-588
39. Bruno R, Washington CB, Lu JF. et al. Population pharmacokinetics of trastuzumab in patients with HER2+ metastatic breast cancer. Cancer Chemother Pharmacol. 2005;56:361-369
40. Gaykema SB, de Jong JR, Perik PJ. et al. 111In-trastuzumab scintigraphy in HER2-positive metastatic breast cancer patients remains feasible during trastuzumab treatment. Mol Imaging. 2014:13
41. Ghetie V, Ward ES. Multiple roles for the major histocompatibility complex class I- related receptor FcRn. Annu Rev Immunol. 2000;18:739-766
42. Keizer RJ, Huitema AD, Schellens JH. et al. Clinical pharmacokinetics of therapeutic monoclonal antibodies. Clin Pharmacokinet. 2010;49:493-507
43. Liu L. Antibody glycosylation and its impact on the pharmacokinetics and pharmacodynamics of monoclonal antibodies and Fc-fusion proteins. J Pharm Sci. 2015;104:1866-1884
44. Rockhold F, Nisen P, Freeman A. Data sharing at a crossroads. N Engl J Med. 2016;375:1115-1117
45. Eisenhauer EA, Therasse P, Bogaerts J. et al. New response evaluation criteria in solid tumours: revised RECIST guideline (version 1.1). Eur J Cancer. 2009;45:228-247
Author contact
![]() Corresponding author: Elisabeth G.E. de Vries, MD, PhD. Department of Medical Oncology, University Medical Center Groningen, P.O. Box 30.001, 9700 RB Groningen, the Netherlands. E-mail: e.g.e.de.vriesnl; Tel.: +31503612821; Fax: +31503614862
Corresponding author: Elisabeth G.E. de Vries, MD, PhD. Department of Medical Oncology, University Medical Center Groningen, P.O. Box 30.001, 9700 RB Groningen, the Netherlands. E-mail: e.g.e.de.vriesnl; Tel.: +31503612821; Fax: +31503614862