Impact Factor
- Issue 14; 2026
- Issue 13; 2026
- Issue 12; 2026
- Issue 11; 2026
- Issue 10; 2026
- Volume 16; 2026
- Advance Articles
- Past Issues
- Cover Images
- Cover Suggestion
- Index & Coverage
- Special Issues
Introduction
Methods
Results
Discussion
Conclusions
Abbreviations
Supplementary Material
Acknowledgements
References
International Journal of Biological Sciences
International Journal of Medical Sciences
 Global reach, higher impact

Theranostics 2018; 8(15):4033-4049. doi:10.7150/thno.24945 This issue Cite
Research Paper
Pharmacokinetics and biodistribution of polymeric micelles containing miRNA and small-molecule drug in orthotopic pancreatic tumor-bearing mice
Virender Kumar1, Vaibhav Mundra1, Yang Peng1, Yingzhe Wang2, Chalet Tan2, ![]() , Ram I. Mahato1,
, Ram I. Mahato1, ![]()
1. Department of Pharmaceutical Sciences, University of Nebraska Medical Center, Omaha, NE 68198, USA
2. Department of Pharmaceutics and Drug Delivery, University of Mississippi, MS 38677, USA
Received 2018-1-15; Accepted 2018-6-5; Published 2018-7-5
Abstract

Rationale: Successful treatment of pancreatic cancer remains a challenge due to desmoplasia and prevalence of KRAS mutation. While hedgehog (Hh) ligand levels are upregulated in pancreatic cancer cells and contribute to desmoplasia, there is significant downregulation of tumor suppressor let-7b, which targets mutant KRAS, C-MYC and several other genes involved in pancreatic cancer progression, invasion, and metastasis. We recently explored combination therapy of GDC-0449 (Hh inhibitor) and let-7b mimic using poly(ethylene glycol)-block-poly(2-methyl-2-carboxyl-propylene carbonate-graft-dodecanol-graft-tetraethylenepentamine) (PEG-b-PCC-g-DC-g-TEPA) micelles in pancreatic tumor mouse model. Here, our objective was to determine the biodistribution (BD), pharmacokinetics (PK), therapeutic efficacy and toxicity of this micellar formulation.
Methods: We determined the PK of micelles encapsulating Cy5.5-let-7b and GDC-0449 following intravenous injection in orthotopic pancreatic tumor-bearing NSG mice at doses of 2 mg/kg and 10 mg/kg, respectively. Mice were scanned for fluorescence by IVIS to determine the biodistribution of Cy5.5-let-7b at the whole-body level, and its concentration in plasma and major organs was determined by measuring fluorescence using a fluorimeter and by real-time RT-PCR. GDC-0449 concentration was determined by LC/MS/MS. Therapeutic efficacy and toxicity of the micellar formulation of let-7b and GDC-0449 was also determined after two weeks of treatment.
Results: The use of a micellar formulation markedly prolonged the elimination half-life (t1/2, e) of Cy5.5-let-7b in plasma from 0.49 ± 0.19 h to 2.65 ± 0.46 h and increased the area-under-the-curve (AUC0-∞) by 7-fold, while t1/2,e and AUC0-∞ of GDC-0449 were increased by 1.78-fold and 3.2-fold, respectively. The micelles significantly decreased the clearance of both encapsulated let-7b mimic and GDC-0449 compared to the emulsion formulation. Compared to the emulsion counterpart, the micellar formulation elevated the delivery of Cy5.5-let-7b and GDC-0449 to the orthotopic pancreatic tumor tissue by 7.8- and 4.2-fold, respectively. Furthermore, there was a significant reduction in tumor volume and negligible systemic toxicity as evident by hematological parameters and histological evaluation.
Conclusion: PEG-b-PCC-g-DC-g-TEPA micelles carrying GDC-0449 and let-7b mimic have great potential to improve drug delivery for pancreatic cancer treatment.
Keywords: pancreatic cancer, let-7b, micelles, GDC-0449, pharmacokinetics, biodistribution
Introduction
Pancreatic ductal adenocarcinoma (PDAC) is surrounded by extremely dense desmoplasia, primarily consisting of pancreatic stellate cells (PSCs), fibroblasts and extracellular matrix (ECM) proteins [1]. Hedgehog (Hh) signaling pathway is implicated in the initiation and progression of PDAC and contributes to desmoplasia [2]. Vismodegib (GDC-0449), a small-molecule Hh inhibitor has been shown to reduce desmoplasia by targeting smoothened (SMO) receptor, and significantly improves the intra-tumoral concentration of anticancer agents [3].
Significant downregulation of let-7b has been reported in PDAC. Let-7b is a tumor suppressor miRNA that reduces the self-renewal ability of cancer stem cells and targets MUC4, KRAS, SMAD4, HMGA2, E-Cadherin, CK-19 and other important genes involved in tumor progression, invasion, metastasis and chemoresistance [4, 5]. However, the delivery of let-7b mimic to pre-established tumors has been shown to exert only limited anticancer efficacy owing to the inability of let-7b to trigger apoptosis in tumor cells [6, 7].
Due to the dysfunction of multiple pathways in most cancers, combination therapies are expected to improve antitumor efficacy [8, 9]. We recently demonstrated significant inhibition of pancreatic tumor growth and metastasis after co-delivery of miR-205 mimic and gemcitabine, as the restoration of miR-205 chemosensitizes GEM-resistant pancreatic cancer cells [10, 11]. Previous studies have shown that sonic hedgehog (SHH) is the downstream effector gene of oncogenic KRAS and its overexpression leads to upregulation of Shh mRNA through NF-κB activation in PDAC. NF-κB binds to the human SHH promoter region and thus activation of NF-κB through KRAS promotes the transcriptional activity of SHH [12]. Further, the KRAS-MEK-ERK cascade is known to noncanonically increase Gli1 transcriptional activity [13]. Dai et al. demonstrated that let-7b restoration sensitizes KRAS mutant tumor cells of various tissue origins to paclitaxel and gemcitabine, suggesting that let-7b mimic has the potential to sensitize resistant tumor cells [14, 15]. We previously demonstrated the synergistic effect of let-7b mimic and GDC-0449 using polymeric micelles in subcutaneous pancreatic tumor-bearing mice [4].
Various nano-delivery platforms, including micelles, liposomes, and nanoparticles have been utilized for delivery of oligonucleotides and small-molecule chemotherapeutic agents [16]. However, nanoformulations encapsulating both anticancer drug(s) and siRNA/miRNA into a single nanocarrier are scarce. Co-delivery systems may ensure similar biodistribution of the drugs and have been shown to exert synergistic antitumor effects. For example, liposomes containing anti-BCR-ABL siRNA and imatinib mesylate, micelles encapsulating doxorubicin and Bcl-2 siRNA, and β-cyclodextrin-functionalized quantum dots containing doxorubicin and mdr1 siRNA were more effective than their monotherapies [17]. However, one of the major challenges in co-delivering nucleic acids and small molecules is their diverse physicochemical properties. Further, several of these carriers have positively charged surfaces, making them readily detectable by the mononuclear phagocyte system (MPS) [18]. Recently, we reported synthesis of poly(ethylene glycol)-block-poly (2-methyl-2-carboxyl-propylene carbonate-graft-dodecanol-graft-tetraethylenepentamine) (PEG-b-PCC-g-DC-g-TEPA). This amphiphilic copolymer self-assembles into micelles capable of encapsulating hydrophilic polyanionic miRNA as well as hydrophobic drugs in their cores. These micelles achieve enhanced stability, sustained release and longer circulation times of unstable hydrophilic miRNA and hydrophobic small-molecule drugs. Since both GDC-0449 and complexed let-7b are present in the hydrophobic core, which is surrounded by PEG shell, this structure may prevent aggregation and impart a high degree of stability and stealth effect, leading to an enhanced mean residence time of the drug and miRNA, which should enhance drug and miRNA delivery to the tumor [19].
Detailed characterization of the pharmacokinetic (PK) profiles of newly developed nanocarrier systems is essential for their clinical success. Dynamic changes and biodistribution of nucleic acids can be studied by several imaging methods including ultrasound, CT, MRI, PET, and SPECT. Recently, epifluorescence measurements in the range of far-red and near-infrared light have been introduced as an alternative to radioactive labeling for non-invasive biodistribution studies [20]. Compared to the tomographic imaging techniques, fluorescence imaging yields quicker results at a lower cost [21].
In this study, we determined the biodistribution, therapeutic efficacy and systemic toxicity of let-7b and GDC-0449 after intravenous injection of their micellar formulation into NSG mice bearing orthotopic pancreatic tumors.
Methods
Reagents
Dodecanol (DC), trimethylamine (TEA), 1-ethyl-3-(3- (dimethylamino)propyl) carbodiimide (EDC), hydroxybenzotriazole (HOBT), 1,8-diazabicyclo[5.4.0]undec-7-ene (DBU), benzyl bromide, 2, 2-bis (hydroxymethyl) propionic acid, methoxy poly (ethylene glycol) (mPEG, Mn = 5000, PDI= 1.03), stannous 2-ethyl hexanoate (Sn(Oct)2) and olomoucine were purchased from Sigma-Aldrich (St. Louis, MO). Tetraethylenepentamine (TEPA) was purchased from Alfa-Aesar (Ward Hill, MA). Cy5.5-let-7b (mature sequence UGAGGUAGUAGGUUGUGUGGUU) was purchased from Invitrogen (Carlsbad, CA). GDC-0449 was purchased from LC Laboratories (Boston, MA). Matrigel matrix basement membrane was procured from Corning (Chicago, IL). All other reagents were purchased from Sigma-Aldrich and used without further purification.
Micelle formulation
Micelles containing Cy5.5-let-7b and GDC-0449 were formulated by film hydration as described previously [22]. Briefly, 10 mg of mPEG-b-PCC-g-DC-TEPA and 0.5 mg of GDC-0449 were dissolved in chloroform and solvent was evaporated using a rotary evaporator, resulting in a thin film, which was then vacuum dried overnight. The film was hydrated with 0.5 mL HEPES buffer (pH 6.5) containing Cy5.5-let-7b and the mixture was vortexed for 2-3 min. This mixture was kept on an orbital shaker for 25 min and centrifuged at 9400 RCF for 5 min. Micelles were characterized for particle size and GDC-0449 loading as described previously [4]. miRNA/polymer complex formation was determined by running the samples on 2% agarose gel and imaging gel by Gel Doc EZ system (Bio-Rad). An emulsion formulation containing GDC-0449 and Cy5.5-let-7b was prepared by mixing 5% dextrose solution containing miRNA, emulsifiers (Cremophore EL 50%, propylene glycol 30%, ethanol 20%), and GDC-0449 at a ratio of 6.5:3.5 [23].
In vivo experiment for BD and PK
All the animal experiments were approved by the Institutional Animal Care and Use Committee (IACUC) of the University of Nebraska Medical Center, Omaha, USA and were carried out as per the NIH animal use guidelines. Male NSG mice (Charles River, 25-30 g, 8-10 weeks) were kept in standard housing. To generate orthotopic pancreatic cancer in NSG mice, animals were anesthetized using Isoflurane, and Luciferase stably expressing MIA PaCa-2 cells (1 × 10⁶) mixed with Matrigel (3:1) were orthotopically injected into the pancreas tail. Tumor size was monitored using an IVIS Spectrum (Xenogen, Caliper Life Sciences, MA) machine after intraperitoneal administration of luciferin (150 μL of 15 mg/mL) to the mice at 6, 12, and 18 days after tumor cell injection. Based on tumor burden, as determined by luciferase expression, mice were divided into 13 groups (n = 4). Six groups of animals were injected with micelles, and the remaining six groups were injected with emulsion formulation containing a dose of 10 mg/kg GDC-0449 and 2 mg/kg miRNA via the tail vein. One group was used as a non-treated control group.
Biodistribution studies by IVIS
After intravenous injection of micelle and emulsion formulations containing Cy5.5-let-7b and GDC-0449, mice were scanned for fluorescence by IVIS at 0.083, 0.5, 1, 4, 24, and 48 h at the excitation and emission wavelengths of 640 nm and 680 nm, respectively, with constant exposure time for all the groups. After whole-body imaging, mice were euthanized, and blood was collected by cardiac puncture in Li-Heparin-containing tubes. Major organs and urine were collected and washed with PBS. Blood samples were processed immediately to obtain plasma by centrifugation at 210 RCF for 10 min, and tissues as well as urine collected were snap frozen in dry ice and stored at -80 °C until further analysis. For ex vivo imaging, tissues were imaged for epifluorescence using IVIS with similar settings of in vivo imaging. The data were normalized by weight of the organ or tissue and expressed as % of the total dose.
Determination of miRNA concentration
Plasma levels of Cy5.5-miR-let7b were determined at predetermined time points. For the assay, an aliquot of the plasma (100 μL) was diluted with PBS to make the final volume 500 μL. Then, methanol (1.00 mL) and chloroform (0.5 mL) were added, and the samples were vortexed for 2 min until a clear, single-phase solution was obtained. Additional 500 µL of water and chloroform each was added to the mixture with vortexing. The mixture was then centrifuged at 500×g for 30 min, and the aqueous phase containing Cy5.5-let-7b was collected. Aqueous phase from micelle formulations was diluted by adding an equal volume of PBS to avoid signal saturation. The fluorescence was measured using a Spectramax M5 multiplate reader (Molecular Devices, CA) at an excitation wavelength of 680 nm and an emission wavelength of 700 nm. A standard curve was generated by spiking 100 µL of plasma aliquots from untreated animals with the formulations containing Cy5.5-let-7b at concentrations ranging from 0 to 20 μg/mL. The mean fluorescence intensity of an aliquot of 50 µL urine was also measured using a fluorometer at the same excitation/emission wavelengths as plasma.
For quantitation of let-7b accumulated in tissues, approximately 50 mg of tissue samples or 30 mg of spleen were homogenized in 1,000 μL triazole using a bead mill. 200 µL of chloroform was added to the homogenized tissue and incubated for 5 min and centrifuged at 18,500 RCF for 15 min. The upper aqueous phase (500 µL) was diluted with equal volume of PBS, and fluorescence was measured using a fluorometer. A standard curve was generated by spiking micelles/emulsion containing known amounts of Cy5.5-let-7b (0-20 μg/mL) in the tissues obtained from non-treated control animals and used to calculate the amount of miRNA present in the samples.
Analysis of GDC-0449
GDC-0449 in plasma and tissue samples was measured using LC/MS/MS. In a 100 µL plasma sample, 20 µL of an Olomoucine aliquot (2.0 µg/mL) was added as an internal standard (IS). Subsequently, 1.0 mL of acetonitrile was added to each sample, followed by vortexing and centrifugation at 18,500 RCF for 10 min, and the supernatant was evaporated to dryness. The residue was reconstituted with 100 μL of acetonitrile: water (65:35, v/v). For biodistribution studies, 50 mg of tissue samples (30-40 mg spleen and heart) were homogenized in 500 µL HPLC grade water and spiked with 20 μL of 5 μg/mL of olomoucine. After that, samples were processed with the same extraction procedure as for plasma samples.
LC/MS/MS data acquisition was performed by using Analyst® software on a QTRAP 4000 mass spectrometer. The separation was achieved on a Shimadzu HPLC, with a Phenomenex C18 column (250 × 4.6 mm, 5 μm) with isocratic elution using 35:65 mobile phase (0.1% formic acid in water: acetonitrile) at 0.8 mL/min flow rate. An injection volume of 10 μL was used for sample analysis by LC/MS/MS. The mass spectrometer was operated in the positively selected reaction monitoring (SRM) for GDC-0449 and IS. The following SRM transitions were monitored: m/z 421.1 → 139.1 for GDC-0449 and m/z 298.34 → 177.084 for Olomoucine [24, 25]. GDC-0449 concentration was calculated using a 1/x2 quadratic regression over a concentration range of 5.0 - 2,500 ng/mL with constant IS.
Pharmacokinetic (PK) analysis
PK parameters were estimated by non-compartmental analysis (NCA) using Phoenix WinNonlin software (version 7.0; Pharsight Corp., Mountain View, CA).
Real-time RT-PCR
The levels of mature let-7b were determined by real-time RT-PCR as described previously [26]. Briefly, total RNA including miRNA was isolated from tumor samples at different time points using RNAeasy isolation kit or miRNeasy mini kit (Qiagen, Valencia, CA). miRNA was reverse transcribed into single-strand cDNA miScript II RT kit. cDNA (1 µL) was mixed with SYBR® Green PCR master mix reagent (Applied Biosystems) using miScript Primer Assays (MS00003122) or Ctr miRTC (Qiagen; MS00000001). Amplification of cDNA was then carried out using a LightCycler 480 machine (Roche). The mature let-7b expression was determined by the ΔΔCT method and normalized to the control, which is the endogenous control in the corresponding samples.
Anticancer activity of GDC-0449- and let-7b-treated mice
Orthotopic pancreatic tumor-bearing NSG mice were randomly divided into 4 groups (n=5). The first group consisted of cancer-bearing mice treated with blank micelles. Second, third and fourth groups correspond to the tumor-bearing mice treated with GDC-0449-loaded micelles, let-7b-complexed micelles, and the micellar formulation of GDC-0449 and let-7b, respectively. Treatment was started when the photon flux reached 1.0 ×10⁷ (p/s/cm2/sr), and a dose of 2 mg/kg of let-7b and 10 mg/kg of GDC-0449 equivalent in micelles were administered via the tail vein on alternating days for two weeks. During the treatment, we monitored mice for morbidity (e.g., marked decrease in body weight, hypothermia), or other conditions requiring euthanasia. The animals were euthanized at one week after the last treatment. Blood, primary tumors, and the vital organs were excised and imaged. Tumor tissues were weighed, halves of these tissues were fixed in formalin for paraffin embedding, and the other halves were snap frozen in liquid nitrogen and stored at -80 °C.
Staining
Tumor sections were stained with hematoxylin and eosin (H&E) to confirm the presence of tumor(s) in each pancreas. Immunostaining for proliferation markers was done using rabbit polyclonal anti-Ki-67 (ab15580; 1:100), Hh pathway activity by anti-Gli-1 (ab151796; 1:250), and KRAS activity by anti-KRAS (ab180772; 1:200) antibodies. Tissue sections were scanned at 40X using iScan HT Slide Scanner (Ventana Medical Systems, Inc., AZ) and representative views of sections are shown.
Treatment-related toxicity
After PK and therapeutic studies, freshly collected plasma (100 µL) was used to determine the liver functions by measuring the levels of alkaline phosphatase (ALP), aspartate aminotransferase (AST), alanine aminotransferase (ALT), and albumin (ALB)/globulin (GLOB) ratio. Levels of these parameters are known to increase due to liver injury/toxicity. Nephrotoxicity was evaluated by measuring blood urea nitrogen (BUN) and creatinine (Cr) levels, while normal kidney functions were assessed by measuring Ca+, Na+, K+, and glucose levels. Sign of a pancreatic disorder was evaluated by measuring amylase (AMY) levels. These biochemical parameters were determined by using Comprehensive Diagnostic Profile kit on a VetScan VS2 (Abaxis North America, Union City, CA).
For histological evaluation, a small chunk of heart, spleen, kidney, lung, and liver (formalin fixed) sections were stained with H&E using standard protocols. Slides were scanned at 40X as above.
Statistical analysis
Results are presented as the mean ± standard deviation (S.D.) (n= 4). Data from distinct groups were compared using Student's t-test. A p-value less than 0.01 was considered to be statistically significant.
Results
We previously demonstrated enhanced antitumor efficacy of a micellar formulation of let-7b mimic and GDC-0449 in mice bearing subcutaneous xenograft pancreatic tumors, compared with micelles carrying either GDC-0449 or let-7b individually. This encouraging finding prompted us to determine the biodistribution and PK profiles of GDC-0449 and Cy5.5-let-7b after intravenous administration of the micellar formulation to orthotopic pancreatic tumor-bearing NSG mice. The doses of Cy5.5-let-7b and GDC-0449 were 2 mg/kg and 10 mg/kg respectively, which were identical to those used in our previous efficacy study [4].
Micelle formulation
The mean particle sizes of drug-loaded micelle and emulsion formulations were 60 ± 15 nm and 80 ± 10 nm, respectively. The polymeric micelles showed a distinct peak on size exclusion chromatography, with a retention time of 6.97 min. The loading efficiency (LE) of 7.5% (w/w) drug-loaded micelles of GDC-0449 was 5.74 ± 0.13%, with an encapsulation efficiency (EE) of 86.61 ± 5.52%. We observed complete complexation of let-7b mimic at a N/P ratio of 16:1 as reported previously [4].
IVIS imaging
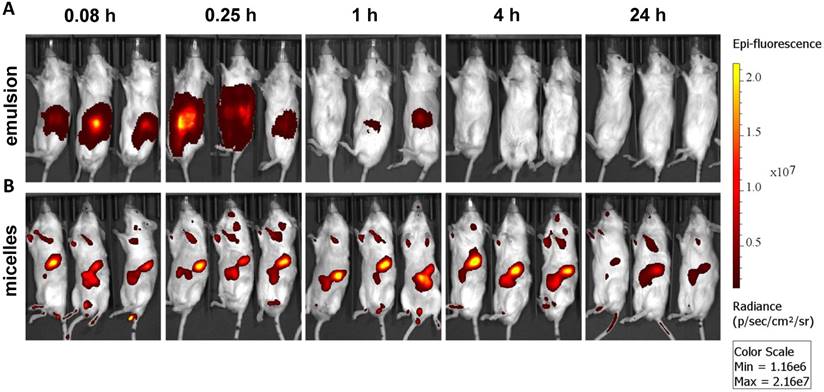
At 21 days after orthotopic implantation of luciferase-expressing MIA PaCa-2 cells in the pancreas, mice were imaged. The mice with photon counts in the range of ~1-2 × 10⁷ p/s/cm2/Sr were randomly divided into separate groups (Figure S1). Micellar or emulsion formulations containing GDC-0449 and Cy5.5-let-7b were injected into the tail vein of mice. Tumor-specific accumulation of Cy5.5-let-7b was assessed by IVIS after intraperitoneal (i.p.) injection of luciferin at 0.5 and 4 h post injection of the formulations. We observed strong signal of CY-5.5 at the tumor region (Figure S2). Mice injected with micelles exhibited fluorescence signal in the tumor region as early as 0.25 h, which peaked at 4 h and significantly diminished at 24 h post-injection (Figure 1). This decrease in fluorescence signal at 24 h can be attributed to miRNA release from the micelles and subsequent elimination. In contrast, the fluorescence signal of emulsion formulation-treated mice was significantly weaker, and no tumor accumulation was observed after 0.25 h post injection (Figure 1).
Real-time biodistribution of Cy5.5-let-7b. Representative bio-distribution of Cy5.5-let-7b in orthotopic pancreatic tumor-bearing NSG mice, with the miRNA administered as an (A) emulsion or (B) micelles. Mice were imaged at different time points up to 24 h using IVIS on their posterior view.
Epifluorescence imaging can be difficult for both precise attribution of the fluorescence signal to exact anatomical sites and absolute signal quantification in whole-body imaging. Therefore, we euthanized mice and excised major organs for ex vivo imaging. Micellar Cy5.5-let-7b was distributed to all the major organs, with higher accumulation in the liver, kidney, and tumor at 4 h (Figure 2). In contrast, Cy5.5-let-7b in the emulsion system showed organ accumulation only at initial time points (0.083-0.25 h) with a rapid decrease in the fluorescence signal reflecting the rapid elimination of Cy5.5-let-7b. Only weak signal remained in the kidney, which is known to be the main site for oligonucleotide excretion via glomerular filtration [27]. The epifluorescence signal quantitation showed that micellar Cy5.5-let-7b accumulated in the tumor to a significantly higher degree than Cy5.5-let-7b in the emulsion formulation at all time-points (Figure S3).
Ex vivo imaging of major organs at 0.083, 0.25, 1, 4, and 24 h post administration of (A) emulsion and (B) micellar formulations of GDC-0449 and Cy5.5-let-7b in orthotopic pancreatic tumor-bearing NSG mice. In case of the emulsion treated mice, strong Cy5.5 signal was only observed in the kidney whereas micelles treated groups were well distributed in the liver, kidney and tumor.
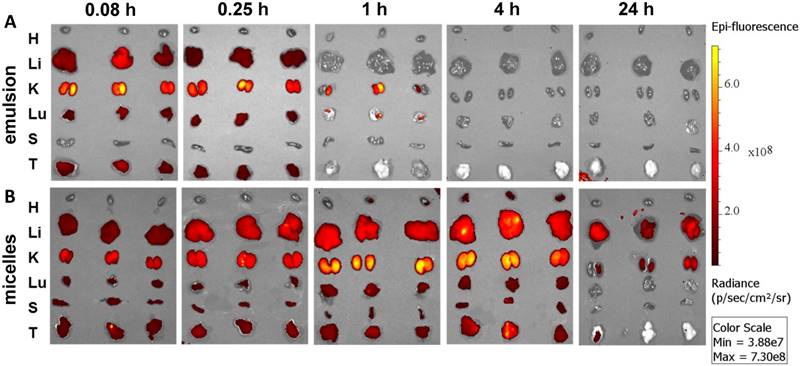
Ex vivo imaging at 1 h and 4 h post administration displayed high fluorescence in the kidneys (Figure 2), which was not captured in whole-animal imaging (Figure 1) owing to their deep location inside the abdominal cavity. Ex vivo imaging allowed the detection of micellar Cy5.5-let-7b in the lungs and spleen at 24 h, but at much lower levels than that in the liver, kidneys, and tumor (Figure 2). Taken together, these results indicate that the micellar delivery system could efficiently prolong the circulation time of Cy5.5-let-7b mimic and enhance tumor exposure.
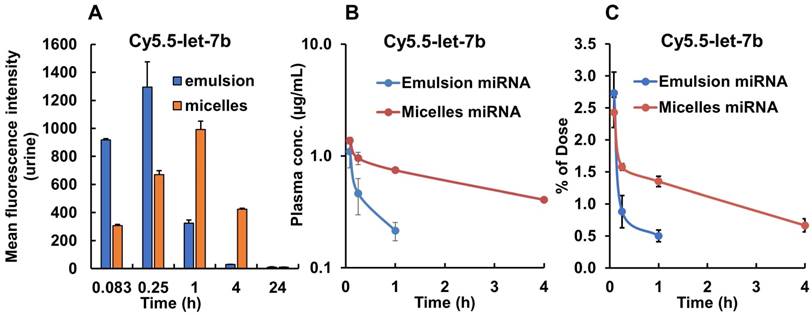
We also measured the fluorescence signal in the urine samples collected from the mouse bladder at each time point. We found that in mice treated with emulsion-formulated Cy5.5-let-7b, strong fluorescence signal appeared in the urine as soon as 5 min post-injection, which peaked rapidly at 0.25 h, whereas urine fluorescence signal increased rather gradually and peaked at 1 h in micelle-treated mice (Figure 3A). Fluorescence signal was undetectable in urine at 24 h in both formulations. These results are consistent with the ex vivo imaging of the kidney and confirm a significant delay in renal excretion of let-7b mimic by the micellar formulation.
Fluorescence intensity of urine samples and plasma concentration of Cy5.5-let-7b after single tail vein injection of emulsion and micellar formulations carrying CY5.5-let-7b and GDC-0449 in orthotopic pancreatic tumor-bearing mice. At indicated time points (0.083-24 h), the mice were euthanized, major organs were harvested, and urine and plasma was collected. (A) Mean fluorescence intensity in urine was determined using a fluorimeter (n=3). (B) Plasma concentration of Cy5.5-let-7b. (C) Percentage of injected dose of Cy5.5-let-7b. Results are represented as the mean ± S.D. (n=4).
Pharmacokinetics and biodistribution of let-7b mimic
We used fluorescence (all organs) and real-time RT-PCR (tumors) to quantify let-7b concentration following IV administration of emulsion and micellar formulations of Cy5.5-let-7b and GDC-0449. Standard curves of fluorescence intensity versus concentration of Cy5.5-let-7b mimic in tissue homogenates and plasma were established to determine let-7b concentration.
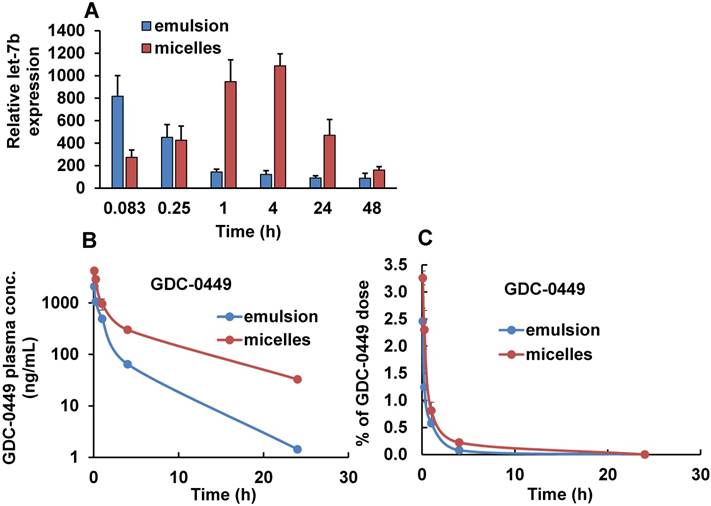
The mean plasma concentration-time profiles of Cy5.5-let-7b after intravenous injection of emulsion and micellar formulations of Cy5.5-let-7b into NSG mice bearing orthotopic pancreatic tumors are shown in Figure 3B. Cy5.5-let-7b in the emulsion formulation exhibited rapid elimination from circulation, resulting in a rapid decline in plasma concentration, which was less than 0.1 µg/mL at 4 h post-administration and below the detection limit afterward. In contrast, intravenous injection of micelles carrying Cy5.5-let-7b resulted in sustained release and its plasma concentration was 407.33 ± 67.98 ng/mL at 4 h post-injection. We observed that more than 1% of the ID of Cy5.5-miR-let7b in micelle-treated mice was still present in the plasma at 4 h, while it was below the quantification limit in emulsion-treated mice (Figure 3C).
Maximal plasma concentration (Cmax), the area-under-the-curve (AUC0-∞), total body clearance (CLT), elimination half-life (t½,e), mean residence time (MRT) and volume of distribution (Vd, Z) were calculated by non-compartmental analysis using Phoenix WinNonlin® (Version 7.0) software. These PK parameters are summarized in Table 1. We observed distinct differences in the PK profiles of Cy5.5-let-7b formulated as emulsion and micelle. Notably, the t1/2, e of micellar Cy5.5-let-7b was 2.65 ± 0.46 h as compared to 0.49 ± 0.19 h for the emulsion formulation, leading to an ~5-fold longer half-life. This increase in half-life by micellar formulation can be attributed to protection of let-7b mimic from enzymatic degradation as well as a decrease in renal clearance. The Cmax of micellar Cy5.5-let-7b and the emulsion formulation were 1374.48 ± 85.17 ng/mL and 1096.71 ± 253.88 ng/mL, respectively. The CLT of Cy5-let-7b was 498.90 ± 83.22 mL/h/kg for the micelle-treated group, but 3613.83 ± 238.54 mL/h/kg for the emulsion-treated mice. Systemic exposure (AUC0-∞) of the micelles encapsulating Cy5.5-let-7b compared to that of the emulsion formulation was ~7-fold higher (4091.26 ± 664.71 versus 555.11 ± 38.09 ng/mL·h). The Vd, Z of Cy5.5-let-7b for the micelles-treated group was markedly lower than that of the emulsion-treated group (1,866.84 ± 45.01 versus 2,569.72 ± 557.91 mL/kg; Table 1), indicating that distribution of Cy5.5-let-7b is more restricted to the circulation when formulated in our polymeric micelles. These results clearly demonstrate the superiority of micelles for miRNA delivery in orthotopic pancreatic mouse models as compared to the emulsion formulation.
Plasma pharmacokinetic parameters of Cy5.5-let-7b and GDC-0449 after intravenous injection of emulsion and mPEG-b-PCC-g-DC-g-TEPA micellar formulations in orthotopic pancreatic tumor-bearing NSG mice. PK parameters were estimated by non-compartmental analysis using Phoenix WinNonlin software. Results are presented as the mean ± S.D. (n=4).
| Cmax (ng/mL) | AUC0-∞ (ng/mL·h) | CLT (mL/h/kg) | t1/2, e (h) | MRT (h) | VZ (mL/kg) | |
|---|---|---|---|---|---|---|
| Cy5-let-7b emulsion | 1096.71 ± 253.88 | 555.11 ± 38.09 | 3613.83 ± 238.54 | 0.49 ± 0.19 | 0.76 ± 0.29 | 2569.72 ± 557.91 |
| Cy5-let-7b micelles | 1374.48 ± 85.17 | 4091.26 ± 664.71 | 498.90 ± 83.22 | 2.65 ± 0.46 | 3.97 ± 0.68 | 1866.84 ± 45.01 |
| GDC-0449 emulsion | 2164.79 ± 161.09 | 1941.46 ± 27.05 | 5151.51 ± 71.67 | 2.94 ± 0.34 | 2.46 ± 0.40 | 21821.39 ± 2445.30 |
| GDC-0449 micelles | 4207.72 ± 312.78 | 6237.79 ± 397.55 | 1598.56 ± 97.42 | 5.24 ± 0.15 | 5.92 ± 0.32 | 12088.16 ± 915.04 |
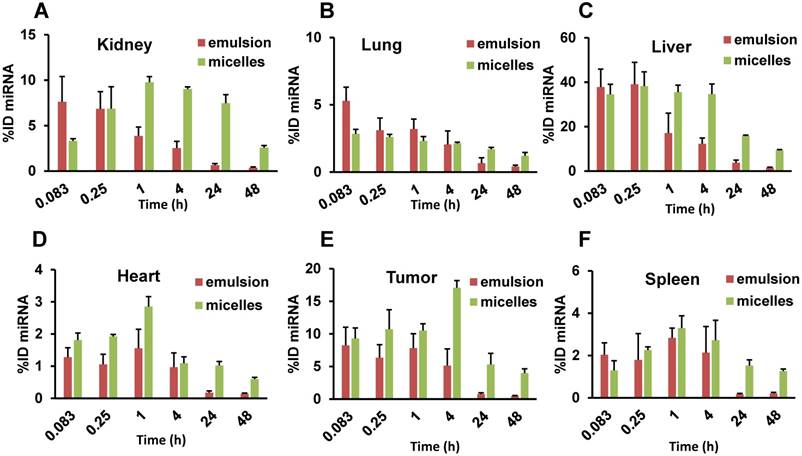
The biodistribution of let-7b mimic in major organs including liver, spleen, tumor, kidneys, lungs, and heart was also quantified. While the whole-body and ex vivo imaging provided qualitative data, let-7b concentration in each tissue was further determined by measuring fluorescence of extracted Cy5.5-labeled miRNA. Mice treated with the emulsion showed higher Cy5.5-let-7b concentration in the liver, kidney, and tumor at initial time points (0.083-0.25 h) with a rapid decline resulting in a low Cy5.5-let-7b signal at 24 h post-injection (Figure 4A). In case of the micellar formulation, Cy5.5-let-7b concentration increased gradually in the liver, tumor, and kidney. At 4 h post-injection, the miRNA concentration for the micelles-treated group was in the following order: liver > tumor > kidneys > spleen > lungs > heart (Figure 4B).
Biodistribution of Cy5.5-let-7b in different organs after single intravenous injection of (A) emulsion and (B) micellar formulations in orthotopic pancreatic tumor-bearing NSG mice. Inset graphs are the same data emphasizing the tumor data that appears in the bar graph. Results are represented as the mean ± S.D. (n=4).
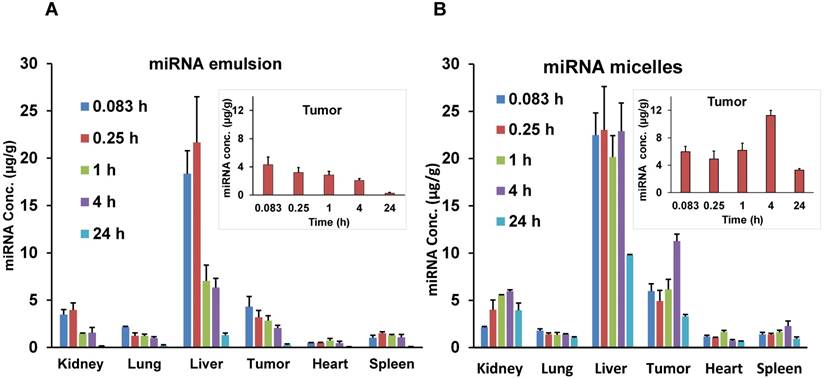
PK parameters for major organs for both emulsion and micelle formulations are summarized in Table 2. In the tumor, there was a 2.6-fold increase in Cmax (11.27 ± 3.3 µg/g versus 4.31 ± 1.8 µg/g) of Cy5.5-let-7b when administered as the micellar formulation. The t1/2 was 2.38-fold higher in the tumor for Cy5.5-let-7b from the micellar formulation compared to the emulsion formulation (16.2 ± 2.6 h versus 6.79 ± 1.2 h). Cy5.5-let-7b AUC0-∞ in the tumor was 7-fold higher for the micelles compared to the emulsion formulation: 255.7 ± 44.2 h·µg/g versus 36.56 ± 9.5 h·µg/g.
Pharmacokinetic parameters of Cy5-let-7b in major organs after intravenous injection of emulsion and mPEG-b-PCC-g-DC-g-TEPA micelle formulations in orthotopic pancreatic tumor-bearing NSG mice. PK parameters were estimated by non-compartmental analysis using Phoenix WinNonlin software. Results are presented as the mean ± SD (n=4).
| Parameter | Kidney | Lung | Liver | Tumor | Heart | Spleen |
|---|---|---|---|---|---|---|
| emulsion | ||||||
| Cmax (µg/g) | 3.95 ± 0.2 | 2.15 ± 0.18 | 21.65 ± 7.9 | 4.31±1.8 | 0.73 ± 0.35 | 1.5 ± 0.4 |
| Tmax (h) | 0.25 ± 0.1 | 0.083 ± 0.01 | 0.25 ± 0.1 | 0.083 ± 0.01 | 0.083 ± 0.1 | 0.25 ± 0.1 |
| AUC0-∞ (µg/g·h) | 26.09 ± 6.4 | 18.55 ± 3.6 | 129.19 ± 26.1 | 36.56 ± 9.5 | 7.89 ± 1.6 | 16.87 ± 2.3 |
| t1/2, e (h) | 6.77 ± 2.1 | 8.28 ± 2.3 | 9.17 ± 1.9 | 6.79 ± 1.2 | 6.5 ± 1.7 | 5.62 ± 0.8 |
| micelles | ||||||
| Cmax (µg/g) | 5.96 ± 1.6 | 1.79 ± 0.4 | 23.02 ± 10.2 | 11.27 ± 3.3 | 1.07 ± 0.5 | 2.28 ± 0.2 |
| Tmax (h) | 4 ± 0.6 | 0.083 ± 0.01 | 0.25 ± 0.01 | 4 ± 1.2 | 1 ±0.3 | 1 ± 0.2 |
| AUC0-∞ (µg/g·h) | 355.95 ±133.2 | 104.1 ± 26.3 | 690.39 ± 139.3 | 255.7 ± 44.2 | 39.07 ± 12.5 | 69.2 ± 15.2 |
| t1/2, e (h) | 41.3 ± 6.1 | 49.42 ± 10.5 | 19.6 ± 5.7 | 16.2 ± 2.6 | 22.86 ± 6.8 | 22.0 ± 11.2 |
miRNA was quantitated in each tissue, and the percent of injected dose (%ID) in the whole organ was calculated, as shown in Figure 5 and Supplementary Table 1. For the emulsion formulation, the tumor showed highest %ID (9.38 ± 3.32%) at 0.083 h and decreased gradually to 4.92 ± 2.39% at 4 h. At 24 h, miRNA %ID reduced to <1% (0.62 ± 0.37%). In contrast, when miRNA was delivered in micelles, %ID increased gradually with the highest value of 17.08 ± 1.11% observed at 4 h. Interestingly, the %ID was 5.32 ± 1.69% at 24 h, which recapitulates the above results from the IVIS experiment and plasma PK parameters where we observed an increase in t1/2,e of let-7b mimic by the micellar formulation.
Percentage of injected dose (ID) of Cy5.5-let-7b in (A) kidney, (B) lung, (C) liver, (D) tumor, (E) heart, and (F) spleen after intravenous administration of emulsion or micellar formulations of Cy5.5-let-7b and GDC-0449 in orthotopic pancreatic tumor-bearing NSG mice. Results are represented as the mean ± S.D. (n= 4).
Since oligonucleotides are highly susceptible to degradation by serum ribonucleases, the observed fluorescence may come from degraded Cy5.5-labeled let-7b fragments rather than intact Cy5.5-let-7b molecules. Therefore, we carried out real-time RT-PCR to quantify the full-length let-7b in the tumor samples at each time point in treated and untreated mice. Untreated tumor samples were used to normalize the miRNA concentrations. Overall there was a good agreement between the fluorescence measurement (Figure 4) and RT-PCR results (Figure 6A), indicating that the distribution and fate of Cy5.5-let-7b observed with IVIS and a fluorimeter do reflect the in vivo behavior of intact let-7b.
Tumor distribution of Cy5.5-let-7b determined by real-time RT-PCR and plasma concentration of GDC-0449 after single injection of emulsion and micellar formulations of Cy5.5-let-7b and GDC-0449 in orthotopic pancreatic tumor-bearing NSG mice. (A) Relative let-7b levels in tumors at different time points. Results are represented as the mean ± S.D. (n=3). (B) Plasma concentration of GDC-0449. (C) Percentage of injected dose of GDC-0449. Results are represented as the mean ± S.D. (n=4).
Pharmacokinetics and biodistribution of GDC-0449
We also determined the plasma and organ PK profiles of GDC-0449 following intravenous injection of the emulsion and micelle formulations for the co-delivery of GDC-0449 and Cy5.5-let-7b. A validated LC-MS method was used for the quantitative analysis of GDC-0449 in the samples. Linearity in the standard curves was observed over the concentration range of 50-2000 ng/mL, with no interference from the plasma components in the chromatograms. For both treatment groups, GDC-0449 was rapidly eliminated from the circulation and distributed to all major organs after systemic administration, with higher accumulation in the liver (Figure 6B and Figure 7). We observed a sharp decline in the %ID of GDC-0449 for both formulations. However, at 4 h post-injection ~0.2 %ID of GDC-0449 in plasma was detected for micelles, but only 0.08% in the emulsion-treated group (Figure 6B).
Biodistribution of GDC-0449 in different organs after single intravenous injection. (A) Emulsion, and (B) micellar formulations in orthotopic pancreatic tumor-bearing NSG mice. Inset graphs are the same data emphasizing the tumor data that appears in the bar graph. Results are represented as the mean ± S.D. (n=4).
Non-compartmental analysis was used to determine the PK parameters of GDC-0449 Table 1. Peak plasma concentration (Cmax) of GDC-0449 was 2-fold higher for the micelles-treated group than that of the emulsion-treated group: 4207.72 ± 312.78 versus 2164.79 ± 161.09 ng/mL. Administration of GDC as micelles led to an increase in the t1/2 of GDC-0449 by ~2-fold (5.18 ± 0.3 h versus 2.94 ± 0.34 h) and decreased in the CLT by 3.2-fold (1598.56 ± 97.42 versus 5151.51 ± 71.67 mL/h/Kg). Similarly, the AUC0-∞ value of GDC-0449 was 3.2 times higher for the micelle formulation than the emulsion treated group: 6237.79 ± 397.55 versus 1941.46 ± 27.05 ng/mL·h. We observed a 2.4-fold increase in MRT of GDC-0449 in micelles-treated mice as compared to the emulsion-treated group (Table 1).
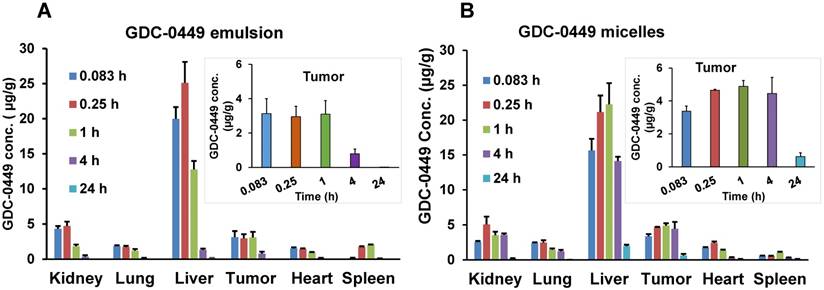
Biodistribution of GDC-0449 in major organs like liver, spleen, tumor, kidneys, lungs, and heart was also determined, and results are shown in Figure 7. At the initial time point post-injection (0.083 h), higher GDC-0449 concentrations in the emulsion-treated group were found in the liver, kidney, and spleen compared to the micelles-treated group. Overall, heart, lung, and spleen showed the lowest drug deposition among the organs analyzed, which also dropped slowly with time. However, we did not observe a significant difference in concentrations between the emulsion- and micelles-treated groups in these organs. For the emulsion formulation, GDC-0449 accumulation in the kidney was high at two early time points and then showed a sharp decline, whereas in the micelles-treated group, GDC-0449 accumulated slowly in the kidney and persisted up to the 4 h time point. As expected, GDC-0449 accumulation in the liver was remarkably higher than other organs for both formulations. However, the liver concentration increased overtime in the micelle-treated group, whereas it declined with time in case of the emulsion group. GDC-0449 accumulated continuously at the tumor site with the highest observed concentrations 4 h post-injection, then decreased gradually, but still detectable for up to 24 h post injection.
Major organ PK parameters for GDC-0449 are listed in Table 3. For the micelles-treated group, there was a significant increase in t½ and AUC0-∞ of GDC-0449 in all organs except the lung compared to the emulsion-treated group. Although no significant difference was observed in Cmax with micelles, the AUC0-∞ of GDC-0449 in the liver (255.03 ± 39.3 vs. 56.18 ± 11.8 h‧µg/g) and tumor (75.9 ± 11.2 vs. 16.81 ± 3.5 h‧µg/g) was significantly increased when the mice were treated with the micellar formulation.
Pharmacokinetic parameters of GDC-0449 in major organs after intravenous injection of emulsion and mPEG-b-PCC-g-DC-g-TEPA micelle formulations in orthotopic pancreatic tumor-bearing NSG mice. PK parameters were estimated by non-compartmental analysis using Phoenix WinNonlin software. Results are presented as the mean ± S.D. (n=4).
| Parameter | Kidney | Lung | Liver | Tumor | Heart | Spleen |
|---|---|---|---|---|---|---|
| emulsion | ||||||
| Cmax (µg/g) | 4.72 ± 0.2 | 1.86 ± 0.18 | 25.11 ± 7.9 | 3.13 ± 1.8 | 1.54 ± 0.35 | 2.1 ± 0.5 |
| Tmax (h) | 0.25 ± 0.06 | 0.083 ± 0.01 | 0.25 ± 0.04 | 0.083 ± 0.01 | 0.083 ± 0.01 | 0.083 ± 0.01 |
| AUC0-∞ (µg/g·h) | 10.51 ± 3.4 | 5.10 ± 1.7 | 56.18 ± 12.6 | 16.81 ± 3.5 | 4.58 ± 1.6 | 5.9 ± 2.3 |
| t1/2, e (h) | 2.75 ± 2.1 | 2.25 ± 4.3 | 3.92 ± 0.9 | 2.23 ± 0.2 | 2.74 ± 0.7 | 1.88 ± 0.8 |
| micelles | ||||||
| Cmax (µg/g) | 5.07 ± 1.6 | 2.47 ± 0.4 | 22.26 ± 10.2 | 4.89 ± 1.3 | 2.43 ± 0.5 | 1.04 ± 0.2 |
| Tmax (h) | 0.25 ± 0.03 | 0.25 ± 0.04 | 1 ± 0.01 | 1 ± 0.09 | 0.25 ± 0.01 | 1 ± 0.03 |
| AUC0-∞ (µg/g·h) | 53.79 ± 13.2 | 18.55 ± 5.6 | 255.03 ± 41.3 | 75.9 ± 11.2 | 9.6 ± 2.5 | 8.4 ± 1.5 |
| t1/2, e (h) | 5.21 ± 1.1 | 3.0 ± 0.5 | 6.7 ± 0.7 | 7.46 ± 0.6 | 6.68 ± 0.8 | 9.14 ± 1.2 |
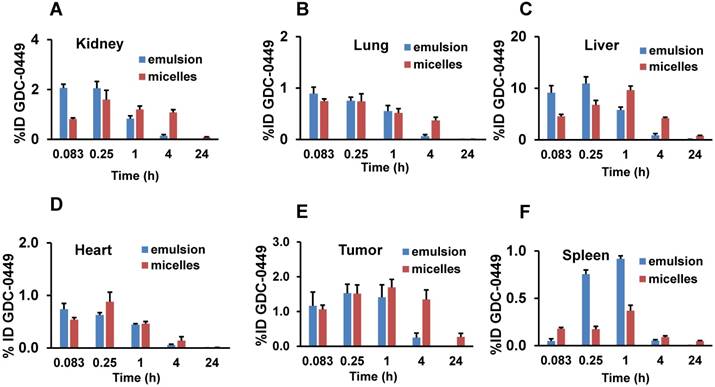
The %ID of GDC-0449 in major organs are shown in Supplementary table 2. Liver, tumor, and kidney showed the highest %ID of GDC-0449 accumulation for both the formulations (Figure 8). At the initial time points (0.083 and 0.25 h), liver and kidney accumulated ~10 and 2 %ID in the emulsion-treated group, which decreased to 0.82 ± 0.1 and 0.14 ± 0.05 %ID at 4 h post-injection. On the other hand, micelles showed 4.8-7.1%ID in the liver, and 0.8-1.6 %ID in the kidney at the initial two time points. At the 4 h time point, GDC-0449 accumulation in the liver and kidney was 4.27 ± 0.19, and 1.08 ± 0.3 %ID for the micelles-treated group, showing prolonged accumulation. The tumor showed a non-significant difference in GDC-0449 accumulation at the initial 0.083-1 h time points between micelles and emulsion formulations, but a significantly higher GDC-0449 concentration was found at 4 h post-injection (1.34 ± 0.27 vs. 0.37 ± 0.13 %ID) in the micelles-treated group compared to the emulsion-treated group. In the kidney, the highest %ID of GDC-0449 was observed at 0.083 h (2.06 ± 0.15) in the emulsion group, and then there was a gradual decline from 0.25 h to 4 h post administration.
Percentage of injected dose (ID) of GDC-0449. (A) Kidney, (B) lung, (C) liver, (D) tumor, (E) heart, and (F) spleen after intravenous administration of emulsion and micellar formulations of Cy5.5-let-7b and GDC-0449 in orthotopic pancreatic tumor-bearing NSG mice. Results are represented as the mean ± S.D. (n=4).
Antitumor activity
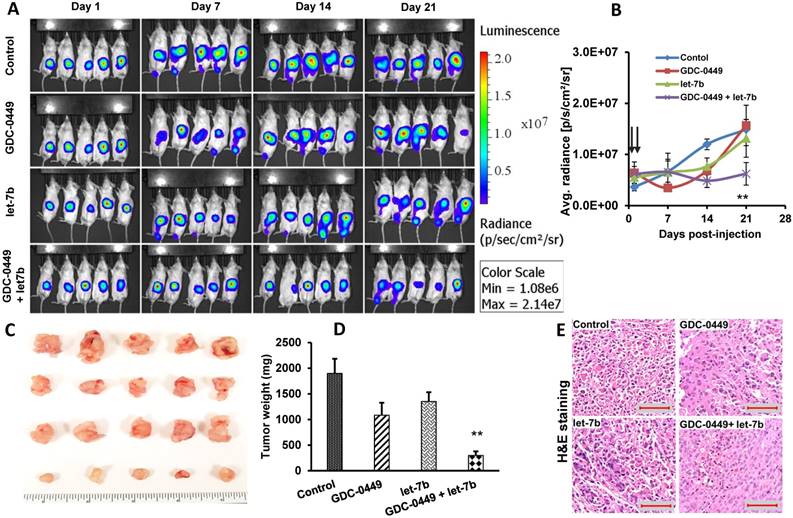
We did not observe a reduction in mean body weight (MBW) or treatment-associated morbidity in mice, indicating that micellar formulations of both drugs were well tolerated. We observed that 4/5 mice in the control group, two each from GDC-0449 and let-7b groups, and none of the combination treated group developed ascites in their peritoneal cavity. The treatment groups had reduced size and weight of the primary tumors compared to the control group. Among treatment groups, combination of GDC-0449 and let-7b significantly decreased tumor growth. Representative IVIS images of mice during the treatment, and tumor size post treatment are shown in Figure 9A. Quantification of bioluminescence signal from distinct groups is presented in Figure 9B and tumor size measured one-week post treatment is shown in Figure 9C-D. H&E staining revealed that control MiaPaCa-2 cell xenografts exhibited an un-differentiated pattern (Figure 9E).
MIA PaCa-2 cells were injected in the tail of the pancreas of NOD SCID gamma (NSG) mice to evaluate the effects of GDC-0449 and let-7b micelles. (A) Bioluminescence at different times. (B) Quantitative analysis of IVIS signal intensity (photons/sec/cm2/steradian) over time after injection. (C) Isolated tumor pictures. (D) Tumor weight. (E) H&E staining. Control MIA PaCa-2 cell xenografts exhibited an un-differentiated pattern by histology (Scale bar 100 µm). *, P<0.01 between treatment groups and control groups; n = 5 mice for each group.
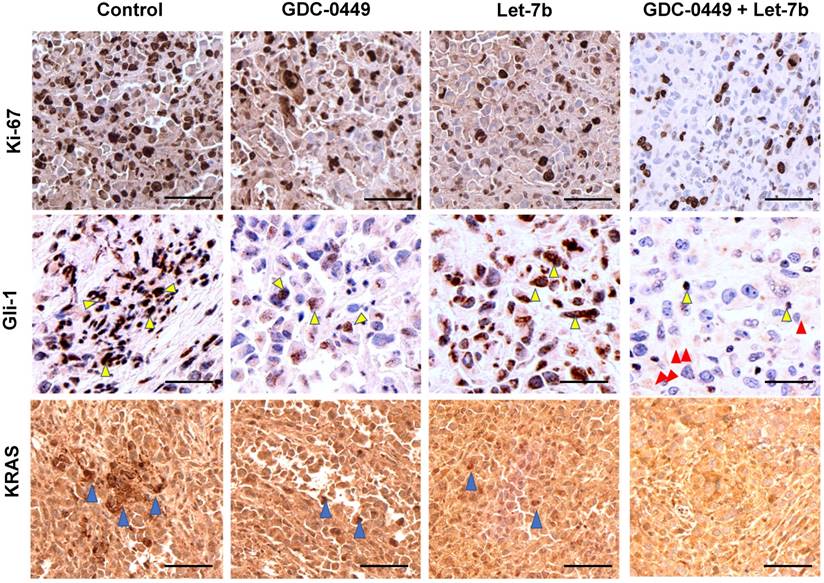
Ki-67 staining represents the vital areas of the tumors and is a marker of proliferation. Ki-67 staining showed marked differences between different treatment groups. Tumors treated with the micellar formulation of GDC-0449 and let-7b revealed reduced Ki-67-positive cells compared to the non-treated or single drug-treated animal groups (Figure 10A). GLi-1 is the effector transcription factor of Hh signaling that drives cancer progression. We assessed the degree of Gli-1 activation in tumors via IHC. We found that Gli-1 was strongly upregulated in the tumor tissue of the control group compared to the group treated with the micellar formulation of GDC-0449 and let-7b (Figure 10B). Gli-1 staining was the least positive in the GDC-0449 and let-7b combination treatment group. We have previously demonstrated that KRAS is one of the target mRNAs of let-7b. We next evaluated levels of KRAS in various tumor tissues. Similar to the above results, GDC-0449 and the combination treatment group showed loss of KRAS signaling in the tumors (Figure 10C).
IHC staining. After treatment tumor tissues were stained with (A) Ki-67, (B) Gli-1 (Yellow arrows show staining in the nucleus and red arrows show Gli-1 staining in cytoplasm), and (C) KRAS (Blue arrows). Sections were scanned at 40X using iScan HT Slide Scanner. Scale bar 10 µm.
Blood biochemical parameters
Considering that cationic micelles may cause acute systemic toxicity, hematological parameters of orthotopic pancreatic tumor-bearing NSG mice were determined after a single injection of micelle and emulsion formulations carrying GDC-0449 and Cy5.5-let-7b, and after completion of the therapeutic study. As shown in Supplementary table 3, Figure S5 A&B, animals injected with the micelle and emulsion formulations showed no statistically significant changes in their biochemical parameters compared to the tumor-bearing non-treated control mice. Further, we observed no obvious changes in serum albumin (ALB) and alanine aminotransferase (ALT), but a slight increase in alkaline phosphatase (ALP) levels, which is non-significant and indicates no cell membrane injury or tissue damage to the liver for the treated groups compared to the control group. No change in the concentration of creatinine, a biochemical marker of kidney damage, was observed in treated animals. However, exposure to the micelles resulted in a slight but not significant decrease in the concentration of circulating urea and potassium. Electrolytes Ca+, Na+, and glucose levels had no change from the control animals, indicating normal kidney functions. Sign of any pancreatic toxicity was evaluated by determining amylase (AMY) levels: increased AMY levels were found in the emulsion-treated group; however, the difference between the control and treated animals was insignificant. Blood clinical chemistry analysis demonstrated that GDC-0449- and let-7b-loaded mPEG-PCC-g-TEPA-g-DC micelles at the used dose did not show any acute toxicity to the vital organs (Figure S5B).
Histological parameters
Next, we investigated and compared the pathological changes in mouse vital organs such as heart, liver, spleen, lung and kidney among the groups at 48 h post administration of micelles in PK and post-therapeutic studies. H&E staining was performed to investigate whether there are any pathological changes due to the treatment. Figure S6 and Figure S7 are representative micrographs of H&E staining, which indicate that the formulations did not cause any noticeable damage or inflammation to these organs. No disorders or overt, concomitant signs of toxicity were observed. Further, there was no evidence of immune cell infiltration in any of these organs of the mice treated with the micelle formulations of GDC-0449, let-7b or their combination.
Discussion
This study presents biodistribution, therapeutic efficacy and toxicity profiles after systemic administration of co-formulated polymeric micelles of polyanionic hydrophilic miRNA let-7b and small molecule hydrophobic drug GDC-0449 into orthotopic pancreatic tumor-bearing NSG mice, and the results were compared with those of mice treated with emulsions carrying these miRNA and drug.
Various reports suggest the benefits of nanocarriers compared to free drug/miRNA in terms of delivery efficiency and for enhanced accumulation in the tumor. However, most of the current nanoparticle platforms can deliver either small molecules or oligonucleotides but are rarely used for their co-delivery. Nanocarriers capable of carrying both small molecules and oligonucleotide are not only rare, but they are also not thoroughly investigated for their in vivo PK and biodistribution properties. Previously, we developed nanocarriers capable of carrying small molecules and miRNA simultaneously and evaluated their efficacy in a subcutaneous tumor model, and a common bile duct ligation (CBDL)-induced liver fibrosis model [4, 22]. The potential challenges associated with NPs include rapid clearance of the particles by the MPS, vehicle-related cytotoxicity, and elicitation of cytokine response due to activation of toll-like receptors (TLRs) [28]. However, some of these limitations can be addressed by the rational design of the polymer/carrier. For instance, PEG molecule on the surface of the nanocarriers and particle size below 100 nm can decrease serum protein adsorption and prevent MPS recognition, endowing the nanocarriers with longer circulation time [29]. The micelles used in this study were 60-70 nm in size and their surface was decorated with PEG, making them suitable for extended circulation and increasing the chance of high accumulation in the tumor.
By whole-body fluorescence imaging, mice injected with the emulsion containing Cy5-let-7b and GDC-0449 showed Cy5.5 signal-positive areas only at initial time points, suggesting that the miRNA rapidly cleared from the tissues. In contrast, mice treated with micelles carrying Cy5-let-7b and GDC-0449 showed significant fluorescence signal co-localized with tumor (tumor location was confirmed by luciferase expression) (Figure S1), and signals increased with time post-injection (Figure 1 and Figure 2), indicating tumor accumulation of micelles. Renal excretion remained the major route of miRNA excretion and free miRNA in the emulsion was cleared rapidly from the system and appeared immediately in the urine, resulting in no accumulation in the major organs (Figure 3A). After i.v. injection of free miRNA, a high Cy5.5 signal appeared in the urine at the first time point, which is in line with previous reports showing high signals in the bladder at as early as 3 min and reaching a peak level between 5 and 10 min [30]. In the micelles-treated mice, a high Cy5.5 signal appeared in the urine at 1 h post injection and persisted until 4 h. We observed low renal excretion at the initial time points due to reduced uptake of large molecules by the kidneys when using nanocarrier-formulated miRNAs [31]. However, previous studies have also shown that most cationic polymer-based oligonucleotide delivery systems get dissembled in the kidney as the glomerular basement membrane is rich in polyionic heparin sulfate [32]. Therefore, we observed strong Cy5.5 signal in the kidneys of the micelles-treated group at 1 h and 4 h time points. A typical biphasic blood circulation profile was observed for both the micellar and emulsion formulations-treated groups (Figure 3B). However, due to the sustained release and protection from nuclease degradation of miRNA when complexed with the cationic lipid chains of the micelles, we observed higher %ID of micellar Cy5-let-7b in the blood up to 24 h (Figure 3C).
An understanding of the distribution of micelles in vital organs is crucial for understanding normal tissue tolerance, and secondary organ toxicities [33]. The tissue(s) levels of Cy5.5-let-7b and GDC-0449 were measurable at all-time points monitored, from 5 min up to 24 h after dosing. As kidneys are located deep inside the body, their fluorescence was undetectable in the whole-animal imaging [34]. We observed the highest Cy5.5 signals in the liver, spleen, kidney, and tumor (Figure 4). Similarly, a higher concentration of GDC-0449 (0.002-28 µg/mg tissue) in micelles was observed in the liver, kidney, and tumor, whereas relatively lower levels (<1 µg/mg tissue) of GDC-0449 were observed in heart, lung, and spleen (Figure 7). Liver, spleen, and kidney are highly perfused organs and contain fenestrae or endothelial structures allowing large particles to cross from the bloodstream into the organs' interstitium, justifying drug accumulation in these organs [35]. In contrast, high uptake of micelles in the tumor is due to its enhanced angiogenesis and undeveloped vasculature, resulting in high permeability that allows entry of nanoparticles (up to 200 nm). At 4 h post-injection, fluorescence was higher in the tissues than in the blood, indicating slow clearance from the organs. Quantitative measurement of the fluorescence signal in isolated tissues further confirms the above imaging results, suggesting the micelles could selectively increase drug accumulation in these organs (Figure S3).
The preclinical PK profiles of a formulation often serve as an early assessment of its potential success in the clinic. We performed PK studies for Cy5.5-miR-let7b and GDC-0449 co-formulated in micelles and their formulation in the emulsion was used as control (Table 1). Both miRNA and GDC-0449 showed improved preclinical PK properties when injected as micelles. Both had low plasma clearance (6-fold for miRNA and 3-fold for GDC-0449), increased AUC0-∞ (4-fold for miRNA and 3-fold for GDC-0449), and increased MRT (2.2-fold for miRNA and 2.2-fold for GDC-0449) compared to the emulsion-treated group. Further, these results are in agreement with the previous findings, where micelles provided slightly longer sustained release and increased MRT of encapsulated drugs [36, 37]. Amphiphilic polymeric micelles can reduce drug uptake by the kidney. However, kidney exposure of miRNA (5.6-fold) and GDC-0449 (5-fold) in the micelles-treated group was higher than that of the emulsion-treated group, which indicates that both drugs were excreted primarily through the kidneys but slowly. The delayed appearance of miRNA in the urine of micelles-treated mice indicates that this formulation only delayed their elimination but did not modify the elimination route of miRNA. However, GDC-0449 is not known to be significantly eliminated through the kidney [37]. The increased AUC0-∞ of GDC-0449 in kidney indicates that micelles increased GDC-0449 availability to the glomerular basement membrane (GBM) and enhanced its Cl through the kidney [38]. Interestingly, Cl and Vd values for both miRNA and GDC-0449 in micelles were lower than those for free emulsion, while the mean residence time was 2-fold higher. The probable reasoning could be sustained release of drugs into circulation upon micellar formulation, resulting in decreased Vd [39], rather than the particle size difference between these formulations (Figure S4). These conclusions are also supported by our previous report, where micelles showed sustained drug release and high kinetic stability in the presence of serum [4].
Determination of the guide strand concentrations by real-time RT-PCR suggests that the miRNA was in its intact form in micelles until 24 h. However, the fluorescence measurement showed very weak signal at 24 h post administration. The reason for these observations could be the sensitivity difference between the two techniques. Real-time RT-PCR technique is more sensitive than the fluorescence methods. Therefore, significantly higher levels of the parent guide strand of miRNA could be determined in the tumor up to 24 h post injection of the micelle formulation by real-time RT-PCR (Figure 6A).
After observing an increase in drug exposure by micelles, we wanted to determine if micelles can deliver effective concentrations to the tumor and provide therapeutic benefits. GDC-0449 and let-7b micelles exhibited the best therapeutic efficacy for pancreatic cancer. We observed significant decreases in the silencing of target genes (Gli-1 and KRAS) specifically in the combination treatment group. This might be attributed to the improved profile of GDC-0449 and let7b by micelles, increasing the amount of drug deposited in the tumor (Figure 9 and Figure 10). These observations are in line with our previous study, which showed that GDC-0449 reduces proliferation and induces apoptosis of tumor cells via a Gli-1-dependent manner and chemosensitizes them to anti-KRAS miR-let-7b [4].
Exogenous gene silencing molecules can result in cellular toxicity due to non-specific off-target effects including activation of the immune system. Recently, a miRNA-based Phase 1 study was halted due to multiple immune-related severe adverse events (SAE) observed in patients dosed with MRX34 over the course of the clinical trial. Therefore, we determined the therapy-related toxicity after i.v. injection of micelles carrying let-7b and GDC-0449 at 2 mg/kg and 10 mg/kg doses, respectively. In both single and multiple-dose studies, general toxicity parameters did not reveal any systemic changes by the micelles (Figure S5). Hematological parameters were within the normal range, and there was no statistically significant change in animals exposed to micelle and emulsion formulations when compared to the controls. There was a slight decrease in the concentration of circulating glucose and sodium ions. Levels of calcium and amylase were slightly increased for emulsion-treated mice. All other parameters in hematology or clinical chemistry showed no statistically significant changes. Further, to determine the potential side effects of miR-let-7b and GDC-0449-loaded micelles, we performed histologic examinations of major organs (liver, lung, heart, kidney, and spleen) by H&E staining. As shown in Figure S6 and Figure S7, the formulations were well tolerated and did not show any signs of organ toxicity such as ballooning degeneration of hepatocytes, increased alveolar wall thickness and cellular infiltration in the lung, myocardial fibrillar loss and vacuolation in heart tissues, edema, tubular vacuolization with hemorrhagic areas in the kidney, or increased numbers of granulocytes in the spleen.
Our findings here provided us with an excellent picture of the biodistribution and anti-cancer efficacy of let-7b and GDC-0449 when co-formulated in micelles and administered systemically in orthotopic pancreatic tumor-bearing mice. Our results suggest that our formulation can be used as a drug delivery platform to overcome the limitations and adverse effects of gene and anticancer drug delivery.
Conclusions
In conclusion, the micelles controlled the biodistribution of Cy5.5-let-7b and GDC-0449 by significantly reducing renal clearance and increasing circulation time in plasma. We have demonstrated here that the fluorescence labeling method for oligonucleotides is applicable for preclinical PK studies of unformulated and micellar formulated miRNAs. Our results showed that the micellar co-delivery system could accumulate efficiently in the tumor, and more importantly both the encapsulated drugs showed similar biodistribution patterns when injected as micelles. Micelles loaded with GDC-0449 and let-7b showed high tumor regression compared to single drug-loaded micelles. Micellar formulation of GDC-0449 and let-7b could improve therapeutic efficacy in vivo by increasing intracellular drug concentrations. Although our toxicity and immunostimulatory tests are quite encouraging, additional studies including long-term toxicology and safety studies will be needed to take this potential delivery system to the next level of drug development.
Abbreviations
ALP: alkaline phosphatase; ALT: alanine aminotransferase; AST: aspartate aminotransferase; AUC0-∞: area under the curve 0 to infinity; BUN: blood urea nitrogen; Cl: total body clearance; ECM: extracellular matrix; GBM: glomerular basement membrane; IVIS: in-vitro imaging system; miRNA: microRNA; MRT: mean residence time; PDAC: pancreatic ductal adenocarcinoma; PEG: poly(ethylene glycol); PK: pharmacokinetic; RES: reticuloendothelial system; SEC: size exclusion chromatography; Shh: Sonic hedgehog; SMO: smoothened; SRM: selected reaction monitoring; Vd: volume of distribution.
Supplementary Material
Supplementary figures and tables.
Acknowledgements
The National Institutes of Health (1R01GM113166) and the Faculty Start-up fund University of Nebraska Medical Center are duly acknowledged for providing financial support for this work.
Author Contributions
V. K. and R. M. designed the study. V.K., V.M. and P.Y performed the implantation surgeries and collected data. V.K., C.T. R.M. analyzed the data and wrote the manuscript. All authors gave their final approval.
Competing Interests
The authors have declared that no competing interest exists.
References
1. Pandol S, Edderkaoui M, Gukovsky I. et al. Desmoplasia of pancreatic ductal adenocarcinoma. Clin Gastroenterol Hepatol. 2009;7:S44-7
2. Yauch RL, Gould SE, Scales SJ. et al. A paracrine requirement for hedgehog signalling in cancer. Nature. 2008;455:406-410
3. Olive KP, Jacobetz MA, Davidson CJ. et al. Inhibition of hedgehog signaling enhances delivery of chemotherapy in a mouse model of pancreatic cancer. Science. 2009;324:1457-1461
4. Kumar V, Mondal G, Slavik P. et al. Codelivery of small molecule hedgehog inhibitor and miRNA for treating pancreatic cancer. Mol Pharm. 2015;12:1289-1298
5. Jusufovic E, Rijavec M, Keser D. et al. Let-7b and miR-126 are down-regulated in tumor tissue and correlate with microvessel density and survival outcomes in non-small-cell lung cancer. PLoS One. 2012;7:e45577
6. Trang P, Medina PP, Wiggins JF. et al. Regression of murine lung tumors by the let-7 microRNA. Oncogene. 2010;29:1580-1587
7. Trang P, Wiggins JF, Daige CL. et al. Systemic delivery of tumor suppressor microRNA mimics using a neutral lipid emulsion inhibits lung tumors in mice. Mol Ther. 2011;19:1116-1122
8. Li F, Zhao C, Wang L. Molecular-targeted agents combination therapy for cancer: Developments and potentials. Int J Cancer. 2014;134:1257-1269
9. Conroy T, Desseigne F, Ychou M. et al. FOLFIRINOX versus gemcitabine for metastatic pancreatic cancer. N Engl J Med. 2011;364:1817-1825
10. Mittal A, Chitkara D, Behrman SW. et al. Efficacy of gemcitabine conjugated and miRNA-205 complexed micelles for treatment of advanced pancreatic cancer. Biomaterials. 2014;35:7077-7087
11. Chaudhary AK, Mondal G, Kumar V. et al. Chemosensitization and inhibition of pancreatic cancer stem cell proliferation by overexpression of microRNA-205. Cancer Lett. 2017;402:1-8
12. Gu D, Schlotman KE, Xie J. Deciphering the role of hedgehog signaling in pancreatic cancer. J Biomed Res. 2016;30:353-360
13. Ji Z, Mei FC, Xie J. et al. Oncogenic KRAS activates hedgehog signaling pathway in pancreatic cancer cells. J Biol Chem. 2007;282:14048-14055
14. Dai X, Jiang Y, Tan C. Let-7 sensitizes KRAS mutant tumor cells to chemotherapy. PLoS One. 2015;10:e0126653
15. Dai X, Fan W, Wang Y. et al. Combined delivery of let-7b MicroRNA and paclitaxel via biodegradable nanoassemblies for the treatment of KRAS mutant cancer. Mol Pharm. 2016;13:520-533
16. Lee JM, Yoon TJ, Cho YS. Recent developments in nanoparticle-based siRNA delivery for cancer therapy. Biomed Res Int. 2013;2013:782041
17. Yao Y, Su Z, Liang Y. et al. pH-sensitive carboxymethyl chitosan-modified cationic liposomes for sorafenib and siRNA co-delivery. Int J Nanomedicine. 2015;10:6185-6197
18. Xiao K, Li Y, Luo J. et al. The effect of surface charge on in vivo biodistribution of PEG-oligocholic acid based micellar nanoparticles. Biomaterials. 2011;32:3435-3446
19. Kattel K, Mondal G, Lin F. et al. Biodistribution of self-assembling polymer-gemcitabine conjugate after systemic administration into orthotopic pancreatic tumor bearing mice. Mol Pharm. 2017;14:1365-1372
20. Gehrig S, Sami H, Ogris M. Gene therapy and imaging in preclinical and clinical oncology: Recent developments in therapy and theranostics. Ther Deliv. 2014;5:1275-1296
21. Dang X, Gu L, Qi J. et al. Layer-by-layer assembled fluorescent probes in the second near-infrared window for systemic delivery and detection of ovarian cancer. Proc Natl Acad Sci U S A. 2016;113:5179-5184
22. Kumar V, Mondal G, Dutta R. et al. Co-delivery of small molecule hedgehog inhibitor and miRNA for treating liver fibrosis. Biomaterials. 2016;76:144-156
23. Mundra V, Peng Y, Kumar V. et al. Systemic delivery of nanoparticle formulation of novel tubulin inhibitor for treating metastatic melanoma. Drug Deliv Transl Res. 2015;5:199-208
24. Hill RM, Kuijper S, Lindsey JC. et al. Combined MYC and P53 defects emerge at medulloblastoma relapse and define rapidly progressive, therapeutically targetable disease. Cancer Cell. 2015;27:72-84
25. Graham RA, Lum BL, Cheeti S. et al. Pharmacokinetics of hedgehog pathway inhibitor vismodegib (GDC-0449) in patients with locally advanced or metastatic solid tumors: The role of alpha-1-acid glycoprotein binding. Clin Cancer Res. 2011;17:2512-2520
26. Kumar V, Mundra V, Mahato RI. Nanomedicines of hedgehog inhibitor and PPAR-gamma agonist for treating liver fibrosis. Pharm Res. 2014;31:1158-1169
27. Nascimento AV, Gattacceca F, Singh A. et al. Biodistribution and pharmacokinetics of Mad2 siRNA-loaded EGFR-targeted chitosan nanoparticles in cisplatin sensitive and resistant lung cancer models. Nanomedicine (Lond). 2016;11:767-781
28. Desai N. Challenges in development of nanoparticle-based therapeutics. AAPS J. 2012;14:282-295
29. Fang C, Shi B, Pei YY. et al. In vivo tumor targeting of tumor necrosis factor-alpha-loaded stealth nanoparticles: Effect of MePEG molecular weight and particle size. Eur J Pharm Sci. 2006;27:27-36
30. Iversen F, Yang C, Dagnaes-Hansen F. et al. Optimized siRNA-PEG conjugates for extended blood circulation and reduced urine excretion in mice. Theranostics. 2013;3:201-209
31. Kawakami S, Hashida M. Targeted delivery systems of small interfering RNA by systemic administration. Drug Metab Pharmacokinet. 2007;22:142-151
32. Zuckerman JE, Choi CH, Han H. et al. Polycation-siRNA nanoparticles can disassemble at the kidney glomerular basement membrane. Proc Natl Acad Sci U S A. 2012;109:3137-3142
33. Chow TH, Lin YY, Hwang JJ. et al. Improvement of biodistribution and therapeutic index via increase of polyethylene glycol on drug-carrying liposomes in an HT-29/luc xenografted mouse model. Anticancer Res. 2009;29:2111-2120
34. Dong DW, Xiang B, Gao W. et al. pH-responsive complexes using prefunctionalized polymers for synchronous delivery of doxorubicin and siRNA to cancer cells. Biomaterials. 2013;34:4849-4859
35. Christensen J, Litherland K, Faller T. et al. Biodistribution and metabolism studies of lipid nanoparticle-formulated internally [3H]-labeled siRNA in mice. Drug Metab Dispos. 2014;42:431-440
36. Wang Y, Li Y, Wang Q. et al. Pharmacokinetics and biodistribution of polymeric micelles of paclitaxel with pluronic P105/poly(caprolactone) copolymers. Pharmazie. 2008;63:446-452
37. Wong H, Chen JZ, Chou B. et al. Preclinical assessment of the absorption, distribution, metabolism and excretion of GDC-0449 (2-chloro-N-(4-chloro-3-(pyridin-2-yl)phenyl)-4-(methylsulfonyl)benzamide), an orally bioavailable systemic hedgehog signalling pathway inhibitor. Xenobiotica. 2009;39:850-861
38. Wei Y, Luo X, Guan J. et al. Biodegradable nanoparticles for improved kidney bioavailability of rhein: Preparation, characterization, plasma, and kidney pharmacokinetics. Drug Dev Ind Pharm. 2017;43:1885-1891
39. Charrois GJ, Allen TM. Drug release rate influences the pharmacokinetics, biodistribution, therapeutic activity, and toxicity of pegylated liposomal doxorubicin formulations in murine breast cancer. Biochim Biophys Acta. 2004;1663:167-177
Author contact
![]() Corresponding authors: Dr. Chalet Tan, Department of Pharmaceutics and Drug Delivery, University of Mississippi School of Pharmacy, University, MS 38677. Tel: (662) 915-2097; E-mail: chalettanedu and Dr. Ram I. Mahato, Department of Pharmaceutical Sciences, University of Nebraska Medical Center (UNMC), 986025 Nebraska Medical Center, Omaha, NE 68198-6025. Tel: (402) 559-5422; Fax: (402) 559-9543; E-mail: ram.mahatoedu
Corresponding authors: Dr. Chalet Tan, Department of Pharmaceutics and Drug Delivery, University of Mississippi School of Pharmacy, University, MS 38677. Tel: (662) 915-2097; E-mail: chalettanedu and Dr. Ram I. Mahato, Department of Pharmaceutical Sciences, University of Nebraska Medical Center (UNMC), 986025 Nebraska Medical Center, Omaha, NE 68198-6025. Tel: (402) 559-5422; Fax: (402) 559-9543; E-mail: ram.mahatoedu