Impact Factor
- Issue 14; 2026
- Issue 13; 2026
- Issue 12; 2026
- Issue 11; 2026
- Issue 10; 2026
- Volume 16; 2026
- Advance Articles
- Past Issues
- Cover Images
- Cover Suggestion
- Index & Coverage
- Special Issues
Introduction
Methods
Results
Discussion
Conclusions
Abbreviations
Supplementary Material
Acknowledgements
References
International Journal of Biological Sciences
International Journal of Medical Sciences
 Global reach, higher impact

Theranostics 2018; 8(14):3874-3890. doi:10.7150/thno.23334 This issue Cite
Research Paper
Circulating ectosomes: Determination of angiogenic microRNAs in type 2 diabetes
Ewa Ł. Stępień1 ![]() , Martyna Durak-Kozica1, Agnieszka Kamińska1, Marta Targosz-Korecka2, Marcin Libera3, Grzegorz Tylko4, Agnieszka Opalińska5, Maria Kapusta6, Bogdan Solnica6, Adriana Georgescu7, Marina C. Costa8, Agnieszka Czyżewska-Buczyńska9, Wojciech Witkiewicz9, Maciej T. Małecki10, Francisco J. Enguita8
, Martyna Durak-Kozica1, Agnieszka Kamińska1, Marta Targosz-Korecka2, Marcin Libera3, Grzegorz Tylko4, Agnieszka Opalińska5, Maria Kapusta6, Bogdan Solnica6, Adriana Georgescu7, Marina C. Costa8, Agnieszka Czyżewska-Buczyńska9, Wojciech Witkiewicz9, Maciej T. Małecki10, Francisco J. Enguita8 ![]()
1. Department of Medical Physics, M. Smoluchowski Institute of Physics, Jagiellonian University, Kraków, Poland
2. Department of Physics of Nanostructures and Nanotechnology, Institute of Physics Jagiellonian University, Kraków, Poland
3. Centre of Polymer and Carbon Materials, Polish Academy of Sciences, Zabrze, Poland
4. Department of Cell Biology and Imaging Institute of Zoology, Jagiellonian University
5. Institute of High Pressure Physics, Polish Academy of Science, Warsaw, Poland
6. Department of Clinical Biochemistry, Jagiellonian University Medical College, Kraków, Poland
7. Department of Pathophysiology and Pharmacology, Institute of Cellular Biology and Pathology, 'Nicolae Simionescu' of Romanian Academy, Bucharest, Romania
8. Instituto de Medicina Molecular, Faculdade de Medicina, Universidade de Lisboa, 1649-028 Lisbon, Portugal
9. WroVasc - Integrated Cardiovascular Centre, Regional Specialist Hospital, Research and Development Centre, Wroclaw, Poland
10. Department of Metabolic Disease, Jagiellonian University Medical College, Kraków, Poland
Received 2017-10-15; Accepted 2018-5-3; Published 2018-6-23
Abstract

Ectosomes (Ects) are a subpopulation of extracellular vesicles formed by the process of plasma membrane shedding. In the present study, we profiled ectosome-specific microRNAs (miRNAs) in patients with type 2 diabetes mellitus (T2DM) and analyzed their pro- and anti-angiogenic potential.
Methods: We used different approaches for detecting and enumerating Ects, including atomic force microscopy, cryogenic transmission electron microscopy, and nanoparticle tracking analysis. Furthermore, we used bioinformatics tools to analyze functional data obtained from specific miRNA enrichment signatures during angiogenesis and vasculature development.
Results: Levels of miR-193b-3p, miR-199a-3p, miR-20a-3p, miR-26b-5p, miR-30b-5p, miR-30c-5p, miR-374a-5p, miR-409-3p, and miR-95-3p were significantly different between Ects obtained from patients with T2DM and those obtained from healthy controls.
Conclusion: Our results showed differences in the abundance of pro- and anti-angiogenic miRNAs in Ects of patients with T2DM, and are suggestive of mechanisms underlying the development of vascular complications due to impaired angiogenesis in such patients.
Keywords: angiogenesis, diabetes, extracellular vesicles, microRNA, systems biology
Introduction
According to a global report on diabetes by the World Health Organization (2016), the global prevalence of diabetes mellitus (DM) has exceeded 400 million patients. Prevalence of DM is highest in the Southeast Asia and Western Pacific regions, with age-standardized mortality rates of 129.1 and 67.8 deaths per 100,000 people, respectively [1]. In these regions, the majority of patients with diabetes have type 2 diabetes mellitus (T2DM). Despite substantial progress in the diagnosis and medical care of patients with diabetes, the life expectancy of these patients is significantly shorter than that of the general population [2] Diabetes imposes a large financial burden on the global health-care system and human capital. Vascular complications are the major cause of increased mortality and morbidity associated with DM. Functions of the cardiovascular system, including angiogenesis and disease states such as atherosclerosis, are seriously altered in hyperglycemic conditions, which is typically observed in patients with poorly controlled DM. Cardiovascular alterations often manifest as macroangiopathies, like coronary artery disease (CAD) and stroke, or as microangiopathies, like non-healing foot ulcers, retinopathy and diabetic nephropathy.
Of the different circulating extracellular vesicles (EVs), submicron-sized ectosomes (Ects) have not attracted as much interest as nano-sized exosomes have [3, 4]. However, after a study by Wolf (1967) describing the origin of Ect-like particles from platelets, numerous studies have investigated the possible mechanisms underlying Ect formation [5]. Ects belong to a large family of membrane vesicles or EVs, also referred to as microparticles (MPs), that are released in an evolutionarily-conserved manner in both prokaryotes and eukaryotes [6].
Ects retain many features of their parental cells, including specific surface antigens and receptors [7]. Therefore, characteristics of Ects are based on their size and their specific molecular signature, with some surface proteins and phosphatidylserine (PS) being the key identifiers of Ects [6]. PS-positive Ects can be easily distinguished from other circulating EVs through annexin V or lactadherin binding [8, 9].
In the blood, platelets and endothelial cells are the main source of circulating Ects; however, under stress conditions such as hypoxia, inflammation, and diabetes, other blood cells, including macrophages and neutrophils, release several EVs [10, 11]. Endothelial cell- and platelet-derived Ects substantially affect the cardiovascular system, especially endothelial cells and hemostasis [12-14]. Numerous studies suggest that endothelial cell-derived Ects exert an anti-vasorelaxing effect on other endothelial cells, promote hemostasis, and exert procoagulant effects [12, 15]. In contrast, platelet-derived Ects increase the adhesion of hematopoietic stem/progenitor cells to the endothelium, significantly improving their engraftment [16], and regulate cell migration and neovascularization [17, 18].
Changes in EV levels and heterogeneity have been observed in the circulating blood of patients with type 1 diabetes mellitus (T1DM) and T2DM. Although patients with T1DM and T2DM show an increase in overall Ect levels, patients with T1DM have a higher number of platelet-derived Ects than patients with T2DM. Moreover, the procoagulant activity of Ects is correlated with the levels of glycated hemoglobin (HbA1C) in patients with T1DM [19]. In contrast, the procoagulant activity of Ects is lower in patients with T2DM having diabetic retinopathy than in those having CAD and diabetic foot syndrome [20].
Pioneering studies on EVs performed over a decade ago indicate that both exosomes and Ects contain RNA, including microRNAs (miRNAs); this finding has substantially renewed interest in EVs as mediators of cell-to-cell communication [21]. miRNAs regulate the transcription and translation of several genes involved in cell metabolism and various canonical and non-canonical pathways in all living cells [22]. In DM, modulation of miRNA expression is suggested to affect the production of insulin and occurrence of diabetic complications [23].
Accumulating evidence indicates that most circulating miRNAs are carried by AGO protein complexes or plasma proteins (lipoproteins) [24, 25]. EVs are suggested to function as alternative carriers that protect extracellular RNA from RNase degradation, indicating that they are efficient tools for transport in the human body [26, 27].
The present study examined miRNAs isolated from the plasma of patients with T2DM. In addition, this study determined miRNA signatures in Ect-enriched and Ect-depleted plasma fractions and analyzed the pro- and anti-angiogenic potential of these miRNAs by using bioinformatics and system biology tools.
Methods
Patients and sample collection
This study involved 15 patients with T2DM and 15 control subjects, both groups comprising male and female subjects aged between 68 and 82 years (mean age, 67.9 ± 5.23 years). Clinical characteristics of the study subjects are listed in Table 1. Inclusion criteria for diabetic patients and control subjects were similar to those described previously [28]. Diabetes was defined according to Polish Diabetes Society guidelines, based on oral glucose tolerance test (OGTT). All T2DM patients were undergoing diabetes treatment. Obesity and insulin resistance were not criteria for exclusion. Both patients and controls with acute coronary syndrome (ACS), acute ischemic stroke (IS) or critical limb ischemia were excluded from this study if they occurred within 6 months prior to the study enrollment. Other criteria for exclusion were patients with a history of cancer, renal and liver failure, and past or present systemic inflammation as defined by high-sensitivity C-reactive protein (hs-CRP) levels above 10 mg/L.
Characteristics of study groups
| Variable | Type 2 diabetes (n=15) | Control group (n=15) | p |
|---|---|---|---|
| Gender: Female/Male (N) | 1/14 | 0/15 | NS |
| Age (years) | 67 (65-71) | 65 (63-71) | 0.337 |
| BMI (kg/m2) | 30.25 ± 3.76 | 25.23 ± 1.22 | <0.0001 |
| Current smokers (N/%) | 1/6.7 | 0/0 | 0.34 |
| Former smokers (N/%) | 4/26.7 | 3/20 | 0.73 |
| Alcohol consumption (N/%) | 3/20 | 5/33.3 | 0.53 |
| Duration of diabetes (years) | 6 (3-12) | NA | - |
| Hypertension (N/%) | 8/53.3 | 0/0 | 0.01 |
| Other cardiac diseases (N/%) | 1/6.7 | 0/0 | 0.34 |
| Peripheral atherosclerosis (N/%) | 2/13.3 | 1/6.7 | 0.58 |
| Retinopathy (N/%) | 1/6.7 | 0/0 | 0.34 |
| Glucose (mM) | 8.96 ± 3.17 | 6.11 ± 0.97 | 0.003 |
| HbA1C (%) | 7.5 (7.1-7.8) | NA | - |
| hs-CRP (mg/L) | 0.81 ± 0.67 | 0.64 ±0.87 | 0.56 |
| TC (mM) | 4.11 ± 0.87 | 4.89 ± 0.55 | 0.007 |
| CHOL LDL (mM) | 1.94 ± 0.64 | 2.95 ± 0.45 | <0.0001 |
| CHOL HDL (mM) | 1.13 (1.05-1.26) | 1.23 (1.15-1.27) | 0.169 |
| TG (mM) | 2.17 (1.40-2.59) | 1.36 (1.09-1.73) | 0.022 |
| Medications | |||
| Aspirin (N/%) | 5/33.3 | 2/13.3 | 0.31 |
| Insulin (N/%) | 5/33.3 | NA | - |
| Metformin (N/%) | 9/60 | NA | - |
| Sulphonylourea (N/%) | 6/40 | NA | - |
| Hypotensive treatment (N/%) | 9/60 | NA | - |
| Statins (N/%) | 5/33.3 | 1/6.66 | 0.13 |
| Fenofibrates (N/%) | 1/6.7 | 0/0 | 0.34 |
BMI: body-mass index; CHOL HDL: cholesterol high-density lipoprotein fraction; CHOL LDL: cholesterol low-density lipoprotein fraction; HbA1C: glycated haemoglobin A1C fraction; hs-CRP: high sensitivity C-reactive protein; TC: total cholesterol; TG: triglycerides.
Values are given as a mean ± standard deviation (SD), a median with an interquartile interval (Q1-Q3) or the number and percentage (%). Bold means statistically significant difference between the two groups at p<0.05
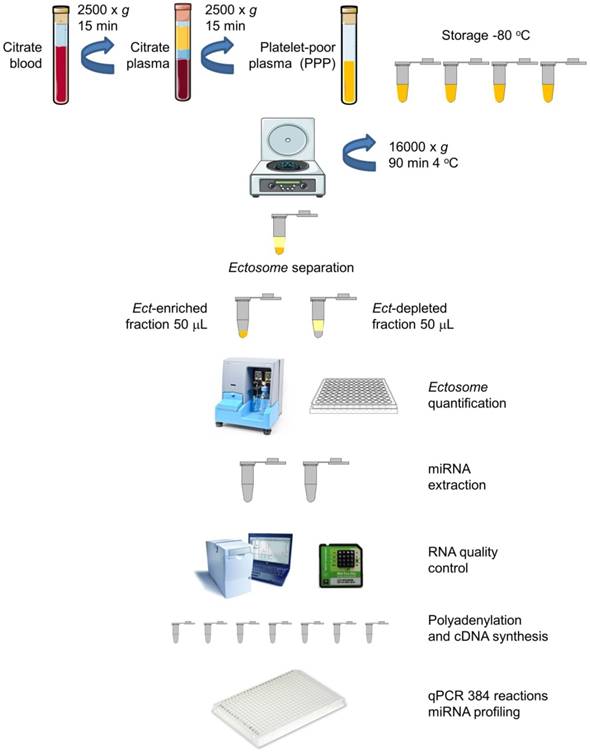
Blood samples from all the subjects were obtained at the same time of the day (between 08:00 and 10:00 A.M.) under fasting conditions by performing venipuncture of the antecubital vein with a >21 gauge needle and by applying a light tourniquet. Approximately 2-3 mL blood was initially withdrawn but not included in the analysis. Blood for miRNA profiling was collected and mixed with an anticoagulant, sodium citrate, centrifuged twice at 2500 × g for 15 min to obtain platelet-poor plasma (PPP). The blood samples were subsequently treated with an anticoagulant, EDTA, for performing hematological analysis and determining HbA1C levels. Biochemical and biomarker analyses were performed by collecting the blood samples in serum separator tubes. Plasma and serum samples were aliquoted, and frozen at -80 °C for further analyses. A schematic description of the procedure is presented in Figure 1.
Circulating Ects and plasma supernatant: workflow for miRNA extraction and analysis. Platelet-poor plasma (PPP) was harvested from blood samples of patients by centrifugation. The plasma was aliquoted in Eppendorf tubes (350 mL) and was stored at -80 °C. Ects were separated by centrifugation, and two plasma fractions, namely, Ect-enriched and Ect-depleted plasma fractions, were used for further analyses (adapted from [30]).
Ethics committee approval and patient consent
The study complied with the Declaration of Helsinki, and the study protocol was approved by the Jagiellonian University Bioethics Committee (permission no. KBET/206/B/2013, extended until December 31, 2017) [28]. Informed consent was obtained from all the study subjects.
Determination of biochemical parameters
Biochemical parameters, including triglyceride, LDL-C, and HDL-C levels, were determined using MaxMat analyzer with ELITech Clinical Systems tests (Puteaux, France), with a limit of detection (LoD) of 0.06 mM. hs-CRP was determined using APTEC Ultra-Sensitive CRP test (APTEC Diagnostics NV, Belgium), with a LoD of 0.13 mg/L. HbA1C level was measured by performing HPLC with D-10 Hemoglobin Testing System (Bio-Rad Laboratories, Inc., Hercules, California, USA), certified by the National Glycohemoglobin Standardization Program (NGSP) organization.
Ect preparation from plasma samples
PPP was thawed in a water bath at 37 °C to prevent cryoprecipitation, mixed, and centrifuged at 16,000 × g and 4 °C for 90 min to obtain Ect-enriched and Ect-depleted plasma fractions, according to Zheng et al., with some modifications including long 16,000 × g centrifugation [29]. The Ect-enriched plasma fraction was frozen at -80 °C for performing subsequent analyses (Figure 1).
Extracellular vesicle (Ect) detection
Atomic force microscopy
Atomic force microscopy (AFM) images of the Ect-enriched and Ect-depleted plasma fractions were obtained using NanoWizard (JPK Instruments AG, Berlin, Germany). All experiments were performed in distilled water using a commercial liquid cell (JPK Instruments, Berlin). V-shape gold-coated cantilevers (MLCT cantilever; Bruker Nano Inc., Billerica, MA, USA) with nominal spring constants of 0.01 N/m were used for scanning in fluid. Surface images (256 × 256 pixels) were obtained from a scan size of 10 × 10 μm and a scan rate of 0.4 Hz. Approximately 10-15 images of the surface were obtained for each sample. The size, cross-section, height, and diameter of all the EVs, including Ects, were calculated using JPK software (JPK Instruments).
Cryogenic transmission electron microscopy
Cryogenic transmission electron microscopy (Cryo-TEM) of the Ect-enriched plasma fraction was performed using a Tecnai F20 TWIN microscope (FEI Company, USA) equipped with a field emission gun and operated at an acceleration voltage of 200 kV. Micrographs were recorded using an Eagle 4k HS camera (FEI Company) and processed using TIA software (FEI Company). Specimens were prepared by vitrifying a particle aqueous solution on grids with a holey carbon film (Quantifoil R 2/2; Quantifoil Micro Tools GmbH, Jena, Germany). The grids were activated for 15 s in oxygen/argon plasma by using Fischione 1020 plasma cleaner (E.A. Fischione Instruments, Inc., Export, PA, USA). Samples were prepared by applying a droplet (2 µL) of the solution onto the grid, blotting with a filter paper for 2 s, and immediately freezing in liquid ethane using a completely automated blotting device (Vitrobot Mark IV; FEI Company, Hillsboro, OR, USA). The vitrified specimens were kept in liquid nitrogen until they were inserted into a Cryo-TEM holder (Gatan 626; Gatan Inc., Pleasanton, CA, USA) and analyzed with a TEM at -178 °C.
Transmission electron microscopy
The Ect-enriched plasma fraction was washed with PBS and centrifuged at 18,000 × g (20 min, 4 °C). Supernatant was discarded and pelleted ectosomes were fixed with 2.5% glutaraldehyde in 0.1 M cacodylic buffer (CB) overnight at 4 °C. Then, samples were washed four times for 15 min with 0.1 M CB and then postfixed for 1 h in 1% osmium tetroxide/0.1 M CB solution. Subsequently, samples were dehydrated by passing through a graded ethanol series (50%, 70%, 80%, 90%, and 100%, 5 min each), embedded in PolyBed 812 (epoxy resin) and polymerized for 48 h at 60 °C. Ultrathin sections were prepared with an EM UC7 Leica ultramicrotome and collected on a copper mesh; the latter was covered with formvar film. Finally, the sections were contrasted with the use of uranyl acetate and lead citrate, and viewed on a JEOL JEM 2100HT TEM at 80 kV accelerating voltage.
Extracellular vesicle (Ect) enumeration
Nanoparticle tracking analysis
The samples were thawed on ice and were vortexed immediately before performing nanoparticle tracking analysis (NTA). To prevent EV aggregation, all the samples were diluted to 100× in HEPES buffer (10 mM HEPES/NaOH, 140 mM NaCl, and 2.5 mM CaCl2, pH 7.4). NTA was performed using a NanoSight NS500 (Malvern Instruments Ltd., Malvern, United Kingdom) equipped with a sample chamber and a 405 nm laser. The assay was performed at room temperature (23.3 °C ± 0.1 °C), and particles present in the samples were visualized based on light scattered by them when illuminated by the laser light. Data were captured and analyzed using NTA 2.3 Build 0025 software (NanoSight NS500, Malvern Instruments Ltd., Malvern, United Kingdom). All the samples were analyzed for 30 s, with manual shutter and gain adjustments in advanced settings. Mean squared displacement of each particle tracked was measured simultaneously to determine the particle diffusion coefficient (Dt), sphere-equivalent, and hydrodynamic radius (R) using the Stokes-Einstein equation Dt = KbT / 6ηRπ, where Kb is Boltzmann's constant, T is temperature, η is solvent viscosity, and R is the hydrodynamic radius of the particle. Thus, NTA helped in measuring both the size and concentration of EVs.
Analysis of the procoagulant activity of Ects
Ect concentration was determined by performing Zymuphen MP Activity assay based on the procoagulant activity of the human plasma (through thrombin generation) by using a manual method (cat. no. 521096; Hyphen BioMed SAS, Neuville sur Oise, France), and was expressed as MP concentration (in nM). The assay was developed in an end-point mode. Absorbance was measured at 405 nm, with a reference wavelength of 690 nm, by using Infinite F200 Pro plate reader (Tecan Group Ltd., Männedorf, Switzerland) at 3 min after substrate introduction at 37 °C and reaction termination. The detection threshold was set at <0.05 nM, and intra-assay variability was set at <8%.
miRNA profiling
miRNA extraction
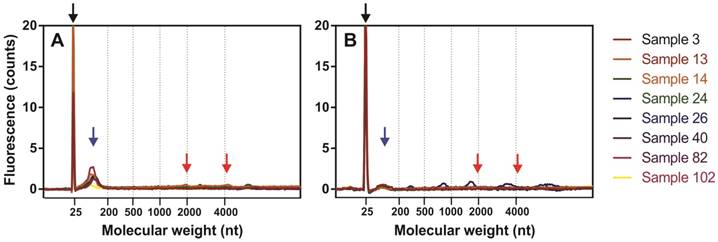
miRNAs were extracted from the Ect-enriched and Ect-depleted plasma fractions by using miRNeasy Serum/Plasma Kit (Qiagen) and Trizol LS Reagent (Invitrogen). RNA yield and concentration were determined by performing capillary electrophoresis with Agilent Bioanalyzer 2100 and Eukaryote Total RNA PicoChip (Agilent Technologies, Inc., Santa Clara, CA, USA). An average of 144 ± 89 and 42.6 ± 45.9 pg/μL total RNA was recovered from 50 µL of Ect-enriched and Ect-depleted plasma fractions, respectively. Electropherograms of miRNAs present in Ect-enriched and Ect-depleted plasma fractions are presented in Figure 2.
Fluorescence profiles of isolated miRNAs determined by capillary electrophoresis using Agilent 2100 Bioanalyzer PicoChip. Fluorograms were merged together according to a nucleotide size axis. (A) Ect-enriched and (B) Ect-depleted plasma fractions. For comparison, miRNAs were isolated from the same samples by using the miRNeasy Serum/Plasma Kit. Blacks arrow indicate marker dye, blue arrows indicate short RNA fragments (miRNAs), and red arrows indicate 18S and 28S rRNAs.
miRNA analysis by quantitative PCR
Extracted miRNA from the Ect-enriched fraction and supernatants was reverse transcribed using a polyadenylation and cDNA synthesis kit (Exiqon). Before cDNA synthesis, RNAs were spiked with a synthetic miRNA (UniSp6, Exiqon) that served as a control for cDNA synthesis. Screening for differentially-expressed miRNAs in ectosomes was performed by using a low-density qPCR array, Serum/Plasma miRCURY LNA PCR Panel V1 (Exiqon) (plate layout shown in Table S1) in a Viia7 real-time PCR system (Thermo Fisher Scientific, Waltham, MA, USA) equipped with a 384-well reaction plate. qPCR was performed using SYBR Green Master Mix Universal RT (Exiqon) under the amplification conditions recommended by the manufacturer. Amplification data were processed by the ΔCT method with a global normalization approach using an open source DataAssist 3.0 software (Thermo Fisher Scientific). Fold changes were calculated by the ΔΔCT method, and statistically significant variations among different groups were determined by calculating adjusted p-values using the Benjamini-Hochberg false discovery rate procedure. Specific candidate miRNAs were chosen from screening results and individually validated in an additional cohort of patients by qPCR using specific LNA primers (Exiqon) along with seven additional pro- and anti-angiogenic miRNAs from previously described studies (Table 2). For individual qPCR validation, we performed three technical replicates per sample. Amplification data were also processed using the ΔCT method using the synthetically spiked miRNA as a normalization control.
Target sequences and nomenclature of selected miRNAs analyzed in the study. Accession sequences and names are presented according to miRBase 21.
| miR name (human) | microRNA target sequence | Sequence reference | LNA™ microRNA PCR primer set |
|---|---|---|---|
| hsa-miR-126-3p | UCGUACCGUGAGUAAUAAUGCG | MIMAT0000445 | EQ-204227 |
| hsa-miR-126-5p | CAUUAUUACUUUUGGUACGCG | MIMAT0000444 | EQ-206010 |
| hsa-miR-193b-3p | AACUGGCCCUCAAAGUCCCGCU | MIMAT0002819 | EQ-204226 |
| hsa-miR-199a-3p | ACAGUAGUCUGCACAUUGGUUA | MIMAT0000232 | EQ-204536 |
| hsa-miR-20a-3p | ACUGCAUUAUGAGCACUUAAAG | MIMAT0004493 | EQ-204052 |
| hsa-miR-221-3p | AGCUACAUUGUCUGCUGGGUUUC | MIMAT0000278 | EQ-204532 |
| hsa-miR-23b-3p | AUCACAUUGCCAGGGAUUACC | MIMAT0000418 | EQ-204790 |
| hsa-miR-26a-5p | UUCAAGUAAUCCAGGAUAGGCU | MIMAT0000082 | EQ-206023 |
| hsa-miR-26b-5p | UUCAAGUAAUUCAGGAUAGGU | MIMAT0000083 | EQ-204172 |
| hsa-miR-29a-5p | ACUGAUUUCUUUUGGUGUUCAG | MIMAT0004503 | EQ-204430 |
| hsa-miR-30b-5p | UGUAAACAUCCUACACUCAGCU | MIMAT0000420 | EQ-204765 |
| hsa-miR-30c-5p | UGUAAACAUCCUACACUCUCAGC | MIMAT0000244 | EQ-204783 |
| hsa-miR-374a-5p | UUAUAAUACAACCUGAUAAGUG | MIMAT0000727 | EQ-204758 |
| hsa-miR-409-3p | GAAUGUUGCUCGGUGAACCCCU | MIMAT0001639 | EQ-204358 |
| hsa-miR-495-3p | AAACAAACAUGGUGCACUUCUU | MIMAT0002817 | EQ-206015 |
| hsa-miR-95-3p | UUCAACGGGUAUUUAUUGAGCA | MIMAT0000094 | EQ-204288 |
| hsa-let-7i-5p | UGAGGUAGUAGUUUGUGCUGUU | MIMAT0000415 | EQ-204394 |
Analysis of miRNA targets and functional interactions
Validated miRNA-target relationships were determined using miRNet database [31]. Functional interactions between proteins were predicted using STRING database by considering a global interaction score of >0.9 [32]. A graphical network showing significant miRNAs and functionally corresponding genes was constructed using NAViGaTOR software [33].
Statistical analysis
Statistical analyses were performed using Statistica 12.0 package (StatSoft Polska, Kraków, Poland). Distribution of variables was examined using Kolmogorov-Smirnov normality test. Quantitative variables were characterized using descriptive statistics, i.e., mean and standard deviation (SD) for normally distributed data or median and interquartile interval (Q1-Q3) for non-normally distributed data. Qualitative variables were compared using two-sided Chi-square and Fisher's exact tests. Student's t-test (normally distributed data) or Mann-Whitney U test (non-normally distributed data) was used to determine significant differences between variables. Statistical significance was set at p < 0.05. For the PCR-array analysis (volcano plots and heat maps), a cut-off for level of fold-change of >2 and p-value < 0.05 were established. Additionally, to reveal the role of classical cofounders in diabetes (age, BMI, arterial hypertension and diabetes duration) the authors applied a logistic regression model in miRNA analysis based on the median miRNA expression value (1 for higher, 0 for lower values).
Results
Characterization of plasma-derived Ects
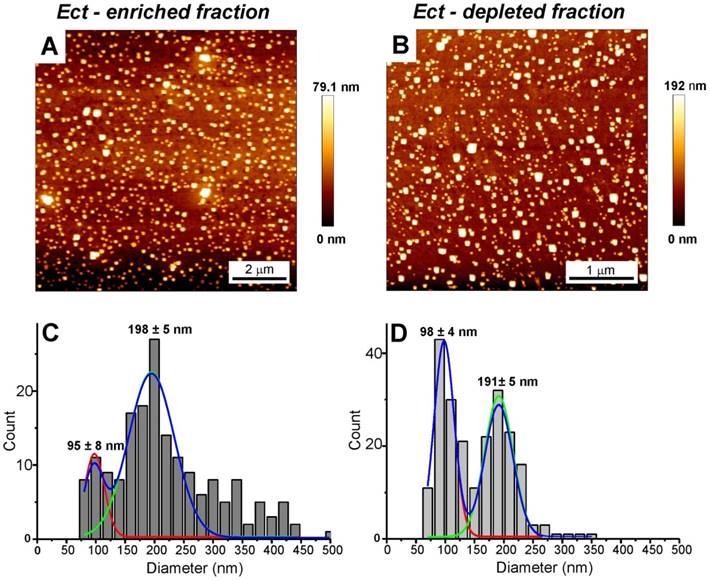
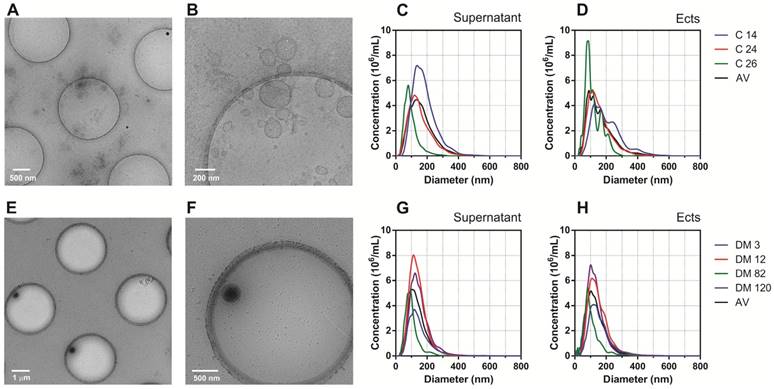
AFM and Cryo-TEM detected Ects and smaller EVs (exosomes) in the Ect-enriched and Ect-depleted plasma fractions (Figure 3 and Figure 4). AFM showed the abundance of large vesicles such as Ects (mean height, ~200 nm) in the Ect-enriched fraction obtained by performing high-speed centrifugation (Figure 3). The average height of the identified vesicles in the Ect-depleted fraction was lower than that in the Ect-enriched fraction (Figure 3C). Cryo-TEM detected Ects in the Ect-enriched plasma fraction obtained from patients with uncontrolled (Figure 4B) and controlled diabetes (Figure 4C). Ects were detected as typical multilayered vesicles with a dense cargo.
AFM and analysis of EVs in the Ect-depleted (left) and Ect-enriched (right) plasma fractions from a representative patient with T2DM. Samples were immobilized on poly-L-lysine-coated slides. AFM images of EVs. Presence of large vesicles was confirmed in the Ect-enriched (A) and depleted plasma fractions (B). (C-D) The mean value of the height of the observed structures calculated based on AFM images. Appropriate size distribution histograms of immobilized EVs in both the plasma fractions showing the presence of Ect populations. Diameters are expressed as mean ± standard error.
Characteristics of Ects present in the Ect-enriched and Ect-depleted plasma fractions. Representative wide-field and magnified cryo-TEM images of Ects isolated from a control subject (A-B) and a patient with diabetes (glucose level: 12.02 mM; HbA1C level: 9.2%) (E-F). Representative plots of NTA size distribution of EVs in Ect-enriched and Ect-depleted plasma fractions from the control group (C-D) and diabetic patients (G-H). Samples were analyzed in 1000 × dilutions.
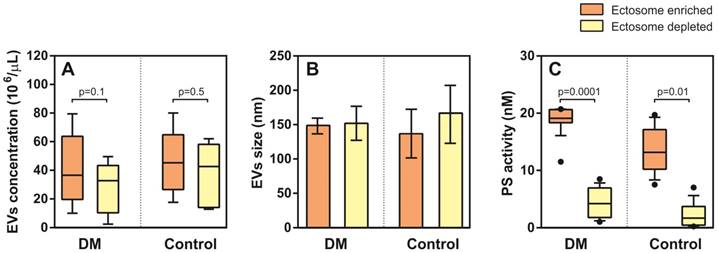
NTA analysis did not show significant differences in EV density (concentration) between T2DM and controls in the Ect-enriched fraction: 36.5 (19.7-63.7) 106/µL vs. 45.2 (29.5-59.8) 106/µL (p = 0.8); or in the Ect-depleted fraction: 33.7 (10.3-43.3) 106/µL vs. 42.7 (14.2-20.8) 106/µL (p = 0.2) (Figure 5A). Similarly, differences in EVs were detected: 148 (144-152) nm vs. 137 (130-191) nm (p = 0.6); and 152 (143-160) nm vs. 165 (100-183) nm (p = 0.9) (Figure 5B). Significant difference in PS-exposed (procoagulant) concentrations between T2DM and controls were observed in the Ect-enriched fraction: 19.10 (18.34-20.59) nM vs. 13.15 (10.31-17.01) nM (p = 0.0001); as well as in the Ect-depleted fraction: 4.21 (2.05-6.81) nM vs. 1.68 (0.48-3.72) nM (p = 0.01) (Figure 5C).
Enumeration and characteristics of Ects present in the Ect-enriched and Ect-depleted plasma fractions. (A) Number of microvesicles present in the Ect-enriched and Ect-depleted plasma fractions obtained from diabetic patients (DM) compared with that in the Ect-enriched and Ect-depleted plasma fractions obtained from healthy controls (Control), as determined by performing nanoparticle tracking analysis (NTA). (B) Ects particle size as determined by NTA in both groups of samples. (C) PS (phosphatidylserine) procoagulant activity exposed on EVs as quantified by Zymuphen MP assay. Whisker plots in (A) and (C) represent data as median (box) with interquartile interval (10-90) showing the outliers. Depicted p-values in (A) and (C) between the studied groups of patients were calculated by a two-tailed non-parametric Mann-Whitney test.
Ectosomes from patients with T2DM showed a specific miRNA enrichment signature
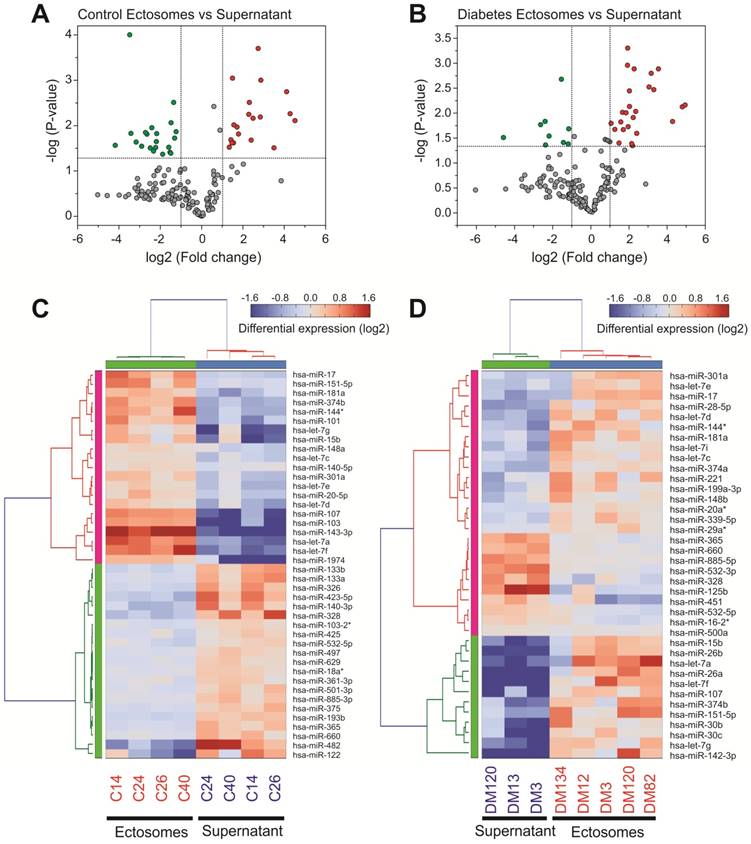
miRNA content in Ects obtained from patients with T2DM and healthy controls was determined by performing low-density qPCR array with LNA primers against 179 circulating miRNAs (Table S1). miRNA levels were compared with those in corresponding paired supernatants obtained during Ect purification by using the same approach (Figure 6). We identified 25 Ect-specific miRNAs in samples obtained from healthy controls and 28 Ect-specific miRNAs in samples obtained from patients with T2DM. Of the 28 miRNAs identified in samples obtained from patients with T2DM, 10 miRNAs, namely, hsa-miR-20a-3p, hsa-miR-26a-5p, hsa-miR-26b-5p, hsa-miR-29a-5p, hsa-miR-374a-5p, hsa-miR-30b-5p, hsa-miR-30c-5p, hsa-let-7i-5p, hsa-miR-199a-3p, and hsa-miR-221-3p, were exclusively present in Ects isolated from patients with T2DM (Figure 7A).
qPCR screening of enriched and depleted miRNAs present in Ects compared with those present in corresponding supernatants. Volcano plots of specific miRNAs present in the Ect-enriched plasma fraction compared with those present in corresponding supernatants obtained from (A) healthy controls and (B) patients with T2DM. Green and red dots represent significantly down- and upregulated miRNAs, respectively, taking into account the following thresholds: p-value < 0.05 and fold-change >2. Heatmap for the differentially enriched miRNAs in Ects obtained from (C) healthy control and (D) patients with T2DM.
Functional characterization of Ect-enriched miRNAs in patients with T2DM. (A) Venn diagram representation of Ect-enriched miRNAs compared with those present in corresponding supernatants obtained from patients with T2DM and healthy controls. Patients with T2DM showed a specific miRNA enrichment pattern, which included 10 unique miRNAs not detected in healthy controls. (B) Integrative analysis of validated targets involved in vasculature development and angiogenesis for the 10 unique miRNAs enriched in Ect from T2DM patients. miRNAs are represented as filled triangles, and validated target genes are represented as circles, with a size proportional to the number of miRNAs regulating a particular mRNA. miRNA-target gene relationships obtained from the miRNet database [31] are indicated using grey lines. Black lines indicate functional interactions between proteins, as determined using the STRING database [32] by using a global interaction score of >0.9. The graphical network representation was constructed using the NAViGaTOR software [33].
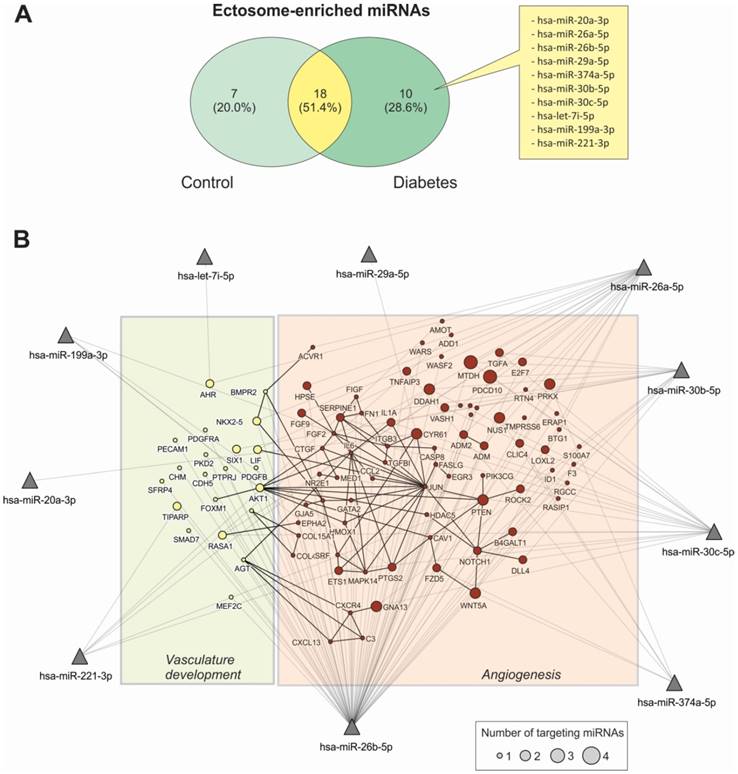
To determine the possible functional role of miRNAs present in Ects obtained from patients with T2DM, we performed a validated target analysis followed by graphical network integration, including protein-protein interactions (Figure 7B). Our results showed that the examined miRNAs targeted genes involved in angiogenesis and vasculature development. Moreover, the examined miRNAs exerted a cooperative regulatory effect on several angiogenesis-related mRNA transcripts that were simultaneously targeted by two or more of the Ect-specific miRNAs. Four Ect-specific miRNAs, namely, hsa-miR-26a-5p, hsa-miR-26b-5p, hsa-miR-30b-5p, and hsa-miR-30c-5p, simultaneously targeted the mRNA transcripts of two genes involved in angiogenesis, namely, MTDH and PDCD10, in patients with T2DM. Interestingly, pro-angiogenic hsa-miR-30 family miRNAs and anti-angiogenic hsa-miR-26 family miRNAs simultaneously targeted MTDH and PDCD10 mRNA transcripts. Three Ect-specific miRNAs targeted seven mRNA transcripts in patients with DM. Of these seven mRNA transcripts, DDAH and GNA13 mRNA transcripts were regulated by pro-angiogenic miRNAs and PRX, CYR61, NUS1, PTEN, and WNT5A mRNA transcripts were regulated by anti-angiogenic miRNAs. Determination of Ect-specific miRNA signatures in patients with T2DM identified several previously characterized pro- and anti-angiogenic miRNAs involved in diverse physiological processes (Table 3).
Functional data of Ect-specific miRNAs involved in angiogenesis and vasculature development in patients with T2DM.
| miRNAs | Function | Comments | References |
|---|---|---|---|
| hsa-miR-20a-3p | Nonrelated | The miRNA hsa-miR-20a-5p generated from the same pre-miRNA loop is anti-angiogenic | [67] |
| hsa-miR-26a-5p | Anti-antiogenic | miR-26a targets a SMAD1-Id1-p21WAF/CIP1/p27 signaling axis and inhibits angiogenesis in endothelial cells. In contrast, pro-angiogenic stimuli such as VEGF or TNF-a reduced miR-26a expression in endothelial cells. | [68] |
| hsa-miR-26b-5p | Anti-antiogenic | Both in vitro and in vivo studies showed that miR-26b-5p could suppress vascular mimicry and angiogenesis by down-regulating the expression of VE-cadherin, Snail and MMP2 and could inhibit the apoptosis of hepatocellular carcinoma cells | [69] |
| hsa-miR-29a-5p | Nonrelated | The miRNA hsa-miR-29a-3p generated from the same pre-miRNA loop is anti-angiogenic | [70] |
| hsa-miR-374a-5p | Nonrelated | The isomer miRNA hsa-miR-374b is anti-angiogenic | [71] |
| hsa-miR-30b-5p hsa-miR-30c-5p | Pro-angiogenic | Overexpression of hsa-miR-30 family in endothelial cells led to increased vessel number and length in an in vitro model of sprouting angiogenesis | [72] |
| hsa-let-7i-5p | Hypertension | Let-7 family targets the FGF5 transcript in microvascular endothelial cells | [73] |
| hsa-miR-199a-3p | Pro-angiogenic | MiR-199a-5p, promotes metastatic invasion, angiogenesis, and colonization in melanoma by targetting ApoE and the heat-shock factor DNAJA4. | [74] |
| hsa-miR-221-3p | Anti-angiogenic | Levels of miR-221/222 were significantly higher in coronary artery disease (CAD). MiR-221-c-kit pathway may play an important role in diabetes-associated vascular dysfunction | [75, 76] |
Validation of Ect miRNA levels in patients with DM
We used two different approaches to validate Ect-specific miRNAs. The first approach involved a literature search to identify miRNAs involved in the pathogenesis of diabetes and its cardiovascular complications [23, 27, 34, 35], and the second approach involved analysis of qPCR data.
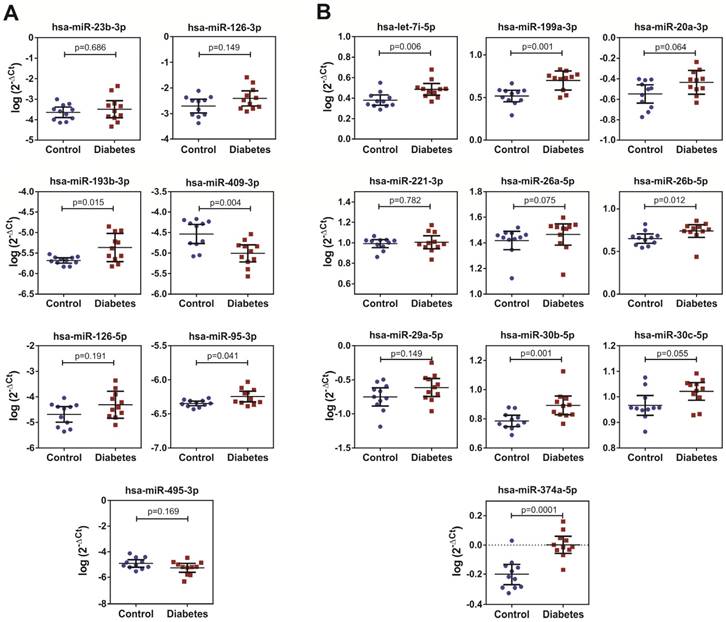
We performed qPCR to validate the levels selected by miRNA screening in the Ect-enriched plasma fractions obtained from 11 healthy controls and 11 patients with DM. Results of qPCR-based validation are shown in Figure 8. Of the reference miRNAs identified by performing a literature search, hsa-miR-193b-3p and hsa-miR-95-3p were significantly enriched in the Ect-enriched plasma fraction obtained from patients with T2DM (p = 0.015 and p = 0.041, respectively; Figure 8A). Interestingly, hsa-miR-409-3p was significantly downregulated in the Ect-enriched plasma fraction obtained from patients with T2DM (p = 0.004). Of the Ect-enriched miRNAs selected by performing miRNA screening, levels of five among them were significantly increased, namely, has-let-7i-5p (p = 0.006), hsa-miR-199a-3-5p (p = 0.001), hsa-miR-26b-5p (p = 0.012), hsa-miR-30b-5p (p = 0.01) and hsa-miR-374a-5p (p = 0.0001). Another three of the selected miRNAs had a tendency to increase: has-miR-20a-3p (p = 0.064), has-miR-26a-5p (p = 0.075) and hsa-miR-30c-5p (p = 0.055) in the Ect-enriched plasma fraction obtained from patients with T2DM (Figure 8B).
Levels of the selected Ect-specific miRNAs in 11 patients with T2DM and 11 healthy controls, as determined by performing qPCR with specific LNA primers. (A) Pro- and anti-angiogenic miRNAs selected by performing literature mining. (B) miRNAs exclusively enriched in Ects obtained from patients with T2DM and selected by performing qPCR screening. Depicted p-values between the studied groups of patients were calculated by a two-tailed non-parametric Mann-Whitney test.
The role of confounding factors on miRNA levels in the Ect-enriched fraction
Age and hypertension are the most confounding factors in D2TM. To reveal the role of confounding factors in diabetes incidence, the logistic regression model was applied. We found that none of the classical risk factors interfered significantly with analyzed miRNA levels in diabetic patients (Table S2).
Discussion
In the present study, we characterized the differences in miRNA cargo between Ects isolated from T2DM patients and healthy controls by various methods. To show their molecular profile and physical properties, technical and experimental requirements were used to attribute their miRNA cargo [3]. The novelty of the present study is the use of the array approach to quantify and discriminate Ects-enriched miRNAs in diabetic patients.
Origin and characteristics of circulating Ects in T2DM
Most Ects, especially those released by platelets and endothelial cells, are spherical in nature. Ects are not formed through exocytosis but are formed by outward membrane budding due to the loss of calcium-dependent membrane phospholipid asymmetry, cytoskeletal rearrangement, and cell surface shedding [36]. Cryo-TEM allowed us to detect very small structures ranging from ~5 to 200-300 nm in size, even in aqueous samples in a virtually artifact-free manner. In the present study, plasma samples were placed on a grid, and the small liquid film was rapidly frozen to 90 K to prevent the formation of ice crystals and maintain the transparency of the frozen water film in an amorphous state. We confirmed the multilayered structure of large microvesicles (Ects) encapsulating small vesicles, which was not abundant in the control sample. This finding concurs with previous observations by Isseman et al. in their Cryo-TEM study [37]. Additionally, we did a TEM imaging analysis that allowed us to characterize average EV size within a similar range to that in the cryo-TEM study. Nevertheless, the direct measurement of diameter by means of TEM is unreliable after the additional washing steps during sample preparation, which has been discussed elsewhere [6]. In the present study, we performed additional TEM imaging to visualize circulating Ect morphology in the plasma (Figure S1).
In the plasma, platelets are considered as the main source of EVs [10]. Cytometric analysis of plasma obtained from patients with T2DM showed that EVs originate from other cellular sources, of which most have been previously characterized as being CD36 positive [38]. Both Ects and apoptotic bodies are released by T lymphocytes under stress conditions, and these vesicles induce vascular hyperactivity in response to vasoconstrictors [39]. Endothelial cell-derived Ects impair endothelial function in vitro by decreasing acetylcholine-induced vasorelaxation and nitric oxide production [12]. Results of a Matrigel assay performed in a previous study showed that endothelial cell-derived Ects affect the formation of vascular networks by decreasing total capillary length, mesh number, and branching points, and increasing mesh area, thus confirming their anti-angiogenic role [40]. In contrast, platelet-derived Ects strongly activate angiogenesis by promoting the proliferation, survival, migration, and tube formation by human umbilical vein endothelial cells [17]. Increasing evidence indicates that EVs (mainly exosomes) derived from the platelet-rich plasma promote the re-epithelization of chronic cutaneous wounds by effectively inducing proliferation and migration of endothelial cells and fibroblasts in a diabetic rat model [41].
We can conclude that differences in Ects characteristics and biological effects result from not only their different origins but also their pathology.
Specific miRNA signature in circulating Ects
The choice of the high-speed centrifugation technique for EV purification facilitates the separation of two fractions of PPP: Ect-enriched and Ect-depleted fractions. This is a method of choice used previously in a number of studies with different modifications [13, 29, 42]. In the Ect-enriched fraction, two types of ectosomes are usually abundant: those of platelet origin, and those of endothelial origin.
Platelet-derived Ects deliver various extracellular miRNAs to different vascular cells [27]. Activated platelets and platelet-derived microvesicles contain miRNAs and other non-coding RNAs [43]. Of these RNAs, two miRNAs, namely, hsa-miR-223-3p and hsa-miR-126-3p, are interesting because of their biological role and proven abundance in platelets [44-46]. miR-223-3p is highly expressed in platelets and megakaryocytes. Expression of hsa-miR-223-3p is strongly correlated with platelet response to antiplatelet therapy, and high miR-223 levels predict efficacious platelet inhibition with clopidogrel [44, 47]. In the present study, qPCR screening did not detect significant abundance of hsa-miR-223-3p in the Ect-enriched plasma fraction, and in patients with T2DM or healthy controls. However, some studies have shown that platelet-derived microvesicles deliver miR-223 as an effector complex along with miRNA machinery protein AGO2 and affect the expression of FBXW7 and EFNA1 mRNA transcripts [46]. In our previous studies, we have confirmed the presence of AGO proteins in larger platelet vesicles corresponding to Ects, obtained from activated platelets (unpublished data).
In the present study, mature miRNAs generated from the miR-126 precursor locus, i.e., hsa-miR-126-3p and hsa-miR-126-5p, were not significantly regulated in the Ect-enriched plasma fraction obtained from patients with T2DM. Our data differ from those of a previous study by Jansen et al., who showed decreased expression of circulating hsa-mir-126-3p in patients with DM [42]. This discrepancy might be because of heterogeneity between the present study and the previous study with respect to the inclusion of patients with different DM types and absence of information on treatment regimen and duration. In contrast, another study showed that circulating miR-126 levels are elevated in patients with T2DM and are positively correlated with glycemic control measure (glucose AUC) [48], which is consistent with the present study. miR-126 is expressed in platelets and endothelial cells, and circulating miR-126 is carried by both platelet- and endothelial cell-derived microvesicles. However, results of sorting experiments showed that most miR-126 is transferred by endothelial cell-derived Ects [27, 49]. These data indicate that miR-126 expression can be upregulated and downregulated in cardiovascular diseases and suggest that both platelet activity and endothelial cell dysfunction affect miR-126 availability [45]. Similarly, the level of another miRNA (hsa-miR-495-3p), which is suggested to be associated with DM complications, was not increased in the Ect-enriched plasma fraction in the present study.
Moreover, we observed that hsa-miR-193b-3p and hsa-miR-95-3p expression was significantly upregulated in the Ect-enriched plasma fraction obtained from patients with T2DM. To the best of our knowledge, no study has reported the involvement of miR-193 or miR-95 in angiogenesis regulation and vascular function, to date. Increased expression of miR-95 has been observed in cancer cells, and its activity is associated with radioresistance (or radiosensitivity) of non-small cell lung cancer [50]. miR-95 functions as an oncogene by directly targeting sorting nexin 1 and other proteins involved in cell proliferation [51]. In contrast to hsa-miR-95-3p, which stimulates cell proliferation, hsa-miR-193b exerts an anti-proliferative effect [52]. Moreover, accumulating evidence suggests that miR-193b inhibits the migration and invasion of cancer cells [53]. In the present study, we found that these two miRNAs were highly expressed in Ects obtained from patients with T2DM, suggesting that pro- and anti-proliferation processes are dysregulated in T2DM and that Ects contribute to the regulation of these processes.
Interestingly, hsa-miR-409-3p expression was downregulated in the Ect-enriched plasma fraction obtained from patients with T2DM. Previous studies indicate that cancer-associated stromal-like cells release miR-409 through EVs and promote epithelial-to-mesenchymal transition (EMT) both in vitro and in vivo [54]. EMT is a transdifferentiation process responsible for several clinical complications in T2DM. In experimental hyperglycemia, TGF-β signaling pathway mediates endothelial-to-mesenchymal transition (EndMT), which induces endothelial damage and increases mesenchymal biomarker expression [55]. The results of the present study suggest that hsa-miR-409-3p regulates EndMT in T2DM.
In addition, we compared the distribution of circulating miRNAs between Ect-enriched and Ect-depleted plasma compartments in healthy controls and patients with T2DM. Our results showed specific distribution patterns of miRNAs between both these compartments in healthy controls and patients with T2DM. miRNA enrichment patterns in Ects isolated from patients with T2DM compared with those present in corresponding supernatants indicated the presence of pro- and anti-angiogenic miRNAs, which were different from that observed in healthy controls. Specific exosomal miRNA transfer in the context of angiogenesis has already been described in the communication between cardiomyocytes and endothelial cells mediated by miR-320 in rat models of DM [56].
Our results suggest an imbalance in the distribution of miRNAs in patients with T2DM, which may be associated with the physiological role of these miRNAs. This unique molecular signature may vary in different DM types showing different progression and associated complications [23, 42, 48], suggesting the role of genetics in Ect formation. However, one should consider environmental factors and baseline characteristics of patients (disease duration, age, weight, and gender). Moreover, relative tissue specificity, expression, and stability of different miRNAs significantly affect miRNA expression.
Role of Ect-enriched miRNAs in the regulation of angiogenesis
We found that both pro- and anti-angiogenic miRNAs were upregulated in Ects and that the miRNA expression pattern was associated with various angiogenic genes. As proven, Ect-enriched miRNAs in patients with T2DM included miRNAs that exerted antagonistic effects on angiogenesis and vasculature development (Table 3). miR-26 family miRNAs and miR-221-3p exert anti-angiogenic effects, whereas miR-30 family miRNAs and miR-199a-3p exert pro-angiogenic effect. Jansen et al. showed that DM is associated with reduced endothelial miR-126 and miR-26a expression in circulating microvesicles; however, the authors analyzed patients with different DM types and for varied durations [42]. These two miRNAs exert both pro- and anti-angiogenic effects by promoting vascular regeneration, inhibiting apoptosis, and reducing insulin sensitivity in endothelial cells [57-59]. In the present study, we found that hsa-miR-26b expression was upregulated in the Ect-enriched plasma fraction obtained from patients with DM. These results suggest the presence of a delicate equilibrium in miRNA cargo that may be associated with the functional regulatory properties of Ects in patients with DM.
Experimental evidence supports this hypothesis in other fields. For example, monocyte-derived Ects carrying pro-angiogenic miRNAs (miR-150) exert strong pro-angiogenic effects, and this pro-angiogenic activity of these Ects is attenuated after depletion of the pro-angiogenic miRNAs [60]. In stem cells, relative proportions of exosomal miRNAs with antagonistic regulatory functions are important for exerting anti-proliferative effect on cancer cells [61]. Moreover, variability of miRNAs in exosomes derived from different sarcomas is important for inducing the formation of a colonization niche around the primary tumor by these miRNAs [62].
We previously reported the pro-angiogenic potential of Ects with Ects obtained from patients with T2DM expressing cytokines and angiogenic factors, including those regulated once activated, normal T-cell expressed and secreted (RANTES), and angiopoietin-2 [30]. Thus, Ects can be considered specific miRNA carriers that may promote angiogenesis in endothelial cells by targeting different angiogenic pathways, including active pSTAT3, nuclear factor (NF)-κB, Wnt, PPARγ, and ERK5/MAPK7 signaling pathways [23, 63]. Moreover, Ect-induced endothelial dysfunction should be considered by comparing data from specific endothelial biomarkers in T2DM [34].
Technical and clinical limitations associated with Ect study
The high diversity of EVs may hamper compatible measurement of Ects by using different analytical methods. To prevent these complications, different biophysical and biochemical properties of Ects, including size, mass density, shape, and surface antigen expression, can be used for their isolation [64]. In the present study, we used high-speed centrifugation for performing plasma fractionation and Ect fractionation as described elsewhere [29, 30]. This strategy cannot fully evade contamination with HDL and LDL proteins, which can bind and transfer miRNAs within a circulation system [65], as well as AGO proteins. To eliminate these effects, we used the normalization method to reduce the potential effect on miRNA analysis.
EV number depends on detection techniques and different pre-analytical variables such as blood collection and handling, plasma preparation, and storage conditions. Pre-analytical variables, namely collection, handling and storage of samples, have been extensively studied in previous work and showed insignificant effects over EVs when performed in identical conditions [66]. Therefore, optimization and standardization of detection techniques are important to precisely define microvesicles and to prevent false-high or false-low quantification. Three ISTH Scientific and Standardization Subcommittees (SSC Vascular Biology, DIC, and Haemostasis & Malignancy) have initiated a project for standardizing the enumeration of cellular MPs by performing flow cytometry. Two collaborative workshops were implemented to establish the resolution and threshold levels of flow cytometers currently used in laboratories. Results of these workshops showed the potential and laboratory limitations of microvesicle evaluation methods [67]. Thus, Ect data should be considered in pre-analytical and analytical phases as well as with patient characteristics, especially for clinical purposes. In the present study, we used different imaging methods to visualize the presence of EV, such as TEM, cryo-TEM, and AFM. The accompanying wide-field images (Figure S1) and wide-field cryo-TEM images (Figure 4A-B, E-F) show potential contaminants, the presence of which should be accounted for in data analysis and normalization methods.
The clinical limitation of the present study was associated with patient characteristics. Body mass index (BMI) was significantly different between patients with T2DM and healthy controls. Patients with T2DM included in the present study were mostly overweight (mean BMI, ~30 kg/m2), which strongly increases the risk of T2DM. In our logistic regression model, BMI (as well as age and arterial hypertension) was analyzed as a potential confounding factor of miRNA levels in DM incidence, without any significance. However, the effect of gender bias should be considered because our study groups were not analyzed with due respect to this risk factor. Similarly, while smoking behavior was not the subject of this study, the role of cigarette smoking on miRNA levels cannot be overlooked.
Subcutaneous adipose tissues, including those present in the abdominal area, possess adipose mesenchymal stem cells that produce EVs, and these cells contribute to the diversity of miRNA profiles in Ects [61]. Therefore, excessive fat accumulation should be considered as an additional factor that impairs angiogenesis in patients with T2DM. Another important issue is glucose regulation in patients with T2DM and healthy controls. The median HbA1C level in patients included in the present study was 7.5% (7.1%-7.8%), which was similar to that reported in other studies [11, 42], and indicated imbalanced glucose regulation in patients with T2DM included in the present study. Moreover, two healthy subjects included in the present study showed incidentally elevated glucose levels, which affected the mean glucose level. However, healthy controls included in the present study were not considerably different from those included in previous studies. Moreover, they were carefully selected with respect to age, gender, smoking behavior, and cardiovascular diseases (except hypertension). Healthy controls differed from T2DM patients with respect to biochemical characteristics, having higher total and LDL cholesterol levels and lower triglycerides levels then T2DM patients, which may affect Ect formation. These differences were probably associated with hyperlipidemia treatment in patients with DM that were included in the present study. Diabetes management guidelines recommend the use of statins to normalize the lipid profile, and to reduce cardiovascular risk in patients with DM; the use of antiplatelet and hypotensive drug therapies is also recommended [28].
Conclusions
The present study is the first systematic study to determine the signatures of Ect-specific miRNAs in patients with T2DM, and to analyze their pro- and anti-angiogenic potential by using bioinformatics tools. Our results clearly show the distribution of pro- and anti-angiogenic miRNAs in patients with T2DM, as indicated by the upregulation or downregulation of miRNAs in the Ect-enriched plasma fraction. This finding may highlight a possible mechanism underlying the occurrence of vascular complications due to impaired angiogenesis in patients with T2DM.
Abbreviations
ACS: acute coronary syndrome; AFM: atomic force microscopy; BMI: body mass index; CB: cacodylic buffer; CHOL HDL: cholesterol high-density lipoprotein fraction; CHOL LDL: cholesterol low-density lipoprotein fraction; CAD: coronary artery disease; Cryo-TEM: cryogenic transmission electron microscopy; DM: diabetes mellitus; Ects: ectosomes; EVs: extracellular vesicles; HbA1C: glycated haemoglobin A1C fraction; hs-CRP: high-sensitivity C-reactive protein; IS: ischemic stroke; LoD: limit of detection; MPs: microparticles; miRNAs: microRNAs; NTA: nanoparticle tracking analysis; NGSP: national glycohemoglobin standardization program; OGTT: oral glucose tolerance test; PS: phosphatidylserine; PPP: platelet-poor plasma; SD: standard deviation; TC: total cholesterol; TG: triglycerides; TEM: transmission electron microscopy; T1DM: type 1 diabetes mellitus; T2DM: type 2 diabetes mellitus.
Supplementary Material
Supplementary figure and tables.
Acknowledgements
This study was funded by the Polish National Science Center in the 4th edition of OPUS Competition under grant number UMO-2012/07/B/NZ5/02510 to Ewa Stępień and by Wrovasc Program to Dr Agnieszka Buczyńska-Czyżewska and Prof. Wojciech Witkiewicz. Special thanks to Olga Woźnicka and Michal Kobiałka from Microscopy Laboratory of Institute of Zoology and Biomedical Research (Jagiellonian University) for specimen preparation for cryo-TEM and TEM imaging. Thanks also to Aleksandra Tokarz (PhD candidate) for plasma sample preparations, and Katarzyna Gruba (PhD candidate) for additional statistical research calculations.
Competing Interests
The authors have declared that no competing interest exists.
References
1. Organization WH. Global report on diabetes. Geneva: WHO Press. 2016
2. Rao Kondapally Seshasai S, Kaptoge S, Thompson A, Di Angelantonio E, Gao P, Sarwar N. et al. Diabetes mellitus, fasting glucose, and risk of cause-specific death. N Engl J Med. 2011;364:829-41
3. Lotvall J, Hill AF, Hochberg F, Buzas EI, Di Vizio D, Gardiner C. et al. Minimal experimental requirements for definition of extracellular vesicles and their functions: a position statement from the International Society for Extracellular Vesicles. J Extracell Vesicles. 2014;3:26913
4. Surman M, Stepien E, Hoja-Lukowicz D, Przybylo M. Deciphering the role of ectosomes in cancer development and progression: focus on the proteome. Clin Exp Metastasis. 2017;34:273-89
5. Wolf P. The nature and significance of platelet products in human plasma. Br J Haematol. 1967;13:269-88
6. van der Pol E, Boing AN, Harrison P, Sturk A, Nieuwland R. Classification, functions, and clinical relevance of extracellular vesicles. Pharmacol Rev. 2012;64:676-705
7. Choi DS, Kim DK, Kim YK, Gho YS. Proteomics of extracellular vesicles: Exosomes and ectosomes. Mass Spectrom Rev. 2015;34:474-90
8. Otzen DE, Blans K, Wang H, Gilbert GE, Rasmussen JT. Lactadherin binds to phosphatidylserine-containing vesicles in a two-step mechanism sensitive to vesicle size and composition. Biochim Biophys Acta. 2012;1818:1019-27
9. Ravanat C, Archipoff G, Beretz A, Freund G, Cazenave JP, Freyssinet JM. Use of annexin-V to demonstrate the role of phosphatidylserine exposure in the maintenance of haemostatic balance by endothelial cells. Biochem J. 1992;282( Pt 1):7-13
10. Stepien E, Stankiewicz E, Zalewski J, Godlewski J, Zmudka K, Wybranska I. Number of microparticles generated during acute myocardial infarction and stable angina correlates with platelet activation. Arch Med Res. 2012;43:31-5
11. Tramontano AF, Lyubarova R, Tsiakos J, Palaia T, Deleon JR, Ragolia L. Circulating endothelial microparticles in diabetes mellitus. Mediators Inflamm. 2010;2010:250476
12. Brodsky SV, Zhang F, Nasjletti A, Goligorsky MS. Endothelium-derived microparticles impair endothelial function in vitro. Am J Physiol Heart Circ Physiol. 2004;286:H1910-5
13. Dasgupta SK, Le A, Chavakis T, Rumbaut RE, Thiagarajan P. Developmental endothelial locus-1 (Del-1) mediates clearance of platelet microparticles by the endothelium. Circulation. 2012;125:1664-72
14. Johnson L, Raynel S, Seghatchian J, Marks DC. Platelet microparticles in cryopreserved platelets: Potential mediators of haemostasis. Transfus Apher Sci. 2015;53:146-52
15. Sabatier F, Roux V, Anfosso F, Camoin L, Sampol J, Dignat-George F. Interaction of endothelial microparticles with monocytic cells in vitro induces tissue factor-dependent procoagulant activity. Blood. 2002;99:3962-70
16. Janowska-Wieczorek A, Majka M, Kijowski J, Baj-Krzyworzeka M, Reca R, Turner AR. et al. Platelet-derived microparticles bind to hematopoietic stem/progenitor cells and enhance their engraftment. Blood. 2001;98:3143-9
17. Kim HK, Song KS, Chung JH, Lee KR, Lee SN. Platelet microparticles induce angiogenesis in vitro. Br J Haematol. 2004;124:376-84
18. Suginami K, Sato Y, Horie A, Matsumoto H, Tani H, Mizumoto Y. et al. Platelet-derived microparticles and soluble factors differentially regulate human endometrial epithelial cell movement. Am J Reprod Immunol. 2017:77
19. Sabatier F, Darmon P, Hugel B, Combes V, Sanmarco M, Velut JG. et al. Type 1 and type 2 diabetic patients display different patterns of cellular microparticles. Diabetes. 2002;51:2840-5
20. Tsimerman G, Roguin A, Bachar A, Melamed E, Brenner B, Aharon A. Involvement of microparticles in diabetic vascular complications. Thromb Haemost. 2011;106:310-21
21. Valadi H, Ekstrom K, Bossios A, Sjostrand M, Lee JJ, Lotvall JO. Exosome-mediated transfer of mRNAs and microRNAs is a novel mechanism of genetic exchange between cells. Nat Cell Biol. 2007;9:654-9
22. Srinivasan S, Selvan ST, Archunan G, Gulyas B, Padmanabhan P. MicroRNAs -the next generation therapeutic targets in human diseases. Theranostics. 2013;3:930-42
23. Shantikumar S, Caporali A, Emanueli C. Role of microRNAs in diabetes and its cardiovascular complications. Cardiovasc Res. 2012;93:583-93
24. Turchinovich A, Weiz L, Langheinz A, Burwinkel B. Characterization of extracellular circulating microRNA. Nucleic Acids Res. 2011;39:7223-33
25. Vickers KC, Palmisano BT, Shoucri BM, Shamburek RD, Remaley AT. MicroRNAs are transported in plasma and delivered to recipient cells by high-density lipoproteins. Nat Cell Biol. 2011;13:423-33
26. Huang X, Yuan T, Tschannen M, Sun Z, Jacob H, Du M. et al. Characterization of human plasma-derived exosomal RNAs by deep sequencing. BMC Genomics. 2013;14:319
27. Hunter MP, Ismail N, Zhang X, Aguda BD, Lee EJ, Yu L. et al. Detection of microRNA expression in human peripheral blood microvesicles. PLoS One. 2008;3:e3694
28. Stępień E, Szuścik I, Tokarz A, Enguita FJ, Solnica B, Zurakowski A. et al. The role of microparticles in pathomechanisms of diabetic retinopathy - analysis of intercellular communication mechanisms in endothelial aging. Case control study in patients with metabolic syndrome, diabetes type 1 and type 2. J Med Sci. 2014;4:322-7
29. Zheng XH, Cui C, Zhou XX, Zeng YX, Jia WH. Centrifugation: an important pre-analytic procedure that influences plasma microRNA quantification during blood processing. Chin J Cancer. 2013;32:667-72
30. Fan Y, Siklenka K, Arora SK, Ribeiro P, Kimmins S, Xia J. miRNet - dissecting miRNA-target interactions and functional associations through network-based visual analysis. Nucleic Acids Res. 2016;44:W135-41
31. Szklarczyk D, Franceschini A, Wyder S, Forslund K, Heller D, Huerta-Cepas J. et al. STRING v10: protein-protein interaction networks, integrated over the tree of life. Nucleic Acids Res. 2015;43:D447-52
32. Brown KR, Otasek D, Ali M, McGuffin MJ, Xie W, Devani B. et al. NAViGaTOR: Network Analysis, Visualization and Graphing Toronto. Bioinformatics. 2009;25:3327-9
33. Alexandru N, Badila E, Weiss E, Cochior D, Stepien E, Georgescu A. Vascular complications in diabetes: Microparticles and microparticle associated microRNAs as active players. Biochem Biophys Res Commun. 2016;472:1-10
34. Stepien E, Kablak-Ziembicka A, Czyz J, Przewlocki T, Malecki M. Microparticles, not only markers but also a therapeutic target in the early stage of diabetic retinopathy and vascular aging. Expert Opin Ther Targets. 2012;16:677-88
35. Morel O, Jesel L, Freyssinet JM, Toti F. Cellular mechanisms underlying the formation of circulating microparticles. Arterioscler Thromb Vasc Biol. 2011;31:15-26
36. Issman L, Brenner B, Talmon Y, Aharon A. Cryogenic transmission electron microscopy nanostructural study of shed microparticles. PLoS One. 2013;8:e83680
37. Phang M, Thorne RF, Alkhatatbeh MJ, Garg ML, Lincz LF. Circulating CD36+ microparticles are not altered by docosahexaenoic or eicosapentaenoic acid supplementation. Nutr Metab Cardiovasc Dis. 2016;26:254-60
38. Martin S, Tesse A, Hugel B, Martinez MC, Morel O, Freyssinet JM. et al. Shed membrane particles from T lymphocytes impair endothelial function and regulate endothelial protein expression. Circulation. 2004;109:1653-9
39. Mezentsev A, Merks RM, O'Riordan E, Chen J, Mendelev N, Goligorsky MS. et al. Endothelial microparticles affect angiogenesis in vitro: role of oxidative stress. Am J Physiol Heart Circ Physiol. 2005;289:H1106-14
40. Guo SC, Tao SC, Yin WJ, Qi X, Yuan T, Zhang CQ. Exosomes derived from platelet-rich plasma promote the re-epithelization of chronic cutaneous wounds via activation of YAP in a diabetic rat model. Theranostics. 2017;7:81-96
41. Jansen F, Wang H, Przybilla D, Franklin BS, Dolf A, Pfeifer P. et al. Vascular endothelial microparticles-incorporated microRNAs are altered in patients with diabetes mellitus. Cardiovasc Diabetol. 2016;15:49
42. Sunderland N, Skroblin P, Barwari T, Huntley RP, Lu R, Joshi A. et al. MicroRNA Biomarkers and Platelet Reactivity: The Clot Thickens. Circ Res. 2017;120:418-35
43. Chyrchel B, Toton-Zuranska J, Kruszelnicka O, Chyrchel M, Mielecki W, Kolton-Wroz M. et al. Association of plasma miR-223 and platelet reactivity in patients with coronary artery disease on dual antiplatelet therapy: A preliminary report. Platelets. 2015;26:593-7
44. Diehl P, Fricke A, Sander L, Stamm J, Bassler N, Htun N. et al. Microparticles: major transport vehicles for distinct microRNAs in circulation. Cardiovasc Res. 2012;93:633-44
45. Laffont B, Corduan A, Ple H, Duchez AC, Cloutier N, Boilard E. et al. Activated platelets can deliver mRNA regulatory Ago2*microRNA complexes to endothelial cells via microparticles. Blood. 2013;122:253-61
46. Zhang YY, Zhou X, Ji WJ, Shi R, Lu RY, Li JL. et al. Decreased circulating microRNA-223 level predicts high on-treatment platelet reactivity in patients with troponin-negative non-ST elevation acute coronary syndrome. J Thromb Thrombolysis. 2014;38:65-72
47. Seyhan AA, Nunez Lopez YO, Xie H, Yi F, Mathews C, Pasarica M. et al. Pancreas-enriched miRNAs are altered in the circulation of subjects with diabetes: a pilot cross-sectional study. Sci Rep. 2016;6:31479
48. Jansen F, Nickenig G, Werner N. Extracellular Vesicles in Cardiovascular Disease: Potential Applications in Diagnosis, Prognosis, and Epidemiology. Circ Res. 2017;120:1649-57
49. Chen X, Chen S, Hang W, Huang H, Ma H. MiR-95 induces proliferation and chemo- or radioresistance through directly targeting sorting nexin1 (SNX1) in non-small cell lung cancer. Biomed Pharmacother. 2014;68:589-95
50. Zhang J, Zhang C, Hu L, He Y, Shi Z, Tang S. et al. Abnormal Expression of miR-21 and miR-95 in Cancer Stem-Like Cells is Associated with Radioresistance of Lung Cancer. Cancer Invest. 2015;33:165-71
51. Guo F, Luo Y, Mu YF, Qin SL, Qi Y, Qiu YE. et al. miR-193b directly targets STMN1 and inhibits the malignant phenotype in colorectal cancer. Am J Cancer Res. 2016;6:2463-75
52. Wang L, Zhang Y, Zhao L, Liu S, Yu S, Ma Y. et al. MicroRNA-193b inhibits the proliferation, migration and invasion of gastric cancer cells via targeting cyclin D1. Acta Histochem. 2016;118:323-30
53. Josson S, Gururajan M, Sung SY, Hu P, Shao C, Zhau HE. et al. Stromal fibroblast-derived miR-409 promotes epithelial-to-mesenchymal transition and prostate tumorigenesis. Oncogene. 2015;34:2690-9
54. Cao Y, Feng B, Chen S, Chu Y, Chakrabarti S. Mechanisms of endothelial to mesenchymal transition in the retina in diabetes. Invest Ophthalmol Vis Sci. 2014;55:7321-31
55. Wang X, Huang W, Liu G, Cai W, Millard RW, Wang Y. et al. Cardiomyocytes mediate anti-angiogenesis in type 2 diabetic rats through the exosomal transfer of miR-320 into endothelial cells. J Mol Cell Cardiol. 2014;74:139-50
56. Fu X, Dong B, Tian Y, Lefebvre P, Meng Z, Wang X. et al. MicroRNA-26a regulates insulin sensitivity and metabolism of glucose and lipids. J Clin Invest. 2015;125:2497-509
57. Jakob P, Doerries C, Briand S, Mocharla P, Krankel N, Besler C. et al. Loss of angiomiR-126 and 130a in angiogenic early outgrowth cells from patients with chronic heart failure: role for impaired in vivo neovascularization and cardiac repair capacity. Circulation. 2012;126:2962-75
58. Zernecke A, Bidzhekov K, Noels H, Shagdarsuren E, Gan L, Denecke B. et al. Delivery of microRNA-126 by apoptotic bodies induces CXCL12-dependent vascular protection. Sci Signal. 2009;2:ra81
59. Li J, Zhang Y, Liu Y, Dai X, Li W, Cai X. et al. Microvesicle-mediated transfer of microRNA-150 from monocytes to endothelial cells promotes angiogenesis. J Biol Chem. 2013;288:23586-96
60. Reza AM, Choi YJ, Yasuda H, Kim JH. Human adipose mesenchymal stem cell-derived exosomal-miRNAs are critical factors for inducing anti-proliferation signalling to A2780 and SKOV-3 ovarian cancer cells. Sci Rep. 2016;6:38498
61. Ghayad SE, Rammal G, Ghamloush F, Basma H, Nasr R, Diab-Assaf M. et al. Exosomes derived from embryonal and alveolar rhabdomyosarcoma carry differential miRNA cargo and promote invasion of recipient fibroblasts. Sci Rep. 2016;6:37088
62. Tokarz A, Szuscik I, Kusnierz-Cabala B, Kapusta M, Konkolewska M, Zurakowski A. et al. Extracellular vesicles participate in the transport of cytokines and angiogenic factors in diabetic patients with ocular complications. Folia Med Cracov. 2015;55:35-48
63. Todorova D, Simoncini S, Lacroix R, Sabatier F, Dignat-George F. Extracellular Vesicles in Angiogenesis. Circ Res. 2017;120:1658-73
64. Coumans FAW, Brisson AR, Buzas EI, Dignat-George F, Drees EEE, El-Andaloussi S. et al. Methodological Guidelines to Study Extracellular Vesicles. Circ Res. 2017;120:1632-48
65. Wagner J, Riwanto M, Besler C, Knau A, Fichtlscherer S, Roxe T. et al. Characterization of levels and cellular transfer of circulating lipoprotein-bound microRNAs. Arterioscler Thromb Vasc Biol. 2013;33:1392-400
66. Yuana Y, Boing AN, Grootemaat AE, van der Pol E, Hau CM, Cizmar P. et al. Handling and storage of human body fluids for analysis of extracellular vesicles. J Extracell Vesicles. 2015;4:29260
67. Cointe S, Judicone C, Robert S, Mooberry MJ, Poncelet P, Wauben M. et al. Standardization of microparticle enumeration across different flow cytometry platforms: results of a multicenter collaborative workshop. J Thromb Haemost. 2017;15:187-93
68. Pin AL, Houle F, Guillonneau M, Paquet ER, Simard MJ, Huot J. miR-20a represses endothelial cell migration by targeting MKK3 and inhibiting p38 MAP kinase activation in response to VEGF. Angiogenesis. 2012;15:593-608
69. Icli B, Dorbala P, Feinberg MW. An emerging role for the miR-26 family in cardiovascular disease. Trends Cardiovasc Med. 2014;24:241-8
70. Wang Y, Sun B, Sun H, Zhao X, Wang X, Zhao N. et al. Regulation of proliferation, angiogenesis and apoptosis in hepatocellular carcinoma by miR-26b-5p. Tumour Biol. 2016;37:10965-79
71. Zhang H, Bai M, Deng T, Liu R, Wang X, Qu Y. et al. Cell-derived microvesicles mediate the delivery of miR-29a/c to suppress angiogenesis in gastric carcinoma. Cancer Lett. 2016;375:331-9
72. Liao YY, Tsai HC, Chou PY, Wang SW, Chen HT, Lin YM. et al. CCL3 promotes angiogenesis by dysregulation of miR-374b/ VEGF-A axis in human osteosarcoma cells. Oncotarget. 2016;7:4310-25
73. Bridge G, Monteiro R, Henderson S, Emuss V, Lagos D, Georgopoulou D. et al. The microRNA-30 family targets DLL4 to modulate endothelial cell behavior during angiogenesis. Blood. 2012;120:5063-72
74. Kriegel AJ, Baker MA, Liu Y, Liu P, Cowley AW Jr, Liang M. Endogenous microRNAs in human microvascular endothelial cells regulate mRNAs encoded by hypertension-related genes. Hypertension. 2015;66:793-9
75. Pencheva N, Tran H, Buss C, Huh D, Drobnjak M, Busam K. et al. Convergent multi-miRNA targeting of ApoE drives LRP1/LRP8-dependent melanoma metastasis and angiogenesis. Cell. 2012;151:1068-82
76. Li Y, Song YH, Li F, Yang T, Lu YW, Geng YJ. MicroRNA-221 regulates high glucose-induced endothelial dysfunction. Biochem Biophys Res Commun. 2009;381:81-3
77. Minami Y, Satoh M, Maesawa C, Takahashi Y, Tabuchi T, Itoh T. et al. Effect of atorvastatin on microRNA 221 / 222 expression in endothelial progenitor cells obtained from patients with coronary artery disease. Eur J Clin Invest. 2009;39:359-67
Author contact
![]() Corresponding authors: Prof. Ewa L. Stępień, Zakład Fizyki Medycznej, Instytut Fizyki im. M. Smoluchowskiego Uniwersytet Jagielloński, ul. Łojasiewicza 11, 30-348 Kraków, Polska. E-mail: e.stepienedu.pl; Tel: +48 126644762; Fax: +48 126644905 and Prof. Francisco J. Enguita, Instituto de Medicina Molecular, Faculdade de Medicina, Universidade de Lisboa, 1649-028 Lisboa, Portugal. E-mail: fenguitaulisboa.pt; Tel: +351-21-7999480
Corresponding authors: Prof. Ewa L. Stępień, Zakład Fizyki Medycznej, Instytut Fizyki im. M. Smoluchowskiego Uniwersytet Jagielloński, ul. Łojasiewicza 11, 30-348 Kraków, Polska. E-mail: e.stepienedu.pl; Tel: +48 126644762; Fax: +48 126644905 and Prof. Francisco J. Enguita, Instituto de Medicina Molecular, Faculdade de Medicina, Universidade de Lisboa, 1649-028 Lisboa, Portugal. E-mail: fenguitaulisboa.pt; Tel: +351-21-7999480