Impact Factor
- Issue 14; 2026
- Issue 13; 2026
- Issue 12; 2026
- Issue 11; 2026
- Issue 10; 2026
- Volume 16; 2026
- Advance Articles
- Past Issues
- Cover Images
- Cover Suggestion
- Index & Coverage
- Special Issues
Introduction
Methods
Results
Discussion and conclusion
Abbreviations
Supplementary Material
References
International Journal of Biological Sciences
International Journal of Medical Sciences
 Global reach, higher impact

Theranostics 2018; 8(12):3400-3407. doi:10.7150/thno.24322 This issue Cite
Research Paper
Molecular detection of inflammation in cell models using hyperpolarized 13C-pyruvate
Renuka Sriram, Julia Nguyen, Justin DeLos Santos, Linda Nguyen, Jinny Sun, Seth Vigneron, Mark Van Criekinge, John Kurhanewicz, John D. MacKenzie ![]()
Department of Radiology and Biomedical Imaging, University of California San Francisco, San Francisco, California, USA
Received 2017-12-12; Accepted 2018-4-16; Published 2018-5-23
Abstract

The detection and treatment monitoring of inflammatory states remain challenging in part due to the multifactorial mechanisms of immune activation and spectrum of clinical manifestations. Currently, diagnostic strategies tend to be subjective and limited quantitative tools exist to monitor optimal treatment strategies. Pro-inflammatory M1 polarized macrophages exhibit a distinct metabolic glycolytic phenotype compared to the continuum of M2 polarization states. In the present study, the distinct metabolic phenotypes of resting and activated macrophages were successfully characterized and quantified using hyperpolarized carbon-13 (13C) labeled pyruvate and its metabolic products, i.e. lactate, as a biomarker of resting, disease and treated states.
Methods: Mouse macrophage J774A.1 cells were used as a model system in an NMR compatible bioreactor to facilitate dynamic hyperpolarized 13C measurements. The glycolytic metabolism of the cells in the quiescent or resting state were compared with macrophages stimulated by lipopolysaccharide, a classical M1 activator using hyperpolarized 13C labeled pyruvate. Additionally, the activated macrophages were also treated with a non-steroidal anti-inflammatory drug to assess the changes in hyperpolarized lactate signal. The hyperpolarized lactate signals were then correlated using biochemical and molecular assays.
Results: We first validated our model system of inflammatory cells by the hallmarks of M1 polarization using steady state metabolic profiling with high resolution NMR in conjunction with nitric oxide Greiss assay, enzyme activity, and mRNA expression. Subsequently, we clearly showed that the cutting edge technology of hyperpolarized 13C NMR can be used to detect elevated lactate levels in M1 polarized macrophages in comparison to control and non-steroidal anti-inflammatory drug treated M2 states.
Conclusion: Hyperpolarized 13C lactate has the potential to serve as a biomarker to non-invasively detect and quantify pro-inflammatory state of immune regulatory cells and its response to therapy.
Keywords: hyperpolarized 13C nuclear magnetic resonance (MR), dynamic nuclear polarization (DNP), pyruvate, lactate, M1 polarization, macrophages, inflammation
Introduction
Inflammation is central to many disease states, such as the initial host defense mechanism against invasive pathogens or noxious stimulus, is implicated in cardiovascular disease, and is an important part of the reparative process after trauma. Acute inflammation consists of two cohesive processes— pro-inflammatory and anti-inflammatory (or repair mode)—in fine balance. A dysregulation of these states is central to chronic inflammatory disease. Specifically, a sustained pro-inflammatory state or M1 polarization of the immune effector cells spans a diverse number of diseases including inflammatory arthritis [1]. However, currently no diagnostic tools are available to access these states, and clinically, very limited tools are readily available to monitor optimal treatment strategies. For example, rheumatoid arthritis affects 1% of the geriatric population, but clinical measures for detection and treatment monitoring are either invasive or fail to provide a direct indication of arthritis activity and are often subjective and difficult to standardize [2-4]. Furthermore, rheumatologists often rely on subjective clinical opinion alone to make important treatment decisions [5]. The costs of new anti-inflammatory treatments for autoimmune disease are high, and the impact on society resulting from the disabilities is even higher [6].
Carbon-13 magnetic resonance spectroscopic imaging (13C-MRSI) with dissolution dynamic nuclear polarization (dDNP) is a molecular imaging/ spectroscopic strategy that has the potential to address these needs. This technique is noninvasive and quantitative, and can monitor metabolic processes repeatedly over time, which may allow for real-time monitoring of inflammatory responses in vivo. The 13C-MRSI with dDNP technique is free of ionizing radiation, as it relies on an applied magnetic field to detect a signal that is proportional to the spin polarization of magnetic nuclei [7]. The main drawback of 13C-MRSI, however, is the limited time to acquire information as the signal from hyperpolarized agents is short: the half-life of current 13C-MRSI probes is in the range of 30-60 s.
Pyruvate, the most widely studied molecular probe for dDNP, has several attractive features that make it desirable to test its potential as an imaging biomarker of inflammation. Carbon-13 labeled pyruvate is nontoxic, can be readily polarized to a high state with dDNP, has a relatively long T1 relaxation time, and has been shown to be a robust indicator of glycolytic phenotype of cancer cells [8]. This ultimate property is key for enabling this technology towards biomarker development in inflammatory diseases as the activated cells switch to a glycolytic state.
Previous work by members of our group showed the conversion of pyruvate to lactate with elevated lactate levels localized to sites of inflammation in the adjuvant induced arthritis rat model [9]. The goal of this study is to further understand the molecular and metabolic underpinnings of inflammation in glycolytic pathways using in vitro macrophage cell models of inflammation. Macrophages are first responders as well as regulators of immunological processes and play a central role in both beneficial and detrimental outcomes in inflammation. They help initiate and recruit other immune cells and are activated and deactivated as they participate in the autoregulatory loop in the inflammatory process. Hence, the metabolic state (i.e., polarization) of the macrophages is a direct readout of the inflammatory process. The aim of this work is to investigate the metabolic alterations of macrophage cells upon activation/stimulation and response to treatment using hyperpolarized [1-13C]pyruvate.
Methods
Cell preparation
Immortalized mouse macrophage cells (J774A.1) were procured from American Type Culture Collection (ATCC, Manassas VA) and were cultured in RPMI 1640 media as recommended by ATCC. Prior to hyperpolarized experiments cells were detached using Ca2+ and Mg2+ free phosphate buffered saline with 0.04% EDTA. Broadly, the cells were divided into three groups: i) control; ii) activated/stimulated, with 100 ng/mL of E. coli lipopolysaccharides (LPS) (Sigma Aldrich, St. Louis, MO) for 24 h; or, iii) treated, with pre-incubation of 10 μM of indomethacin (Sigma Aldrich, St. Louis, MO), a non-steroidal anti-inflammatory drug for 4 days with simultaneous administration during the last 24 h of LPS stimulation and indomethacin before measurement.
Nitric oxide assay and treatment with indomethacin
Nitric oxide (NO) production in J774A.1 cells of the three groups was determined by measuring the levels of nitrite, a stable breakdown product of NO, in the media supernatant of the J774A.1 macrophages according to the Griess reaction (Promega, Madison, WI) from three biological replicates for each group. Briefly, media from each plate (50 μL) was mixed with 1% sulfanilamide in 5% phosphoric acid solution (50 μL) and incubated at room temperature for 10 min. Subsequently, 0.1% N-1-napthylethylenediamine dihydrochloride in deionized water (50 μL) was added to each mixture, followed by incubation for 10 min. Absorption was measured at 540 nm using a microplate reader (Synergy 2, BioTek, VT, USA), and nitrite content was calculated by comparison to a sodium nitrite standard curve.
Measurement of lactate production using steady state proton nuclear magnetic resonance (NMR) spectroscopy
Lactate efflux was measured in control and LPS stimulated cells from three 75 cm2 cell culture flasks, each at 60-80% confluency. Fresh media was added to all flasks at the beginning of the experiment and 1 mL of media was sampled every 30 min for 2 h from each of the cell culture flasks. 540 μL of the sampled media was then added to 60 μL of D2O containing 0.75% of trimethylsiylyl pentanoic acid (TSP) (Sigma Aldrich, St. Louis, MO, USA) for internal concentration and chemical shift reference. Spectroscopic profiles of the media samples were obtained with proton NMR on an 800 MHz Avance I Bruker spectrometer (Bruker Inc, Billerica, MA, USA) using a presaturation sequence with a 90° RF pulse, relaxation delay of 1 s, and 128 repetitions with a sweep width of 12 KHz and 12288 points. Topspin (Bruker Inc, Billerica, MA, USA) was used to process the spectra (after a 1 Hz line broadening, phasing and baseline correction) and quantify the lactate concentration of the media samples using TSP as the reference standard and corrected for the short repetition time used for data acquisition.
Measurement of intracellular metabolites of cell extracts using NMR
Equal number of macrophage cells were aliquoted into ten 75 cm2 cell culture flasks. Five of the plates were treated with 100 ng/mL of LPS in the media, and five were used for control cells. Of the five plates from each group, two were used for cell count to ensure equal number of cells and three were used for the assay. At the end of 24 h, the cells were extracted using the cold methanol chloroform procedure [10]. The aqueous phase was lyophilized and reconstituted in D2O with 1 mM TSP. The prepared extracts were also measured using high resolution proton NMR as detailed above. Chenomx NMR Suite (Chenomx, Alberta, Canada) was used for identification and quantification of the different metabolites using TSP as a concentration reference. Briefly, after 1 Hz line broadening and proper phasing of each spectrum using the processor, the TSP peak was designated as the reference compound in the profiler. Using the compound reference library inbuilt in Chenomx (based on the HMDB database), the different metabolites were identified and quantified automatically using the peak-fit routine. After, the automatic fitting routine of the Chenomx, we manually verified the fitted peak areas by inspecting the fitting robustness as well as the difference spectrum. The table in the supplementary information lists the chemical shifts of the peaks and their multiplicity used for its quantitation.
Analysis of ribonucleic acid (RNA) expression by quantitative real-time reverse transcriptase polymerase chain reaction
Total RNA was extracted from J774A.1 cells for each group in triplicate using Qiagen's RNeasy Mini Kit and was reverse transcribed using iScript cDNA Synthesis Kit (BioRad Laboratories, Hercules, CA, USA). Polymerase chain reaction was performed using Piko-Real (Thermofisher, Fremont CA, USA) for RNA expression levels of genes of interest, namely, lactate dehydrogenase A and B isoforms (LDHA/B) and monocarboxylate transporters 1 and 4 isoforms (MCT1/4), using Taqman probes (Applied Biosystems, Foster City, CA, USA) as described previously [11]. β-actin was used as the housekeeping gene, and the relative difference from the control cells was calculated for each primer/probe combination.
Measurement of enzyme activity
Lactate dehydrogenase (LDH) activity of cell lysates was measured spectrophotometrically by quantifying the linear decrease in reduced nicotinamide adenine dinucleotide (NADH) absorbance at varying pyruvate concentrations at 339 nm using a micro-plate reader (Tecan Group Ltd., Switzerland) over 10 min. The maximum velocity and the Michaelis-Menten constant (Km) were estimated using the Lineweaver-Burke plot. Nicotinamide adenine dinucleotide (NAD), a required cofactor for the conversion of pyruvate to lactate via LDH, was assayed using a NADH/NAD Quantification Kit (Biovision, Milpitas, CA), a calorimetric assay that uses a NAD cycling enzyme mix to detect NADH and NAD that is quantified using a NADH standard curve. Both these assays were done in three biological replicates for each group.
Measurement of hyperpolarized 13C-lactate with NMR
J774A.1 macrophage cells were cultured on the surface of polystyrene beads in order to facilitate its use in the NMR compatible bioreactor without altering its baseline metabolism. Twenty million J774A.1 cells were mixed with 500 μL of Cytodex micro-carrier beads (Sigma Aldrich, C0646-5G, lot # SLBK0652V) and plated on 100 mm low-attachment culture dishes. Cells were either left as control or activated with 100 ng/mL LPS. For the indomethacin treated group, cells were pretreated as described earlier on cell culture plates for 4 days with 10 μM of indomethacin, before being mixed with the microcarrier beads along with the drug as well as LPS. For all three groups, the same number of cells were incubated with the same volume of Cytodex micro-carrier beads. After 24 h of incubation, 250 μL of the microcarriers were loaded in a 5 mm bioreactor and perfused with RPMI 1640 media at a flow rate of 0.5 mL/min. The media was kept at 37 °C with water-jacketed perfusion lines and maintained at 5% CO2 via gas exchanger as detailed before [12]. There was no observable difference in the cell viability or adherence to the micro-carrier beads between the three groups. This was observed by microscopic inspection of the micro-carrier beads prior-to and post hyperpolarized NMR experiments, in addition to trypan blue assessment of cell viability.
Experiments were conducted on a 500 MHz Varian Inova (Agilent Technologies, Santa Clara, CA) with a 5 mm probe at 37 °C. The hyperpolarized [1-13C]lactate signal in the cells was then measured with 13C NMR after infusion of 750 μL of hyperpolarized [1-13C]pyruvate into the bioreactor over 90 s. 7.5 μL of [1-13C]pyruvic acid with 15 mmol of the trityl radical (GE Healthcare, Waukesha, WI, USA) was polarized on a Hypersense polarizer (Oxford Instruments, Oxfordshire, England), which was followed by dissolution in 5 mL of 50 mM phosphate buffer as described previously [11]. NMR data was acquired dynamically with a 30° flip-angle and pulse repetition time of 3 s for a total of 5 minutes, using a sweep width of 100 ppm and acquisition time of 2 s, obtaining 40,000 points. Cell viability was verified by measuring the nucleoside triose phosphate peaks (predominantly arising from the ATP molecule) using 31P NMR acquired using a repetition time of 2 s and a RF flip angle of 90° with 2048 repetitions, with a sweep width of 20 kHz and 40,000 points (see supplementary methods for additional information).
All NMR spectra were processed using Advanced Chemistry Development, Inc. (ACD/Labs) (Toronto, ON, Canada). The 31P spectra were filtered using an exponential window and 20 Hz line broadening, followed by phasing and baseline correction. Peak integrals were quantified using an in-built Lorentzian / Gaussian line shape fitting routine manually to minimize residuals. The dynamic 13C spectra was summed on the Varian console itself and then processed with 2 Hz line broadening and automatic spline - baseline correction in ACD/Labs and the peak areas were quantified using the above-mentioned routine, and the data are represented as a summed ratio of lactate / pyruvate of the entire dynamic curve.
Statistical analysis
T-test was used to compare LPS stimulated with control cells using Microsoft Excel (Seattle, WA). One-way ANOVA was used to compare the LPS stimulated cells and treated cells with the control cells with Tukey's post-hoc test for statistical significance (p<0.05) using PRISM (GraphPad, Software, La Jolla, CA). All data are represented as mean ± standard error.
Results
Confirmation of metabolic markers of macrophage activation
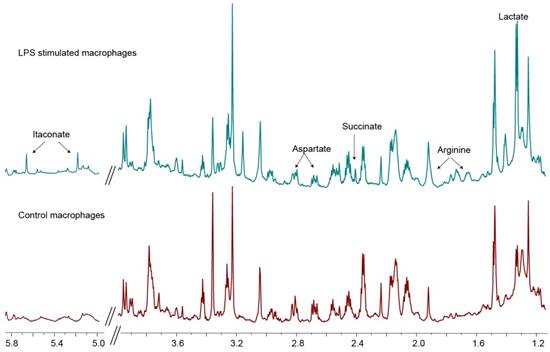
Upon LPS stimulation, macrophages polarize to the M1 state characterized by NO production and a glycolytic phenotype [13]. To confirm the increase in glycolysis upon stimulation of macrophages, the media of control cells and LPS stimulated macrophages were assessed for lactate for 2 h. The rate of lactate excretion in the stimulated cells (3.54 ± 0.28 nmol/min) was significantly higher (p<0.05) compared to the control macrophages (1.53 ± 0.39 nmol/min), confirming the enhanced glycolytic state upon LPS stimulation, congruent with M1 polarization state. Figure 1 compares the metabolite peaks in the control macrophages with that of the LPS stimulated cells obtained from the aqueous phase of the cell extractions. The associated quantification of the metabolite levels is listed in Table 1. As expected the increased glycolysis in activated macrophages (LPS stimulated) is observed by the significant increase in lactate levels (3 fold). Other key markers indicative of M1 polarization are the significant increase in arginine levels by 416% as well as the observed production of itaconate, which was not detectable in the control cells. Of the choline moieties, we saw a significant upregulation of glycerophosphocholine in the LPS stimulated macrophages, indicative of highly proliferative cells. Another hallmark of stimulated macrophages (or M1 polarization) is the production of NO. The successful stimulation (M1 polarization) of the inflammatory cells was confirmed by measuring the NO production by Greiss assay. In the control conditions, there was negligible NO production, which was significantly elevated to 17 ± 3 μM in LPS stimulated cells (p<0.05). We further used the Greiss assay as a measure of treatment efficacy. The indomethacin treated cells showed a significant reduction in NO to 10 ± 3 μM (p<0.05). This dose of the non-steroid anti-inflammatory drug was used for treatment in the hyperpolarized studies.
1H spectra of cell extracts. 800 MHz spectra of cell extracts of control macrophages (lower spectrum) and that of LPS-treated macrophages (top spectrum). The labeled peaks, namely itaconate, arginine and lactate, indicate the significantly elevated metabolites in LPS-stimulated macrophages that are indicative of the M1 polarization state.
Metabolite concentrations in control cells versus LPS-stimulated cells.
| Metabolite | Metabolite concentrations (μM) | Significance (p-value) | |
|---|---|---|---|
| Control | LPS | ||
| Acetate | 17.3 ± 1.8 | 13.5 ± 0.6 | 0.118 |
| Alanine | 54.4 ± 8.4 | 56.4 ± 1.9 | 0.821 |
| Arginine | 13.8 ± 2.5 | 57.3 ± 8.4 | 0.008* |
| Aspartate | 73.0 ± 10.3 | 37.9 ± 3.2 | 0.031* |
| Choline | 0.93 ± 0.2 | 1.1 ± 0.2 | 0.59 |
| Citrate | 7.1 ± 1.1 | 10.0 ± 0.7 | 0.083 |
| Creatine | 36.9 ± 5.3 | 48.3 ± 3.0 | 0.136 |
| Glutamate | 136.0 ± 22.8 | 83.2 ± 3.1 | 0.084 |
| Glutamine | 60.1 ± 11.9 | 82.6 ± 4.4 | 0.151 |
| Glutathione | 35.9 ± 6.9 | 40.9 ± 7.28 | 0.644 |
| Glycerophosphocholine | 2.8 ± 0.5 | 5.8 ± 0.3 | 0.009* |
| Itaconate | 0 | 16.9 ± 3.43 | 0.008* |
| Lactate | 26.8 ± 2.9 | 82.6 ± 4.6 | 0.001* |
| Phophocholine | 21.3 ± 3.4 | 28.7 ± 1.7 | 0.126 |
| Pyruvate | 2.8 ± 0.4 | 2.4 ± 0.2 | 0.417 |
| Succinate | 1.7 ± 0.4 | 5.2 ± 0.2 | 0.001* |
| Taurine | 70.2 ± 7.0 | 38.1 ± 1.2 | 0.011* |
Data is displayed as mean ± standard error with the corresponding p-values of t-tests listed. The significant changes (p<0.05) in metabolite concentrations between the control and treated cells are indicated by bolded text and an asterix.
Non-invasive measurement of macrophage activation and treatment using NMR and hyperpolarized 13C-lactate
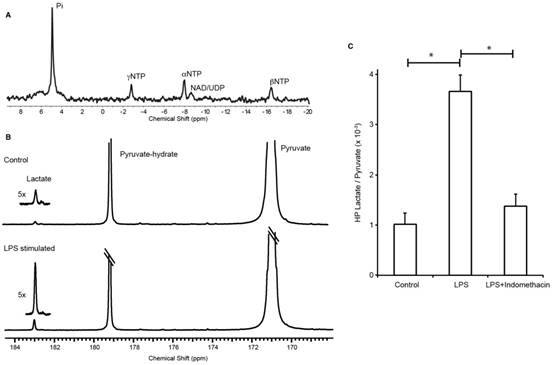
J774A.1 macrophages were successfully grown on the surface of polystyrene beads (cytodex) and transferred to a micro-engineered bioreactor system to study in situ metabolism using NMR. The beads facilitated key areas of the experimental design: 1) cell growth, 2) easy transfer from tissue culture to the bioreactor system (the beads eliminated the need to trypsinize cells off the tissue culture plates), 3) consistent and even distribution of cells (20 million cells) in the active region of the NMR coil, and 4) space among the beads to perfuse media with dissolved gases, and hyperpolarized [1-13C] pyruvate. To that end, the bioenergetics of the cells were assessed using 31P with no measurable phospho-esters, a metabolic marker indicative of high cell proliferation (Figure 2A). However, the strong nucleoside triosephosphate signals indicate normal physiological function. The hyperpolarized 13C lactate/pyruvate ratio was significantly elevated in the LPS stimulated cells (mean ± SD = 3.66 ± 0.33 ×10⁻³, n=5) in comparison to control (1.02 ± 0.23 ×10⁻³, n=6) and treated (1.38 ± 0.24 ×10⁻³, n=7) groups, p=0.0001 for both comparisons (Figure 2B-C). The dynamic spectra of the hyperpolarized pyruvate and lactate signals in the LPS stimulated macrophages are provided in Figure S1.
Three-fold elevation in the production of hyperpolarized 13C-lactate after LPS stimulation in a macrophage cell model of inflammation. (A) 31P spectrum shows viable cells with normal physiology. (B) 13C-NMR spectrum of hyperpolarized signals normalized to pyruvate signal shows elevation of lactate production in LPS-activated macrophages in comparison to control (inset is 5x magnification of the lactate spectra). (C) Bar graph shows the 3.5-fold increase in hyperpolarized 13C-lactate after LPS stimulation in the macrophages and its subsequent reduction to baseline (control cells) with indomethacin treatment.
Investigation of molecular underpinnings of increased hyperpolarized lactate as a biomarker of inflammation
The key molecular mechanisms of lactate metabolism were studied in J774A.1 cells to understand the increased lactate signal observed by hyperpolarized NMR. Enzyme/transporter expression, LDH activity and NADH levels (Figure 3A) are potential regulatory sites responsible for the 3.5-fold increase in conversion of hyperpolarized pyruvate to lactate we observed in LPS stimulated macrophages. NADH, an essential cofactor of LDH, was increased (Figure 3B) by 50% in the activated macrophages (23.4 ± 1.4 fmol/cell, p=0.0059) compared to the control cells (15.4 ± 0.5 fmol/cell).
Molecular underpinnings of increased hyperpolarized lactate signal. (A) Schematic representation of hyperpolarized pyruvate metabolism in activated macrophages. (B) NADH content in the stimulated and control cells measured using a calorimetric assay. (C) RNA expression of stimulated macrophages relative to control cells (normalized to the housekeeping gene L19). Increased LDHA expression with a concomitant increase in the monocarboxylate transporters (MCT1 and MCT4) synergistically promote increased lactate production as well as efflux. LDHb/a: isoenzymes A and B of lactate dehydrogenase; MCT1/4: monocarboxylate transporters 1 and 4. (D) The LDH activity measured in stimulated macrophages reflects the increased LDHA expression compared to the control cells. (* denotes significant change from control, p<0.05)
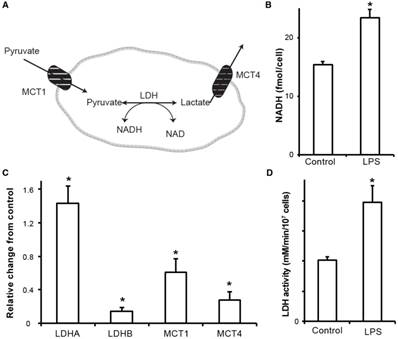
The primary regulation of intracellular lactate concentration occurs via LDHA/B enzymatic transformation of pyruvate to lactate and by intra/extracellular transportation of lactate via cell surface MCT1/4 molecules. Figure 3C shows the gene expression levels of LDHA/B and MCT1/4 measured in RNA extracts from LPS-stimulated and control J774A.1 macrophages. LPS stimulation resulted in a significant upregulation of LDHA expression, 43 ± 5 % (p<0.05), which has a higher Km for pyruvate, and the LDHB isoform was significantly downregulated by 86 ± 1% (p<0.05). Taken together, these result in the metabolic profile being skewed towards increased lactate signal. Furthermore, expression levels of MCT1 and 4 were significantly downregulated by 40 ± 0.2 % (p=0.01) and 73 ± 1 ×10⁻³% (p=0.003), respectively, in the activated cells and thereby promotes less extracellular efflux and increased intracellular lactate concentration. Concomitant with all the above molecular changes, the LDH activity was also significantly (p<0.005) increased by 50% in stimulated cells (3.96 ± 0.16 mM NADH/min/106 cells) compared to the control cells (2.04 ± 0.01 mM NADH/min/106 cells) (Figure 3D).
Decreased hyperpolarized lactate/pyruvate ratio in treated macrophages can be attributed to the fast, non-steady state kinetic measure of LDH enzyme activity
Upon treatment of the macrophages with indomethacin, the hyperpolarized lactate to pyruvate ratio decreased significantly, further reinforcing that lactate could potentially serve as a biomarker of therapy. However, most of the molecular effectors responsible for the observed increase in hyperpolarized lactate did not decrease with indomethacin treatment, such as the NADH levels and LDHA mRNA expression. In fact, the LDH activity and mRNA levels of the cells pretreated with indomethacin alone were similar (Figure S2) to that of LPS+indomethacin treated cells, pointing towards a non-specific effect of the non-steroid anti-inflammatory drug. Furthermore, the lactate efflux as well as the intracellular lactate in the treated cells were non-significantly decreased to 3.28 ± 0.08 nmol/min and 68.7 ± 7.5 μM respectively, compared to those in the stimulated cells (3.5 ± 0.28 nmol/min and 82.6 ± 4.6 μM). However, with indomethacin treatment of LPS stimulated cells, the Km of the LDH enzyme increased significantly to 0.2 ± 0.03 mM compared to 0.08 ± 0.002 mM in the stimulated cells (p=0.017). This suggests an inhibitory effect of the drug (either directly or by indirect means) on the LDH enzyme with no significant change in the maximal velocity of LDH (3.97 ± 0.15 mM NADH/min in stimulated cells and 4.15 ± 0.41 mM NADH/min in treated cells).
Discussion and conclusion
This work examined lactate as a biomarker of inflammation in a robust cell model system to study key metabolic pathways for inflammation. Lactate was non-invasively measured using carbon-13 molecular imaging and we showed that the lactate signals correlate with inflammation and response to treatment. M1 polarized macrophage cells stimulated with LPS, had elevated levels of hyperpolarized 13C-lactate after the administration of hyperpolarized 13C-pyruvate. We further corroborated these findings by detailing key molecular mechanisms that promote elevated intracellular lactate concentration: a net increase in LDH activity via increased cofactor NADH and increased mRNA expression of LDHA isoenzyme with a concomitant decrease in LDHB and a net decrease in lactate transport out of the cell via decrease in MCT1/4 expression.
The increased NADH upon LPS stimulation is in line with prior observation by Haschemi et al [14]. It has been shown [15] that the mRNA expression levels of MCT1 in LPS treated macrophages, while initially high (4 h post stimulation), can be reduced to almost zero by 16 h, validating our results. However, the same work also showed persistent protein expression of the transporter, clearly exemplifying the transient nature of mRNA expression and the discordance between the mRNA levels and protein expression. The slight downregulation of LDHB may also have important indications for inflammation. LDH5 is the LDH isoenzyme with the highest efficiency to catalyze pyruvate to lactate, and downregulation of LDHB could mediate an LDH isozyme pattern shift to LDH5 [16]. Thus, the activation of immune cells results in downregulation of LDHB to meet the higher energy demands and the need to metabolize more pyruvate to lactate.
Our initial cell experiments to confirm M1 polarization state include a characterization of the metabolite profile using proton NMR. Upregulated glycolysis was verified by the increase in lactate levels both intracellularly as well as in the rate of lactate efflux, a hallmark of M1 polarization [17]. Similarly, significant upregulation of arginine observed in the stimulated macrophages plays a central role in the M1 polarization of macrophages via NO production [18]. Concomitant with arginine, we saw an increased pool of aspartate in the stimulated macrophages. This metabolite has a dual functionality in stimulated macrophages: it serves as 1) a key component of the arginosuccinate cycle for sustained arginine pool geared towards NO production [19] and 2) as an anaplerotic source to replenish fumarate due to the truncation of the TCA cycle at the succinatedehydrogenase step [20]. Congruent to that, succinate, a known metabolite intrinsic to immune signaling in LPS stimulated cells [21] was also observed to be higher. The recently discovered itaconic acid in activated macrophages, [22] which has been shown to have antimicrobial properties [23], was significantly elevated, indicating a further fractured TCA cycle. However, we did not observe a significant increase in citrate. Although not significant, we registered an increase in citrate levels, which effluxes out of the cycle to produce itaconaic acid in the LPS stimulated macrophages, similar to prior work [24]. These associated increases in arginine, aspartate, succinate and itaconate in LPS stimulated macrophages are a clear indication of M1 polarization as shown previously [25-27].
Treatment with indomethacin decreased inflammation perceived as a reduction in NO production (less than 50%), indicating reversal of macrophage polarization. Interestingly, the hyperpolarized lactate, which serves as a biomarker of M1 polarization, was also decreased, thereby functioning as a marker of drug efficacy too. The observed non-specific effect of the drug alone, in terms of increased LDHA mRNA expression, is similar to the observations by Schnyder et al [28]. However, the striking increase in Km of the LDH enzyme could explain the hyperpolarized lactate / pyruvate signal being decreased compared to the stimulated cells. Additionally, this exemplifies the notion that the hyperpolarized signal observed represents the initial rate kinetics and is not a steady state measure. This shift in Km (without an alteration in maximal enzyme velocity) could be due to either: 1) an incidental consequence on the LDH isozyme composition change as indomethacin does not seem to inhibit LDH activity [29] or 2) an indirect effect on LDH. One plausible mechanism of action for indomethacin to reverse the inflammatory response is its inhibitory effect on NO activated mechanisms, as has been shown by Summ and Evers [30].
This study showed how lactate is quantifiable and may be used as a non-invasive molecular marker of inflammation and treatment response. However, for clinical translation, the background lactate could be an issue when highly glycolytic tissue is involved and would be confounded by the number of activated macrophages at the site of inflammation. However, a recent study by Guglielmetti et al [31] in a mouse model of multiple sclerosis of neuro-inflammation showed that hyperpolarized lactate is increased due to inflammatory effectors. Similarly, in the heart, another non-glycolytic organ, it has been shown that hyperpolarized lactate signal is indicative of inflammatory processes in a rat model of myocardial infarction, with as few as 350-500 monocytes/mg of tissue [32].
Hyperpolarized 13C NMR has the potential for preclinical tests of drug efficacy in addition to the study of metabolic pathways and their alteration by inflammatory processes. Unlike other molecular imaging techniques that are still experimental, this technique is currently being employed in 7 clinical sites across the world to study biological processes and oncologic and cardiac applications, and can thus translate rapidly to clinical use for inflammatory disorders such as rheumatoid arthritis.
Abbreviations
13C-MRSI: carbon-13 magnetic resonance spectroscopic imaging; dDNP: dissolution dynamic nuclear polarization; LDH: lactate dehydrogenase; LPS: lipopolysaccharides; MCT: monocarboxylate transporter; NAD: nicotinamide adenine dinucleotide; NMR: nuclear magnetic resonance; NO: nitric oxide; TSP: trimethylsiylyl pentanoic acid; RNA: ribonucleic acid.
Supplementary Material
Supplementary figures and tables.
Competing Interests
The authors have declared that no competing interest exists.
References
1. Antonio Sica AM. Macrophage plasticity and polarization: in vivo veritas. J Clin Invest. 2012;122:787-95
2. Ravelli A, Martini A. Juvenile idiopathic arthritis. Lancet. 2007;369:767-78
3. Felson DT, Anderson JJ, Boers M, Bombardier C, Chernoff M, Fried B. et al. The American College of Rheumatology preliminary core set of disease activity measures for rheumatoid arthritis clinical trials. The Committee on Outcome Measures in Rheumatoid Arthritis Clinical Trials. Arthritis Rheum. 1993;36:729-40
4. Felson DT, Anderson JJ, Boers M, Bombardier C, Furst D, Goldsmith C. et al. American College of Rheumatology. Preliminary definition of improvement in rheumatoid arthritis. Arthritis Rheum. 1995;38:727-35
5. Scott DL, Kingsley GH. Tumor necrosis factor inhibitors for rheumatoid arthritis. N Engl J Med. 2006;355:704-12
6. Lundqvist J, Kastäng F, Kobelt G, Jönsson B. The burden of rheumatoid arthritis and access to treatment: determinants of access. Eur J Health Econ. 2008;8(Suppl 2):S87-93
7. Ardenkjaer-Larsen JH, Fridlund B, Gram A, Hansson G, Hansson L, Lerche MH. et al. Increase in signal-to-noise ratio of > 10,000 times in liquid-state NMR. Proc Natl Acad Sci U S A. 2003;100:10158-63
8. Sriram R, Kurhanewicz J, Vigneron DB. Hyperpolarized Carbon-13 MRI and MRS Studies. eMagRes. 2014;3:311-24
9. MacKenzie JD, Yen Y-F, Mayer D, Tropp JS, Hurd RE, Spielman DM. Detection of inflammatory arthritis by using hyperpolarized 13C-pyruvate with MR imaging and spectroscopy. Radiology. 2011;259:414-20
10. Maharjan RP, Ferenci T. Global metabolite analysis: the influence of extraction methodology on metabolome profiles of Escherichia coli. Anal Biochem. 2003;313:145-54
11. Keshari KR, Sriram R, Koelsch BL, Van Criekinge M, Wilson DM, Kurhanewicz J. et al. Hyperpolarized 13C-pyruvate magnetic resonance reveals rapid lactate export in metastatic renal cell carcinomas. Cancer Res. 2013;73:529-38
12. Keshari KR, Wilson DM, Van Criekinge M, Sriram R, Koelsch BL, Wang ZJ. et al. Metabolic response of prostate cancer to nicotinamide phophoribosyltransferase inhibition in a hyperpolarized MR/PET compatible bioreactor. Prostate. 2015;75:1601-9
13. Geeraerts X, Bolli E, Fendt S-M, Van Ginderachter JA. Macrophage Metabolism As Therapeutic Target for Cancer, Atherosclerosis, and Obesity. Front. Immunol. 2017;8:289-302
14. Haschemi A, Kosma P, Gille L, Evans CR, Burant CF, Starkl P. et al. The Sedoheptulose Kinase CARKL Directs Macrophage Polarization through Control of Glucose Metabolism. Cell Metab. 2012;15:813-26
15. Hahn EL, Halestrap AP, Gamelli RL. Expression of the lactate transporter MCT1 in macrophages. Shock. 2000;13:253-60
16. Kim J-H, Kim E-L, Lee Y-K, Park C-B, Kim B-W, Wang H-J. et al. Decreased lactate dehydrogenase B expression enhances claudin 1-mediated hepatoma cell invasiveness via mitochondrial defects. Exp Cell Res. 2011;317:1108-18
17. Rodríguez-Prados J-C, Través PG, Cuenca J, Rico D, Aragonés J, Martín-Sanz P. et al. Substrate Fate in Activated Macrophages: A Comparison between Innate, Classic, and Alternative Activation. J Immunol. 2010;185:605-14
18. Rath M, Müller I, Kropf P, Closs EI, Munder M. Metabolism via Arginase or Nitric Oxide Synthase: Two Competing Arginine Pathways in Macrophages. Front. Immunol. 2014;5:723
19. Qualls JE, Subramanian C, Rafi W, Smith AM, Balouzian L, DeFreitas AA. et al. Sustained generation of nitric oxide and control of mycobacterial infection requires argininosuccinate synthase 1. Cell Host Microbe. 2012;12:313-23
20. Stadler J, Billiar TR, Curran RD, Stuehr DJ, Ochoa JB, Simmons RL. Effect of exogenous and endogenous nitric oxide on mitochondrial respiration of rat hepatocytes. Am J Physiol. 1991;260:C910-6
21. Tannahill GM, Curtis AM, Adamik J, Palsson-McDermott EM, McGettrick AF, Goel G. et al. Succinate is an inflammatory signal that induces IL-1β through HIF-1α. Nature. 2013;496:238-42
22. Strelko CL, Lu W, Dufort FJ, Seyfried TN, Chiles TC, Rabinowitz JD. et al. Itaconic Acid Is a Mammalian Metabolite Induced during Macrophage Activation. J Am Chem Soc. 2011;133:16386-9
23. Michelucci A, Cordes T, Ghelfi J, Pailot A, Reiling N, Goldmann O. et al. Immune-responsive gene 1 protein links metabolism to immunity by catalyzing itaconic acid production. Proc Natl Acad Sci U S A. 2013;110:7820-5
24. Meiser J, Krämer L, Sapcariu SC, Battello N, Ghelfi J, D'Herouel AF. et al. Pro-inflammatory Macrophages Sustain Pyruvate Oxidation through Pyruvate Dehydrogenase for the Synthesis of Itaconate and to Enable Cytokine Expression. J Biol Chem. 2016;291:3932-46
25. Talaue MT, Venketaraman V, Hazbon MH, Peteroy-Kelly M, Seth A, Colangeli R. et al. Arginine Homeostasis in J774.1 Macrophages in the Context of Mycobacterium bovis BCG Infection. J Bacteriol. 2006;188:4830-40
26. Jha AK, Huang SC-C, Sergushichev A, Lampropoulou V, Ivanova Y, Loginicheva E. et al. Network Integration of Parallel Metabolic and Transcriptional Data Reveals Metabolic Modules that Regulate Macrophage Polarization. Immunity. 2015;42:419-30
27. Gaber T, Strehl C, Buttgereit F. Metabolic regulation of inflammation. Nat Rev Rheumatol. 2017;13:267-79
28. Schnyder J, Dewald B, Baggioloni M. Effects of cyclooxygenase inhibitors and prostaglandin E2 on macrophage activation in vitro. Prostaglandins. 1981;22:411-21
29. Yoshihiko Ō. Inhibition of superoxide anion production in macrophages by anti-inflammatory drugs. Biochem Pharmacol. 1976;25:1473-80
30. Summ O, Evers S. Mechanism of Action of Indomethacin in Indomethacin-Responsive Headaches. Curr Pain Headache Rep. 2013;17:327
31. Guglielmetti C, Najac C, Didonna A, Van der Linden A, Ronen SM, Chaumeil MM. Hyperpolarized 13C MR metabolic imaging can detect neuroinflammation in vivo in a multiple sclerosis murine model. Proc Natl Acad Sci U S A. 2017;114:E6982-91
32. Lewis AJ, Miller JJ, Lau AZ, Curtis MK, Rider OJ, Choudhury RP. et al. Non-Invasive Immuno-Metabolic Cardiac Inflammation Imaging Using Hyperpolarized Magnetic Resonance. Circ Res. 2018;122:1084-93
Author contact
![]() Corresponding author: John D. MacKenzie, Department of Radiology and Biomedical Imaging, University of California, San Francisco, UCSF Department of Radiology, 1855 4th Street, San Francisco, California 94158, Phone: (415) 502-9877; John.MacKenzieedu
Corresponding author: John D. MacKenzie, Department of Radiology and Biomedical Imaging, University of California, San Francisco, UCSF Department of Radiology, 1855 4th Street, San Francisco, California 94158, Phone: (415) 502-9877; John.MacKenzieedu