Impact Factor
- Issue 14; 2026
- Issue 13; 2026
- Issue 12; 2026
- Issue 11; 2026
- Issue 10; 2026
- Volume 16; 2026
- Advance Articles
- Past Issues
- Cover Images
- Cover Suggestion
- Index & Coverage
- Special Issues
Introduction
Methods
Results
Discussion
Abbreviations
Acknowledgements
Supplementary Material
References
International Journal of Biological Sciences
International Journal of Medical Sciences
 Global reach, higher impact

Theranostics 2018; 8(12):3366-3379. doi:10.7150/thno.23978 This issue Cite
Research Paper
Functional role of BTB and CNC Homology 1 gene in pancreatic cancer and its association with survival in patients treated with gemcitabine
Xudong Huang1*, Jian Zheng2*, Jun Li1*, Xu Che3*, Wenle Tan1, Wen Tan1, Mingming Shao1, Xinxin Cheng1, Zhongli Du1, Yanjie Zhao1, Chengfeng Wang3 ![]() , Chen Wu1
, Chen Wu1 ![]() , Dongxin Lin1
, Dongxin Lin1 ![]()
1. Department of Etiology and Carcinogenesis, National Cancer Center/Cancer Hospital, Chinese Academy of Medical Sciences and Peking Union Medical College, Beijing 100021, China
2. Sun Yat-sen University Cancer Center, State Key Laboratory of Oncology in South China and Collaborative Innovation Center for Cancer Medicine, Guangzhou 510060, China
3. Department of Abdominal Surgery, National Cancer Center/Cancer Hospital, Chinese Academy of Medical Sciences and Peking Union Medical College, Beijing 100021, China
*These authors contributed equally to this work.
Received 2017-11-22; Accepted 2018-3-27; Published 2018-5-23
Abstract

Genetic variation (rs372883C/T) in the 3'-untranslated region of BTB and CNC homology 1 (BACH1) has been associated with pancreatic ductal adenocarcinoma (PDAC) risk in our previous genome-wide association study; however, the action roles of this genetic variation in PDAC remains unknown.
Methods: BACH1 expression was measured by quantitative real-time PCR, Western blot and immunohistochemistry. The effects of BACH1 on cell proliferation and sensitivity to gemcitabine were examined by alteration of BACH1 expression in PDAC cells. Angiogenesis was determined in vitro using a human umbilical vein endothelial cell model. Reporter gene assays were conducted to compare the effects of microRNA-1257 on rs372883 variation. The associations between rs372883 variants and survival time in patients treated with gemcitabine were estimated by logistic regression.
Results: We found substantially lower BACH1 expression in PDAC compared with normal pancreatic tissues and the rs372883T allele had significantly lower BACH1 levels than the rs372883C allele in both tumor and normal tissues. Knockdown of BACH1 expression provoked proliferation of PDAC cells and angiogenesis, which might result from upregulation of hemeoxygenase-1 that evokes oncogenic AKT and ERK signaling. The rs372883T>C change inhibits interaction of BACH1 with microRNA-1257, resulting in increased BACH1 expression. PDAC patients with the rs372883T allele were more resistant to gemcitabine and had shorter survival time compared with those with the rs372883C allele.
Conclusion: These results shed light on the mechanism underlying the associations of BACH1 rs372883 variation with risk of developing PDAC and differential gemcitabine sensitivity in patients.
Keywords: pancreatic cancer, BACH1, HO-1, genetic variation, survival
Introduction
The survival rate for pancreatic ductal adenocarcinoma (PDAC) is among the worst for any cancer due to the lack of effective means for screening and early diagnosis [1, 2]. Gemcitabine is the first line chemotherapy given to patients with advanced or unresectable PDAC [3, 4] but response varies greatly. Accumulating evidence indicates that genetic factors may play important roles in tumorigenesis and response to chemotherapy [5-7]. In recent years, efforts have been made to identify susceptibility loci associated with sporadic PDAC through genome-wide association studies (GWAS) [8-13], which have provided further understanding of the pathogenesis of the disease. However, clinical utilization of the GWAS findings as specific biomarkers for early detection and diagnosis remains limited, and one of the major obstructions is lack of a functional mechanism [14]. Thus, functional characterization of GWAS-identified genetic variants has a fundamental merit.
The strongest association signal in our previous GWAS of PDAC was rs372883T>C variation located in the 3'-untranslated region (3'UTR) of the BTB and CNC homology 1 gene (BACH1) on 21q21.3. The C allele was associated with significantly decreased PDAC risk compared with the T allele [11]. Nevertheless, the role of BACH1 variant in the development of PDAC remains unclear. BACH1, ubiquitously expressed in various tissues [15-17], is a transcriptional repressor of HMOX1 encoding heme oxygenease-1 (HO-1), a rate-limiting enzyme in heme catabolism. At low heme level, BACH1 binds directly to the HMOX1 enhancer and represses HO-1 expression; however, at high heme concentration, the bound BACH1 is relieved, resulting in the upregulation of HO-1 [18]. HO-1 may also play important roles in other cellular processes such as oxidative stress, metabolic inflammation, cell cycle, apoptosis and angiogenesis [19-23]. Thus, disruption of feedback regulation in the BACH1/HO-1 pathway may be implicated not only in cancer development but also in the sensitivity of cancer cells to chemotherapeutic agents.
Since rs372883C>T variation located in the BACH1 3'UTR might disrupt the binding of certain regulatory microRNAs and thus affect BACH1 expression, in this study, we performed functional analysis of rs372883 variants and examined the effects of altered BACH1/HO-1 signaling pathway on the phenotypes of PDAC cells. In addition, we investigated whether BACH1 rs372883 variation is associated with response to gemcitabine chemotherapy and survival time in PDAC patients.
Methods
Study subjects
Subjects with PDAC (N=102) were recruited between November 2002 and December 2014 (Table S1). Among them, 82 were treated with gemcitabine alone while the other 20 were treated with gemcitabine after surgical resection at a dose of 1,000 mg/m2 delivered on days 1, 8 and 15 every 28 days. Responsiveness was evaluated with RECIST criteria [24] after accomplishing at least two courses of treatment. We defined patients achieving complete response (CR) or partial response (PR) as responders, and patients with stable disease (SD) or progressive disease (PD) as nonresponders. Survival time was measured from the date of diagnosis to the date of last follow-up or death. The last date of follow-up was 30th May 2015 and the median follow-up time was 33 months. Patients alive on the last follow-up date were considered censored. Twelve patients were lost to follow-up during this period and therefore only 90 patients were included in the survival analysis. Informed consent was obtained from all participants, and this study was approved by the Institutional Review Board of the Chinese Academy of Medical Sciences Cancer Hospital. All experiments on the participants in this study were performed in accordance with the relevant guidelines and regulations.
Analysis of BACH1 genotypes
A blood DNA sample was obtained from each subject at the time of diagnosis and the BACH1 rs372883 genotypes were determined using a TaqMan genotyping platform (ABI 7900HT system) with the primers and probes shown in Table S2.
In silico analysis of interaction between BACH1 3'UTR and microRNAs
We used publicly available software FINDTAR3 (http://bio.sz.tsinghua.edu.cn/), RegRNA (http://regrna.mbc.nctu.edu.tw/php/prediction.php) and SnipMir (http://www.microarray.fr:8080/merge/index?action=MISNP) to analyze the potential interactions between different BACH1 3'UTR sequences and microRNAs.
Cell lines and cell culture
Human PDAC cell lines CFPAC-1, BXPC-3 and Capan-2, human umbilical vein endothelial cell line HUVEC and human embryonic kidney cell line 293T were purchased from the China Infrastructure of Cell Line Resources (Beijing). Cells passaged for less than 6 months were authenticated by DNA fingerprinting analysis using short-tandem repeat (STR) markers.
Reporter gene construction and luciferase reporter assays
The full length of BACH1 3'UTR amplified from a rs372883TT homozygous DNA sample was subcloned into the psiCHECK-2 vector (Promega) and designated as p-Trs372883, which was site-specifically mutated to create its variant counterparts p-Crs372883. The constructs were transfected respectively into CFPAC-1 and BXPC-3 cells with or without miR-1257. Renilla luciferase activity was detected with a Dual-Luciferase Reporter Assay System (Promega) and normalized using the firefly luciferase activity.
RNA preparation and quantitative real-time PCR (qRT-PCR) analysis
Total RNA was extracted from PDAC cell lines and surgically removed pancreatic specimens from 75 individuals. First-strand cDNA was synthesized by using the Superscript II-reverse transcriptase kit (Invitrogen). qRT-PCR was accomplished using the SYBR Green method on an ABI Prism 7900HT system.
Northern blot of microRNA
Total RNA extracted from CFPAC-1 and BXPC-3 cells was separated on denaturing polyacrylamide gels and transferred to Immobilon-Ny+ Membrane (Millipore, INYC00010). After pre-hybridization in DIG Easy Hyb buffer (Roche, 12039672910), the membrane was hybridized with the denatured 3'-digoxigenin-labeled complementary sequence of miR-1257 probe (Table S2) and detected using an Odyssey infrared scanner (Li-Cor, Lincoln).
Plasmids, lentiviral production and transduction
BACH1 cDNA made from CFPAC-1 cells was PCR-amplified and subcloned into pLvx-IRES-Neo vector (Clontech). Two short hairpin RNAs (shRNAs) were synthesized (GenePharma) for BACH1 suppression (Table S2). They were respectively inserted into the pSIH1-H1-Puro lentiviral shRNA vector (System Biosciences) to produce lentivirus in 293T cells. CFPAC-1 and BXPC-3 cells were infected with concentrated virus. The supernatant was replaced with complete culture media after 24 h, followed by selection with G418 or puromycin, respectively.
Gene expression profiling, gene ontology and gene set enrichment analysis
Total RNA extracted from CFPAC-1 cells with or without BACH1 knockdown were subject to analysis by the Agilent human lncRNA+mRNA array V.4.0 platform (Agilent Technologies). The raw and processed microarray data have been submitted to the Gene Expression Omnibus (accession number GSE111506). For Gene Ontology (GO) analysis, differentially expressed protein-coding genes were uploaded to online software DAVID (http://david.abcc.ncifcrf.gov/) and P<0.05 was considered significant for the biological process enrichment. For Gene Set Enrichment Analysis (GSEA), gene profiling data were uploaded to GSEA 3.0. Hallmark gene sets were obtained from MSigDBv6.1 (http://software.broadinstitute.org/gsea/msigdb/index.jsp). False discovery rate (FDR) <0.25 was considered significant for enriched biological pathways.
Transient overexpression and RNA interference of HMOX1
Full length of HMOX1 cDNA was PCR-amplified from total RNA isolated from CFPAC-1 cells and the fragment was subcloned into the pcDNA3.1 vector (Invitrogen). Small interfering RNA (siRNA) targeting HMOX1 and its scramble control (Table S2) were obtained from GenePharma. Transfections were done with lipofectamine 2000.
Western blot assays
Total protein (60 μg) extracted from cells or tissue samples was resolved by SDS-PAGE and transferred to PVDF membrane (Millipore). Antibody against BACH1 (A303-057A) was from Bethyl Laboratories while antibodies against other proteins were from Abcam (HO-1, ab52947; ERK1/2, ab36991; phosphorylated ERK1/2, ab76299; NRF2, ab62352; OCT4, ab181557; ABCG2, ab207732; ALDH1, ab52492 and TRA-1-60, ab16288), Santa-Cruz (HIF1A, sc-10790; VEGF, sc-152 and β-ACTIN, sc-47778) and Cell Signaling Technology (AKT, #9272; phospho-AKTThr308, #9275; phospho-AKTSer473, #9271; PTEN, #9559; eNOS, #9586; phospho-eNOSSer1177, #9570; E-CADHERIN, #3195; VIMENTIN, #5741; ZO-1, #8193; ZEB1, #3396 and SLUG, #9585). The membranes were incubated with the primary antibody and visualized with a Phototope-horseradish peroxidase Western Blot Detection kit (Cell Signaling Technology).
Chromatin immunoprecipitation combined quantitative PCR (ChIP-qPCR)
CFPAC-1 and BXPC-3 cells were treated with formaldehyde for cross linking, followed by ChIP with antibody against BACH1 (Santa-Cruz, sc-14700X), NRF2 (Abcam, ab62352) or mouse IgG. The level of HMOX1 was determined by qPCR using SYBR Green and the primers for HMOX1 and its enhancer regions 1 and 2 [25, 26].
Cell viability and colony formation assays
Cell viability was measured using CCK-8 kit (Dojindo). Colony formation ability was determined by counting number of cells in 12-well cell-culture cluster with complete growth media after fixing with methanol and stained with crystal violet.
Enzyme-linked Immunosorbent assay (ELISA) of VEGF protein
CFPAC-1 and BXPC-3 cells with overexpression or knockdown of BACH1 were cultured in a complete medium for 48h. The culture medium was collected for ELISA of VEGF using the VEGF ELISA kit (R&D System).
In vitro angiogenesis assays
HUVECs were seeded at a density of 2×10⁴ cells per well on growth factor-reduced Matrigel (Corning 356231) and grown in a conditioned medium collected from CFPAC-1 or BXPC-3 cells with overexpression or knockdown of BACH1. The morphologic change of HUVECs was photographed and tube formation was counted after cultivation for 6h.
Drug sensitivity assays
Cells in growth medium were exposed to various concentrations of gemcitabine (Selleck, S1714) and enumerated using CCK-8 kit at 48 h of exposure. Gemcitabine sensitivity was expressed as drug concentration that inhibits cell proliferation by 50% (IC50).
Xenograft tumor formation assays
Five-week old female BALB/c nude mice (6 animals in each group) were subcutaneously injected with 0.1 mL of cell suspension containing 1×10⁶ cells into the back flank. Animals were raised in the following six weeks and tumor volume was measured every other day and calculated by length×width2 ×0.5. Sample size was not predetermined for these experiments. All experimenters were blinded to which cells were injected in the mice. All animal handling and experimental procedures were performed in accordance with the relevant institutional and national guidelines.
Immunohistochemical (IHC) analysis
Tissue microarrays of PDAC and paired normal tissues (N=67) were incubated with the mouse anti-BACH1 antibody (1:100; Abcam, ab128486) and detected with the ABC kit (Pierce). The BACH1 labeling index was ranked according to the percentage of positive cell nuclei and staining scores were calculated using an immunoreactive scoring (IRS). BACH1 labeling score of intensity was estimated as negative (0), weak (1), moderate (2) and strong (3). The extent of staining, defined as the percentage of positive staining cells, was scored as 1 (≤10%), 2 (11%-50%), 3 (51%-75%) and 4 (>75%). The total IRS was obtained by multiplying the score of intensity and that of extent, ranking from negative to >6 (+++). Owing to limited sample size, IRS was categorized into weak expression group (IRS<4) and strong expression group (IRS≥4).
Statistical analysis
The statistical significance of comparison between two groups was determined using Student's t-test. Wilcoxon matched-pairs test was used to assess IHC IRS score within cancer and matched normal tissues. Odds ratios (ORs) and their 95% confidence intervals (CIs) were calculated using logistic regression model adjusting for sex, age, tumor stage and surgery. Hazard rations (HRs) and their 95% CIs were calculated using Cox proportional hazard models and adjusted for covariates that might influence the length of survival, including sex, age, tumor stage and surgery. Kaplan-Meier survival estimates were plotted, and the significances were assessed using log-rank tests. All statistical analyses were performed using SPSS (version 20.0, SPSS Inc.). P<0.05 was considered statistically significant.
Results
BACH1 is downregulated in PDAC
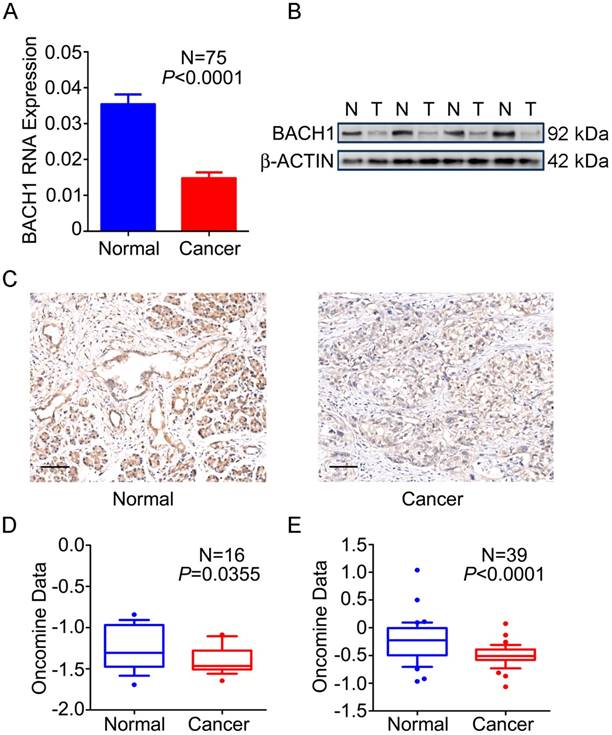
We first examined the expression status of BACH1 in PDAC and normal tissues and found that 76.0% (57/75) of tumors expressed significantly lower BACH1 mRNA than their adjacent normal tissues (P<0.0001; Figure 1A). Western blot analysis of randomly selected 35 pairs of samples showed that 23 (65.7%) had lower BACH1 protein levels in tumors than in normal tissues (Figure 1B). IHC staining of BACH1 on tissue microarrays revealed strong signals in both cytoplasm and nuclei of normal pancreatic duct cells and acinar cells; however, BACH1 staining was apparently reduced in tumors (Figure 1C). Two published data sets [27, 28] also showed significantly lower BACH1 mRNA in PDAC than in normal tissues (Figures 1D-E), consistent with our results.
Expression of BACH1 in PDAC. (A) BACH1mRNA levels determined by qRT-PCR were significantly lower in PDAC compared with paired adjacent normal tissues (N=75). Results represent mean ± SEM normalized to GAPDH and P-values are for Student's t-test. (B) BACH1 protein levels determined by Western blot were significantly lower in PDAC (T) than in paired normal tissues (N). Shown is a representative picture selected from 35 pairs of clinical specimens. (C) Representative IHC images (200×) showing BACH1 protein expression in normal pancreatic tissues (left) and PDAC (right). Bar scale, 100 μm. (D-E) Expression of BACH1 in published data sets of Pei et al.[27] and Badea et al. [28] (Oncomine, https://www.oncomine.org/resource/main.html). The line in the middle of the box represents the median; bars represent 10th and 90th percentiles and greater values were plotted as individual points. P-values are for unpaired Wilcox rank-sum test.
BACH1 inhibits in vitro PDAC cell proliferation and angiogenesis
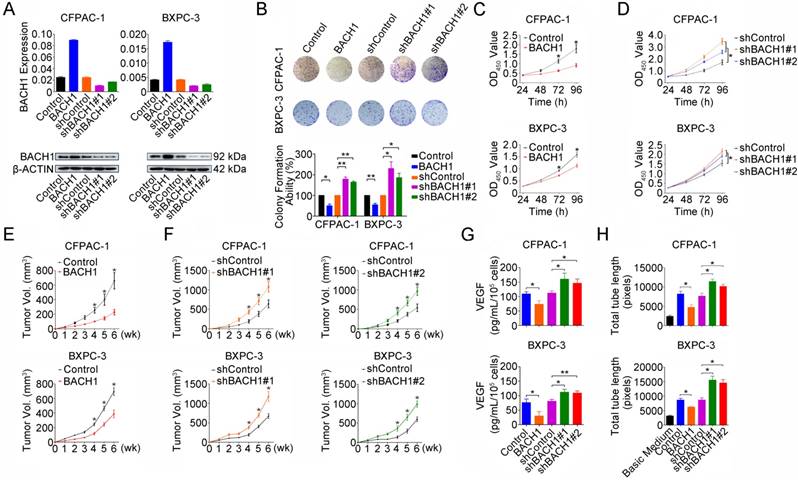
To explore the whole landscape of gene expression programs regulated by BACH1 in PDAC, we performed gene expression profile analysis in CFPAC-1 cells with or without BACH1 knockdown. Gene ontology analysis showed that differentially expressed genes were enriched in many pathways including transcription, redox process, RAS signal transduction, cell proliferation, stem cell maintenance, cell migration, vascular endothelial growth factor receptor signaling pathway, apoptotic process and positive regulation of epithelial to mesenchymal transition (Figure S1A). Gene set enrichment analysis revealed that genes upregulated in CFPAC-1 cells with BACH1 knockdown were enriched in ROS pathway, glycolysis, angiogenesis, complement, xenobiotic metabolism, MTORC1 signaling, hypoxia, MYC targets, P53 pathway and epithelial-mesenchymal transition (Figure S1B and Table S3). Based on these findings, we next examined the impact of BACH1 on PDAC cell proliferation by altering BACH1 expression in CFPAC-1 and BXPC-3 cells (Figure 2A). Overexpression of BACH1 substantially inhibited colony formation (Figure 2B) and cell proliferation (Figure 2C) while knockdown of BACH1expression accelerated colony formation and proliferation abilities of cells (Figures 2B and 2D). The inhibitory effect of BACH1 on PDAC cell proliferation was also replicated in vivo by xenograft growth in mice (Figures 2E-F). To explore the effect of BACH1 on angiogenesis, we first examined the VEGF levels secreted by CFPAC-1 and BXPC-3 cells in the culture medium and the results showed that overexpression of BACH1 significantly suppressed VEGF levels in the supernatant but knockdown of BACH1expression significantly elevated the levels (Figure 2G). In vitro angiogenesis assays using HUVEC model showed that tube formation was greatly enhanced by culture with the supernatants from PDAC cells having BACH1 knockdown compared with that by culture with the supernatants from cells having BACH1 overexpression (Figure 2H).
BACH1 inhibits PDAC cells proliferation and angiogenesis. (A) Stable overexpression or knockdown of BACH1 in CFPAC-1 and BXPC-3 cells. (B) Effect of BACH1 overexpression or knockdown on colony formation of CFPAC-1 and BXPC-3 cells. Results represent colony formation ability relative to Control or shControl set to 100% from three experiments. P-values are for Student's t-test. *, P<0.05; **, P<0.01 compared with Control or shControl. (C) Overexpression of BACH1 substantially reduced proliferation of both CFPAC-1 and BXPC-3 cells determined by CCK-8 assay. Results are mean ± SEM from three experiments and each experiment had six replicates. *, P<0.05 compared with control. (D) Knockdown of BACH1 significantly enhanced proliferation of both CFPAC-1 and BXPC-3 cells. Results are mean ± SEM from three experiments and each experiment had six replicates. *, P<0.05 compared with shControl. (E-F) Xenograft tumor formation and growth of CFPAC-1 and BXPC-3 cells with BACH1 overexpression or knockdown in nude mice. Results are mean ± SEM from 6 animals in each group. *, P<0.05 compared with Control or shControl. (G) Effect of BACH1 expression on VEGF levels quantified by ELISA in the culture medium of CFPAC-1 or BXPC-3 cells. Results are mean ± SEM from three measurements. *, P<0.05; **, P<0.01 compared with Control or shControl. (H) Effects of culture medium of CFPAC-1 or BXPC-3 cells with BACH1 overexpression or knockdown on HUVEC tube formation. Results are mean ± SEM from three measurements. *, P<0.05 compared with Control or shControl.
BACH1 negatively regulates HO-1 expression
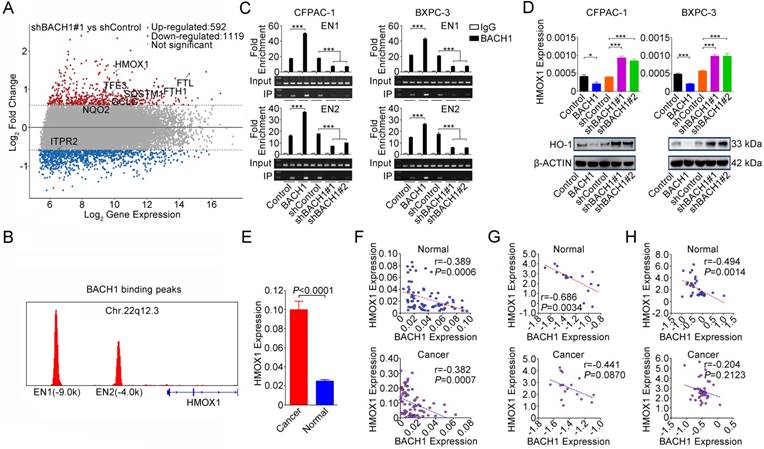
To shed light on the underlying molecular mechanism that BACH1 may act, we combined published BACH1 ChIP-sequencing data (GEO accession: GSM693953 and GSM693952) [29] and differentially expressed genes (fold change>1.5 or <-1.5) identified by our microarray analysis. We found 8 genes that were directly regulated by BACH1 and, among them, HMOX1 was the mostly upregulated one (Figure 3A and Figure S2). We confirmed that BACH1 can bind to the HMOX1 enhancers [29] (Figures 3B-C) and overexpression of BACH1 substantially suppressed HO-1 expression while knockdown of BACH1 substantially increased HO-1 expression in PDAC cell lines (Figure 3D). Furthermore, we found that HMOX1 levels were significantly higher in PDAC than in normal pancreatic tissues (P<0.0001; Figure 3E) and were negatively correlated with BACH1 levels (Figures 3F-H). NRF2 is thought to be a transactivator in NRF2/BACH1 transcriptional network. However, we found that the change of BACH1 expression had no effect on NRF2 expression at both mRNA and protein levels (Figure S3A). ChIP-qPCR assays showed that NRF2 can also bind to the HMOX1 enhancers. However, when BACH1 was overexpressed in cells, less NRF2 was enriched in EN1 and EN2; in contrast, when BACH1 expression was knocked down, more NRF2 was enriched in EN1 and EN2 (Figure S3B).
BACH1 negatively regulates HO-1 expression in PDAC cells. (A) MA plot of the gene expression profile. Eight genes directly regulated by BACH1 were marked: red, upregulated; blue, downregulated; gray, not significantly changed. The dotted lines indicate the cut-off value of log2 fold change (± 0.58). (B) BACH1 binding peaks in the HMOX1 gene locus based on ChIP-sequencing data (GSM693953 and GSM693952). (C) Chromatin immunoprecipitation assays showing binding of BACH1 to two enhancers EN1 (-9.0kb) and EN2 (-4.0kb) in the upstream of HMOX1 in CFPAC-1 and BXPC-3 cells. Overexpression of BACH1 in these cells substantially enhanced enrichment of BACH1 in EN1 and EN2, while knockdown of BACH1 substantially decreased the enrichment in these two enhancers. Fold enrichment (mean ± SEM) represents DNA levels associated with BACH1 or IgG relative to an input control from three independent experiments. IgG served as negative control. ***, P<0.001 compared with Control or shControl. (D) Overexpression of BACH1 suppressed HO-1 expression while knockdown of BACH1 elevated HO-1 expression in both mRNA and protein levels in CFPAC-1 and BXPC-3 cells. *, P<0.05; ***, P<0.001 compared with Control or shControl. (E) HMOX1 mRNA expression was significantly higher in PDAC compared with their adjacent normal tissues (N=75). Results are mean ± SEM normalized to GAPDH and the P-values are for Student's t-test. (F) Correlation between BACH1 and HMOX1 mRNA levels in PDAC and paired normal tissues (N=75). The RNA levels were determined by qRT-PCR and expressed relative to GAPDH. The r- and P-values are for Pearson's correlation analysis. (G-H) Correlation between BACH1 and HMOX1 mRNA levels in PDAC and paired normal tissues. Data are from Oncomine database generated by Pei et al. [27] and Badea et al. [28].
BACH1 controls cell proliferation and angiogenesis via regulating HO-1 expression
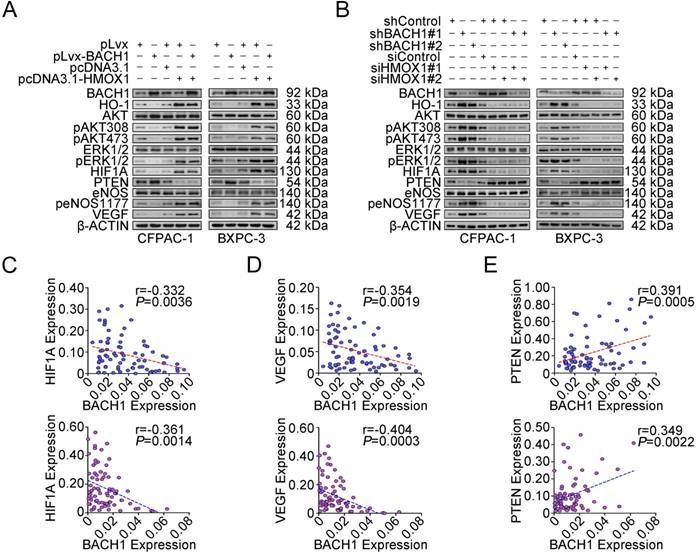
We further examined the impact of HO-1 on PDAC cell proliferation under the BACH1 overexpression or knockdown condition. When BACH1 was overexpressed in CFPAC-1 and BXPC-3 cells, HO-1 was substantially reduced; however, forced restoration of HO-1 expression in cells efficiently overcame the repression of cell proliferation and colony formation caused by overexpression of BACH1 (Figures S4A-B). In contrast, silencing HO-1 expression successfully suppressed proliferation and colony formation caused by knockdown of BACH1 expression in the same cells (Figures S4C-D). These results suggest that the effect of BACH1 on cell proliferation is largely mediated by HO-1. We then examined the changes of molecules downstream HO-1 focusing on aberrant activation and regulation of AKT, ERK, eNOS, HIF1A, PTEN and VEGF, which has been well-known to be involved in cancer cell proliferation and angiogenesis [30-33]. We found that when BACH1 was overexpressed in CFPAC-1 and BXPC-3 cells, HO-1 and phosphorylated AKT, eNOS and ERK1/2 were substantially reduced, although the total amount of AKT, eNOS and ERK1/2 were not significantly changed (Figure 4A). In addition, we also observed substantially decreased expression of HIF1A and VEGF and increased expression of PTEN in cells overexpressing BACH1 (Figure 4A and Figure S5). These changes caused by alterations of BACH1 expression could be rescued when HO-1 expression was restored (Figures 4A-B). In line with these results in vitro in cells, we detected a reverse correlation between BACH1 and HIF1A (Figure 4C) or VEGF (Figure 4D) mRNA expression and a positive correlation between BACH1 and PTEN mRNA expression (Figure 4E) in both clinical PDAC and normal pancreatic tissues.
BACH1 regulates signaling pathway downstream of HO-1. (A-B) Western blot analysis of AKT and ERK signaling modules downstream of HO-1 in CFPAC-1 and BXPC-3 cells with overexpression or knockdown of BACH1. (C-E) A reverse correlation between mRNA levels (N=75) of BACH1 and mRNA levels of HIF1A (C) or VEGF (D) and a positive correlation between mRNA levels of BACH1 and mRNA levels of PTEN (E) in normal tissues (upper panel) and paired PDAC (lower panel). The RNA levels were determined by qRT-PCR relative to GAPDH. The r- and P-values are for Pearson's correlation analysis.
BACH1 3'UTR-rs372883T variant is a target of miR-1257
To elucidate the effect of the rs372883T>C change on BACH1 expression, we carried out reporter gene assays in CFPAC-1 and BXPC-3 cells. The results showed that the plasmid constructs containing the BACH1 3'UTR-rs372883T had significantly decreased luciferase expression compared with the BACH1 3'UTR-rs372883C counterparts (Figure 5A), suggesting that the rs372883T>C change may be a functional variation. In silico analysis showed that rs372883 lies within a binding site for the seed region of miR-1257 (MI0006391), the microRNA first described by Morin et al [34] and confirmed by Northern blot analysis in the present study (Figure S6). rs372883T>C change causes a base pair mismatch between miR-1257 and the BACH1 3'UTR (Figure 5B). The expression of reporter vectors p-Trs372883 and p-Crs372883 were then compared in PDAC cells in the presence of exogenous miR-1257 and the results showed that although miR-1257 had no effect on the expression of vector containing the BACH1 3'UTR-rs372883C (p-Crs372883), it significantly suppressed the expression of vector containing the BACH1 3'UTR-rs372883T (p-Trs372883). The suppressive effect of miR-1257 was in a dose-dependent manner and could be restored by co-transfection of the miR-1257 inhibitor (Figure 5C).
Functional relevance of rs372883 variants. (A) Relative reporter gene activity bearing BACH1 3'UTR fragment with the rs372883T or rs372883C allele in CFPAC-1 and BXPC-3 cells. Results are mean ± SEM from three experiments and each had six replicates. The P-values are for Student's t-test. (B) In silico prediction of interaction between miR-1257 and BACH1 3'UTR showing differences in binding within the seed region. (C) Relative reporter gene activity of the psiCHECK2-rs372883T and psiCHECK2-rs372883C constructs cotransfected with 1.0, 5.0 and 10.0 pmol of miR-1257 or its inhibitor in CFPAC-1 and BXPC-3 cells. Results are mean ± SEM from three experiments and each had six replicates; P-values were for Student's t-test. (D-F) Levels of BACH1 mRNA, miR-1257 and HMOX1 mRNA in normal pancreatic tissues adjacent to tumors of subjects with the rs372883 CC (N=11), CT (N=38) or TT (N=26) genotype. Results are mean ± SEM relative to GAPDH or U6. (G) Western blot analysis of AKT and ERK signaling modules downstream of HO-1 in surgically removed PDAC specimens from subjects with the rs372883CC, CT or TT genotype.
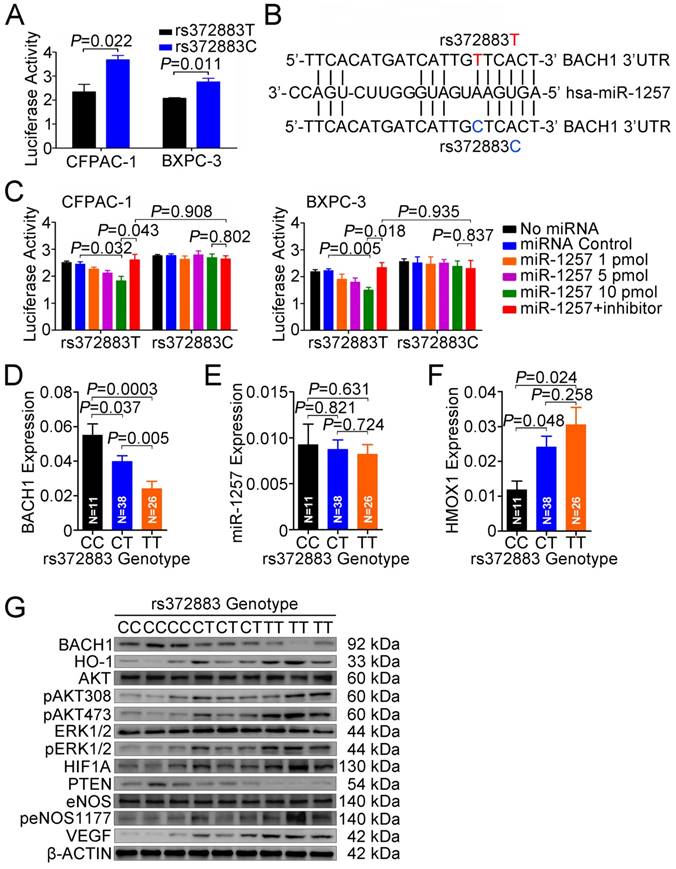
We then evaluated the association between rs372883 genotypes and BACH1 mRNA levels in clinical normal pancreatic tissues (N=75) and found that the BACH1 mRNA levels were significantly lower in the rs372883 TT or CT genotype than that in the CC genotype (Figure 5D). However, these genotype-associated differences were not related to the miR-1257 levels because no significant differences in miR-1257 expression were observed among individuals (Figure 5E). As expected, HMOX1 mRNA levels were significantly higher in the BACH1 rs372883TT or CT genotype compared with that in the CC genotype (Figure 5F). These results suggest that rs372883T>C change may diminish the interaction between BACH1 3'UTR and miR-1257, enhancing BACH1 expression which further negatively regulates HO-1 expression in a BACH1 variant-dependent manner. Western blot analysis showed that PDAC specimens with the rs372883TT genotype had substantially lower BACH1 protein levels but substantially elevated levels of activated signaling molecules that are critical in cell proliferation and angiogenesis such as phosphorylated-AKT, -ERK, -eNOS, HIF1A and VEGF compared with those with the rs372883CC genotype except for PTEN, which was substantially lower in the TT or CT genotype compared with the CC genotype (Figure 5G).
Sensitivity to gemcitabine in PDAC cells depends on BACH1 in an allele-specific manner
Since response to gemcitabine varies greatly among patients, we performed drug sensitivity assays in PDAC cells by altering BACH1 expression. We found that compared with vector controls, overexpression of BACH1 significantly increased the sensitivity of both CFPAC-1 and BXPC-3 cells to gemcitabine but knockdown of BACH1 substantially decreased the sensitivity (Figure 6A). Because BACH1 is a suppressor for HO-1 expression, we thus investigated whether BACH1-dependent gemcitabine sensitivity is mediated by HO-1. We found that restoration of HO-1 expression in both CFPAC-1 and BXPC-3 cells overexpressing BACH1 partially suppressed the sensitivity (Figure 6B), but silencing HO-1 expression in cells with knockdown of BACH1 partially increased the sensitivity (Figure 6C).
Gemcitabine sensitivity in PDAC cells depends on BACH1 in an allele-specific manner. (A) Effects of BACH1 on gemcitabine sensitivity in CFPAC-1 and BXPC-3 cells. Results represent mean ± SEM from three independent experiments and each had four replications. *, P<0.05 and **, P<0.01. (B-C) Effect of HO-1 expression on gemcitabine sensitivity in CFPAC-1 and BXPC-3 cells with overexpression (B) or knockdown (C) of BACH1. Results are mean ± SEM from three independent experiments and each had four replications. *, P<0.05; **, P<0.01 and ***, P<0.001. (D-F) Effect of miR-1257 on gemcitabine sensitivity in BXPC-3 (D), CFPAC-1 (E) and Capan-2 (F) cells carrying the rs372883 CC, CT or TT genotype, respectively. Cells transiently transfected with miR-1257 or its inhibitor were exposed to gemcitabine at final concentrations ranging from 10-3 to 103 nM. Cells were enumerated with the CCK-8 assay at 48h after drug exposure. IC50 represents gemcitabine concentration that inhibits cell proliferation by 50%. Results are mean ± SEM from three experiments and each had four replicates. *, P<0.05 and ***, P<0.001.
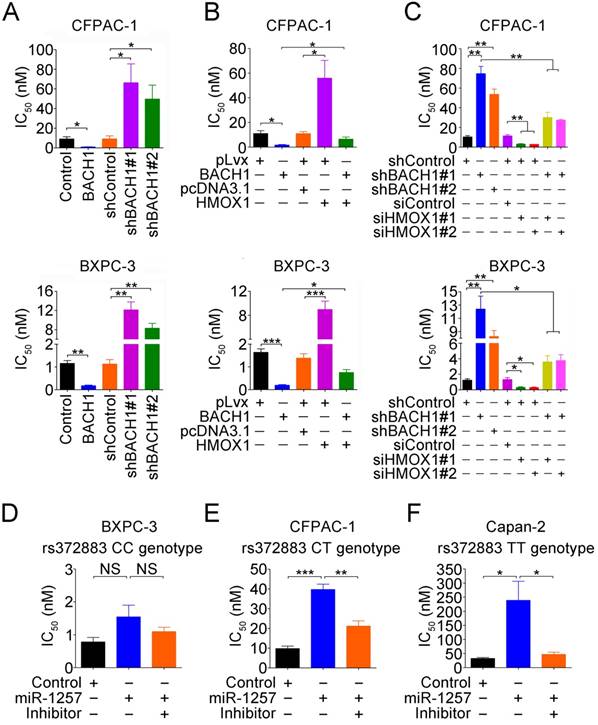
We then looked at the effects of different rs372883 genotypes on gemcitabine sensitivity and found that in the absence of miR-1257, BXPC-3 cells carrying the rs372883CC genotype had an IC50 that is significantly lower than CFPAC-1 cells carrying the rs372883CT genotype and Capan-2 cells carrying the rs372883TT genotype (Figures 6D-F). The presence of miR-1257 in the assay system significantly increased IC50 for Capan-2 (P=0.0390) and CFPAC-1 (P=0.0006) but not for BXPC-3 (P>0.05) cells, with the fold-change being 7.32, 4.06 and 1.92, respectively (Figures 6D-F and Figure S7), indicating a BACH1 allele-dependent effect of miR-1257. Furthermore, the effect of miR-1257 on gemcitabine resistance in PDAC cells could be restored by co-transfection with the miR-1257 inhibitor (Figures 6D-F).
To further elucidate the mechanism for the gemcitabine sensitivity dependent on BACH1 allele, we examined expressions of some drug-resistant genes including ABCC2, MGST1 and NQO1 in PDAC cells and found that in the presence of miR-1257, the expression of ABCC2 (P=0.0005 and P=0.0019), MGST1 (P=0.0002 and P<0.0001) and NQO1 (P=0.0002 and P=0.0048) significantly increased in Capan-2 and CFPAC-1 cells but not in BXPC-3 cells (all P>0.05; Figures S8A-C). Furthermore, the effect of miR-1257 on the expression of these drug-resistant genes in PDAC cells could be restored by co-transfection with the miR-1257 inhibitor (Figure S8A-C).
BACH1 regulates expression of genes involved in EMT and stemness
GO and GSEA results suggested that BACH1 may be involved in regulating EMT and cell pluripotency processes (Figures S1A-B and Table S3). We then examined the alteration of EMT associated markers in cells with BACH1 overexpression or downregulation and found that when BACH1 was overexpressed in CFPAC-1 and BXPC-3 cells, the levels of E-cadherin and ZO-1 were substantially increased but mesenchymal markers ZEB1, Vimentin and Slug were substantially reduced. The reverse results were observed in the same cells with BACH1 knockdown (Figure S9A). In addition, we found that stemness markers ABCG2 and ALDH1 were substantially reduced when BACH1 was overexpressed, but substantially increased when BACH1 was knocked down (Figure S9B). However, we did not observe any changes of OCT4; TRA-1-60 was not detectable in both cell lines (Figure S9B). By analyzing previously published results, we observed that the expression levels of BACH1 were negatively correlated with ABCG2 and CXCR4 levels (Figure S9C-D).
BACH1 genotypes may predict gemcitabine response and prognosis in PDAC patients
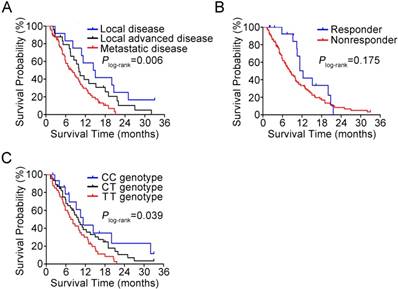
In 102 patients treated with gemcitabine, we observed a response rate of 15.7% and this was not related to the select clinical characteristics such as sex, age, tumor stage and surgery. The BACH1 rs372883 genotypes appeared to have an ability to identify responsiveness: among responders, 37.5% of individuals carried the CC genotype, while among nonresponders, only 11.6% of individuals carried the CC genotype (P=0.024). The adjusted odds ratio of the CC genotype for being nonresponders was 0.15 (95% CI, 0.03-0.68) compared with the TT genotype (Table 1). However, there was no significant difference for the heterozygous CT genotype in responders and nonresponders (37.5% versus 46.5%, P=0.745). In this set of patients, 85 (83.3%) had died before the last follow-up time and the median survival time (MST) was 9.3 months. We observed significantly different survival times by tumor stage, with the MST being 14.4, 10.0 and 7.8 months for patients with local, locally advanced and metastatic tumor, respectively (Plog-rank=0.006; Figure 7A). Patients who responded to gemcitabine also had longer MST than those who did not respond to the regimen (12.3 versus 8.2 moths; Figure 7B) although the difference did not reach statistical significance (Plog-rank=0.175) probably due to limited sample size. We then evaluated the association between BACH1 rs372883 genotypes and PDAC survival time and found that the MST for the rs372883CC, CT and TT genotypes was 11.3, 9.8 and 7.5 months (Plog-rank=0.039; Figure 7C). The per-allele hazard ratio for PDAC death was 0.63 (95% CI, 0.44-0.90; P=0.01).
Response to gemcitabine therapy in patients with PDAC by BACH1 rs372883 genotypes
| Genotype | Responders* | Nonresponders* | OR (95% CI)§ | P |
|---|---|---|---|---|
| TT | 4 (25.0) | 36 (41.9) | 1.00 (Reference) | |
| CT | 6 (37.5) | 40 (46.5) | 0.63 (0.15-2.57) | 0.514 |
| CC | 6 (37.5) | 10 (11.6) | 0.15 (0.03-0.68) | 0.014 |
*Responders include complete response and partial response while nonresponders include stable disease and progressive disease.
§OR, odds ratio, was calculated by logistic regression with adjustment for sex, age, tumor stage and surgery.
Kaplan-Meier estimation of PDAC survival time in 102 patients. (A) Survival curves by disease stage. (B) Survival curves by response to gemcitabine therapy. (C) Survival curves by BACH1 3'UTR rs372883 genotypes.
Discussion
In the previous GWAS, we identified rs372883 variant in BACH1 3'UTR as a genetic susceptibility locus for the development of PDAC [11]. The aim of the present study was to elucidate the functional effect of this 3'UTR variant on BACH1 expression and its consequential molecular role in PDAC. We demonstrate that BACH1 is low-expressed in PDAC and knockdown of BACH1 in PDAC cells provokes AKT and ERK oncogenic signaling via upregulation of HO-1 and thus promotes cell proliferation and angiogenesis. Importantly, we found that rs372883 variant in BACH1 3'UTR lies on a binding site for miR-1257; the T>C change might diminish miR-1257 binding, resulting in a higher expression of BACH1. These experimental findings are consistent with our GWAS results and indicate that higher expression of BACH1 rs372883C allele may be the underlying mechanism for reduced risk of PDAC in individuals carrying this variant. The supportive evidence for tumor suppressor role of BACH1 in PDAC is also seen in TCGA database (http://www.cbioportal.org/index.do), showing high frequencies of somatic mutations and copy number loss in the BACH1 locus. However, we notice that some sets of BACH1 mRNA profiling data from human PDAC in Oncomine database are not in line with our results, which is probably due to use of unpaired samples in these studies. In addition, in the present study, we have extended the results to the potential clinical implication that BACH1 genotype may be a useful biomarker for the identification of gemcitabine treatment efficacy and prognosis of PDAC.
BACH1 is broadly expressed in various human tissues [15-17]; however, little was previously known about its role in the development of PDAC. Because BACH1 is a transcriptional repressor negatively regulating several genes involved in oxidative stress response, cell cycle progression and apoptosis [29], it is reasonable to assume that as a potential tumor suppressor, BACH1 might act through some of these pathways. Indeed, by gene expression profile analysis using mRNAs from PDAC cells with or without BACH1 knockdown, we found the significant expression changes in several pathways, including those involved in cell proliferation. Previous study has reported that BACH1 may inhibit proliferation and angiogenesis of HUVECs through suppressing Wnt/β-catenin signaling pathway [35]. Other groups have also shown that BACH1 regulates proliferation of smooth muscle cells during inflammation and atherogenesis [36] and proliferation of murine embryonic fibroblasts in premature cellular senescence of these cells [37]. It has been reported that knockdown of BACH1 represses the growth inhibitory function of CXCR3-B in breast cancer cells [38]. On the other hand, it has been shown that overexpression of miR-155, which can target BACH1 mRNA, promotes proliferation of renal cancer cells [39]. All these findings indicate that BACH1 may regulate cell proliferation. Since HMOX1 (HO-1) is the main target of BACH1 and is important in the induction of tumorigenic signaling pathways [23, 40-43], in this study we focused on examination of the effects of altered BACH1 expression on HO-1 and its downstream signaling modules. We demonstrated that in PDAC cells, BACH1 indeed negatively regulates HO-1 expression. Knockdown of BACH1 expression substantially increased production of HO-1 and activation of AKT, ERK and eNOS and elevated HIF1A and VEGF but decreased PTEN expression, which consequentially enhanced cell proliferation ability. In contrast, overexpression of BACH1 in PDAC cells had reversed effects. Furthermore, the effects of BACH1 overexpression or knockdown could be rescued when HO-1 was concurrently overexpressed or knocked down in PDAC cells. During this process, we found that NRF2, the transactivator of HMOX1, may modulate the expression of HMOX1 by competitive binding to BACH1. Taken together, these results indicate that the acting mechanism of BACH1 in the risk of developing PDAC may at least partially depend on HO-1. In addition, we found that BACH1 could regulate the expression of genes involved in EMT and stemness, which might also contribute to tumor progression and drug resistance.
It has been well known that some microRNAs may induce mRNA cleavage or suppress translation by binding to the 3'UTR of target mRNA and therefore function as negative regulators of gene expression [44]. In the present study, we show for the first time that BACH1 expression is regulated by miR-1257 and the rs372883T>C variation diminishes this regulation. Since BACH1 may function as a tumor suppressor, one may expect that higher constitutional activity of BACH1 would confer lower risk of cancer formation, which may explain why individuals with the rs372883C allele have reduced PDAC risk compared with those with the rs372883T allele [11]. In line with this notion, we detected higher levels of miR-1257 in PDAC tissues compared with their adjacent normal tissues, implicating an oncogenic role of miR-1257 in PDAC. Since miR-1257 has poorly been investigated in malignancies, our results warrant further studies to examine the regulation and oncogenic role of this microRNA in the formation of PDAC and other types of human cancer.
Another interesting finding in the present study is the correlation between BACH1 expression levels and response to gemcitabine chemotherapy and survival time in individuals with PDAC. We found that individuals with the rs372883CC genotype had a stronger response to gemcitabine and longer MST compared with those with the rs372883TT genotype, suggesting that rs372883 genotype has potential to serve as a biomarker for identification or prediction of responsiveness to gemcitabine treatment and prognosis of the disease. These clinical findings can be replicated by in vitro drug sensitivity assays in PDAC cells with overexpression or knockdown of BACH1 and with different BACH1 rs372883 genotypes in the presence of BACH1 expression suppressor miR-1257. The association between BACH1 genotype and response to gemcitabine and survival time in patients may reflect the function of HO-1 since previous studies have linked HO-1 overexpression to resistance against gemcitabine in pancreatic cancer cells [45, 46]. Nonetheless, we found that HO-1 can rescue only part of the BACH1 effect, suggesting that there might be other effectors regulated by BACH1 involved in gemcitabine sensitivity. Indeed, we also found that the expression levels of ABCC2, MGST1 and NQO1, which may be downstream of BACH1, also had an effect on gemcitabine sensitivity to some degree. On the other hand, we found that the alteration of EMT- and stemness-associated genes may also play an important role in gemcitabine treatment. A more high-throughput study will be helpful to reveal other potential players. Because of the unavailability of target tissue specimens from most PDAC patients in the clinic, BACH1 rs372883 genotype would be a good surrogate for prediction if this effect can be further validated in a larger size of sample. However, we failed to find such a predictive effect for the rs372883CT genotype, which might be due to mixed expressing alleles of BACH1 in this group of the heterozygous genotype.
In conclusion, by a set of functional analyses in this study, we demonstrated that rs372883T>C change diminishes the interaction of BACH1 mRNA 3'UTR with miR-1257, resulting in a high expression of BACH1 that may more efficiently repress HO-1 expression and consequent oncogenic signaling. These results may explain why rs372883C allele is associated with reduced risk for the development of PDAC as discovered in our previous GWAS in Chinese population. Furthermore, we found that rs372883 genotype is also associated with response to gemcitabine treatment and survival time in patients with PDAC, suggesting that rs372883 genotypes might serve as a biomarker for prediction of gemcitabine treatment efficacy and prognosis of the malignancy.
Abbreviations
AKT: AKT serine/threonine kinase; BACH1: BTB and CNC homology 1 gene; ChIP: chromatin immunoprecipitation; ERK: extracellular signal-regulated kinase; ELISA: enzyme-linked immunesorbent assay; EMT: epithelial-mesenchymal transition; GWAS: genome-wide association study; GO: gene ontology; GSEA: gene set enrichment analysis; HMOX1: heme oxygenase 1 gene; HUVEC: human umbilical vein endothelial cell; MST: median survival time; PDAC: pancreatic ductal adenocarcinoma; TCGA: the cancer genome atlas; 3'UTR: 3'-untranslated region.
Acknowledgements
This study was supported by National Nature Science Foundation of China (grant number 81572793 to D.L., 81772586 to J.Z. and 81602461 to J.Z.); National High-Tech Research and Development Program of China (grant number 2013CB910302 to C.W.); Natural Science Foundation of Guangdong Province (grant number 2016A030313283 to J.Z.); the Recruitment Program of Global Youth Experts to C.W. and Chinese Academy of Medical Sciences Intramural Funds to C.W. and X.H.
Contributions
D.L., Chen W. and Chengfeng W. conceptualized and supervised this study. X.H., J.Z., J.L. and Xu C. designed and performed functional experiments and data analysis. Wenle T., M.S., Xinxin C., Z.D., Y.Z. and Wen T. performed sample preparation, genotyping assays and association analysis. Chengfeng W. and Xu C. provided clinical samples and data of patients. D.L., X.H. and Chen W. were involved in manuscript preparation. All authors reviewed the manuscript.
Supplementary Material
Supplementary figures and tables.
Competing Interests
The authors have declared that no competing interest exists.
References
1. Li D, Xie K, Wolff R, Abbruzzese JL. Pancreatic cancer. Lancet. 2004;363:1049-57
2. Siegel R, Ma J, Zou Z, Jemal A. Cancer statistics, 2014. CA Cancer J Clin. 2014;64:9-29
3. Burris 3rd HA, Moore MJ, Andersen J, Green MR, Rothenberg ML, Modiano MR. et al. Improvements in survival and clinical benefit with gemcitabine as first-line therapy for patients with advanced pancreas cancer: a randomized trial. J Clin Oncol. 1997;15:2403-13
4. Oettle H, Richards D, Ramanathan RK, van Laethem JL, Peeters M, Fuchs M. et al. A phase III trial of pemetrexed plus gemcitabine versus gemcitabine in patients with unresectable or metastatic pancreatic cancer. Ann Oncol. 2005;16:1639-45
5. Raimondi S, Maisonneuve P, Lowenfels AB. Epidemiology of pancreatic cancer: an overview. Nat Rev Gastroenterol Hepatol. 2009;6:699-708
6. Farrell JJ, Elsaleh H, Garcia M, Lai R, Ammar A, Regine WF. et al. Human equilibrative nucleoside transporter 1 levels predict response to gemcitabine in patients with pancreatic cancer. Gastroenterology. 2009;136:187-95
7. Shi C, Hruban RH, Klein AP. Familial pancreatic cancer. Arch Pathol Lab Med. 2009;133:365-74
8. Amundadottir L, Kraft P, Stolzenberg-Solomon RZ, Fuchs CS, Petersen GM, Arslan AA. et al. Genome-wide association study identifies variants in the ABO locus associated with susceptibility to pancreatic cancer. Nat Genet. 2009;41:986-90
9. Petersen GM, Amundadottir L, Fuchs CS, Kraft P, Stolzenberg-Solomon RZ, Jacobs KB. et al. A genome-wide association study identifies pancreatic cancer susceptibility loci on chromosomes 13q22.1, 1q32.1 and 5p15.33. Nat Genet. 2010;42:224-8
10. Low SK, Kuchiba A, Zembutsu H, Saito A, Takahashi A, Kubo M. et al. Genome-wide association study of pancreatic cancer in Japanese population. PLoS One. 2010;5:e11824
11. Wu C, Miao X, Huang L, Che X, Jiang G, Yu D. et al. Genome-wide association study identifies five loci associated with susceptibility to pancreatic cancer in Chinese populations. Nat Genet. 2012;44:62-6
12. Wolpin BM, Rizzato C, Kraft P, Kooperberg C, Petersen GM, Wang Z. et al. Genome-wide association study identifies multiple susceptibility loci for pancreatic cancer. Nat Genet. 2014;46:994-1000
13. Childs EJ, Mocci E, Campa D, Bracci PM, Gallinger S, Goggins M. et al. Common variation at 2p13.3, 3q29, 7p13 and 17q25.1 associated with susceptibility to pancreatic cancer. Nat Genet. 2015;47:911-6
14. Manolio TA. Bringing genome-wide association findings into clinical use. Nat Rev Genet. 2013;14:549-58
15. Igarashi K, Sun J. The heme-Bach1 pathway in the regulation of oxidative stress response and erythroid differentiation. Antioxid Redox Signal. 2006;8:107-18
16. Okada S, Muto A, Ogawa E, Nakanome A, Katoh Y, Ikawa S. et al. Bach1-dependent and -independent regulation of heme oxygenase-1 in keratinocytes. J Biol Chem. 2010;285:23581-9
17. Sun J, Hoshino H, Takaku K, Nakajima O, Muto A, Suzuki H. et al. Hemoprotein Bach1 regulates enhancer availability of heme oxygenase-1 gene. EMBO J. 2002;21:5216-24
18. Vile GF, Basu-Modak S, Waltner C, Tyrrell RM. Heme oxygenase 1 mediates an adaptive response to oxidative stress in human skin fibroblasts. Proc Natl Acad Sci USA. 1994;91:2607-10
19. Abraham NG, Kappas A. Pharmacological and clinical aspects of heme oxygenase. Pharmacol Rev. 2008;60:79-127
20. Jais A, Einwallner E, Sharif O, Gossens K, Lu TT, Soyal SM. et al. Heme oxygenase-1 drives metaflammation and insulin resistance in mouse and man. Cell. 2014;158:25-40
21. Was H, Cichon T, Smolarczyk R, Rudnicka D, Stopa M, Chevalier C. et al. Overexpression of heme oxygenase-1 in murine melanoma: increased proliferation and viability of tumor cells, decreased survival of mice. Am J Pathol. 2006;169:2181-98
22. Liu ZM, Chen GG, Ng EK, Leung WK, Sung JJ, Chung SC. Upregulation of heme oxygenase-1 and p21 confers resistance to apoptosis in human gastric cancer cells. Oncogene. 2004;23:503-13
23. Sunamura M, Duda DG, Ghattas MH, Lozonschi L, Motoi F, Yamauchi J. et al. Heme oxygenase-1 accelerates tumor angiogenesis of human pancreatic cancer. Angiogenesis. 2003;6:15-24
24. Therasse P, Arbuck SG, Eisenhauer EA, Wanders J, Kaplan RS, Rubinstein L. et al. New guidelines to evaluate the response to treatment in solid tumors. European Organization for Research and Treatment of Cancer, National Cancer Institute of the United States, National Cancer Institute of Canada. J Natl Cancer Inst. 2000;92:205-16
25. Reichard JF, Sartor MA, Puga A. BACH1 is a specific repressor of HMOX1 that is inactivated by arsenite. J Biol Chem. 2008;283:22363-70
26. Hussong M, Borno ST, Kerick M, Wunderlich A, Franz A, Sultmann H. et al. The bromodomain protein BRD4 regulates the KEAP1/NRF2-dependent oxidative stress response. Cell Death Dis. 2014;5:e1195
27. Pei H, Li L, Fridley BL, Jenkins GD, Kalari KR, Lingle W. et al. FKBP51 affects cancer cell response to chemotherapy by negatively regulating Akt. Cancer Cell. 2009;16:259-66
28. Badea L, Herlea V, Dima SO, Dumitrascu T, Popescu I. Combined gene expression analysis of whole-tissue and microdissected pancreatic ductal adenocarcinoma identifies genes specifically overexpressed in tumor epithelia. Hepatogastroenterology. 2008;55:2016-27
29. Warnatz HJ, Schmidt D, Manke T, Piccini I, Sultan M, Borodina T. et al. The BTB and CNC homology 1 (BACH1) target genes are involved in the oxidative stress response and in control of the cell cycle. J Biol Chem. 2011;286:23521-32
30. Ma J, Sawai H, Ochi N, Matsuo Y, Xu D, Yasuda A. et al. PTEN regulates angiogenesis through PI3K/Akt/VEGF signaling pathway in human pancreatic cancer cells. Mol Cell Biochem. 2009;331:161-71
31. Lim KH, Ancrile BB, Kashatus DF, Counter CM. Tumour maintenance is mediated by eNOS. Nature. 2008;452:646-9
32. Mai J, Qiu Q, Lin YQ, Luo NS, Zhang HF, Wen ZZ. et al. Angiotensin II-derived reactive oxygen species promote angiogenesis in human late endothelial progenitor cells through heme oxygenase-1 via ERK1/2 and AKT/PI3K pathways. Inflammation. 2014;37:858-70
33. Keith B, Johnson RS, Simon MC. HIF1alpha and HIF2alpha: sibling rivalry in hypoxic tumour growth and progression. Nat Rev Cancer. 2011;12:9-22
34. Morin RD, O'Connor MD, Griffith M, Kuchenbauer F, Delaney A, Prabhu AL. et al. Application of massively parallel sequencing to microRNA profiling and discovery in human embryonic stem cells. Genome Res. 2008;18:610-21
35. Jiang L, Yin M, Wei X, Liu J, Wang X, Niu C. et al. Bach1 represses Wnt/beta-catenin signaling and angiogenesis. Circ Res. 2015;117:364-75
36. Omura S, Suzuki H, Toyofuku M, Ozono R, Kohno N, Igarashi K. Effects of genetic ablation of bach1 upon smooth muscle cell proliferation and atherosclerosis after cuff injury. Genes Cells. 2005;10:277-85
37. Dohi Y, Ikura T, Hoshikawa Y, Katoh Y, Ota K, Nakanome A. et al. Bach1 inhibits oxidative stress-induced cellular senescence by impeding p53 function on chromatin. Nat Struct Mol Biol. 2008;15:1246-54
38. Balan M, Pal S. A novel CXCR3-B chemokine receptor-induced growth-inhibitory signal in cancer cells is mediated through the regulation of Bach-1 protein and Nrf2 protein nuclear translocation. J Biol Chem. 2014;289:3126-37
39. Li S, Chen T, Zhong Z, Wang Y, Li Y, Zhao X. microRNA-155 silencing inhibits proliferation and migration and induces apoptosis by upregulating BACH1 in renal cancer cells. Mol Med Rep. 2012;5:949-54
40. Zhu X, Fan WG, Li DP, Lin MC, Kung H. Heme oxygenase-1 system and gastrointestinal tumors. World J Gastroenterol. 2010;16:2633-7
41. Was H, Dulak J, Jozkowicz A. Heme oxygenase-1 in tumor biology and therapy. Curr Drug Targets. 2010;11:1551-70
42. Na HK, Surh YJ. Oncogenic potential of Nrf2 and its principal target protein heme oxygenase-1. Free Radic Biol Med. 2014;67:353-65
43. Dennery PA. Signaling function of heme oxygenase proteins. Antioxid Redox Signal. 2014;20:1743-53
44. Bartel DP. MicroRNAs: target recognition and regulatory functions. Cell. 2009;136:215-33
45. Berberat PO, Dambrauskas Z, Gulbinas A, Giese T, Giese N, Kunzli B. et al. Inhibition of heme oxygenase-1 increases responsiveness of pancreatic cancer cells to anticancer treatment. Clin Cancer Res. 2005;11:3790-8
46. Nuhn P, Kunzli BM, Hennig R, Mitkus T, Ramanauskas T, Nobiling R. et al. Heme oxygenase-1 and its metabolites affect pancreatic tumor growth in vivo. Mol Cancer. 2009;8:37
Author contact
![]() Corresponding authors: Dongxin Lin, Department of Etiology and Carcinogenesis, Cancer Hospital, Chinese Academy of Medical Sciences. Phone: 10-87788715; Fax: 10-67722460; Email: lindxac.cn; Chen Wu, Department of Etiology and Carcinogenesis, Cancer Hospital, Chinese Academy of Medical Sciences. Phone: 10-87787395; Fax: 10-67722460; Email: chenwuac.cn or Chengfeng Wang, Department of Abdominal Surgery, Cancer Hospital, Chinese Academy of Medical Sciences. Phone: 10-87788491; Email: wangcf369com.cn.
Corresponding authors: Dongxin Lin, Department of Etiology and Carcinogenesis, Cancer Hospital, Chinese Academy of Medical Sciences. Phone: 10-87788715; Fax: 10-67722460; Email: lindxac.cn; Chen Wu, Department of Etiology and Carcinogenesis, Cancer Hospital, Chinese Academy of Medical Sciences. Phone: 10-87787395; Fax: 10-67722460; Email: chenwuac.cn or Chengfeng Wang, Department of Abdominal Surgery, Cancer Hospital, Chinese Academy of Medical Sciences. Phone: 10-87788491; Email: wangcf369com.cn.