Impact Factor
- Issue 14; 2026
- Issue 13; 2026
- Issue 12; 2026
- Issue 11; 2026
- Issue 10; 2026
- Volume 16; 2026
- Advance Articles
- Past Issues
- Cover Images
- Cover Suggestion
- Index & Coverage
- Special Issues
Introduction
Methods
Results
Discussion
Abbreviations
Supplementary Material
Acknowledgements
References
International Journal of Biological Sciences
International Journal of Medical Sciences
 Global reach, higher impact

Theranostics 2018; 8(12):3198-3213. doi:10.7150/thno.24699 This issue Cite
Research Paper
DNA damage predicts prognosis and treatment response in colorectal liver metastases superior to immunogenic cell death and T cells
Johannes Laengle1,6, Judith Stift2, Agnes Bilecz3, Brigitte Wolf1, Andrea Beer2, Balazs Hegedus1,3, Stefan Stremitzer1, Patrick Starlinger1, Dietmar Tamandl4, Dietmar Pils1,5 ![]() , Michael Bergmann1,6
, Michael Bergmann1,6 ![]()
1. Division of General Surgery, Department of Surgery, Comprehensive Cancer Center Vienna, Medical University of Vienna, Waehringer Guertel 18-20, A-1090 Vienna, Austria
2. Department of Pathology, Comprehensive Cancer Center Vienna, Medical University of Vienna, Waehringer Guertel 18-20, A‑1090 Vienna, Austria
3. 2nd Department of Pathology, Semmelweis University, Üllői út 93, H-1091 Budapest, Hungary
4. Division of Cardiovascular and Interventional Radiology, Department of Biomedical Imaging and Image-guided Therapy, Comprehensive Cancer Center Vienna, Medical University of Vienna, Waehringer Guertel 18-20, A-1090 Vienna, Austria
5. Institute of Clinical Biometrics, Center for Medical Statistics, Informatics and Intelligent Systems, Medical University of Vienna, Spitalgasse 23, A‑1090 Vienna, Austria
6. Ludwig Boltzmann Institute Applied Diagnostics, Medical University of Vienna, Waehringer Guertel 18-20, 1090 Vienna, Austria
Received 2018-1-2; Accepted 2018-3-29; Published 2018-5-10
Abstract

Preclinical models indicate that DNA damage induces type I interferon (IFN), which is crucial for the induction of an anti-tumor immune response. In human cancers, however, the association between DNA damage and an immunogenic cell death (ICD), including the release and sensing of danger signals, the subsequent ER stress response and a functional IFN system, is less clear.
Methods: Neoadjuvant-treated colorectal liver metastases (CLM) patients, undergoing liver resection in with a curative intent, were retrospectively enrolled in this study (n=33). DNA damage (γH2AX), RNA and DNA sensors (RIG-I, DDX41, cGAS, STING), ER stress response (p-PKR, p-eIF2α, CALR), type I and type II IFN- induced proteins (MxA, GBP1), mature dendritic cells (CD208), and cytotoxic and memory T cells (CD3, CD8, CD45RO) were investigated by an immunohistochemistry whole-slide tissue scanning approach and further correlated with recurrence-free survival (RFS), overall survival (OS), radiographic and pathologic therapy response.
Results: γH2AX is a negative prognostic marker for RFS (HR 1.32, 95% CI 1.04-1.69, p=0.023) and OS (HR 1.61, 95% CI 1.23-2.11, p<0.001). A model comprising of DDX41, STING and p-PKR predicts radiographic therapy response (AUC=0.785, p=0.002). γH2AX predicts prognosis superior to the prognostic value of CD8. CALR positively correlates with GBP1, CD8 and cGAS. A model consisting of γH2AX, p-eIF2α, DDX41, cGAS, CD208 and CD45RO predicts pathological therapy response (AUC=0.944, p<0.001).
Conclusion: In contrast to preclinical models, DNA damage inversely correlated with ICD and its associated T cell infiltrate and potentially serves as a therapeutic target in CLM.
Keywords: DNA damage, calreticulin, immunogenic cell death, colorectal liver metastases
Introduction
Around 50% of all colorectal cancer (CRC) patients will develop liver metastases over the course of time [1]. Currently, only 30% of patients with colorectal liver metastases (CLM) are curable [2-4]. A profound molecular understanding of CLM could lead to the development of tailored therapeutic approaches to improve patient outcome.
Recent data indicate that the innate and adaptive immune systems appear to play a crucial role in the anti-tumor response against solid malignancies [5]. In primary CRC, the presence of tumor infiltrating T helper type 1 (Th1), cytotoxic T lymphocytes (CTLs) and memory T cells are associated with an improved disease-free survival (DFS) and overall survival (OS) [6-12].
This raises the question of how those T cells are activated within CLM. One likely candidate for T cell activation is type I interferon (IFN) [13-15]. Type I IFN is involved in the priming of T cells against tumor-associated antigens (TAAs) by professional antigen-presenting cells (APCs), as well as in the intratumoral accumulation of dendritic cells (DCs) and spontaneous cross-priming of tumor antigen-specific T cells in vivo [16-20]. Moreover, host type I IFN has been shown to be mandatory for the efficacy of chemotherapy [21].
In murine models, tumor-derived deoxyribonucleic acid (DNA), incorporated by DCs, is capable of activating the stimulator of interferon genes (STING) pathway, resulting in type I IFN production [22, 23]. The STING pathway plays a fundamental role in the process of recognizing damage-associated molecular patterns (DAMPs), such as tumor-derived DNA. STING is an adapter protein, which gets activated by cyclic dinucleotides (CDNs), generated by cyclic guanosine monophosphate‑adenosine monophosphate (GMP-AMP) synthase (cGAS), which in turn is directly activated by cytosolic DNA [24-26]. Strikingly, radiation-induced type I IFN‑dependent anti-tumor immunity also depends on the functional DNA-sensing STING pathway [27]. Moreover, DAMPs such as double-stranded ribonucleic acid (dsRNA) can lead to activation of the protein kinase R (PKR) following an endoplasmic reticulum (ER) stress response, mediated by the phosphorylation of eukaryotic translation initiation factor 2 alpha (eIF2α), which results in a calreticulin (CALR) mediated immunogenic cell death (ICD) [28].
In primary CRC, a type I and type II IFN-driven tumor microenvironment (TME) is associated with a Th1 immune reaction and an increased DFS [29]. Furthermore, mutated kirsten rat sarcoma viral oncogene homolog (KRAS) might abolish such a potential protective immune response by blunting an effective type I IFN response [30].
In this work, we evaluated this correlation in the clinical setting of CLM. Based on the pre-clinical data, we hypothesized that DNA damage would correlate with an increased type I IFN response and subsequently with a high infiltration of tumor-ablative immune cells, leading to an improved prognosis in CLM.
In contrary to the predictions from pre-clinical data, DNA damage was inversely correlated with ICD and negatively associated with pathological response and clinical prognosis.
Methods
Patient collective
A total of 70 patients with resectable or borderline resectable colorectal liver metastases (CLM), who underwent 3 cycles of neoadjuvant and adjuvant bevacizumab-based chemotherapy, following liver resection with a curative intent at the Department of Surgery of the Medical University of Vienna between 2005 and 2011, were retrospectively enrolled in this study. Of these, 33 were appropriate for our study (Figure S1). Patient characteristics were available from a prospectively maintained database (Table 1). Median follow-up time, 9 years (95% CI 7.56-10.45), was calculated according to the reversed Kaplan-Meier method [31]. This study was conducted according to the reporting recommendations for tumor marker prognostic studies (REMARK) [32].
Patient characteristics.
| Total no | ||
|---|---|---|
| Demographics | (n=33) | |
| Median age ± IQR (years) | 62 ± 19 | |
| Sex | ||
| Male | 17 | (52%) |
| Female | 16 | (48%) |
| Primary tumor | ||
| Tumor location | ||
| Left | 26 | (12%) |
| Right | 4 | (79%) |
| Transverse | 3 | (9%) |
| pT stage | ||
| pT1 | 2 | (8%) |
| pT2 | 2 | (8%) |
| pT3 | 20 | (76%) |
| pT4 | 2 | (8%) |
| pN stage | ||
| pN0 | 11 | (39%) |
| pN1 | 11 | (39%) |
| pN2 | 6 | (22%) |
| M stage | ||
| M0 | 13 | (42%) |
| M1 | 18 | (58%) |
| UICC stage | ||
| I | 1 | (4%) |
| II | 4 | (15%) |
| III | 4 | (15%) |
| IV | 18 | (66%) |
| Tumor differentiation | ||
| Well | 2 | (8%) |
| Moderate | 19 | (70%) |
| Poor | 6 | (22%) |
| Residual Tumor classification | ||
| R0 | 26 | (100%) |
| Liver metastases | ||
| Metastases timepoint | ||
| Synchronous | 19 | (58%) |
| Metachronous | 14 | (42%) |
| Distribution | ||
| Unilobular | 15 | (45%) |
| Bilobular | 16 | (49%) |
| Central | 2 | (6%) |
| Number of lesions | ||
| Solitary | 13 | (39%) |
| Multiple | 20 | (61%) |
| Neoadjuvant chemotherapy | ||
| XELOX | 19 | (58%) |
| FOLFIRI | 4 | (12%) |
| FOLFOX | 4 | (12%) |
| XELIRI | 2 | (6%) |
| TOMOX | 1 | (3%) |
| Fluorouracil | 1 | (3%) |
| Irinotecan | 1 | (3%) |
| Raltitrexed + Irinotecan | 1 | (3%) |
| Neoadjuvant bevacizumab | ||
| Yes | 29 | (88%) |
| No | 4 | (12%) |
| Neoadjuvant cetuximab | ||
| Yes | 2 | (6%) |
| No | 31 | (94%) |
| Median neoadjuvant cycles ± IQR | 5 ± 3 | |
| Radiographic therapy response | ||
| Good response (CR, PR) | 15 | (45%) |
| Poor response (SD, PD) | 18 | (55%) |
| Radiomorphologic therapy response | ||
| Good response (OR, PR) | 20 | (60%) |
| Poor response (AR) | 13 | (40%) |
| Synchronous primary tumor resection | ||
| Yes | 2 | (6%) |
| No | 31 | (94%) |
| Histology | ||
| Adenocarcinoma - Tubular-papillary | 27 | (82%) |
| Adenocarcinoma - Mucinous | 6 | (12%) |
| Tumor differentiation | ||
| Moderate | 33 | (100%) |
| Residual Tumor classification | ||
| R0 | 33 | (100%) |
| Pathologic therapy response | ||
| Good response (0-25% viable) | 9 | (27%) |
| Poor response (≥25% viable) | 24 | (73%) |
| Histologic therapy response | ||
| Good response (TRG 1-3) | 4 | (12%) |
| Poor response (TRG 4-5) | 29 | (88%) |
| Modified histologic therapy response | ||
| Good response (mTRG 1-3) | 17 | (52%) |
| Poor response (mTRG 4-5) | 16 | (48%) |
| Mismatch repair status | ||
| Proficient | 33 | (100%) |
| Deficient | 0 | (0%) |
| KRAS status | ||
| Wild-type | 13 | (39%) |
| Mutant | 20 | (61%) |
| BRAF status | ||
| Wild-type | 33 | (100%) |
| Mutant | 0 | (0%) |
| Median recurrence-free survival (months) | 10 | (95% CI 6.66-13.34) |
| Median overall survival (months) | 40 | (95% CI 26.50-53.51) |
AR: absent response; BRAF: V‑raf murine sarcoma viral oncogene homolog B1; CI: confidence interval; CR: complete response; FOLFIRI: folinic acid, fluorouracil, irinotecan; FOLFOX: folinic acid, fluorouracil, oxaliplatin; IQR: interquartile range; KRAS: kirsten rat sarcoma viral oncogene homolog; Left: descending colon, sigmoid colon or rectum; mTRG: modified tumor regression grading; OR: optimal response; PD: progressive disease; PR: partial response, partial remission; Right: caecum or ascending colon; SD: stable disease; TOMOX: raltitrexed, oxaliplatin; Transverse: transverse colon; TRG: tumor regression grading; UICC: union for international cancer control; XELIRI: capecitabine, irinotecan; XELOX: capecitabine, oxaliplatin.
Therapy application
To achieve or improve resectability of CLM, all patients received a neoadjuvant treatment. Patients receiving chemotherapy in combination with the monoclonal antibody (mAb) bevacizumab, targeting the vascular endothelial growth factor-A (VEGF-A), obtained one of the following regimens:
XELOX + bevacizumab: 21-day treatment cycle comprised the intravenous (IV) administration of bevacizumab 7.5 mg/kg over 30 min, oxaliplatin 130 mg/m2 over 2 h and oral capecitabine 850 mg/m2 twice daily on days 1 to 14.
XELIRI + bevacizumab: 21-day treatment cycle comprised the IV administration of bevacizumab 7.5 mg/kg over 30 min, irinotecan 250 mg/m2 and oral capecitabine 1000 mg/m2 twice daily on days 1 to 14.
FOLFOX + bevacizumab: 14-day treatment cycle comprised the IV administration of bevacizumab 5 mg/kg over 15 min, oxaliplatin 85 mg/m2 over 2 h, folinic acid 400 mg/m2 over 2 h concurrent with oxaliplatin, a bolus of fluorouracil 400 mg/m2 and fluorouracil 2400 mg/m2 over 48 h.
FOLFIRI + bevacizumab: 14-day treatment cycle comprised the IV administration of bevacizumab 5 mg/kg over 15 min, irinotecan 180 mg/m2 over 90 min, folinic acid 400 mg/m2 over 2 h concurrent with irinotecan, a bolus of fluorouracil 400 mg/m2 and fluorouracil 2400 mg/m2 over 46 h.
TOMOX + bevacizumab: 21-day treatment cycle comprised the IV administration of bevacizumab 7.5 mg/kg over 30 min, raltitrexed 3 mg/m2 over 15 min and oxaliplatin 130 mg/m2 over 2 h.
Raltitrexed + irinotecan + bevacizumab: 21-day treatment cycle comprised the IV administration of bevacizumab 7.5 mg/kg over 30 min, raltitrexed 3 mg/m2 over 15 min and irinotecan 350 mg/m2 over 90 min.
Irinotecan + bevacizumab: 21-day treatment cycle comprised the IV administration of bevacizumab 7.5 mg/kg over 30 min and irinotecan 350 mg/m2 over 90 min.
For patients who received chemotherapy in combination with the mAb cetuximab, targeting the epidermal growth factor receptor (EGFR), obtained the following regimen:
FOLFIRI + cetuximab: 28-day treatment cycle comprised the IV administration of cetuximab, starting with a loading dose of 400 mg/m2 over 2 h, followed by 250 mg/m2 over 1 h every week, irinotecan 180 mg/m2 over 90 min, folinic acid 400 mg/m2 over 2 h concurrent with irinotecan, a bolus of fluorouracil 400 mg/m2 and fluorouracil 2400 mg/m2 over 48 h, given on days 1 and 15.
For patients receiving chemotherapy alone, they obtained either XELOX as described above or oral capecitabine 1250 mg/m2 twice daily for 2 weeks in a 21-day treatment cycle.
The type of regimen and dose alteration was based on the decision of the local multidisciplinary tumor board team. The different chemotherapy regimens were preferentially given in combination with bevacizumab as long as there were no contraindications, such as history of gastrointestinal perforation, fistulas, wound healing complications, challenging hypertension, proteinuria, arterial or venous thromboembolic events, bleedings, congestive cardiac failure, current infection or neutropenia.
Evaluation of radiographic therapy response
Radiographic therapy response was determined by an expert radiologist (D.T.) of the Department of Radiology and Nuclear Medicine of the Medical University of Vienna, who was blinded to clinical data.
Change of metastases diameter between pre- and post‑neoadjuvant treatment was evaluated by contrast-enhanced computed tomography (CT) or magnetic resonance imaging (MRI). Metastases were classified as complete response (CR), partial response (PR), stable disease (SD) or progressive disease (PD), according to the response evaluation criteria in solid tumors (RECIST) 1.1 [33]. Briefly, CR (vanishing of all lesions), PR (decrease in ≥30% size), SD (decrease in <30% size) and PD (increase in ≥20% size). Patients were considered as good (CR, PR) or poor (SD, PD) responders.
Evaluation of radiomorphologic therapy response
Radiomorphologic therapy response was determined by an expert radiologist (D.T.) of the Department of Radiology and Nuclear Medicine of the Medical University of Vienna, who was blinded to clinical data.
Change of metastases morphology between pre- and post‑neoadjuvant treatment was evaluated by contrast-enhanced CT scans according to the novel morphological response criteria [34-36]. Briefly, target lesions were evaluated and grouped according to their overall attenuation (heterogeneous, mixed or homogeneous/hypoattenuating), tumor-liver interface (defined, variable or sharp) and peripheral rim enhancement (may be present, if primarily present, incompletely resolved or if primarily present, completely resolved). Group 1 was classified by a homogeneous overall attenuation, a sharply defined tumor-liver interface and a completely resolved peripheral rim enhancement. Group 3 was characterized by a heterogeneous overall attenuation, a poorly defined tumor-liver interface and absence of a peripheral rim enhancement or if primarily present, no resolution. Group 2 was classified by an intermediate morphology, which could not be scored as group 1 or 3. Optimal response (OR) was defined by a change from group 3 or 2 to group 1, partial response (PR) was considered for a change from group 3 to group 2 and absent response (AR) if there was no group change or progression from group 2 to group 3. Patients were considered as good (OR, PR) or poor (AR) responders.
Evaluation of pathologic therapy response
An expert hepatobiliary pathologist (J.S.) of the Department of Pathology of the Medical University of Vienna, who was blinded to clinical data, assessed the histologic characteristics of hematoxylin and eosin (H&E) stained specimens.
Pathologic therapy response was semi‑quantitatively assessed by the amount of vital tumor cells, as a percentage relative to all tumor cells. Areas of usual necrosis (UN), indicating an insufficient treatment effect, were considered as part of vital tumor cells. However, infarct-like necrosis (ILN), characterizing a therapeutic response to chemotherapy, was considered as non-vital tumor cells [37]. On this basis, we allocated each specimen into one quartile (≥75%, 50-75%, 25-49% or <25% viable tumor cells).
Evaluation of histologic therapy response
An expert hepatobiliary pathologist (J.S.) of the Department of Pathology of the Medical University of Vienna, who was blinded to clinical data, assessed the histologic characteristics of H&E stained specimens.
Histologic therapy response was assessed semi-quantitatively according to the tumor regression grading (TRG) [38]. Briefly, TRG1 was classified by the absence of tumor cells replaced by extensive fibrosis. TRG2 represented seldom remaining tumor cells dispersed through extensive fibrosis. TRG3 characterized more remaining tumor cells dispersed through predominant fibrosis. TRG4 described large amount of vital tumor cells predominating over fibrosis. TRG5 contained mostly vital tumor cells without any fibrosis.
Moreover, we incorporated the consideration of ILN into a modified TRG (mTRG) [37].
For the declaration of hepatic steatosis, a cut-off of 5% steatotic cells of patient matched normal liver tissue was used [39].
Analysis of mutation status
Kirsten rat sarcoma viral oncogene homolog (KRAS) and V‑raf murine sarcoma viral oncogene homolog B1 (BRAF) mutation status of CLM was determined as previously described [40]. Briefly, genomic DNA was extracted from tissue blocks and exon 2 and 3 of the KRAS gene and exon 15 of the BRAF gene were polymerase chain reaction (PCR) amplified with AmpliTaq Gold® DNA polymerase (Applied Biosystems, Fisher Scientific, Vienna, Austria) and corresponding oligonucleotide primers (Table S1). Excess of primers and deoxynucleotides (dNTPs) was removed by incubation of 5 µL PCR product with 2.5 U exonuclease I (GE Healthcare Life Sciences, Vienna, Austria) and 2.5 U shrimp alkaline phosphatase (SAP; GE Healthcare Life Sciences) at 37°C for 1 h. Enzymes were further heat inactivated at 70°C for 15 min, following sequence analysis with 1-2 µL of the purified PCR product and 4 pmol primers using the BigDye™ Terminator Cycle Sequencing Kit (Applied Biosystems) according to the manufacturer's instructions. Excess of BigDye™ Terminator nucleotides was removed by centrifugation with Centri-Sep™ Spin Columns (Invitrogen, Fisher Scientific, Vienna, Austria). Separation and analysis of the sequencing reaction products were performed with an Applied Biosystems 3130 Genetic Analyzer (Applied Biosystems) according to manufacturer's protocol.
Analysis of mismatch repair status
Mismatch repair (MMR) status, proficient or deficient, was determined by immunohistochemistry (IHC) [41, 42]. For this purpose, MutL homolog 1 (MLH1; Ventana Medical Systems Inc.) and MutS protein homolog 2 (MSH2; Cell Marque, Rocklin, CA, USA) were stained by an automated IHC slide staining BenchMark ULTRA system (Ventana Medical Systems Inc.) according to manufacturer's protocol (Table S2). Briefly, samples were deparaffinized following heat-induced epitope retrieval (HIER) at 95°C for 52 min at pH 8 (ready-to-use solution). Antibody binding was visualized using the ultraView Universal DAB Detection Kit (Ventana Medical Systems Inc.). Slides were counterstained with hematoxylin (Ventana Medical Systems Inc.) and sealed with coverslips. All samples were evaluated by an expert hepatobiliary pathologist (J.S.) of the Department of Pathology of the Medical University of Vienna, who was blinded to clinical data. Tumor showing loss of MLH1 and MSH2 expression were classified as mismatch repair deficient. Matched nuclear staining of lymphocytes served as an internal positive control.
Immunohistochemistry
Formalin-fixed paraffin-embedded (FFPE) tissue of CLM was obtained from the Department of Pathology of the Medical University of Vienna. Consecutive 1 µm thick slices were cut from FFPE tumor tissue. Paraffin wax was melted at 60°C for 2 h and, subsequently, slides were deparaffinized in xylene (Fisher Scientific, Pittsburgh, PA, USA) and rehydrated in declining dilutions of ethanol. For HIER, slides were incubated in 10 mM sodium citrate (Sigma-Aldrich, St. Louis, MO, USA) containing 0.05% Tween 20 (Sigma-Aldrich) at pH 6.0 or in 10 mM tris(hydroxymethyl)aminomethane (Merck Millipore, Darmstadt, HE, DE) and 1 mM ethylenediaminetetraacetic acid (EDTA; Sigma-Aldrich) containing 0.05% Tween 20 at pH 9.0 and heated up in pressure cooker until 121°C. Consequently, slides were cooled down to room temperature (RT) and permeabilized with 0.2% Triton X-100 (Sigma-Aldrich) in phosphate-buffered saline (PBS) for 5 min at RT. Endogenous peroxidase activity was blocked with 0.3% hydrogen peroxide (Merck Millipore) in PBS for 10 min at RT in the dark. Afterwards, slides were incubated with 5% normal horse serum in PBS (VECTASTAIN Elite ABC HRP Kit; Vector Laboratories, Burlingame, CA, USA) for 20 min at RT. Primary antibodies (Table S2) were incubated for 1 hr at RT in a humidified chamber. Afterwards biotinylated horse anti-mouse IgG/anti-rabbit IgG secondary antibody (VECTASTAIN Elite ABC HRP Kit; Vector Laboratories) was applied for 30 min at RT, following incubation with the AB reagent (VECTASTAIN Elite ABC HRP Kit; Vector Laboratories) for 30 min at RT in the dark. Color development was conducted with the DAB Peroxidase (HRP) Substrate Kit (Vector Laboratories). Slides were counterstained with Mayer's hemalum solution (Merck Millipore), dehydrated in ascending dilutions of ethanol, incubated in n‑Butyl acetate (Fisher Scientific) for 2 min at RT, mounted with Entellan (Merck Millipore) and sealed with coverslips.
CD3, CD8, CD45RO, GBP1, Ki-67 and MxA were stained by an automated immunohistochemistry staining Benchmark XT system (Ventana Medical Systems Inc., Tucson, AZ, USA) using the reagents and steps according to the manufacturer's protocol. Briefly, following deparaffinization, HIER was performed at 42°C for 30 min at pH 9 (ready-to-use solution). Antibody binding was visualized using the ultraView Universal DAB Detection Kit (Ventana Medical Systems Inc.). Slides were counterstained with Mayer's hematoxylin (Zymed Laboratories Inc., San Fransisco, CA, USA) and sealed with coverslips.
Whole-slide tissue cell quantification
Microscopic images of whole-slide tissue sections were automatically acquired with TissueFAXS scanning systems (TissueGnostics GmbH, VIE, AUT), using a Zeiss Observer Z1 microscope (Carl Zeiss AG, Oberkochen, BW, GER) equipped with a SCAN IM 12-slide scanning stage (Marzhauser Wetzlar GmbH & Co. KG, Wetzlar, HE, GER) and a Baumer HXG40c camera (Baumer Group, Frauenfeld, TG, CHE), operated by TissueFAXS 4.2 Slides software (TissueGnostics). Acquisition was performed with an EC Plan-Neofluar 20x/0.5 M27 objective (Zeiss). Acquired imaging data was analyzed with the image analysis software StrataQuest 5.0.1.264 (TissueGnostics).
Two different regions were analyzed within the CLM: (i) tumor (TU) and (ii) invasive margin (IM; tumor/adjacent liver border). For this purpose, the clear distinguishable tumor area was marked manually and a standardized invasive margin area, with an exact width of 500 µm on each side of the tumor/adjacent liver border, was created automatically by the analysis software (Figure S2).
For absolute cell quantification a (i) nuclei mask was programmed, which detects all single cells on the basis of the cell nuclei staining and morphology. This nuclei mask was further used for the generation of an (ii) antibody detection mask, identifying the antibody specific staining pattern (membrane, cytoplasmic or nucleus) of the differently used antibodies (Figure S3).
Values are given as percentages of nuclei and antibody specific-stained single cells out of all nuclei-stained single cells at each region of interest. All computerized evaluations were visually crosschecked for reliability.
Statistics
Recurrence-free survival (RFS) was the primary endpoint of this study and defined as the time between surgery of CLM and observation of the first recurrence (local or distant) or cancer-related death. Overall survival (OS), defined as the time between resection of CLM and cancer-related death, radiographic therapy response and pathologic therapy response were secondary endpoints. If a patient had neither a recurrence nor a cancer-related death, RFS or OS was censored at the date of the last follow-up or known to be alive.
All statistical analyses were computed with R version 3.4.1 [43]. Percentage of marker panel events were log2 transformed to achieve approximate normal distributions. Missing IHC (up to 24% for CD3 values) and clinical data (radiographic therapy response, radiomorphologic therapy response, histology, pathologic therapy response, histologic therapy response, and modified histologic therapy response) were imputed with values estimated by the predictive mean matching method using R-package “mice” (version 2.30; table without imputed values is shown in Table S3).
Principal component analysis (PCA), correlation matrix plots and Pearson's correlation coefficients for IM and TU were calculated with intrinsic R commands and R‑package “corrplot” (version 0.77). P-values of the “corrplot” were corrected according to the false discovery rate (FDR) [44].
Univariate Cox regression analyses were calculated with R commands. Hazard ratios (HR) and corresponding 95% confidence intervals (CI) were plotted with R-package “forestplot” (version 1.8). Prognostics models were computed with an adaptive elastic net approach for censored data using the R-package “hdnom” (version 4.8.9000) and are illustrated by nomograms. For this purpose, the “hdcox.aenet” command with a 4-fold internal cross-validation and lambda selection based on the one standard error cut-off method (“lambda.1se”), which gives the most regularized model in which the error is within one standard error of the minimum mean cross‑validated error, was used. The final prognostic models were further bootstrap-based validated at several time points and results are depicted by corresponding plots. The model-predictor was further dichotomized into a high‑risk and low-risk group to illustrate the impact of each final model on clinical outcome, which is illustrated by Kaplan-Meier survival estimates. As the survival estimates are originated from the multivariable models, no censored patients are included.
To predict radiographic and pathologic therapy response with the marker panel, least absolute shrinkage and selection operator (LASSO) logistic regression models were generated with the R-package “glmnet” (version 2.0-10), internally cross-validated and regularized as described above. For each outcome (radiographic or pathologic) the model with the best prediction performance, based on the area under the receiver operating characteristic (ROC) curve (AUC), was selected. Boxplots of the corresponding model-values are illustrated next to the AUC plots.
The Venn diagram was plotted using R-package “VennDiagram” (version 1.6.17). All p‑values were 2-sided and considered as statistically significant if <0.05.
Results
Marker panel events at the invasive margin and tumor area are correlated
We determined proteins involved in DNA damage (γH2AX), RNA and DNA sensors (RIG-I, DDX41, cGAS, STING), ER stress response (p-PKR, p‑eIF2α, CALR), type I and type II IFN-induced proteins (MxA and GBP1 respectively) and tumor-infiltrating immune cells, such as activated DCs (CD208) and T cells (CD3, CD8, CD45RO) in patients with CLM by the use of a quantitative immunohistochemistry approach (Figure 1A).
Marker panel events at the invasive margin and tumor area are correlated with each other. (A) Studydesign. (B) Principal component analysis (PCA) of marker panel values at the invasive margin (IM) and tumor area (TU). Each dot represents a CLM sample. PC1 is depicted on the x-axis and PC2 on the y-axis. Percentage of data variance explained by each PC is indicated. Arrows specify vectors for each individual marker at the IM and TU, indicating the impact of the PCs. (C) Correlation matrix plots for each individual marker at the IM and TU. Pearson's correlation coefficients are indicated in the upper right boxes. Histogram of corresponding value distributions at the IM and TU are shown in the upper left and lower right boxes, respectively. Dashed lines in the lower left boxes represent linear regressions. ***p<0.001; CALR: calreticulin. CD: cluster of differentiation; cGAS: cyclic guanosine monophosphate‑adenosine monophosphate synthase; DDX41: aspartate-glutamate-alanine-aspartate-box helicase 41; GBP1: guanylate binding protein 1; IM: invasive margin; MxA: interferon-induced guanosine triphosphate-binding protein MxA; p-eIF2α: phosphorylated-eukaryotic translation initiation factor 2 alpha; p-PKR: phosphorylated-protein kinase R; RIG-I: retinoic acid inducible gene I; STING: stimulator of interferon genes; TU: tumor area; γH2AX: phosphorylated-histone H2AX.
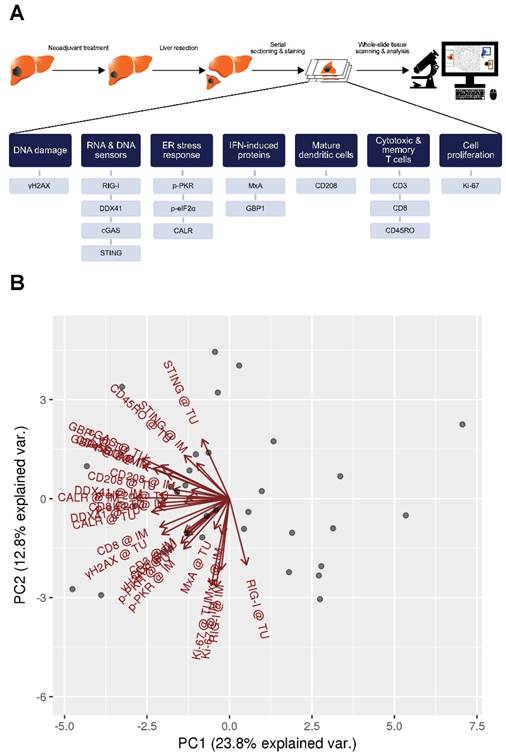
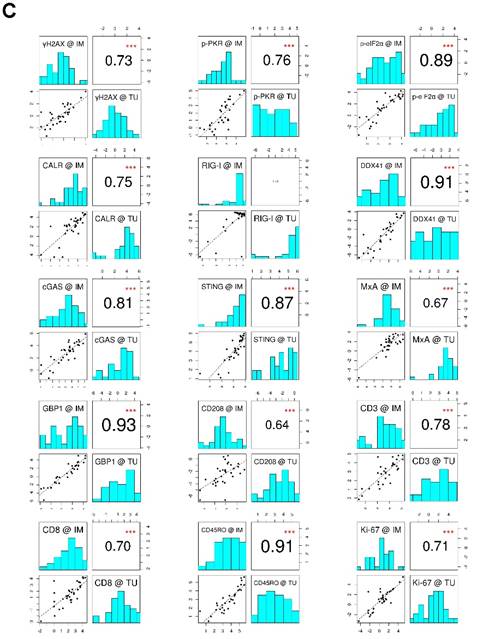
To evaluate the data explaining variance of our marker panel, we initially performed a principal component analysis (PCA). Strikingly, nearly all vectors, indicating the impact of each marker on the PCs, pointed in the same direction within the PC1 (Figure 1B). This implies that the biological raised question in this work accounts for the highest variance in the data (i.e., PC1). Moreover, IM and TU vectors of each individual marker were approximately overlapping, indicating an association between each other. The latter observation was further confirmed by a correlation analysis of the marker panel values at the IM and TU (Figure 1C). Taking all these facts into account, we conducted all further analysis only with the marker panel values at the IM.
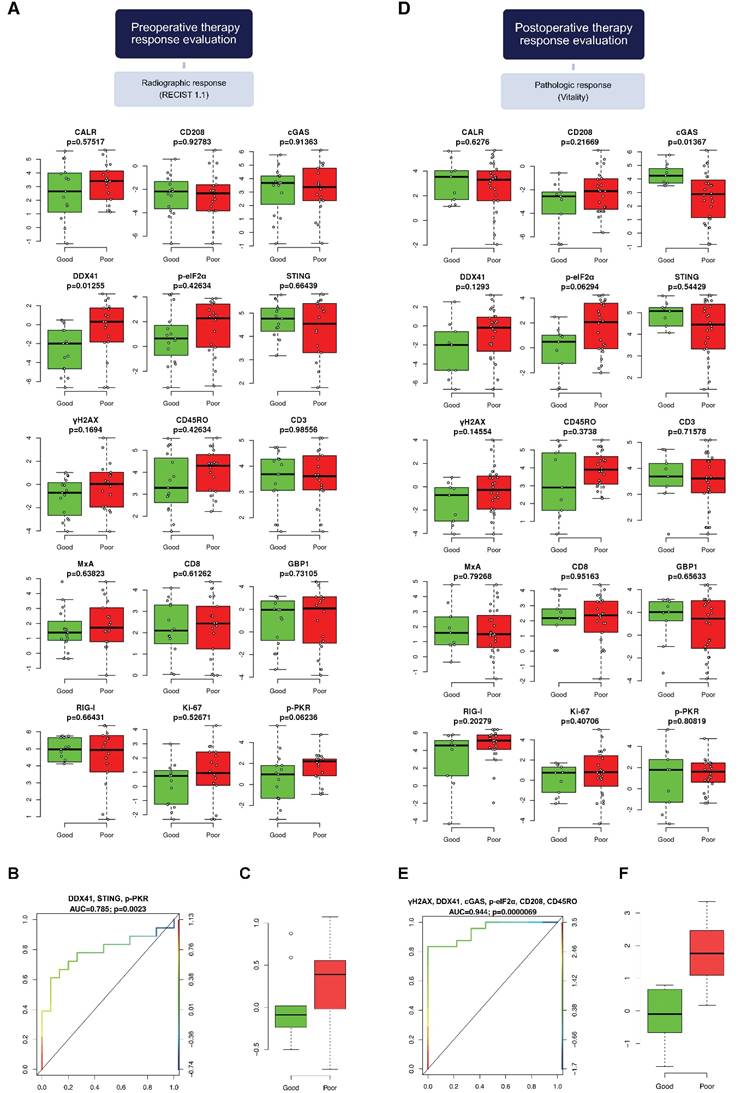
DNA damage and ER stress response are inversely associated with recurrence-free survival
We assessed the association of our marker panel with recurrence-free survival (RFS). We first conducted a univariate Cox regression analysis (Figure 2A). Interestingly, the amount of DNA damage, represented by γH2AX, was associated with a shorter RFS (HR 1.32, 95% CI 1.04-1.69, p=0.023). In contrast, ER stress response, characterized by the exposure of calreticulin (CALR), was linked with a longer RFS (HR 0.83, 95% CI 0.69-0.98, p=0.03). In this line, cytotoxic T cells (CTLs; CD8) were also related with a longer RFS (HR 0.67, 95% CI 0.50-0.89, p=0.007).
DNA damage and ER stress response are inversely associated with recurrence‑free survival. (A) Forest plot indicating hazard ratios (HR; black squares) and corresponding 95% confidence intervals (CI; grey horizontal lines) of marker panel (log2 % values) and (B) clinical characteristics for RFS. The square size correlates with the range of the 95% CI. The grey vertical line represents the no effect point. Green and red color indicates a statistically significant positive or negative effect, respectively. HR, corresponding 95% CI (within the brackets) and p-values are shown. (C) Internal cross-validated adaptive elastic‑net model for RFS is illustrated by a nomogram. A straight upward line to the “Points” axis is drawn for each individual patient clinical characteristic and marker expression (log2 % values), following a straight downward line to the “Total Points” axis, the “Linear Predictor” and the corresponding “5-Year Recurrence-free Survival Probability”. (D) Bootstrap validation of nomogram model over time. The area under the receiver operating characteristic (ROC) curve (specified on the ordinate) is depicted over time (months; specified on the abscissa). The mean (solid blue line), median (dashed blue line), 25% and 75% quantiles (dark grey area), minimum and maximum (light grey area) of the area under the ROC curve are illustrated. (E) RFS probability for “high-risk” and “low-risk” groups, which are dichotomized from the nomogram model, is specified on the ordinate. Time (months) is specified on the abscissa. AR: absent response; CALR; calreticulin; CD: cluster of differentiation; cGAS: cyclic guanosine monophosphate‑adenosine monophosphate synthase; CR: complete response; DDX41: aspartate-glutamate-alanine-aspartate-box helicase 41; GBP1: guanylate binding protein 1; IM: invasive margin; KRAS: kirsten rat sarcoma viral oncogene homolog; mTRG: modified tumor regression grading; mut: mutant; MxA: interferon-induced guanosine triphosphate-binding protein MxA; OR: optimal response; p-eIF2α: phosphorylated-eukaryotic translation initiation factor 2 alpha; p-PKR: phosphorylated-protein kinase R; PD: progressive disease; PR: partial response, partial remission; RIG-I: retinoic acid inducible gene I; SD: stable disease; STING: stimulator of interferon genes; TRG: tumor regression grading; TU: tumor area; wt: wild-type; γH2AX: phosphorylated-histone H2AX.
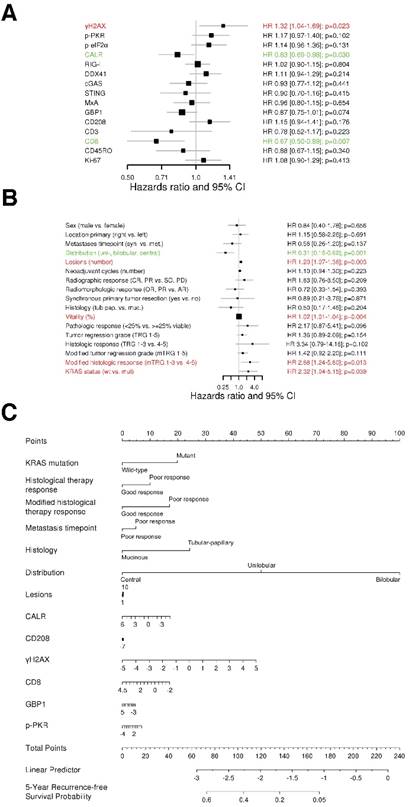
Furthermore, we conducted a univariate Cox regression analysis for the clinical characteristics (Figure 2B). The clinical characteristics that contributed with statistical significance to RFS were distribution of metastases (HR 0.31, 95% CI 0.15-0.62, p=0.001), number of metastases (HR 1.20, 95% CI 1.07-1.36, p=0.003), tumor vitality (HR 1.02, 95% CI 1.01‑1.04, p=0.004), modified histologic response (HR 2.68, 95% CI 1.24-5.80, p=0.013) and KRAS status (HR 2.32, 95% CI 1.04-5.15, p=0.039).
Additionally, we assessed a multivariable analysis for RFS by combining the marker panel and clinical variables. For this intent, we built an internally cross-validated adaptive elastic‑net model (Figure 2C), which was further bootstrap-validated at certain time-points (Figure 2D). The model contributing statistical significance to the 5-year RFS probability consisted of the markers γH2AX, CALR, CD8, GBP1, p-PKR and CD208, as well as the clinical variables metastases distribution, KRAS status, modified histologic therapy response, timing of metastases, histologic therapy response and histology. Apart from the CLM distribution, γH2AX had the strongest association (negative) with RFS.
The prognostic power of the model for RFS revealed a stable median AUC of ~0.8 over time. On the basis of the statistically significant model for RFS, patients were further dichotomized into high-risk and low-risk groups. Comparison between the two different groups revealed a statistically significant different RFS probability (p<0.001; Figure 2E).
DNA damage and DNA sensor DDX41 are negatively associated with overall survival
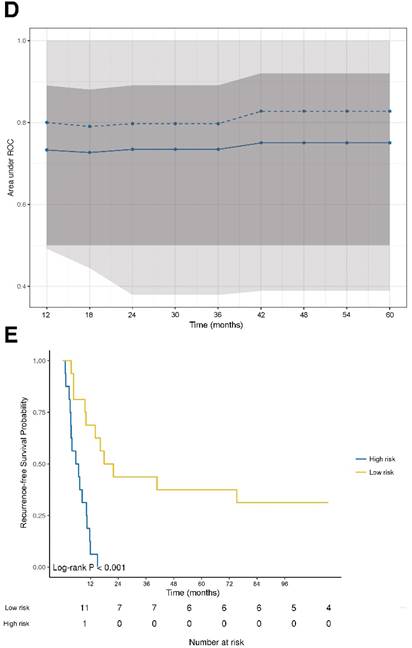
To investigate the association impact of our marker panel with OS we conducted a univariate Cox regression analysis (Figure 3A). The amount of γH2AX, the DNA sensor DDX41, as well as p-PKR were negatively associated with OS (HR 1.61, 95% CI 1.23-2.11, p<0.001; HR 1.22, 95% CI 1.04-1.44, p=0.017 and HR 1.33 95% CI 1.07-1.64, p=0.009; respectively).
DNA damage and DNA sensor DDX41 are negatively associated with overall survival. (A) Forest plot indicating hazard ratios (HR; black squares) and corresponding 95% confidence intervals (CI; grey horizontal lines) of marker panel (log2 % values) and (B) clinical characteristics for OS. The square size correlates with the range of the 95% CI. The grey vertical line represents the no effect point. Green and red colors indicate a statistically significant positive or negative effect, respectively. HR, corresponding 95% CI (within the brackets) and p-values are shown. (C) Internal cross validated adaptive elastic‑net model for OS is illustrated by a nomogram. A straight upward line to the “Points” axis is drawn for each individual patient clinical characteristic and marker expression (log2 % values), following a straight downward line to the “Total Points” axis, the “Linear Predictor” and the corresponding “5‑Year Overall Survival Probability”. (D) Bootstrap validation of nomogram model over time. The area under the receiver operating characteristic (ROC) curve (specified on the ordinate) is depicted over time (months; specified on the abscissa). The mean (solid blue line), median (dashed blue line), 25% and 75% quantiles (dark grey area), minimum and maximum (light grey area) of the area under the ROC curve are illustrated. (E) OS probability for “high-risk” and “low-risk” groups, which are dichotomized from the nomogram model, is specified on the ordinate. Time (months) is specified on the abscissa. AR: absent response; CALR; calreticulin; CD: cluster of differentiation; cGAS: cyclic guanosine monophosphate‑adenosine monophosphate synthase; CR: complete response; DDX41: aspartate-glutamate-alanine-aspartate-box helicase 41; GBP1: guanylate binding protein 1; IM: invasive margin; KRAS: kirsten rat sarcoma viral oncogene homolog; mTRG: modified tumor regression grading; mut: mutant; MxA: interferon-induced guanosine triphosphate-binding protein MxA; OR: optimal response; p-eIF2α: phosphorylated-eukaryotic translation initiation factor 2 alpha; p-PKR: phosphorylated-protein kinase R; PD: progressive disease; PR: partial response, partial remission; RIG-I: retinoic acid inducible gene I; SD: stable disease; STING: stimulator of interferon genes; TRG: tumor regression grading; TU: tumor area; wt: wild-type; γH2AX: phosphorylated-histone H2AX
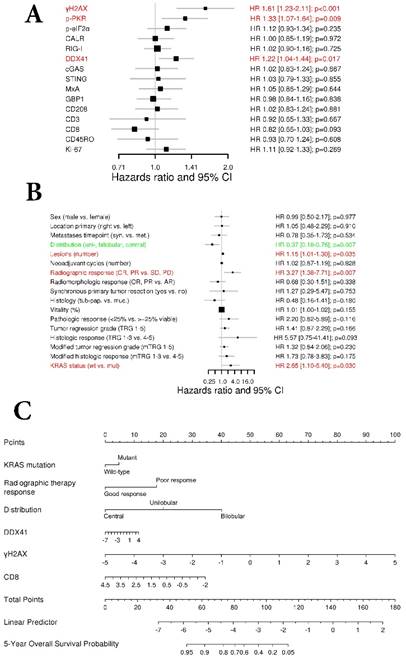
With respect to the clinical characteristics and their impact on OS, a univariate Cox regression analysis revealed that metastases distribution (HR 0.37, 95% CI 0.18-0.76, p=0.007), number of metastases (HR 1.15, 95% CI 1.01-1.30, p=0.035), radiographic therapy response (HR 3.27, 95% CI 1.38-7.71, p=0.007) and KRAS status (HR 2.65, 95% CI 1.10-6.40, p=0.03) had a statistically significant association with OS (Fig. 3B).
Next, we performed an adaptive elastic‑net model for the marker panel and the clinical characteristics together, as described above. The analysis revealed a model, which included the markers γH2AX, CD8 and DDX41, as well as the clinical variables such as metastases distribution, radiographic therapy response and KRAS status, which all together contributed statistical significance to the 5-year OS probability (Figure 3C). Again, γH2AX was the strongest molecular parameter, which had a negative impact on OS. The model was further bootstrap-validated over time, which revealed a stable median AUC of ~0.9 (Figure 3D). On the basis of the statistically significant model, patients were further dichotomized into high-risk and low-risk groups, which revealed a significant different OS probability between the two groups (p<0.001; Figure 3E).
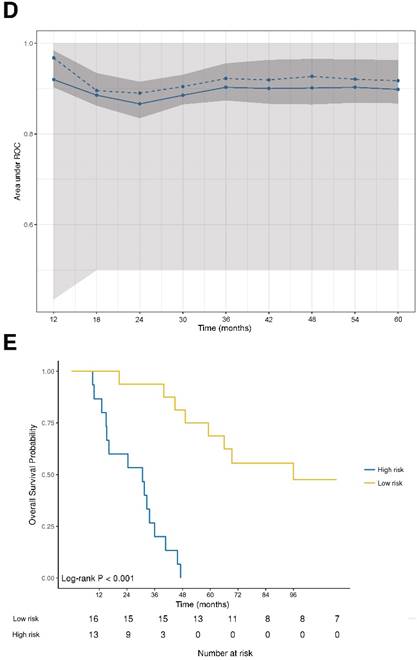
ER stress response correlates with a functional type II IFN system and cytotoxic T cell infiltration
In order to investigate the biological relationship between the different markers of our marker panel, we generated a correlogram (Figure 4). Strikingly, ER stress response (CALR) was positively correlated with a functional type II IFN system, represented by the expression of GBP1 (r=0.67, FDR<0.001), CTLs (CD8; r=0.54, FDR=0.015) and the DNA sensors cGAS (r=0.48, FDR=0.005). A functional type II IFN system (GBP1) was further positively correlated with memory T cells (CD45RO; r=0.46, FDR=0.04) and the DNA sensor cGAS (r=0.47, FDR=0.012). Pan T cells (CD3) were positively correlated with cytotoxic T cells (CD8; r=0.56, FDR=0.001). The RNA sensor RIG-I showed a positive correlation with a higher cell proliferation index, represented by Ki‑67 (r=0.39, FDR=0.047).
ER stress response correlates with a functional type II IFN system. A correlogram of marker panel values is shown. Pearson's correlation coefficients (r) for all markers are given in the lower triangle. Colored circles indicate statistically significant correlations, corrected according to the false discovery rate (FDR<0.05). Size and color intensity of the circles are related to the correlation coefficients. Blue color represents positive and red color negative correlations. CALR: calreticulin; CD: cluster of differentiation; cGAS: cyclic guanosine monophosphate‑adenosine monophosphate synthase; DDX41: aspartate-glutamate-alanine-aspartate-box helicase 41; GBP1: guanylate binding protein 1; MxA: interferon-induced guanosine triphosphate-binding protein MxA; p-eIF2α: phosphorylated-eukaryotic translation initiation factor 2 alpha; p-PKR: phosphorylated-protein kinase R; RIG-I: retinoic acid inducible gene I; STING: stimulator of interferon genes; γH2AX: phosphorylated-histone H2AX
DNA sensors DDX41, STING and p-PKR predict radiographic therapy response
Next, we investigated the association of our marker panel with radiographic as well as radiomorphologic therapy response (Figure S4A-C). Patients were dichotomized into good responder (CR, PR and OR, PR, respectively) and poor responder (SD, PD and AR, respectively).
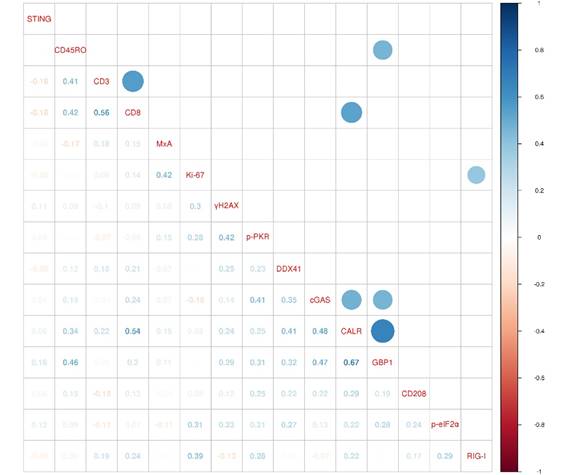
We conducted a univariate analysis between good and poor responders, which revealed the DNA sensor DDX41 as the only statistically significant marker associated with radiographic therapy response (p=0.013; Figure 5A). With respect to radiomorphologic response, there was a statistically significant association seen between γH2AX and good or poor response (p=0.043; Figure S5A).
DNA sensors DDX41, STING and p-PKR predict radiographic therapy response. Comparison of the marker panel between good and poor (A) radiographic and (D) pathologic responders is indicated by box-and-whisker plots, containing the individual values (Mann-Whitney U test). The bold horizontal line represents the median, the top and bottom of the box illustrate the first and third quartiles, and the whisker represent 1.5 times the interquartile range (IQR). Multivariable logistic regression model (LASSO) for the prediction of (B) radiographic and (E) pathologic response is illustrated by a receiver operating characteristic (ROC) curve. False positive rate (FPR) is specified at the abscissa and true positive rate (TPR) at the left ordinate. The ROC curve is color-coded according to the threshold values defined on the right ordinate. The black 45° line represents the line of identity. Area under the curve (AUC) and corresponding p-values are indicated. Comparison of the multivariate logistic regression model between good and poor (C) radiographic and (F) pathologic responders. CALR: calreticulin; CD: cluster of differentiation; cGAS: cyclic guanosine monophosphate‑adenosine monophosphate synthase; DDX41: aspartate-glutamate-alanine-aspartate-box helicase 41; GBP1: guanylate binding protein 1; MxA: interferon-induced guanosine triphosphate-binding protein MxA; p-eIF2α: phosphorylated-eukaryotic translation initiation factor 2 alpha; p-PKR: phosphorylated-protein kinase R; RIG-I: retinoic acid inducible gene I; STING: stimulator of interferon genes; γH2AX: phosphorylated-histone H2AX
We further generated a multivariable logistic regression model, using a LASSO approach. The statistically significant model, which predicted radiographic therapy response, was comprised of the markers DDX41, STING and p-PKR, (AUC=0.785, p=0.002; Figure 5B). The coefficients of DDX41 and p-PKR comparted a negative impact to STING, which was positively associated with radiographic therapy response (Figure 5C). Of note, within a multivariable logistic regression model for radiomorphologic response, γH2AX remained the only statistically significant associated marker, which had a negative impact on treatment response (AUC=0.712, p=0.022; Figure 5B-C).
DNA damage, DNA sensors DDX41 and cGAS, ER stress, DCs and memory T cells predict pathologic therapy response
We examined the association of our marker panel with pathologic, histologic as well as with modified histologic therapy response (Figure S4D-E). Patients were dichotomized into good responders (0-25% viable, TGR 1-3 and mTRG 1-3, respectively) and poor responders (≥25% viable, TRG 4-5 and mTRG 4-5, respectively).
A univariate analysis between good and poor responder revealed a statistically significant correlation between cGAS and pathologic therapy response, as well as between p‑eIF2α and CD208 and modified histologic therapy response (p=0.014, p=0.016 and p=0.035 respectively; Figure 5D and Figure S6D). Regarding the evaluation of histologic therapy response, there was no association between any marker and good or poor response (Figure S6A).
Next, we performed a multivariable logistic regression analysis, using a LASSO approach. The model contributing statistical significance to the prediction of pathologic therapy response comprised the markers γH2AX, DDX41, cGAS, p‑eIF2α, CD208 and CD45RO (AUC=0.944, p<0.001; Figure 5E). Within this model the individual coefficients of γH2AX, DDX41, p‑eIF2α, CD208 and CD45RO had a negative impact compared to cGAS, which was positively associated with pathologic therapy response (Figure 5F).
In contrast, a multivariable evaluation of histologic therapy response revealed no association between any marker and response to therapy (Figure S6B-C). However, multivariable analysis for modified histologic therapy response revealed a statistically significant model, which comprised the markers cGAS, p‑eIF2α, MxA, GBP1 and CD208 (AUC=0.926, p<0.001; Figure S6E). The individual coefficients of cGAS and GBP1 were positively associated with modified histologic response compared to p‑eIF2α, MxA and CD208, which were negatively associated (Figure S6F).
DNA damage, ER stress response and DNA sensor DDX41 are associated with therapy response and clinical outcome
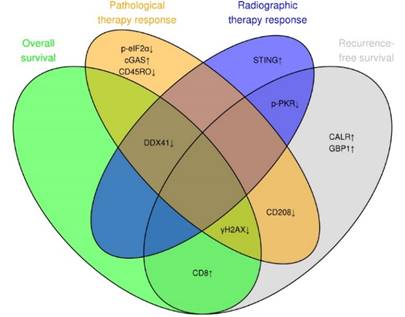
We summarized the contribution of each individual marker to one of the two prognostics (RFS and OS) and predictive (radiographic and pathologic therapy response) models in a Venn diagram (Figure 6). This summary highlights the role of DNA damage (γH2AX), ER stress response (CALR) and the DNA sensor DDX41, which contributed the most to the preoperative evaluation of radiographic therapy response, RFS and postoperative evaluation of pathologic therapy response.
DNA damage, ER stress response and DNA sensor DDX41 are associated with therapy response and clinical outcome. Venn diagram illustrating the overlap between the marker panel and the four different multivariable models (RFS, OS, radiographic and pathologic response). Arrows indicate positive or negative coefficients for each marker. The coefficients of all markers pointed in the same direction (positive or negative) within the four different multivariable models.
Discussion
Recent murine data gave evidence that the initiation of a so called bona fide ICD depends on the release of danger signals, such as DNA damage [45-48], which gets sensed in part by the cGAS-STING pathway [26, 49, 50], following the induction of a type I IFN response [15, 18], which links the innate and adaptive immune system and thereby supports an anti‑tumor immune response.
In contrast to murine data, we found in our clinical dataset that DNA damage (γH2AX) is negatively associated with RFS, OS and pathologic therapy response. DNA damage has an inverse impact on the clinical outcome compared to CTL (CD8) infiltration, as well as ER stress response (CALR). Correspondingly, the DNA sensor DDX41 is associated with a shorter OS, as well as poor radiographic and pathologic therapy response. The negative prognostic and predictive role of DNA damage can be explained by its dual role, which on one hand promotes an ICD, while on the other hand facilitates the assembly of DNA repair proteins, which favors tumor cell survival [51, 52]. In line with the latter role, a recent study demonstrated that the expression of DNA damage at the time of diagnosis predicts poor treatment response to chemotherapy in breast cancer patients [53]. Moreover, DNA damage has been reported as an inducer of tumorigenicity and stemness in patient-derived glioma cells [54]. The negative impact of γH2AX on RFS and OS suggests that patients with CLM, which develop high amounts of DNA damage, render a “high-risk” group of patients throughout the course of the disease.
The DNA sensor DDX41, which is upstream of the STING pathway, also has a dual role in tumorigenesis [55]. On one hand, DDX41 serves as a tumor suppressor in hematological malignances, while in solid tumors DDX41 has been reported as a tumor promotor. Here, we strengthen DDX41 as a negative prognosticator for OS and negative predictor for radiographic and pathologic therapy response.
Our findings indicate that STING and cGAS induction positively correlate with response to therapy, but this induction is not associated with activation of the type I IFN pathway (MxA) or DNA damage, as the later negatively correlates with therapy response. However, DNA damage appears to mediate a stress response, as observed by the negative impact of up-regulated p‑PKR and p-eIF2α. This suggests that part of the ER stress response is involved in the negative impact of DNA damage on therapeutic unresponsiveness.
The differences seen in our clinical observations compared to murine studies, which describe an immunostimulatory effect of DNA damage, might be explained by the fact that DNA damage was rather shortly induced before the analysis [27]. In contrast, in our clinical setting, neoadjuvant therapy was usually finished four weeks before liver resection. Thus, we propose that the protein expression pattern observed in our CLM is derived from spontaneously occurring endogenous stimuli, rather than from exogenously induced DNA damage by chemotherapy.
The multivariable analysis depicted in the nomogram reveals that the negative association of γH2AX has a bigger impact on OS compared to the positive association of CTLs (CD8). Similarly, γH2AX has a higher influence on RFS than CTLs (CD8). Previously, tumor-infiltrating immune cells were considered as the strongest prognostic parameter in primary CRC as well as CLM [9, 56]. Our multivariable analysis now indicates that DNA damage is even more relevant for prognosis than tumor-infiltrating immune cells in our dataset. This finding highlights the impact of DNA damage for disease progression and calls for its further understanding as a prognostic marker and as a potential therapeutic target in a clinical setting.
Furthermore, we demonstrate the prognostic relevance of so called “eat-me” signals such as CALR [47] in CLM, which has been shown previously in treatment-naïve primary CRC [57, 58]. The exposure of CALR correlated with a functional type II IFN system (GBP1), CTLs (CD8) and the expression of the DNA sensor cGAS. Additionally, in regards of RFS, CTLs (CD8) are associated with the activation of ER stress response (CALR) and a functional type II IFN system (GBP1) but not with the type I IFN pathway (MxA).
Taken together, translating data from murine models to a clinically applied human setting suggests a key role of DNA damage and sensing, as well as a bona fide ICD on the clinical outcome during the course of CLM. Surprisingly, those interactions were already significant on a very limited number of patients, suggesting a high biological impact. Certainly, those findings should be further verified in a larger cohort, as well as in different disease stages and cancer types. In this line, a recently developed positron-emission tomography (PET) imaging agent directed against γH2AX could serve as an attractive approach to monitor current treatment response and clinical outcome [59].
Abbreviations
APCs: antigen-presenting cells; AR: absent response; AUC: area under the receiver operating characteristic curve; BRAF: V‑raf murine sarcoma viral oncogene homolog B1; CALR: calreticulin; CD: cluster of differentiation; CDNs: cyclic dinucleotides; cGAS: cyclic guanosine monophosphate‑adenosine monophosphate synthase; CI: confidence interval; CLM: colorectal liver metastases; CR: complete response; CRC: colorectal cancer; CT: computed tomography; CTLs: cytotoxic T lymphocytes; DAMPs: damage-associated molecular patterns; DCs: dendritic cells; DDX41: aspartate-glutamate-alanine-aspartate-box helicase 41; DFS: disease-free survival; DNA: deoxyribonucleic acid; dNTPs: deoxynucleotides; dsRNA: double-stranded ribonucleic acid; EDTA: ethylenediaminetetraacetic acid; p-eIF2α: phosphorylated-eukaryotic translation initiation factor 2 alpha; ER: endoplasmic reticulum; FDR: false discovery rate; FFPE: formalin-fixed paraffin-embedded; FOLFIRI: folinic acid, fluorouracil, irinotecan; FOLFOX: folinic acid, fluorouracil, oxaliplatin; FPR: false positive rate; GBP1: guanylate binding protein 1; H&E: hematoxylin and eosin; HIER: heat-induced epitope retrieval; HR: hazard ratio; ICD: immunogenic cell death; IFN: interferon; IHC: immunohistochemistry; ILN: infarct-like necrosis; IM: invasive margin; IQR: interquartile range; KRAS: kirsten rat sarcoma viral oncogene homolog; LASSO: least absolute shrinkage and selection operator; MLH1: MutL homolog 1; MMR: Mismatch repair; MRI: magnetic resonance imaging; MSH2: MutS protein homolog 2; mTRG: modified tumor regression grading; mut: mutant; Mx1: interferon-induced guanosine triphosphate-binding protein Mx1; OR: optimal response; OS: overall survival; PBS: phosphate-buffered saline; PCA: principal component analysis; PCR: polymerase chain reaction; PD: progressive disease; PET: positron-emission tomography; p-PKR: phosphorylated-protein kinase R; PR: partial response; RECIST: response evaluation criteria in solid tumors; REMARK: reporting recommendations for tumor marker prognostic studies; RFS: recurrence-free survival; RIG-I: retinoic acid inducible gene I; RT: room temperature; SAP: shrimp alkaline phosphatase; SD: stable disease; STING: stimulator of interferon genes; TAAs: tumor-associated antigens; Th1: T helper type 1; TME: tumor microenvironment; TOMOX: raltitrexed, oxaliplatin; TPR: true positive rate; TRG: tumor regression grading; TU: tumor; UN: usual necrosis; VEGF-A: vascular endothelial growth factor-A; wt: wild-type; XELIRI: capecitabine, irinotecan; XELOX: capecitabine, oxaliplatin; γH2AX: phosphorylated-histone H2AX.
Supplementary Material
Supplementary figures and tables.
Acknowledgements
Our special thanks go to Anna Obenauf (Research Institute of Molecular Pathology, Vienna, Austria) for her critical review and proofreading of the manuscript, as well as to Benjamin Loinger for drawing the graphical abstract. Furthermore, we would like to thank Lea Hunter for drawing the vector graphics, Marion Groeger (Core Facility Imaging, Medical University of Vienna, Vienna, Austria) for her expert help with the TissueFAXS scans and Margit Schmeidl (Department of Pathology, Medical University of Vienna, Vienna, Austria) for her excellent help with the tissue cutting. StrataQuest analysis was kindly supported by Robert Nica (TissueGnostics, Vienna, Austria).
This study was in part supported by the Ludwig Boltzmann Institute Applied Diagnostics (lbi:ad), the Medical-Scientific Fund of the Mayor of Vienna (no. 15071), as well as funds of the Medical University of Vienna. In addition, a personal research funding of the Fellinger Cancer Research and a personal research scholarship of the Medical University of Vienna was granted to J.L. to support this study.
Author contributions
J.L. and M.B. designed the study. J.S. provided histological samples. J.L., A.B. and B.H. performed immunohistochemistry. J.L. scanned and analyzed whole-slide tumor tissue. J.L., M.B., P.S. and S.S. provided clinical data and patient characteristics. D.T. and J.L. evaluated radiographic therapy response. J.S., J.L. and A.B. assessed pathologic therapy response. B.W. performed the mutation analysis. J.S. investigated the microsatellite status. D.P. and J.L. did the bioinformatics and performed the statistics. J.L., M.B, and D.P. analyzed and interpreted the results. J.L. wrote the manuscript. J.L., M.B. and D.P. edited the manuscript. M.B. supervised the study. All authors read and approved the final version of the manuscript.
Ethics statement
This study was conducted in accordance with the latest “Declaration of Helsinki” and “Good Scientific Practice Guidelines of the Medical University of Vienna”. Furthermore, the study protocol was verified by the “Ethics Committee of the Medical University of Vienna” (#1374/2014). Due to the retrospective nature of this study no informed consent was made.
Competing Interests
The authors have declared that no competing interest exists.
References
1. Desch CE, Benson AB 3rd, Somerfield MR, Flynn PJ, Krause C, Loprinzi CL. et al. Colorectal cancer surveillance: 2005 update of an american society of clinical oncology practice guideline. J Clin Oncol. 2005;23:8512-9
2. Cummings LC, Payes JD, Cooper GS. Survival after hepatic resection in metastatic colorectal cancer: A population-based study. Cancer. 2007;109:718-26
3. Fong Y, Fortner J, Sun RL, Brennan MF, Blumgart LH. Clinical score for predicting recurrence after hepatic resection for metastatic colorectal cancer: Analysis of 1001 consecutive cases. Ann Surg. 1999;230:309-18 discussion 18-21
4. Leporrier J, Maurel J, Chiche L, Bara S, Segol P, Launoy G. A population-based study of the incidence, management and prognosis of hepatic metastases from colorectal cancer. Br J Surg. 2006;93:465-74
5. Fridman WH, Pages F, Sautes-Fridman C, Galon J. The immune contexture in human tumours: Impact on clinical outcome. Nat Rev Cancer. 2012;12:298-306
6. Anitei MG, Zeitoun G, Mlecnik B, Marliot F, Haicheur N, Todosi AM. et al. Prognostic and predictive values of the immunoscore in patients with rectal cancer. Clin Cancer Res. 2014;20:1891-9
7. Galon J, Costes A, Sanchez-Cabo F, Kirilovsky A, Mlecnik B, Lagorce-Pages C. et al. Type, density, and location of immune cells within human colorectal tumors predict clinical outcome. Science. 2006;313:1960-4
8. Koelzer VH, Lugli A, Dawson H, Hadrich M, Berger MD, Borner M. et al. Cd8/cd45ro t-cell infiltration in endoscopic biopsies of colorectal cancer predicts nodal metastasis and survival. J Transl Med. 2014;12:81
9. Mlecnik B, Tosolini M, Kirilovsky A, Berger A, Bindea G, Meatchi T. et al. Histopathologic-based prognostic factors of colorectal cancers are associated with the state of the local immune reaction. J Clin Oncol. 2011;29:610-8
10. Pages F, Berger A, Camus M, Sanchez-Cabo F, Costes A, Molidor R. et al. Effector memory t cells, early metastasis, and survival in colorectal cancer. N Engl J Med. 2005;353:2654-66
11. Pages F, Galon J, Dieu-Nosjean MC, Tartour E, Sautes-Fridman C, Fridman WH. Immune infiltration in human tumors: A prognostic factor that should not be ignored. Oncogene. 2010;29:1093-102
12. Pages F, Kirilovsky A, Mlecnik B, Asslaber M, Tosolini M, Bindea G. et al. In situ cytotoxic and memory t cells predict outcome in patients with early-stage colorectal cancer. J Clin Oncol. 2009;27:5944-51
13. Fuertes MB, Woo SR, Burnett B, Fu YX, Gajewski TF. Type i interferon response and innate immune sensing of cancer. Trends Immunol. 2013;34:67-73
14. Hervas-Stubbs S, Perez-Gracia JL, Rouzaut A, Sanmamed MF, Le Bon A, Melero I. Direct effects of type i interferons on cells of the immune system. Clin Cancer Res. 2011;17:2619-27
15. Zitvogel L, Galluzzi L, Kepp O, Smyth MJ, Kroemer G. Type i interferons in anticancer immunity. Nat Rev Immunol. 2015;15:405-14
16. Broz ML, Binnewies M, Boldajipour B, Nelson AE, Pollack JL, Erle DJ. et al. Dissecting the tumor myeloid compartment reveals rare activating antigen-presenting cells critical for t cell immunity. Cancer Cell. 2014;26:638-52
17. Diamond MS, Kinder M, Matsushita H, Mashayekhi M, Dunn GP, Archambault JM. et al. Type i interferon is selectively required by dendritic cells for immune rejection of tumors. J Exp Med. 2011;208:1989-2003
18. Fuertes MB, Kacha AK, Kline J, Woo SR, Kranz DM, Murphy KM. et al. Host type i ifn signals are required for antitumor cd8+ t cell responses through cd8{alpha}+ dendritic cells. J Exp Med. 2011;208:2005-16
19. Lorenzi S, Mattei F, Sistigu A, Bracci L, Spadaro F, Sanchez M. et al. Type i ifns control antigen retention and survival of cd8alpha(+) dendritic cells after uptake of tumor apoptotic cells leading to cross-priming. J Immunol. 2011;186:5142-50
20. Ruffell B, Chang-Strachan D, Chan V, Rosenbusch A, Ho CM, Pryer N. et al. Macrophage il-10 blocks cd8+ t cell-dependent responses to chemotherapy by suppressing il-12 expression in intratumoral dendritic cells. Cancer Cell. 2014;26:623-37
21. Sistigu A, Yamazaki T, Vacchelli E, Chaba K, Enot DP, Adam J. et al. Cancer cell-autonomous contribution of type i interferon signaling to the efficacy of chemotherapy. Nat Med. 2014;20:1301-9
22. Klarquist J, Hennies CM, Lehn MA, Reboulet RA, Feau S, Janssen EM. Sting-mediated DNA sensing promotes antitumor and autoimmune responses to dying cells. J Immunol. 2014;193:6124-34
23. Woo SR, Fuertes MB, Corrales L, Spranger S, Furdyna MJ, Leung MY. et al. Sting-dependent cytosolic DNA sensing mediates innate immune recognition of immunogenic tumors. Immunity. 2014;41:830-42
24. Barber GN. Sting-dependent cytosolic DNA sensing pathways. Trends Immunol. 2014;35:88-93
25. Burdette DL, Monroe KM, Sotelo-Troha K, Iwig JS, Eckert B, Hyodo M. et al. Sting is a direct innate immune sensor of cyclic di-gmp. Nature. 2011;478:515-8
26. Cai X, Chiu YH, Chen ZJ. The cgas-cgamp-sting pathway of cytosolic DNA sensing and signaling. Mol Cell. 2014;54:289-96
27. Deng L, Liang H, Xu M, Yang X, Burnette B, Arina A. et al. Sting-dependent cytosolic DNA sensing promotes radiation-induced type i interferon-dependent antitumor immunity in immunogenic tumors. Immunity. 2014;41:843-52
28. Obeid M, Tesniere A, Ghiringhelli F, Fimia GM, Apetoh L, Perfettini JL. et al. Calreticulin exposure dictates the immunogenicity of cancer cell death. Nat Med. 2007;13:54-61
29. Grenz S, Naschberger E, Merkel S, Britzen-Laurent N, Schaal U, Konrad A. et al. Ifn-gamma-driven intratumoral microenvironment exhibits superior prognostic effect compared with an ifn-alpha-driven microenvironment in patients with colon carcinoma. Am J Pathol. 2013;183:1897-909
30. Klampfer L, Huang J, Corner G, Mariadason J, Arango D, Sasazuki T. et al. Oncogenic ki-ras inhibits the expression of interferon-responsive genes through inhibition of stat1 and stat2 expression. J Biol Chem. 2003;278:46278-87
31. Schemper M, Smith TL. A note on quantifying follow-up in studies of failure time. Control Clin Trials. 1996;17:343-6
32. McShane LM, Altman DG, Sauerbrei W, Taube SE, Gion M, Clark GM. Reporting recommendations for tumor marker prognostic studies (remark). Breast Cancer Res Treat. 2006;100:229-35
33. Eisenhauer EA, Therasse P, Bogaerts J, Schwartz LH, Sargent D, Ford R. et al. New response evaluation criteria in solid tumours: Revised recist guideline (version 1.1). Eur J Cancer. 2009;45:228-47
34. Boonsirikamchai P, Asran MA, Maru DM, Vauthey JN, Kaur H, Kopetz S. et al. Ct findings of response and recurrence, independent of change in tumor size, in colorectal liver metastasis treated with bevacizumab. AJR Am J Roentgenol. 2011;197:W1060-6
35. Chun YS, Vauthey JN, Boonsirikamchai P, Maru DM, Kopetz S, Palavecino M. et al. Association of computed tomography morphologic criteria with pathologic response and survival in patients treated with bevacizumab for colorectal liver metastases. JAMA. 2009;302:2338-44
36. Shindoh J, Loyer EM, Kopetz S, Boonsirikamchai P, Maru DM, Chun YS. et al. Optimal morphologic response to preoperative chemotherapy: An alternate outcome end point before resection of hepatic colorectal metastases. J Clin Oncol. 2012;30:4566-72
37. Chang HH, Leeper WR, Chan G, Quan D, Driman DK. Infarct-like necrosis: A distinct form of necrosis seen in colorectal carcinoma liver metastases treated with perioperative chemotherapy. Am J Surg Pathol. 2012;36:570-6
38. Rubbia-Brandt L, Giostra E, Brezault C, Roth AD, Andres A, Audard V. et al. Importance of histological tumor response assessment in predicting the outcome in patients with colorectal liver metastases treated with neo-adjuvant chemotherapy followed by liver surgery. Ann Oncol. 2007;18:299-304
39. Loupakis F, Schirripa M, Caparello C, Funel N, Pollina L, Vasile E. et al. Histopathologic evaluation of liver metastases from colorectal cancer in patients treated with folfoxiri plus bevacizumab. Br J Cancer. 2013;108:2549-56
40. Stremitzer S, Stift J, Gruenberger B, Tamandl D, Aschacher T, Wolf B. et al. Kras status and outcome of liver resection after neoadjuvant chemotherapy including bevacizumab. Br J Surg. 2012;99:1575-82
41. Lanza G, Gafa R, Maestri I, Santini A, Matteuzzi M, Cavazzini L. Immunohistochemical pattern of mlh1/msh2 expression is related to clinical and pathological features in colorectal adenocarcinomas with microsatellite instability. Mod Pathol. 2002;15:741-9
42. Lanza G, Gafa R, Santini A, Maestri I, Guerzoni L, Cavazzini L. Immunohistochemical test for mlh1 and msh2 expression predicts clinical outcome in stage ii and iii colorectal cancer patients. J Clin Oncol. 2006;24:2359-67
43. Team RC. R: A language and environment for statistical computing. Vienna, Austria: R Foundation for Statistical Computing. 2017
44. Benjamini Y, Hochberg Y. Controlling the false discovery rate: A practical and powerful approach to multiple testing. J R Stat Soc Series B Stat Methodol. 1995;57:289-300
45. Galluzzi L, Buque A, Kepp O, Zitvogel L, Kroemer G. Immunogenic cell death in cancer and infectious disease. Nat Rev Immunol. 2017;17:97-111
46. Mouw KW, Goldberg MS, Konstantinopoulos PA, D'Andrea AD. DNA damage and repair biomarkers of immunotherapy response. Cancer Discov. 2017;7:675-93
47. Rufo N, Garg AD, Agostinis P. The unfolded protein response in immunogenic cell death and cancer immunotherapy. Trends Cancer. 2017;3:643-58
48. Yatim N, Cullen S, Albert ML. Dying cells actively regulate adaptive immune responses. Nat Rev Immunol. 2017;17:262-75
49. Chatzinikolaou G, Karakasilioti I, Garinis GA. DNA damage and innate immunity: Links and trade-offs. Trends Immunol. 2014;35:429-35
50. Paludan SR, Bowie AG. Immune sensing of DNA. Immunity. 2013;38:870-80
51. Bonner WM, Redon CE, Dickey JS, Nakamura AJ, Sedelnikova OA, Solier S. et al. Γh2ax and cancer. Nat Rev Cancer. 2008;8:957-67
52. Roos WP, Thomas AD, Kaina B. DNA damage and the balance between survival and death in cancer biology. Nat Rev Cancer. 2016;16:20-33
53. Yang SX, Polley EC, Nguyen D. Association of γh2ax at diagnosis with chemotherapy outcome in patients with breast cancer. Theranostics. 2017;7:945-51
54. Liu X, Li F, Huang Q, Zhang Z, Zhou L, Deng Y. et al. Self-inflicted DNA double-strand breaks sustain tumorigenicity and stemness of cancer cells. Cell Res. 2017;27:764-83
55. He L, Xiao X, Yang X, Zhang Z, Wu L, Liu Z. Sting signaling in tumorigenesis and cancer therapy: A friend or foe? Cancer Lett. 2017;402:203-12
56. Mlecnik B, Van den Eynde M, Bindea G, Church SE, Vasaturo A, Fredriksen T. et al. Comprehensive intrametastatic immune quantification and major impact of immunoscore on survival. J Natl Cancer Inst. 2018;110:1-12
57. Peng R-Q. Expression of calreticulin is associated with infiltration of t-cells in stage iiib colon cancer. World J Gastroenterol. 2010;16:2428-34
58. Stoll G, Iribarren K, Michels J, Leary A, Zitvogel L, Cremer I. et al. Calreticulin expression: Interaction with the immune infiltrate and impact on survival in patients with ovarian and non-small cell lung cancer. Oncoimmunology. 2016;5:e1177692
59. Knight JC, Mosley MJ, Bravo LC, Kersemans V, Allen PD, Mukherjee S. et al. (89)zr-anti-γh2ax-tat but not (18)f-fdg allows early monitoring of response to chemotherapy in a mouse model of pancreatic ductal adenocarcinoma. Clin Cancer Res. 2017;23:6498-504
Author contact
![]() Corresponding authors: Dietmar Pils; Email: dietmar.pilsac.at; Phone: +43 1 40400 22070; Fax: +43 1 40400 66740; Michael Bergmann; Email: michael.bergmannac.at; Phone: +43 1 40400 73744; Fax: +43 1 40400 73593
Corresponding authors: Dietmar Pils; Email: dietmar.pilsac.at; Phone: +43 1 40400 22070; Fax: +43 1 40400 66740; Michael Bergmann; Email: michael.bergmannac.at; Phone: +43 1 40400 73744; Fax: +43 1 40400 73593