Impact Factor
- Issue 14; 2026
- Issue 13; 2026
- Issue 12; 2026
- Issue 11; 2026
- Issue 10; 2026
- Volume 16; 2026
- Advance Articles
- Past Issues
- Cover Images
- Cover Suggestion
- Index & Coverage
- Special Issues
Introduction
Methods
Results
Discussion
Abbreviations
Supplementary Material
Acknowledgements
References
International Journal of Biological Sciences
International Journal of Medical Sciences
 Global reach, higher impact

Theranostics 2018; 8(11):3074-3086. doi:10.7150/thno.24281 This issue Cite
Research Paper
MMP1/PAR1/SP/NK1R paracrine loop modulates early perineural invasion of pancreatic cancer cells
Chumei Huang1,2,3,#, Yaqing Li1,2,#, Yubo Guo1,4,#, Zuoquan Zhang5,#, Guoda Lian1,2,#, Yinting Chen1,2, Jian Li6, Yonghui Su7, Jiajia Li1,2, Kege Yang1,2, Shaojie Chen1,2, Hong Su 1,2, Kaihong Huang1,2, ![]() , Linjuan Zeng8,
, Linjuan Zeng8, ![]()
1. Department of Gastroenterology, Sun Yat-sen Memorial Hospital, Sun Yat-sen University, Guangzhou 510120, China
2. Guangdong Provincial Key Laboratory of Malignant Tumor Epigenetics and Gene Regulation, Sun Yat-sen Memorial Hospital, Sun Yat-sen University, Guangzhou 510120, China
3. Department of Gastroenterology, The Seventh Affiliated Hospital of Sun Yat-sen University, Shenzhen 518100, China
4. Department of Gastroenterology, Zhu Hai People's Hospital, JiNan University, Zhuhai 519000, China
5. Department of Radiology, The Fifth Affiliated Hospital of Sun Yat-sen University, Zhuhai 519000, China
6. Department of Hepatobiliary Surgery, The Fifth Affiliated Hospital of Sun Yat-sen University, Zhuhai 519000, China
7. Department of General surgery, The Fifth Affiliated Hospital of Sun Yat-sen University, Zhuhai 519000, China
8. Department of Oncology, The Fifth Affiliated Hospital of Sun Yat-sen University, Zhuhai 519000, China
# These authors contributed equally to this work.
Received 2017-12-9; Accepted 2018-3-27; Published 2018-4-30
Abstract

The molecular mechanism of perineural invasion (PNI) is unclear, and insufficient detection during early-stage PNI in vivo hampers its investigation. We aimed to identify a cytokine paracrine loop between pancreatic ductal adenocarcinoma (PDAC) cells and nerves and established a noninvasive method to monitor PNI in vivo.
Methods: A Matrigel/ dorsal root ganglia (DRG) system was used to observe PNI in vitro, and a murine sciatic nerve invasion model was established to examine PNI in vivo. PNI was assessed by MRI with iron oxide nanoparticle labeling. We searched publicly available datasets as well as obtained PDAC tissues from 30 patients to examine MMP1 expression in human tumor and non-tumor tissues.
Results: Our results showed that matrix metalloproteinase-1 (MMP1) activated AKT and induced protease-activated receptor-1 (PAR1)-expressing DRG to release substance P (SP), which, in turn, activated neurokinin 1 receptor (NK1R)-expressing PDAC cells and enhanced cellular migration, invasion, and PNI via SP/NK1R/ERK. In animals, hind limb paralysis and a decreased hind paw width were observed approximately 20 days after inoculation of cancer cells in the perineurium. MMP1 silencing with shRNA or treatment with either a PAR1 or an NK1R antagonist inhibited PNI. MRI detected PNI as early as 10 days after implantation of PDAC cells. PNI also induced PDAC liver metastasis. Bioinformatic analyses and pathological studies on patient tissues corroborated the clinical relevance of these findings.
Conclusion: In this study, we provided evidence that the MMP1/PAR1/SP/NK1R paracrine loop contributes to PNI during the early stage of primary tumor formation. Furthermore, we established a sensitive and non-invasive method to detect nerve invasion using iron oxide nanoparticles and MRI.
Keywords: perineural invasion, iron oxide nanoparticles, MR imaging, metastasis, pancreatic ductal adenocarcinoma
Introduction
The process by which neoplastic cells invade and migrate through nerves is defined as perineural invasion (PNI). Although PNI was first described in the mid-1800s, not much information on this pathological process was available until recent years. For some malignancies, including pancreatic cancer, PNI is a marker of poor prognosis [1]. The exact mechanism of PNI remains unclear. However, the propensity of a tumor to invade nerves depends on various factors, including the specific properties of cancer cells as well as their interaction with stromal cells and with nerves and/or neural stroma [2-6].
Pancreatic ductal adenocarcinoma (PDAC) is characterized by a dense tumor stroma with large numbers of tumor-associated macrophages (TAMs) [7]. Based on clinical and epidemiological evidence, there is a positive correlation between TAMs density and metastasis in several types of cancers, including PDAC [8, 9]. In our previous study, PNI was identified in 83% of cases and was determined to be related to TAMs density [10]. M2-macrophages are commonly regarded as pro-tumorigenic [11]. Further mechanistic studies have revealed that TAMs promote cancer progression and metastasis by releasing activators or by inducing cancer cells to release a variety of cytokines, including chemokines, inflammatory factors, and growth factors [12, 13].
Among the important factors involved in TAMs-promoted tumor progression, matrix metalloproteinases (MMPs), especially MMP-2 and MMP-9, are believed to be crucial for collagen degradation and enhance cancer cell adhesion to the extracellular matrix in the tumor stroma [14, 15]. Notably, MMP1 has been identified as an agonist against protease-activated receptor 1 (PAR1) [16]. Endothelial PAR1 is a non-tumor cell/non-matrix target of MMP1 produced by carcinoma cells. The activation of endothelial PAR1 by MMP1 enhanced endothelial permeability resulting in transendothelial migration [17]. Neuronal PAR1 is associated with plasma extravasation by a neurogenic mechanism. When neuronal PAR1 is activated by agonists (i.e., thrombin), sensory nerves release substance P (SP), which activates endothelial neurokinin 1 receptor (NK1R) to induce plasma extravasation [18]. As a PAR1 agonist similar to thrombin, whether MMP1 can induce dorsal root ganglia (DRG)-releasing SP is unclear. SP is an undecapeptide released from primary sensory nerve fibers and is widely expressed in the central and peripheral nervous systems [19]. It is overexpressed in both normal and neoplastic cell types including PDAC cell, and plays an important role in cancer cell metastasis [20, 21].
Based on these data, in this study, we investigated the role of MMP1 in PDAC PNI and identified an MMP1/PAR1/SP/NK1R paracrine loop between PDAC cells and nerves both in vitro and in vivo. We found that carcinoma-produced MMP1 activates neuronal PAR1 and induces SP release, activating carcinoma NK1R. Consequently, both the tumor MMP1/neuronal PAR1 axis and the neuronal SP/tumor NK1R axis contribute to carcinoma cell PNI. Furthermore, we labelled PDAC cells with iron oxide nanoparticles (IONPs), an ideal MRI enhancer [22], to assess the onset and distance of nerve invasion by cancer cells using murine sciatic nerve invasion as a modified in vivo model of PNI. Finally, the analysis of MMP1 expression in publicly available datasets and PDAC tissues identified MMP1 as a potential pharmacological target for PDAC therapy.
Methods
Cell lines and mice
Human pancreatic cancer cell lines PANC-1 and MiaPaCa-2 were purchased from the American Type Culture Collection (ATCC) (Manassas, VA, USA). Human monocyte cell line U937 was purchased from the Institute of Biochemistry and Cell Biology, Chinese Academy of Sciences (Shanghai, China). BABL/c nude mice (13 g ± 1 g) were purchased from Sun Yat-Sen University Laboratory Animal Center. All animal experiments were conducted in full compliance with the National Institutes of Health Guide for Care and Use of Laboratory Animals, and were approved by the Animal Care and Use Committee of Sun Yat-Sen University.
TAMs induction and co-culture
U937 cells were treated with PMA (10 ng/mL) and IL-4 (10 ng/mL) for TAMs induction [23]. TAMs were seeded onto a 0.4 μm pore Transwell chamber (Corning Life Sciences, MA, USA) to allow cytokines to cross over without cell-cell contact. PANC-1 and Mia PaCa-2 cells were seeded in 6-well plates and co-cultured with TAMs in 5% CO2 at 37 °C for 24 h. PCR and Western blot assays are described in the supplementary materials, and the sequences of primers and shRNA are shown in Table S1.
Soluble MMP1 production by cancer cells and soluble SP production by DRG
PANC-1 and MIA PaCa-2 cells with/without pre-co-culturing with activated macrophages were reseeded in 6-well plates and cultured in FBS-free DMEM for 48 h. The supernatants were then collected for MMP1 evaluation. DRG isolated from mice were cultured in DMEM or DMEM containing MMP1 (5 nM) in a 96-well plate for 10 min, 30 min, 1 h, 2 h, 4 h and 6 h. The supernatants were then collected for SP evaluation. To observe the inhibitory effect of the PAR1 antagonist and the AKT inhibitor on SP release, DRGs were incubated with SCH79797 (100 μM) and LY294002 (30 μM) for 1 h, followed by the addition of MMP1 for 2 h. The concentrations of MMP1 and SP were measured using an enzyme-linked immunosorbent assay (ELISA) kit (Cusabio Biotech, Wuhan, China).
In vitro co-culture model of nerve invasion
A Matrigel/DRG model was used to observe cancer cell invasion into nerves. This model was first established by Ayala [5] and is frequently used to study the paracrine interaction between neuronal and cancer cells in vitro. Briefly, DRG was implanted beside the cell cluster approximately 800 μm in Matrigel. The Matrigel/DRG system was cultured in DMEM containing 10% FBS in 5% CO2 at 37 °C. The neural invasion index was calculated as the nearest distance of a cancer cell cluster to DRG at d1 divided by the distance at d8 [24].
In vivo model of murine sciatic nerve invasion
The murine sciatic nerve invasion model is one of the most widely used animal models of PNI [25, 26]. BALB/c nude mice were randomly divided into six groups (n = 4) as follows: (i) PANC-1, (ii) PANC-1 + TAMs, (iii) PANC-1 shRNA negative control (shNC) + TAMs, (iv) PANC-1 shMMP1 + TAMs, (v) PANC-1 + TAMs + SCH79797, and (vi) PANC-1 + TAMs + L732,138. The cell mixture (in 3 μL PBS) was microscopically injected into the perineurium using a microliter syringe (Hamilton, 10 μL, 33G). The right sciatic nerves were injected with 3 μL PBS as controls. SCH79797 and L-732,138 were given by intraperitoneal injection every three days and mice in parallel groups were treated with 100 µL PBS.
Sciatic nerve function was measured weekly as previously described [27]. The sciatic nerve score was graded from 4 (normal) to 1 (total paw paralysis). The sciatic nerve function index indicates the distance between the first and fifth toes of the mouse hind limbs (millimeter, mm). At the end of the experiment, mice were sacrificed and sciatic nerves and tumor tissues were isolated, measured and fixed for histological analysis. Areas of 2 mm, 4 mm, and 6 mm distance from the injection site were measured, with the mean value representing the nerve width.
MRI of sciatic nerves
PANC-1 cells were pre-labeled with IONPs (PANC-1IONP). Subsequently, 3×10⁵ PANC-1IONP cells were suspended in 3 μL PBS (with and without 3×10⁴ TAMs). Each mouse was microscopically injected with PANC-1IONP cells under the epineurium at the right sciatic nerve, and PANC-1IONP cells with TAMs were injected in the left side. MRI was carried out at day 0, 3, 7, 10, 17, 20, and 24 (n=4). MRI was performed on a 3.0 T imaging system MAGNETOM Verio (Siemenz Medical System, Erlangen, Germany) with 40 mm loop coils. T2-weighted images (T2WI) parallel to the sciatic nerve were acquired using a two-dimensional turbo spin echo sequence (repetition time 2700 ms, echo time 70 ms, field of view 37 mm × 25 mm, slice thickness 1.0 mm, and flip angle 150°; turbo factor 15, matrix 192 × 138, averages 32). T2*-weighted images (T2*WI) were acquired using a three-dimensional gradient echo sequence (repetition time 13.4 ms, echo time 5.2 ms, field of view 83 mm × 52 mm, slice thickness 0.24 mm, and flip angle 30°; matrix 256 × 243, averages 8). The T2*WI volume data were post-processed on a SyngoViews Workstation and multiple plane reconstruction images, including sagittal and coronal images parallel to the bilateral sciatic nerve, were acquired as minimum-intensity projection (MIP) images.
Dataset information and tissue sample and data collection of PDACs
The GSE28735 dataset (http://www.ncbi.nlm.nih.gov/geo/), which integrates a variety of gene data for 45 pairs of PDAC tissues and adjacent non-tumor tissues, was used to analyze differences in the mRNA expression of MMP1 between PDAC and adjacent non-tumor tissues. In total, 30 PDAC samples were obtained from 11 men and 19 women (median age 56 years, range 28-83 years) at Sun Yat-sen Memorial Hospital from September 2004 to December 2011. The study was approved by the Hospital Research Ethics Committee. The grading of MMP1 staining in human tissue was described detailly in the supplementary material. The H&E and S-100 immunohistochemistry staining (DAKO, prediluted) was used to diagnose PNI in human tissues. The methodology of PNI staining and diagnosis was described in our previous study [10].
Statistical analyses
All statistical analyses were performed using SPSS software, version 17.0. Spearman test was used for correlation analyses. One-way analysis of variance (ANOVA) was used for statistical analysis in multiple subgroups, and the significant difference was determined by Bonferroni method. P < 0.05 was considered statistically significant. Results are reported as mean ± standard deviation (SD). Error bars in figures represent SD.
Results
TAMs enhanced the migration and PNI of PDAC cells
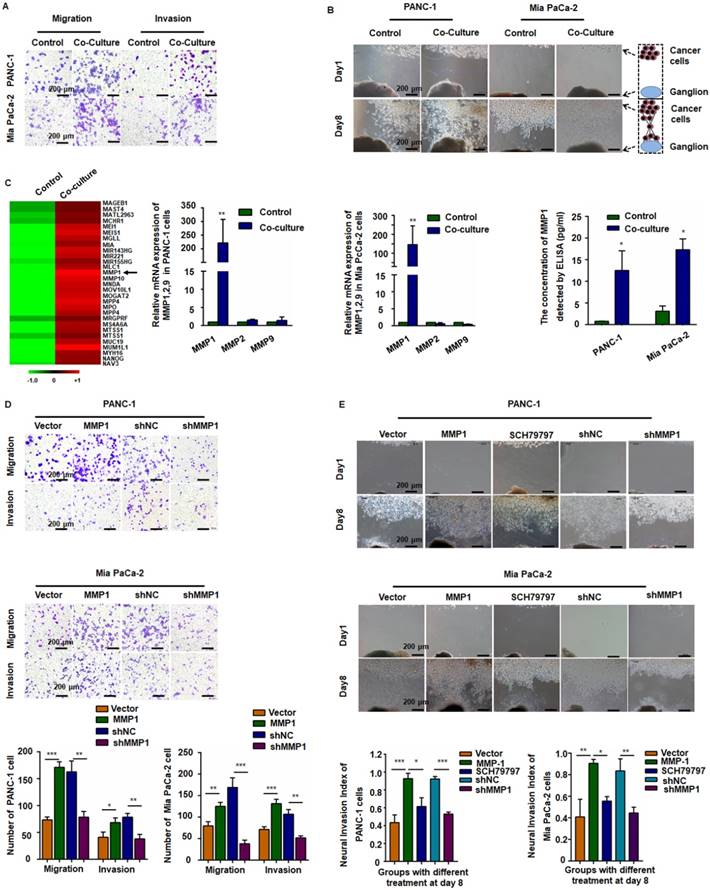
After incubation with PMA and IL-4, the smooth surface morphology of U937 cells had a thorny appearance because of pseudopodia, and the suspended cells became adherent. The immuno-phenotype, as detected by qPCR, demonstrated that CD68 and CD163 expression was upregulated, indicating that the monocytes transformed into M2-type macrophages (Figure S1A). After co-culture with TAMs, the migration and invasion abilities of PANC-1 and Mia PaCa-2 cells markedly enhanced (Figure 1A and Figure S1B). In the Matrigel/DRG model (Figure 1B), cancer cells dissociated from their colonies and migrated in a unidirectional fashion along the nerve toward the ganglion. Over time, cancer cells clustered around and connected with the DRG. The neural invasion index was used to quantify PNI (Figure S1C). Pre-co-culture with TAMs markedly increased the neural invasion index of both PANC-1 and Mia PaCa-2 cells, indicating that TAMs enhanced PNI by triggering intrinsic factors of cancer cells.
MMP1 was a key factor during the invasion of pancreatic carcinoma cells. (A) PANC-1 and Mia PaCa-2 cells were co-cultured with TAMs for 24 h and reseeded into Transwell plates. TAMs enhanced pancreatic carcinoma cell migration and invasion. (B) Nerve invasion of pancreatic carcinoma cells in a Matrigel/dorsal root ganglion (DRG) model. Eight days after implantation, cancer cells pre-co-cultured with TAMs exhibited extensive nerve invasion. (C) Microarray, qPCR, and ELISA analyses revealed that MMP1 was the most upregulated cytokine in pancreatic carcinoma cells after co-culture with TAMs. (D) Upregulation of MMP1 enhanced PANC-1 and Mia PaCa-2 cell migration and invasion, which was inhibited by shRNA targeting MMP1. (E) MMP-1 overexpression enhanced PNI, which was inhibited by PAR1 antagonist or shRNA targeting MMP1. Data are shown as the mean ± SD. * P < 0.05, ** P < 0.01, and *** P < 0.001.
MMP1/PAR1 contributed to the migration and PNI of PDAC cells
We detected mRNA expression profile by microarray analysis using pooled RNA samples of PANC-1 cells co-cultured with or without TAMs. MMP1 gene expression was up-regulated over 150-fold after co-culturing with TAMs (Figure 1C, arrow). All genes and the relative expression assessed in the array are presented in Table S2. Quantitative RT-PCR (qRT-PCR) and ELISA confirmed the significant increase of MMP1 expression in both PANC-1 and Mia PaCa-2 cells (Figure 1C). We also tested the expression of PAR1 in neuron and NK1R expression in pancreatic cancer cell lines (Figure S2). To investigate the effect of MMP1 on PDAC cell migration, an MMP1-expressing vector and its negative control (NC) vector were transiently transfected into PANC-1 and Mia PaCa-2 cells and MMP1 over-expression was confirmed by qRT-PCR, as well as ELISA assay. MMP1 silencing effect of stable transfection of shRNA-MMP1 and shRNA-NC plasmids was confirmed by qPCR (Figure S1D). As shown in Figure 1D-E, MMP1-overexpressing PANC-1 and Mia PaCa-2 cells exhibited enhanced invasion and PNI capabilities. Furthermore, PNI was inhibited by the PAR1 antagonist or MMP1 silencing shRNA, indicating that MMP1 mediated PDAC cells PNI by activating its receptor PAR1 on DRG.
The MMP1/PAR1 axis induced DRG-releasing SP by activating Akt
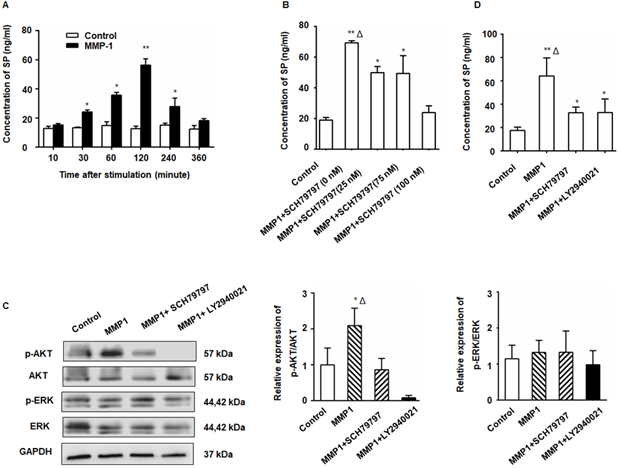
After treatment with MMP1, a significant increase in SP production from the DRG was detected by ELISA (Figure 2A). The SP concentration in the DRG supernatant began to increase 30 min after MMP1 treatment and the peak concentration was detected at 2 h. The amount of SP protein decreased to nearly baseline levels at 6 h indicating the rapid and transient release of SP. The MMP1-induced SP release was inhibited by PAR1 antagonist (Figure 2B). As shown in Figure 2C, Akt phosphorylation increased in the DRG following MMP1 stimulation which was attenuated by the PAR1 antagonist, whereas the expression of ERK1/2 and p-ERK1/2 did not change. Consistent with the Western blot analysis, ELISA showed that the upregulation of SP release induced by MMP1 was attenuated by treatment with the PAR1 antagonist or the Akt pathway inhibitor (Figure 2D). Thus, our results indicated that, by activating Akt, the MMP1/PAR1 axis induced DRG to release SP.
The MMP1/PAR1 axis induced DRG-releasing SP by activating Akt. (A) Thirty minutes after MMP1 (5 nM) stimulation, the SP concentration in the DRG supernatant began to increase and the peak concentration was detected at 2 h. The concentration of SP protein decreased almost to baseline levels at 6 h. (B) DRG were incubated in DMEM with MMP1 (5 nM) and different concentrations of PAR1 antagonist SCH79797 (0, 25, 50, and 100 nM) for 2 h, and the SP concentration in the supernatant was measured by ELISA. The MMP1-induced SP release was inhibited by SCH79797. (C) MMP1 induces DRG-releasing SP via MMP1/PAR1/AKT. After MMP1 stimulation, p-Akt increased in the DRG, whereas the PAR1 antagonist SCH79797 attenuated the phosphorylation of Akt. LY2940021 (Akt pathway inhibitor) was used as a positive control. The expression of ERK1/2 and p-ERK1/2 remained unchanged. (D) ELISA showed that the upregulation of SP induced by MMP1 was attenuated by treatment with the PAR1 antagonist or the Akt pathway inhibitor. Data are shown as the mean ± SD. * P < 0.05 and ** P < 0.01 compared to the control. Δ P < 0.05 compared to the SP+ SCH79797 group.
The SP/NK1R axis induced cancer cell migration, invasion, and PNI by activating ERK1/2
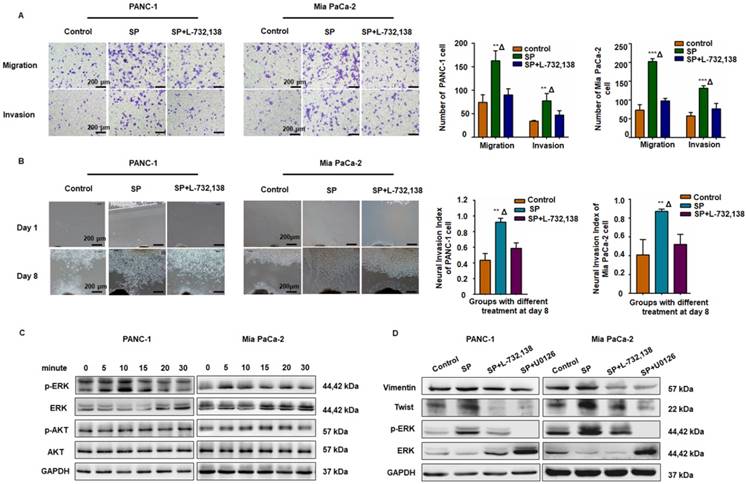
As displayed in Figure 3A-B, SP promoted migration, invasion, and PNI in both PANC-1 and MiaPaCa-2 cells, whereas the NK1R antagonists (L-732,138) significantly reduced these effects. Western blot analysis also revealed that SP stimulation activated the ERK1/2 pathway in both PANC-1 and Mia PaCa-2 cells (Figure 3C and Figure S3A). As shown in Figure 3D and Figure S3B-C, in both PANC-1 and MiaPaCa-2 cells, SP treatment upregulated the expression of Vimentin and Twist, markers that represent mesenchymal features during the epithelial-mesenchymal transition (EMT) of cancer cells and are consistent with cell invasion in vitro and metastasis in vivo [28]. Treatment with the NK1R or ERK1/2 antagonist significantly reduced the expression of Vimentin and Twist in both pancreatic cancer cell lines, indicating the role of SP/NK1R axis activating ERK1/2 and exerting pro-tumor activities.
The SP/NK1R axis induced cancer cell migration, invasion, and PNI. (A) After SP stimulation, both PANC-1 and Mia PaCa-2 cells exhibited enhanced migration and invasion, which was attenuated by the NK-1R antagonist SP + L-732,138. (B) In the cancer cells and Matrigel/DRG co-culture system, SP stimulation enhanced PNI. When SP/NK1R was blocked with the NK1R antagonist, PNI was inhibited. (C-D) SP activated p-ERK1/2 and upregulated Vimentin and Twist1 expression in both PANC-1 and Mia PaCa-2 cells, which was attenuated by treatment with the NK1R antagonist or the ERK pathway inhibitor, indicating that SP induced the EMT phenotype of PANC-1 and Mia PaCa-2 cells via SP/NK1R/ERK. Data are shown as the mean ± SD. ** P < 0.01 compared to the control, Δ P < 0.05 compared to the SP+L-732,138 group.
Essential role of MMP1/PAR1 and SP/NK1R during PNI in vivo
To further examine the role of MMP1/PAR1 and SP/NK1R during PNI in vivo, we used BALB/c mice and PANC-1 cells to establish a model of murine sciatic nerve invasion. Nerve function was assessed by the sciatic nerve score and sciatic nerve function index (hind limb paralysis and hind paw width). Nerve caliber was observed at the end of the experiment. Mice with PANC-1 + TAMs and PANC-1 shNC + TAMs tumors suffered from progressive ipsilateral hind limb paralysis over 3 weeks, with an apparent decrease in hind paw width (Figure 4A). Both were significantly higher than mice treated with PANC-1 cells alone, PANC-1 + TAMs + shMMP1, PANC-1 + TAMs + SCH79797, and PANC-1 + TAMs + L732,138 (all P < 0.05). Animals injected with PANC-1 + TAMs or PANC-1 shNC + TAMs also exhibited tumor growth along nerves. When the MMP1 gene was knocked down by shRNA, or mice were treated with antagonists that blocked MMP1/PAR1 or SP/NK1R axis, the growth along the nerves was significantly inhibited. Interestingly, there was no visible tumor growth in mice inoculated with PANC-1 only (no apparent changes in never function or nerve caliber; Figure 4B).
MMP1/PAR1 and SP/NK1R contributed to PNI in vivo. (A) Sciatic nerve score and sciatic nerve function index of mice with different treatments. (a) Paralysis occurred approximately 20 days after implantation. (b-d) The most severe bilateral hind limb paralysis was observed in mice treated with PANC-1 + TAMs or PANC-1 shNC + TAMs tumors on day 28. Mice receiving MMP1-shRNA, the PAR1 antagonist, or the NK1R antagonist exhibited much less severe paralysis. (B) Surgical images of sciatic nerve PNI. Cancer cells were injected into perineurium of left sciatic nerves (red arrow), and the right sciatic nerves were injected with 3 μL PBS as controls (black arrow). Mice treated with PANC-1 + TAMs or PANC-1 shNC + TAMs tumors exhibited obvious PNI. Knock down of MMP1 by shRNA or treatment with the PAR1 antagonist or the NK1R antagonist significantly reduced PNI. (C) Histological images of sciatic nerves and liver tissues of mice with different treatments. On day 28, the PBS-treated group exhibited normal proximal sciatic nerve histology and caliber and negative MMP1 IHC staining. Injection of PANC-1 cells only resulted in a slightly expanded nerve caliber with cancer cell infiltration and low MMP1 expression. Injection of PANC-1 + TAMs or PANC-1 shNC + TAMs resulted in extensive PNI and highly positive MMP1 IHC staining. MMP1-shRNA significantly reduced MMP1 expression in cancer cells and treatment with the PAR1 antagonist or the NK1R antagonist did not affect MMP1 protein expression. Less nerve caliber expansion with cancer cell infiltration was observed in these three groups. Liver metastases were detected in all experimental groups except for the PBS group. ** P < 0.01 compared to the control and Δ P < 0.01 compared to other groups.
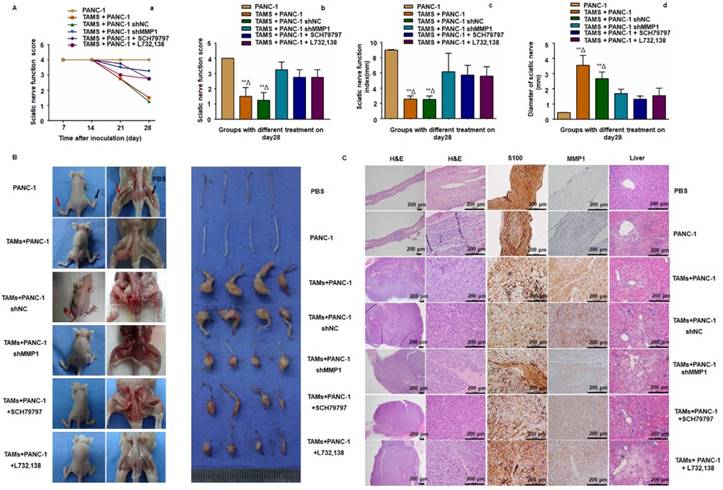
Histological analysis revealed normal proximal sciatic nerve histology and caliber 4 weeks after injection with PBS. MMP1 expression was negative and liver tissue was normal. The most extensive PNI with expansion of the nerve by infiltrating tumor cells was observed in mice after injection with PANC-1 + TAMs or PANC-1 shNC + TAMs. Less severe PNI was observed in mice after MMP1 silencing or treatment with PAR1 or NK1R antagonists. Positive MMP1 immunochemical staining was observed in PANC-1 cells co-cultured with TAMs (4+). The immunochemical staining of tumor sections exhibited CK19+ and CD68-, which further confirmed adenocarcinoma (Figure S4A). Mice injected with TAMs alone did not exhibit any neoplastic growth or changes in nerve function or caliber (Figure S4B-C). In mice injected with PANC-1 cells alone, most cancer cells remained in the inoculation area but expansion of the nerve by infiltrating tumor cells was observed microscopically. Liver metastasis was detected in all experimental groups except in the PBS group, indicating that PNI caused liver metastasis (Figure 4C). In a parallel experiment, PANC-1 cells were pre-co-cultured with TAMs for 24 hours in vitro, then collected and injected into perineurium of left sciatic nerves. These cells showed enhanced sciatic nerve invasion compared to PANC-1 cells without TAMs pre-co-culture, indicating that even transient co-culture with TAMs robustly enhanced the nerve invasion and migration ability of PANC-1 cells (Figure S4D).
In vivo monitoring of PNI by MRI scans
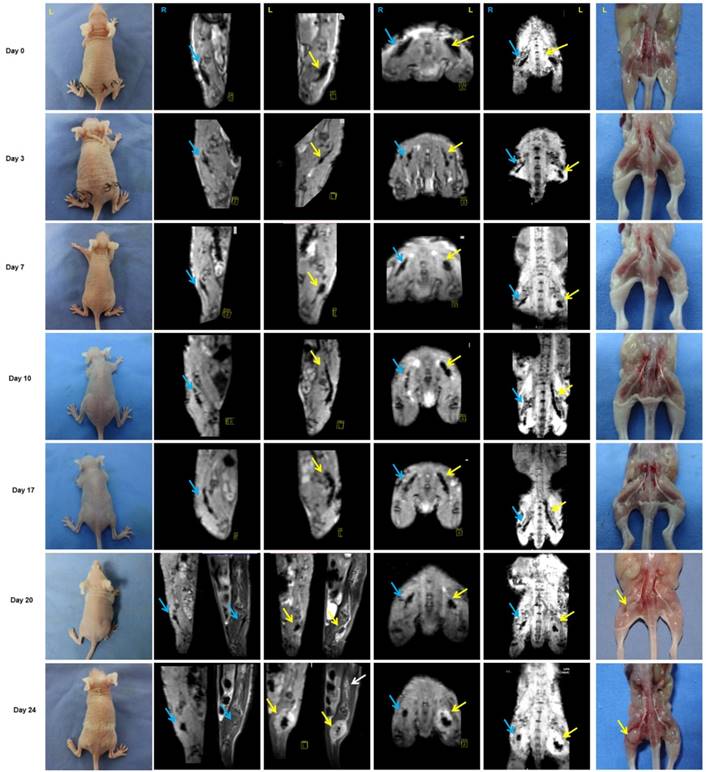
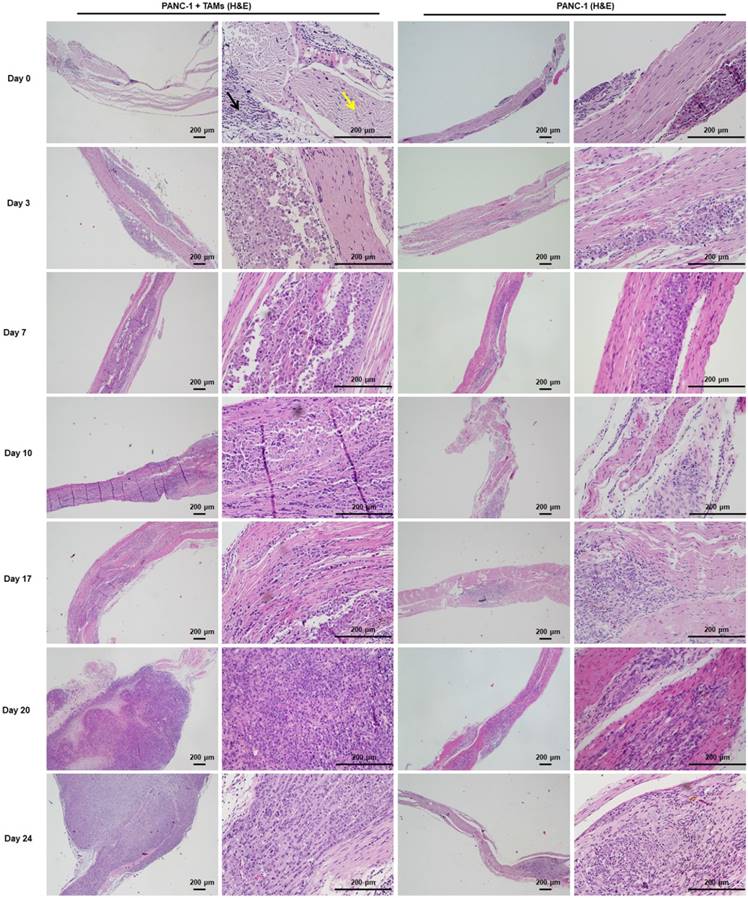
Approximately 3 weeks after PANC-1 cancer cell inoculation, paralysis or diminished hind paw width was observed while gross appearance of tumor volume was delayed for 4 weeks. Notably, there was no gross appearance of a tumor, although liver metastasis occurred. To assess nerve invasion in the early stage, we developed a non-invasive and sensitive method. PANC-1 cells were marked with an MR-negative contrast agent IONP to enhance MRI, they exhibited a low signal in T2WI and T2*WI. The concentration of IONP was 36mg/L according to the results of cellular uptake, T2-value, and the influence on cell viability (Figure S5). After injection of PANC-1 IONP cells or PANC-1 IONP + TAMs under the epineurium of sciatic nerves, low-signal regions represented PANC-1 cell infiltration (Figure 5, day 0, blue and yellow arrows). From day 0 to day 7, there was no apparent difference between the two sides of the sciatic nerves and no apparent nerve invasion was observed. On day 10, a low-signal area on the left sciatic nerve injected with PANC-1IONP + TAMs enlarged and demonstrated expanded sciatic nerves indicating sciatic nerve invasion. The right sciatic nerve injected with PANC-1IONP remained unchanged. At this time point, all mice exhibited intact hind limb function and normal hind paw width. On day 17, both the left and right sciatic nerves exhibited invasion with the left side being more apparent than the right side. However, no tumor formation was detected by MRI or surgical images in any of the mice and hind limb function and hind paw width were normal. On day 20, left hind limb paralysis occurred and the left hind paw width decreased from 9.33±0.26 mm to 7.38±1.23 mm. Tumor formation was also detected by MRI and surgical images. No tumor formation or change in nerve function was observed on the right sciatic nerve. The experiment was terminated on day 24 due to the severity of left hind limb paralysis. MRI clearly showed cancer cell invasion along the nerves extending from the left sciatic nerve injection area to the spine nerve root. Newly growing tumors were more distinct in T2WI than T2*WI because of the lower/no IONP content (Figure 5, day 24, yellow and white arrows). At this time point, the right side injected with PANC-1 cells exhibited normal hind limb function and hind paw width, and no tumor formation was detected by MRI. Nerve invasion was further confirmed by histological analysis with H&E staining. As shown in Figure 6, on days 0, 3, and 7, cancer cells remained in the injection area under the epineurium (black arrow) without contacting a nerve bundle (yellow arrow) in both the left and right sciatic nerves. On day 10, cancer cells infiltrated into the nerve tract in the left sciatic nerve, while the right sciatic nerve did not exhibit nerve invasion. Infiltration in the left sciatic nerve was more advanced on day 17, while few cancer cells began to invade into the right nerve bundle. On days 20 and 24, tumor formation and aggressive nerve infiltration were observed in the left sciatic nerve. Invasion also progressed in the right sciatic nerve but was less severe than the left side. Our data showed that, at all time points examined, MRI results were consistent with those from the pathology and indicated that nerve invasion occurred much earlier than nerve function impairment or detectable tumor formation.
Monitoring of PNI by MRI scans in vivo. PANC-1 cells labeled with IONP, PANC-1IONP, exhibited low signals upon MRI. Right sciatic nerves were injected with PANC-1 IONP (blue arrow) and left sciatic nerves were injected with PANC-1 IONP + TAMs (yellow arrow). From day 0 to day 7, no apparent PNI was observed in either sciatic nerve. On day 10, a low-signal area on the left sciatic nerve became enlarged and demonstrated thickened sciatic nerves, indicative of PNI. On day 17, both sciatic nerves exhibited PNI, but the left side was more apparent than the right side. On day 20, left hind limb paralysis was observed and tumor formation was detected on the left side by MRI and surgical images. The right hind limb did not exhibit paralysis and no tumor formation was detected. On day 24, left hind limb paralysis was more severe. MRI clearly showed cancer cell invasion along nerves from the left sciatic nerve injection area (yellow arrow) toward the spinal cord (white arrow).
H&E staining of sciatic nerves at individual time points was consistent with MRI. Cancer cells were restricted to the injection area under the epineurium (black arrow) without contacting a nerve bundle (yellow arrow) on days 0, 3, and 7. From day 10, cancer cells infiltrated into the left sciatic nerve tract and progressed thereafter. Cancer cells infiltrated into the right sciatic nerve tract on day 17 and the progression was much less severe than that on the left side.
MMP1 expression was upregulated in PDAC tissues and was correlated with PNI in patients
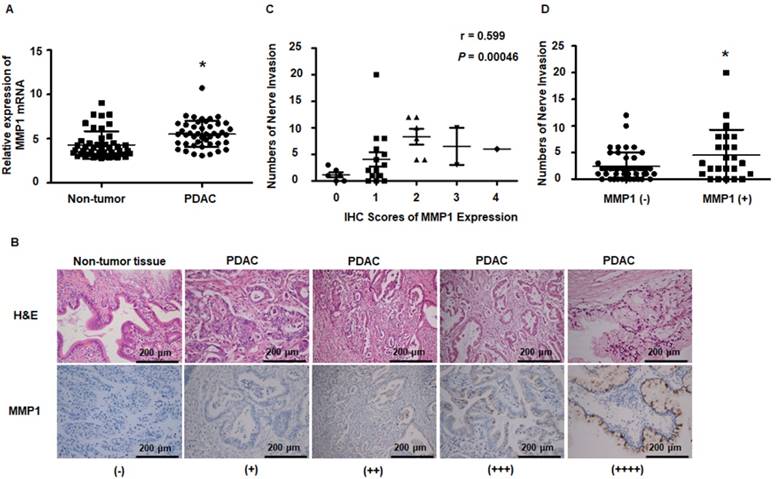
Results obtained from the public dataset GSE28735 showed higher expression of MMP1 mRNA in tumor tissues than in adjacent non-tumor tissues (Figure 7A). Immunohistochemical staining of MMP1 protein was performed on tissue sections from 30 surgically excised human PDAC samples and was read by two independent experienced pathologists. The clinicopathological features of PDAC patients are presented in Table S3. Figure 7B shows representative IHC images of PDAC and adjacent non-tumor tissues. MMP1-positive staining was scattered in the cytoplasm of 26 of 30 PDAC samples. Negative or very weak positive staining was observed in the non-tumor tissues. Since the correlation between non-invaded nerves and tumor progression remains unclear, in the present study, only invaded nerves were counted. Spearman correlation analyses showed that MMP1 protein expression was positively correlated with PNI (Figure 7C, R=0.599, P=0.00046). PDAC patients with MMP1-positive staining had more PNI than MMP1-negative patients (Figure 7D), consistent with a role for MMP1 in the PNI of PDAC.
MMP1 expression data from public datasets and post-operation PDAC patients. (A) MMP1 mRNA expression levels were higher in PDAC tissues than adjacent non-tumor tissues from the public dataset GSE28735. (B) Immunohistochemical images for MMP1 expression in PDAC and adjacent non-tumor tissues collected from clinical PDAC patient specimens. The positive rate of PDAC tissues was 86.7% (26/30). Negative or very weak positive staining was observed in the most of non-tumor tissues. (C) MMP1 expression positively correlated with PNI (R=0.599, P=0.00046). (D) The number of PNI in PDAC patients with IHC MMP1 positivity was higher than MMP1-negative patients. Data are shown as the mean ± SD. * P < 0.05.
Discussion
Increasing clinical evidence indicates that PNI occurs in the early stage of PDAC and is also associated with relapse after surgery, resulting in an overall short survival of patients [29, 30]. In recent years, the process of PNI and the underlying mechanisms have been studied by examining gene profiles, cytokine chemotaxis, and cell-cell interactions [31-33]. However, most studies were unable to identify a direct paracrine loop between cancer cells and nerves. In this study, we used Matrigel/DRG and a murine sciatic nerve invasion model as in vitro and in vivo PNI models and identified MMP1 as a pivotal factor during PDAC cell PNI and revealed an MMP1/PAR1/SP/NK1R paracrine loop between PDAC cells and DRG. We selected PANC-1 cells with low PNI capability [4] to establish the Matrigel/DRG in vitro model as well as for in vivo studies.
It has been well-established that TAMs play a pivotal role in tumor progression and invasion by up-regulating MMPs [34, 35]. The canonical activation of PAR1, the first identified thrombin receptor [36], is induced by thrombin. MMP1 induces noncanonical PAR1 activation by cleaving at the N-terminal extracellular domain (exodomain) LD39-P40RS site of PAR1, which differs from the thrombin cleavage site PR41-S42FL [37, 38]. MMP-2 was recently shown to enhance platelet activation by cleaving PAR1 at TL38-D39PR using integrin αIIbβ3 as a cofactor [39]. Thus, it is clear that the activation of PAR1 by MMP1 is peptide-specific [38]. Previous studies have also shown that MMP1-PAR1 activation induces secretion of several angiogenic factors from ovarian carcinoma cells. This indicates that, in addition to the direct role of extracellular matrix degradation and cell invasion, MMP1 mediates tumor migration by cleaving special receptors releasing other bioactive proteins [40]. Thrombin and the PAR1 agonist TFLLR-NH2 (TF-NH2) induce plasma extravasation by inducing sensory nerves to release SP and by stimulating Ca2+ mobilization in cultured neurons [18]. Our results confirmed that MMP1/PAR1 induced SP release from the DRG via AKT phosphorylation. MMP1 cleavage-generated PAR1-dependent Ca2+ signals in a neuron may also contribute to SP release [38]. These observations prompted us to focus on MMP1 as a unique MMP member that connects PDAC cells to the peripheral nerves and may be functionally essential for PNI.
MMP1 expression has been observed in the early stages of a variety of cancers and is associated with a poor prognosis [41, 42]. RAS oncogenes may play a critical role in the constitutive expression of MMP1 in human pancreatic cancer cells by activating MAPK pathways [43]. Also, the interaction between cancer cells and TAMs dramatically upregulated MMP1 expression in PDAC cells. Temporary stimulation by inflammatory factor IL-6 induced constitutive activation of an inflammatory signaling circuit during mammary epithelial cell transformation and tumorigenesis [44]. Previous studies have reported a paracrine loop between MMP1/PAR1 and IL-8/CXCR1/2 [40, 45]. We hypothesized that, after co-culture with TAMs, PDAC cells could be activated by a pro-inflammatory factor (possibly IL-8) secreted by TAMs and that the inflammatory signaling circuit in PDAC cells was constitutively activated, resulting in increased levels of MMP1.
The animal experiments performed in this study have shown that TAMs promoted the proliferation and PNI of PANC-1 cells. However, after MMP1 knockdown by shRNA, PANC-1 cells grew locally and PNI was inhibited indicating the pivotal effect of MMP1 during the PNI process. At the end of the experiment, aggressive tumors were detected in mice treated with PANC-1 + TAMs, whereas mice treated with PANC-1 cells alone did not exhibit visible tumor growth. Among several pancreatic cancer cell lines, PANC-1 is known to have high latency periods before tumor development following allograft [46]. Also, in the absence of TAMs, the tumor microenvironment provides insufficient growth factors essential for tumor development [47].
Our study established a sensitive, convenient, and non-invasive method to observe nerve invasion from the early stage of PNI. IONPs have been used to enhance MRI with their high biocompatibility and low cytotoxicity and to detect lymph node metastasis in patients [48, 49]. In this study, PANC-1 cells were marked with IONP and cell movement along the sciatic nerve was observed by MRI. MR images clearly demonstrated that PANC-1 cells migrated along the sciatic nerve as early as 10 days after implantation under the epineurium, and the nerve invasion signals were consistent with the pathological assays. However, there was no obvious change in the sciatic nerve index or nerve caliber until 20 days after implantation. These data indicate that, prior to measurable tumor growth or functional deficiency, spreading along the nerve had already occurred.
Another unexpected finding of the present study was that sciatic nerve invasion by PDAC cells resulted in liver metastasis. Although we observed distant spread of carcinoma cells along the spine, the reason for liver metastasis remains obscure and should be further elucidated. PNI is believed to be one source of locoregional recurrence in resected PDAC [29]. Our results provide a new perspective that PNI may be a risk factor of liver metastasis in PDAC patients. Finally, results from PDAC tissues and a publicly available dataset indicated that MMP1 is highly expressed in tumors and is positively correlated with PNI. Although the cases in the dataset and clinical samples were limited, our comprehensive results indicate MMP1 as a pharmacological target that may be intercepted to reduce relapse and metastasis of PDAC.
There are certain limitations in the present study. In the animal experiments, we injected tumors cells directly into perineurium and could clearly observe the migration of tumor cells along sciatic nerve, but we could not address how PNI is initiated in PDAC progression. In addition, TAMs injected with PANC1 are not expected to stay in the nerve for days. Our experiment showed the advantage of intermediate effect of TAMs on PNI, further investigations should be performed using transgenic mice which lack macrophages trafficking. Also, the findings of the present study need to be repeated using a gene knock out mouse or a spontaneous pancreatic cancer model in mice to understand many other biological factors implicated in PNI. Finally, the correlation between MMP1 and PNI need to be further evaluated using a larger number of patients.
In conclusion, the present study showed that the paracrine loop between PDAC cells and the DRG mediated by MMP1 contributes to PNI. Characterization of this paracrine loop provides important clinical implications. Our results suggest that pharmacological targeting of MMP1 is an adjuvant therapy to prevent PDAC metastasis. Our study also provides evidence that metastasis through nerves occurs in a very early stage of primary tumor formation. Furthermore, we established a sensitive and non-invasive method to monitor nerve invasion using IONP and MRI. To some extent, this method overcomes the limitations of current in vivo PNI assessment methods and would be helpful for future PNI research.
Abbreviations
DRG: dorsal root ganglia; IONP: iron oxide nanoparticle; MMP: matrix metalloproteinase; NK1R: neurokinin 1 receptor; PNI: perineural invasion; PAR1: protease-activated receptors1; PDAC: pancreatic ductal adenocarcinoma; SP: substance P; TAM: tumor-associated macrophage.
Supplementary Material
Supplementary figures and tables.
Acknowledgements
This work was supported by National Natural Science Foundation of China (grant no. 81502503, 81572396, and 81672408), Natural Science Foundation of Guangdong Province, China (grant no. 2016A030310191, 2014A030313050), Science and Technology Program of Guangzhou, China (grant no. 201508020013), Program of Science and Technology star of Zhujiang Guangzhou city, China (grant no. 201610010078), Key Laboratory of Malignant Tumor Molecular Mechanism and Translational Medicine of Guangzhou Bureau of Science and Information Technology (grant no. [2013]163), Key Laboratory of Malignant Tumor Gene Regulation and Target Therapy of Guangdong Higher Education Institutes (grant no. KLB09001), and Medical Scientific Research Foundation of Guangdong Province, China (grant no. A2016210).
Author contributions
L.J.Z. and K.H.H. conceptualized and designed the study; C.M.H, Y.Q.L., Y.B.G, G.D.L., Y.T.C., J.L., Y.H.S. and K.G.Y. carried out experiments and acquisition of data; Z.Q.Z. performed the MRI imaging; S.J.C., J.J.L., and H.S. assisted with statistical analysis and interpretation of data.
Competing Interests
The authors have declared that no competing interest exists.
References
1. Liebig C, Ayala G, Wilks JA, Berger DH, Albo D. Perineural invasion in cancer: a review of the literature. Cancer. 2009;115:3379-91
2. Gil Z, Carlson DL, Gupta A. et al. Patterns and incidence of neural invasion in patients with cancers of the paranasal sinuses. Arch Otolaryngol Head Neck Surg. 2009;135:173-9
3. Abiatari I, DeOliveira T, Kerkadze V. et al. Consensus transcriptome signature of perineural invasion in pancreatic carcinoma. Mol Cancer Ther. 2009;8:1494-504
4. Koide N, Yamada T, Shibata R. et al. Establishment of perineural invasion models and analysis of gene expression revealed an invariant chain (CD74) as a possible molecule involved in perineural invasion in pancreatic cancer. Clin Cancer Res. 2006;12:2419-26
5. Ayala GE, Wheeler TM, Shine HD. et al. In vitro dorsal root ganglia and human prostate cell line interaction: redefining perineural invasion in prostate cancer. Prostate. 2001;49:213-23
6. Cavel O, Shomron O, Shabtay A. et al. Endoneurial macrophages induce perineural invasion of pancreatic cancer cells by secretion of GDNF and activation of RET tyrosine kinase receptor. Cancer Res. 2012;72:5733-43
7. Hidalgo M. Pancreatic cancer. N Engl J Med. 2010;362:1605-17
8. Yoshikawa K, Mitsunaga S, Kinoshita T. et al. Impact of tumor-associated macrophages on invasive ductal carcinoma of the pancreas head. Cancer Sci. 2012;103:2012-20
9. Jamieson NB, Mohamed M, Oien KA. et al. The relationship between tumor inflammatory cell infiltrate and outcome in patients with pancreatic ductal adenocarcinoma. Ann Surg Oncol. 2012;19:3581-90
10. Zeng L, Guo Y, Liang J. et al. Perineural invasion and TAMs in pancreatic ductal adenocarcinomas: review of the original pathology reports using immunohistochemical enhancement and relationships with clinicopathological features. J Cancer. 2014;5:754-60
11. Sica A, Allavena P, Mantovani A. Cancer related inflammation: the macrophage connection. Cancer Lett. 2008;267:204-15
12. Helm O, Held-Feindt J, Grage-Griebenow E. et al. Tumor-associated macrophages exhibit pro- and anti-inflammatory properties by which they impact on pancreatic tumorigenesis. Int J Cancer. 2014;135:843-61
13. Mantovani A, Germano G, Marchesi F, Locatelli M, Biswas SK. Cancer-promoting tumor-associated macrophages: new vistas and open questions. Eur J Immunol. 2011;41:2522-5
14. Chen H, Yuan Y, Zhang C. et al. Involvement of S100A14 protein in cell invasion by affecting expression and function of matrix metalloproteinase (MMP)-2 via p53-dependent transcriptional regulation. J Biol Chem. 2012;287:17109-19
15. Tian TV, Tomavo N, Huot L. et al. Identification of novel TMPRSS2:ERG mechanisms in prostate cancer metastasis: involvement of MMP9 and PLXNA2. Oncogene. 2014;33:2204-14
16. Austin KM, Covic L, Kuliopulos A. Matrix metalloproteases and PAR1 activation. Blood. 2013;121:431-9
17. Juncker-Jensen A, Deryugina EI, Rimann I. et al. Tumor MMP-1 activates endothelial PAR1 to facilitate vascular intravasation and metastatic dissemination. Cancer Res. 2013;73:4196-211
18. de Garavilla L, Vergnolle N, Young SH. et al. Agonists of proteinase-activated receptor 1 induce plasma extravasation by a neurogenic mechanism. Br J Pharmacol. 2001;133:975-87
19. Hokfelt T, Pernow B, Wahren J. Substance P: a pioneer amongst neuropeptides. J Intern Med. 2001;249:27-40
20. Munoz M, Rosso M. The NK-1 receptor antagonist aprepitant as a broad spectrum antitumor drug. Invest New Drugs. 2010;28:187-93
21. Entschladen F, Drell TLt, Lang K, Joseph J, Zaenker KS. Tumour-cell migration, invasion, and metastasis: navigation by neurotransmitters. Lancet Oncol. 2004;5:254-8
22. Lee GY, Qian WP, Wang L. et al. Theranostic nanoparticles with controlled release of gemcitabine for targeted therapy and MRI of pancreatic cancer. ACS Nano. 2013;7:2078-89
23. Ding J, Jin W, Chen C, Shao Z, Wu J. Tumor associated macrophage x cancer cell hybrids may acquire cancer stem cell properties in breast cancer. PLoS One. 2012;7:e41942
24. Gil Z, Cavel O, Kelly K. et al. Paracrine regulation of pancreatic cancer cell invasion by peripheral nerves. J Natl Cancer Inst. 2010;102:107-18
25. He S, Chen CH, Chernichenko N. et al. GFRalpha1 released by nerves enhances cancer cell perineural invasion through GDNF-RET signaling. Proc Natl Acad Sci USA. 2014;111:E2008-17
26. Mitsunaga S, Fujii S, Ishii G. et al. Nerve invasion distance is dependent on laminin gamma2 in tumors of pancreatic cancer. Int J Cancer. 2010;127:805-19
27. Gil Z, Rein A, Brader P. et al. Nerve-sparing therapy with oncolytic herpes virus for cancers with neural invasion. Clin Cancer Res. 2007;13:6479-85
28. Kalluri R, Weinberg RA. The basics of epithelial-mesenchymal transition. J Clin Invest. 2009;119:1420-8
29. Zhang JF, Hua R, Sun YW. et al. Influence of perineural invasion on survival and recurrence in patients with resected pancreatic cancer. Asian Pac J Cancer Prev. 2013;14:5133-9
30. Takahashi H, Ohigashi H, Ishikawa O. et al. Perineural invasion and lymph node involvement as indicators of surgical outcome and pattern of recurrence in the setting of preoperative gemcitabine-based chemoradiation therapy for resectable pancreatic cancer. Ann Surg. 2012;255:95-102
31. Guo K, Ma Q, Li J. et al. Interaction of the sympathetic nerve with pancreatic cancer cells promotes perineural invasion through the activation of STAT3 signaling. Mol Cancer Ther. 2013;12:264-73
32. Li X, Wang Z, Ma Q. et al. Sonic hedgehog paracrine signaling activates stromal cells to promote perineural invasion in pancreatic cancer. Clin Cancer Res. 2014;20:4326-38
33. Magnon C, Hall SJ, Lin J. et al. Autonomic nerve development contributes to prostate cancer progression. Science. 2013;341:1236361
34. Vinnakota K, Zhang Y, Selvanesan BC. et al. M2-like macrophages induce colon cancer cell invasion via matrix metalloproteinases. J Cell Physiol. 2017
35. Tauchi Y, Tanaka H, Kumamoto K. et al. Tumor-associated macrophages induce capillary morphogenesis of lymphatic endothelial cells derived from human gastric cancer. Cancer Sci. 2016;107:1101-9
36. Vu TK, Hung DT, Wheaton VI, Coughlin SR. Molecular cloning of a functional thrombin receptor reveals a novel proteolytic mechanism of receptor activation. Cell. 1991;64:1057-68
37. Trivedi V, Boire A, Tchernychev B. et al. Platelet matrix metalloprotease-1 mediates thrombogenesis by activating PAR1 at a cryptic ligand site. Cell. 2009;137:332-43
38. Boire A, Covic L, Agarwal A, Jacques S, Sherifi S, Kuliopulos A. PAR1 is a matrix metalloprotease-1 receptor that promotes invasion and tumorigenesis of breast cancer cells. Cell. 2005;120:303-13
39. Sebastiano M, Momi S, Falcinelli E, Bury L, Hoylaerts MF, Gresele P. A novel mechanism regulating human platelet activation by MMP-2-mediated PAR1 biased signaling. Blood. 2017;129:883-95
40. Agarwal A, Tressel SL, Kaimal R. et al. Identification of a metalloprotease-chemokine signaling system in the ovarian cancer microenvironment: implications for antiangiogenic therapy. Cancer Res. 2010;70:5880-90
41. Liu M, Hu Y, Zhang MF. et al. MMP1 promotes tumor growth and metastasis in esophageal squamous cell carcinoma. Cancer Lett. 2016;377:97-104
42. Poola I, DeWitty RL, Marshalleck JJ, Bhatnagar R, Abraham J, Leffall LD. Identification of MMP-1 as a putative breast cancer predictive marker by global gene expression analysis. Nat Med. 2005;11:481-3
43. Endo H, Watanabe T, Sugioka Y, Niioka M, Inagaki Y, Okazaki I. Activation of two distinct MAPK pathways governs constitutive expression of matrix metalloproteinase-1 in human pancreatic cancer cell lines. Int J Oncol. 2009;35:1237-45
44. Rokavec M, Wu W, Luo JL. IL6-mediated suppression of miR-200c directs constitutive activation of inflammatory signaling circuit driving transformation and tumorigenesis. Mol Cell. 2012;45:777-89
45. Waugh DJ, Wilson C. The interleukin-8 pathway in cancer. Clin Cancer Res. 2008;14:6735-41
46. Deer EL, Gonzalez-Hernandez J, Coursen JD. et al. Phenotype and genotype of pancreatic cancer cell lines. Pancreas. 2010;39:425-35
47. Brown JM, Recht L, Strober S. The promise of targeting macrophages in cancer therapy. Clin Cancer Res. 2017;23:3241-50
48. Gao Z, Ma T, Zhao E. et al. Small is smarter: nano MRI contrast agents - advantages and recent achievements. Small. 2016;12:556-76
49. Harisinghani MG, Barentsz J, Hahn PF. et al. Noninvasive detection of clinically occult lymph-node metastases in prostate cancer. N Engl J Med. 2003;348:2491-9
Author contact
![]() Corresponding author: Linjuan Zeng; Department of Oncology, The Fifth Affiliated Hospital of Sun Yat-sen University. 52 Mei Hua Dong Road, Zhuhai 519000, China; Tel: +86 756 2528027; Fax: +86 756 2528166; E-mail: zenglinjsysu.edu.cn; Kaihong Huang; Department of Gastroenterology, Sun Yat-sen Memorial Hospital, Sun Yat-sen University. The 107th of Yanjiang West Road, Guang Zhou 510120, China; Tel +86 20 81332489; Fax +86 20 81332244; Email: huangkhsysu.edu.cn
Corresponding author: Linjuan Zeng; Department of Oncology, The Fifth Affiliated Hospital of Sun Yat-sen University. 52 Mei Hua Dong Road, Zhuhai 519000, China; Tel: +86 756 2528027; Fax: +86 756 2528166; E-mail: zenglinjsysu.edu.cn; Kaihong Huang; Department of Gastroenterology, Sun Yat-sen Memorial Hospital, Sun Yat-sen University. The 107th of Yanjiang West Road, Guang Zhou 510120, China; Tel +86 20 81332489; Fax +86 20 81332244; Email: huangkhsysu.edu.cn