Impact Factor
- Issue 14; 2026
- Issue 13; 2026
- Issue 12; 2026
- Issue 11; 2026
- Issue 10; 2026
- Volume 16; 2026
- Advance Articles
- Past Issues
- Cover Images
- Cover Suggestion
- Index & Coverage
- Special Issues
Introduction
Results and discussion
Conclusion
Methods
Abbreviations
Supplementary Material
Acknowledgements
References
International Journal of Biological Sciences
International Journal of Medical Sciences
 Global reach, higher impact

Theranostics 2018; 8(11):2939-2953. doi:10.7150/thno.24015 This issue Cite
Research Paper
Cascade-amplifying synergistic effects of chemo-photodynamic therapy using ROS-responsive polymeric nanocarriers
Chun-Yang Sun1*, Ziyang Cao2*, Xue-Jun Zhang3, Rong Sun4, Chun-Shui Yu1 ![]() , Xianzhu Yang2
, Xianzhu Yang2 ![]()
1. Department of Radiology and Tianjin Key Laboratory of Functional Imaging, Tianjin Medical University General Hospital, Tianjin 300052, P.R. China
2. Institutes for Life Sciences, School of Medicine and National Engineering Research Center for Tissue Restoration and Reconstruction, South China University of Technology, Guangzhou, Guandong 510006, P. R. China
3. School of Medical Imaging, Tianjin Medical University, Tianjin 300203, P.R. China
4. School of Biological and Chemical Engineering, Zhejiang University of Science & Technology, Hangzhou, Zhejiang 310023, P. R. China
*These authors contributed equally.
Received 2017-11-25; Accepted 2018-3-8; Published 2018-4-18
Abstract

The simple integration of chemotherapeutic drugs and photosensitizers (PSs) into the same nanocarriers only achieves a combination of chemo-photodynamic therapy but may not confer synergistic effects. The boosted intracellular release of chemotherapeutic drugs during the photodynamic therapy (PDT) process is necessary to achieve a cascade of amplified synergistic therapeutic effects of chemo-photodynamic therapy.
Methods: In this study, we explored an innovative hyperbranched polyphosphate (RHPPE) containing a singlet oxygen (SO)-labile crosslinker to boost drug release during the PDT process. The photosensitizer chlorin e6 (Ce6) and doxorubicin (DOX) were simultaneously loaded into RHPPE nanoparticles (denoted as SOHNPCe6/DOX). The therapeutic efficacy of SOHNPCe6/DOX against drug-resistant cancer was evaluated in vitro and in vivo.
Results: Under 660-nm light irradiation, SOHNPCe6/DOX can produce SO, which not only induces PDT against cancer but also cleaves the thioketal linkers to destroy the nanoparticles. Subsequently, boosted DOX release can be achieved, activating a chemotherapy cascade to synergistically destroy the remaining tumor cells after the initial round of PDT. Furthermore, SOHNPCe6/DOX also efficiently detected the tumor area by photoacoustic/magnetic resonance bimodal imaging. Under the guidance of bimodal imaging, the laser beam was precisely focused on the tumor areas, and subsequently, SOHNPCe6/DOX realized a cascade of amplified synergistic chemo-photodynamic therapeutic effects. High antitumor efficacy was achieved even in a drug-resistant tumor model.
Conclusion: The designed SOHNPCe6/DOX with great biocompatibility is promising for use as a co-delivery carrier for combined chemo-photodynamic therapy, providing an alternative avenue to achieve a cascade of amplified synergistic effects of chemo-photodynamic therapy for cancer treatment.
Keywords: ROS responsive, chemo-photodynamic therapy, on-demand drug release, drug-resistant cancer, synergistic therapy
Introduction
Photodynamic therapy (PDT) is a minimally invasive therapeutic modality based on a photosensitizer (PS)-produced cytotoxic reactive oxygen species (ROS), prevalently singlet oxygen (1O2, SO), that holds great promise for treating various cancers [1-4]. By localizing light illumination to tumor regions, SO generation can be selectively restricted to a specific area to trigger tumor destruction and spare healthy organs through oxidation of the surrounding biomacromolecules [5-9]. In addition, the PDT can be combined with traditional chemotherapy to further improve the anticancer efficiency through different therapeutic mechanisms [10-12]. Specifically, the rapid development of nanotechnology has ensured the simultaneous integration of PS and chemotherapy drugs into the same nanoparticles to achieve combination therapy [13-16]. For instance, Dong et al. developed polyethylene glycol (PEG)-modified CaCO3 nanoparticles as a nanocarrier for the photosensitizer chlorin e6 and the chemotherapeutic drug doxorubicin (DOX) for cancer combination therapy [17]. Lin and coworkers reported a nanoscale coordination polymer-based nanoparticle carrying cisplatin and pyrolipid for combined chemotherapy and photodynamic therapy for resistant head and neck cancers [18].
Despite great promising, most current nanocarriers for chemo-photodynamic combination therapy are just used as a system to co-deliver the two agents. The encapsulated cytotoxic drug is gradually released within the tumor cells and directly kills the cells (chemotherapy), while the PS generates SO only under light irradiation to induce cell apoptosis (PDT) [19-21]. Therefore, these chemo-photodynamic therapies are simply combinations of the two therapies and do not confer synergistic effects of PS and chemotherapy drugs, making them insufficient for amplifying the anticancer efficacy. Increasing evidence has demonstrated that nanocarriers should boost the intracellular release of cytotoxic drug during the PDT process to yield the maximal benefit of chemo-photodynamic therapy [22-27]. Liu et al. demonstrated that the mesoporous silica nanorods with SO-sensitive shells offer remarkable synergistic therapeutic effects in cancer treatment owing to the boosted release of DOX specifically at the tumor site during the light-induced PDT process [28]. Zhang et al. observed that mesoporous silica nanoparticles (MSNs) with triggered self-accelerating DOX released during the light-induced PDT process with the MSN surface anchored by a SO-sensitive polymer induced more significant antitumor activity in human breast cancer than control MSNs [29]. Overall, these results suggested that simultaneous encapsulation of PS and chemotherapy drugs in the same nanocarriers is only a prerequisite for synergistic chemo-photodynamic therapy; triggering the intracellular release of chemotherapy drugs during the PDT process is necessary to realize cascade-amplifying synergistic therapeutic effects of chemo-photodynamic therapy.
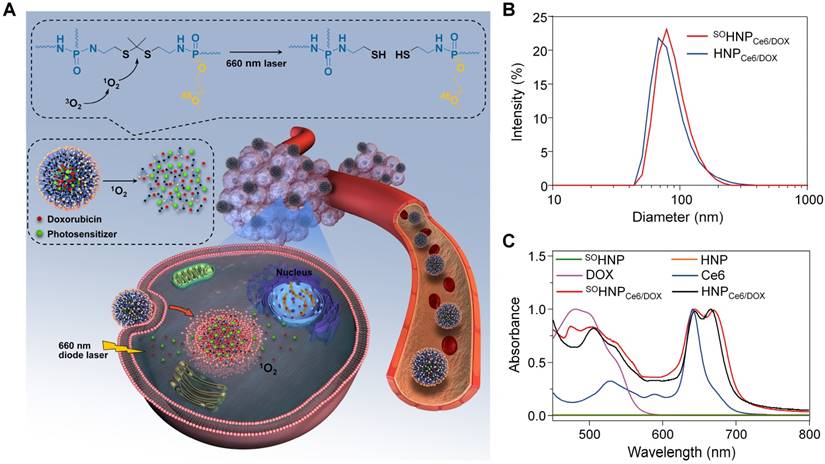
Herein, to trigger drug release during the PDT process, SO-responsive PEGylated hyperbranched polyphosphates containing thioketal linkers (RHPPE) were successfully synthesized through (A2 + B3) type polycondensation (Figure S1) and then used to simultaneously encapsulate Ce6 and DOX (Figure 1A). The obtained Ce6 and DOX-loaded nanoparticles were denoted SOHNPCe6/DOX. Under 660-nm light irradiation, SOHNPCe6/DOX can produce SO, which not only induces PDT against cancer but also realizes cleavage of the thioketal linkers to destroy nanoparticles. Disassembly of the nanoparticles subsequently boosts DOX release, thus activating a cascade of chemotherapeutic effects to synergistically destroy the remaining tumor cells after the initial round of PDT. Therefore, under the guidance of photoacoustic/magnetic resonance bimodal imaging, the SOHNPCe6/DOX nanoparticles can be utilized to realize cascade-amplifying synergistic therapeutic effects of chemo-photodynamic therapy with high antitumor efficacy. This study provides new avenues for cascade-amplifying synergistic effects of chemo-photodynamic therapy by boosting drug release during the PDT process.
(A) Schematic illustration of SOHNPCe6/DOX with PDT-activated cascade chemotherapy to synergistically treat cancer cells. The PS-generated SO would selectively cleave the thioketal linkers under 660-nm laser irradiation, leading to nanoparticle destruction and triggering DOX release into the cell nuclei. (B) Hydrodynamic diameters of HNPCe6/DOX or SOHNPCe6/DOX. (C) The UV-Vis absorption spectra of free Ce6, free DOX, HNP, SOHNP, HNPCe6/DOX and SOHNPCe6/DOX.
Results and discussion
Preparation and characterization of SOHNPCe6/DOX
To substantiate our design, a PEGylated hyperbranched polyphosphate containing thioketal linkers (RHPPE) was first synthesized. As shown in Figure S1, RHPPE was obtained through a one-step reaction using hydroxyl-terminated mPEG, phosphorus oxychloride and 2,2'-(propane-2,2-diylbis(sulfanediyl))bis(ethan-1-amine) (PDSE, Figure S2). The successful synthesis of RHPPE was confirmed by 1H (Figure S3) and 13C NMR (Figure S4); every resonance could be assigned to the protons of RHPPE. In addition, the SO non-responsive 1,7-diaminoheptane was used to replace PDSE to synthesize insensitive hyperbranched polyphosphate (HPPE) as a control (1H and 13C spectra are shown in Figure S5-6). Then, the photosensitizer Ce6 and the chemotherapy drug DOX were simultaneously integrated into RHPPE or HPPE through a nanoprecipitation method, and the resultant nanoparticles were denoted SOHNPCe6/DOX and HNPCe6/DOX, respectively. The average diameter of SOHNPCe6/DOX was ~80 nm, similar to that of HNPCe6/DOX (Figure 1B). The UV-vis absorption spectra of SOHNPCe6/DOX and HNPCe6/DOX in aqueous suspension (Figure 1C) showed two characteristic absorption bands at approximately 490 nm and 660 nm, respectively. The loading contents (DLCs) of Ce6 and DOX for SOHNPCe6/DOX were 3.39% and 3.13% (Table S1), respectively, which was similar to that of HNPCe6/DOX. Additionally, SOHNPCe6/DOX and HNPCe6/DOX exhibited excellent stability in the culture media, and their size did not change for at least 120 h (Figure S7), which might be due to stabilization by the PEG layer.
The mechanism of boosted DOX release from SOHNPCe6/DOX during the PDT process
Based on our design, the light irradiation during the PDT process boosted the release of encapsulated DOX from SOHNPCe6/DOX. To verify this speculation, changes in DOX fluorescence of SOHNPCe6/DOX at pH 7.4 and 5.5 were recorded upon 660-nm laser irradiation (0.2 W/cm2). DOX fluorescence was significantly elevated with an extension of the incubation time under 660-nm light irradiation at both pH conditions (Figure 2A). Considering that the fluorescence of DOX was partially quenched in SOHNPCe6/DOX (Figure S8), the elevated DOX fluorescence intensity suggested that the light-induced PDT process boosted the release of encapsulated DOX from SOHNPCe6/DOX. Additionally, DOX release was further enhanced at pH 5.5 (the pH value of endosome/lysosomes), implying that the light-boosted DOX release was more efficient within tumor cells. The accelerated DOX release was more likely attributed to the increased DOX solubility at pH 5.5 [30, 31]. The light-boosted DOX release during the PDT process was further quantitatively evaluated (Figure 2B). Only approximately 8% of DOX was released from SOHNPCe6/DOX and HNPCe6/DOX at 24 h without light irradiation. In contrast, nearly 50% of DOX was released from SOHNPCe6/DOX upon 660-nm laser irradiation (SOHNPCe6/DOX +L, 0.2 W/cm2, 30 min), while such boosted DOX release during the PDT process was not observed for HNPCe6/DOX.
(A) Fluorescence recovery of DOX after light irradiation at pH 7.4 or 5.5. (B) The cumulative release of DOX from HNPCe6/DOX and SOHNPCe6/DOX with or without light irradiation. (C) The cumulative release of DOX from SOHNPCe6/DOX upon 660-nm laser irradiation at different power densities for 30 min. (D) Laser-stimulated pulsed release of DOX from HNPCe6/DOX and SOHNPCe6/DOX at pH 5.5. The samples were irradiated with 660-nm laser for 10 min at different time points indicated by the arrows.
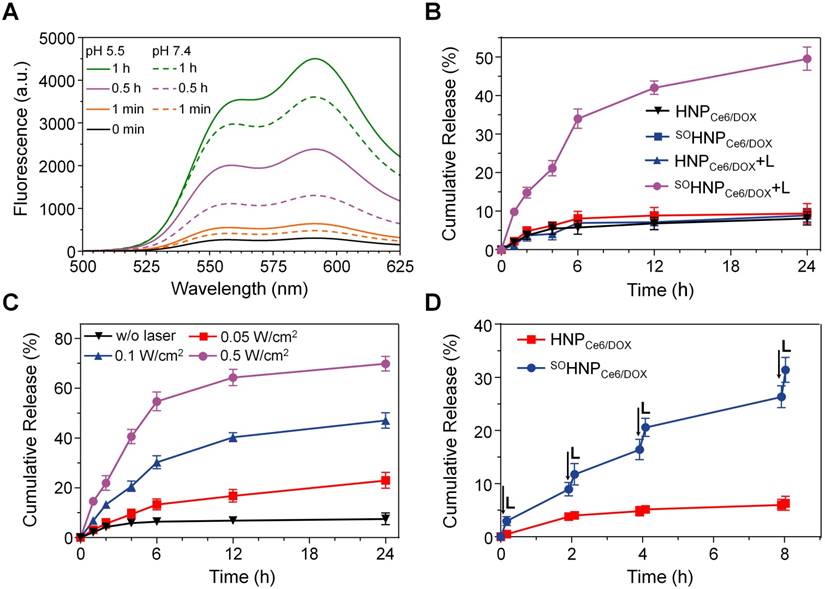
The boosted release properties of DOX from SOHNPCe6/DOX during the PDT process was further evaluated under 660-nm laser irradiation at different power densities. As expected, less than 10% of DOX was released without 660-nm laser irradiation (Figure 2C). When SOHNPCe6/DOX received 660-nm laser irradiation at power densities of 0.05 W/cm2, 0.1 W/cm2, and 0.5 W/cm2, approximately 22.92±3.26%, 47.24±3.08%, and 69.83±2.97% of DOX, respectively, was released from SOHNPCe6/DOX at 24 h, thus exhibiting power density-dependent release behavior. Moreover, to simulate such boosted DOX release within the tumor cells, SOHNPCe6/DOX or HNPCe6/DOX were exposed to 660-nm laser at a power density of 0.2 W/cm2 for 10 min (L+, laser on) and then incubated for 2 h or 4 h in the dark (L-, laser off). As shown in Figure 2D, DOX release from SOHNPCe6/DOX was improved under light irradiation and presented a pulsatile and controlled pattern during the laser on/laser off input cycle, while this phenomenon was insignificant for the HNPCe6/DOX control formulation.
Furthermore, the mechanism of such boosted DOX release during the PDT process was investigated. According to our design, SO was produced by the encapsulated Ce6 during the PDT process, and then the thioketal linkers were rapidly cleaved upon 660-nm light irradiation, which subsequently destroyed the structure of SOHNPCe6/DOX and resulted in light-boosted DOX release. To verify this speculation, SO generation was first detected using 2′,7′-dichlorofluorescin diacetate (DCF-DA) as an indicator, because the green fluorescent signal of DCF was produced in the presence of SO [32-34]. Following 660-nm laser irradiation for 10 min, the fluorescence intensity change of blank nanoparticle SOHNP and HNP groups was negligible (Figure 3A, Ex = 485 nm, Em = 525 nm). However, sharply increased DCF fluorescence was detected in the SOHNPCe6 and HNPCe6 groups under 660-nm light irradiation, suggesting efficient production of SO by the encapsulated Ce6. In addition, the SO production of SOHNPCe6 was significantly attenuated in the presence of vitamin C (an ROS scavenger) [35], which further demonstrated that the SO was produced by the encapsulated Ce6 of SOHNPCe6 and HNPCe6 under 660-nm laser irradiation.
(A) Fluorescence intensity changes of DCF at 525 nm in different groups (PBS, Ce6 in PBS after irradiation, SOHNP in PBS after irradiation, HNPCe6 in PBS after irradiation and SOHNPCe6 in PBS after irradiation). Vitamin C acts as an ROS scavenger. (B) The degradation rates of SOHNP, HNPCe6 and SOHNPCe6 after irradiation with different power densities (L: 0.2 W/cm2, L': 0.1 W/cm2) detected by Ellman's test. (C) Changes in HNPCe6/DOX and SOHNPCe6/DOX diameter after light irradiation. (D) Transmission electron microscopy images of HNPCe6/DOX and SOHNPCe6/DOX with or without light irradiation. The scale bar is 200 nm.
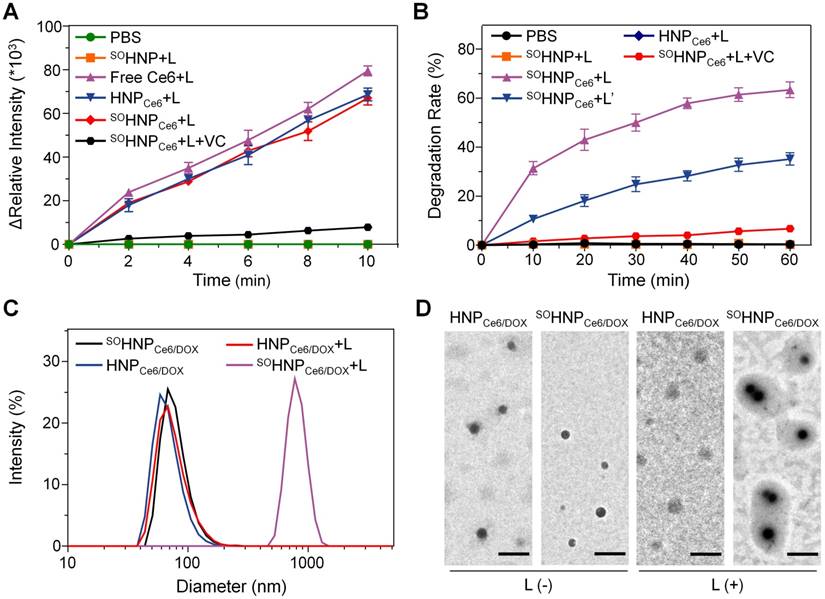
Subsequently, we evaluated whether the produced SO was capable of rapidly cleaving the thioketal linkers of SOHNPCe6. As reported, the thioketal bond would be converted to two thiol terminal groups by SO, and thus, the degradation rate of SOHNP could be calculated by measuring the amount of thiol groups by Ellman's test [36-38]. As shown in Figure 3B, under 660-nm laser irradiation, HNPCe6 and SOHNP degradation was not observed. Notably, the degradation of SOHNPCe6 was clearly detected, exhibiting laser density and time dependencies. For instance, more than 35% and 60% of the thioketal bonds were cleaved after receiving 660-nm laser irradiation for 60 min at power densities of 0.1 W/cm2 and 0.2 W/cm2. Additionally, the presence of vitamin C markedly decelerated the degradation rate, which could be attributed to the produced SO being scavenged by the vitamin C. Additionally, the cleavage of thioketal bonds was further verified by the 1H NMR spectra. As shown in Figure S9, the intensity of the resonance of thioketal protons (peak at ~1.52 ppm) decreased gradually with 660-nm laser irradiation. It was observed that 67.4% of the thioketal was degraded after 60 min of light irradiation through calculating the relative integration. Furthermore, the corresponding size and morphology changes were also analyzed by dynamic light scattering and transmission electron microscopy (Figure 3C-D). The light irradiation exhibited negligible effects on the size and microscopy of HNPCe6/DOX. In contrast, the size of SOHNPCe6/DOX remarkably increased to above 700 nm, which may be attributed to aggregation of the degraded HNPCe6/DOX particles.
Based on the above results, it can be concluded that the SO was produced by the encapsulated Ce6 during the PDT process under 660-nm light irradiation. The produced SO was not only realized PDT for cancer but was also capable of cleaving the thioketal linkers in situ, resulting in the rapid degradation and aggregation of SOHNPCe6/DOX, which consequently boosted DOX release from SOHNPCe6/DOX.
SOHNPCe6/DOX efficiently overcame drug resistance of cancer cells in vitro
To demonstrate the advantage of the boosted DOX release during the PDT process in tumor cells, DOX-resistant MCF-7/ADR cells, which overexpressed P-glycoprotein (P-gp) protein to efflux a broad range of anticancer agents (e.g., DOX), were used to evaluate the subsequent anticancer efficacy [39-41]. The cellular uptake and retention of both SOHNPCe6/DOX and HNPCe6/DOX in MCF-7/ADR cells were first analyzed. MCF-7/ADR cells were incubated with free DOX, SOHNPCe6/DOX, and HNPCe6/DOX for 1 h, 2 h, 4 h, or 8 h, and the intracellular DOX content was then quantitatively determined according to our previously reported method [42, 43]. As shown in Figure 4A, the intracellular DOX content exhibited a time-dependent pattern and gradually elevated as the incubation time increased. At each time point, incubation of both SOHNPCe6/DOX and HNPCe6/DOX with MCF-7/ADR cells led to a significant accumulation of DOX in cells compared with free DOX. For instance, the intracellular DOX contents (normalized to total cellular protein) of the SOHNPCe6/DOX and HNPCe6/DOX groups were 2.304±0.174 and 2.458±0.131 μg/mg protein at 8 h, which were 3.92- and 4.18-fold greater, respectively, than that of free DOX (0.588±0.051 μg/mg protein). SOHNPCe6/DOX and HNPCe6/DOX enter into MCF-7/ADR cells via clathrin and caveolae-mediated endocytosis (Figure S10), which efficiently bypasses the efflux by P-gp [44]. In addition, the efflux of these formulations from MCF-7/ADR cells was also determined. MCF-7/ADR cells were incubated with SOHNPCe6/DOX and HNPCe6/DOX at a DOX concentration of 10 μg/mL for 6 h. In addition, to avoid the initial concentration effect, the free DOX group was elevated to 50 μg/mL. Subsequently, these formulations were replaced with fresh culture medium, and then, the intracellular DOX content was tracked. As shown in Figure 4B, almost 90% of the free drug was effluxed out of the cells after further incubation for 6 h, while 44.23% and 45.07% of the DOX was still retained within the DOX-resistant MCF-7/ADR.
(A) Total intracellular DOX in MCF-7/ADR cells after incubation with free DOX, HNPCe6/DOX, or SOHNPCe6/DOX for 1, 2, 4 or 8 h. The dose of DOX (free DOX or equivalent) was 4 μg/mL in the cell culture. *p < 0.05. (B) Retention of DOX in MCF-7/ADR cells after preincubation with DOX, SOHNPCe6/DOX or HNPCe6/DOX. The concentration of total DOX in the free DOX preincubation was 50 μg/mL, while it was 10 μg/mL in the SOHNPCe6/DOX or HNPCe6/DOX groups. *p < 0.05 compared with HNPCe6/DOX or SOHNPCe6/DOX. (C) Geometric mean fluorescence intensity (GMFI) of MCF-7/ADR cells after treatment with free DOX, HNPCe6/DOX, HNPCe6/DOX plus laser, SOHNPCe6/DOX or SOHNPCe6/DOX plus laser. The power density of the 660-nm laser was 0.1 W/cm2. Data were collected from flow cytometric analyses (n = 3). *p < 0.05. (D) Assessment of the intracellular DOX release and biodistribution of HNPCe6/DOX or SOHNPCe6/DOX in MCF-7/ADR cells with continuous 660-nm laser irradiation (0.1 W/cm2) (scale bar: 50 μm). The concentration of DOX in the cell culture was 6 μg/mL. Acidic endosomes/lysosomes and cell nuclei were stained with LysoTrackerTM Green (green) and DAPI (blue), respectively.
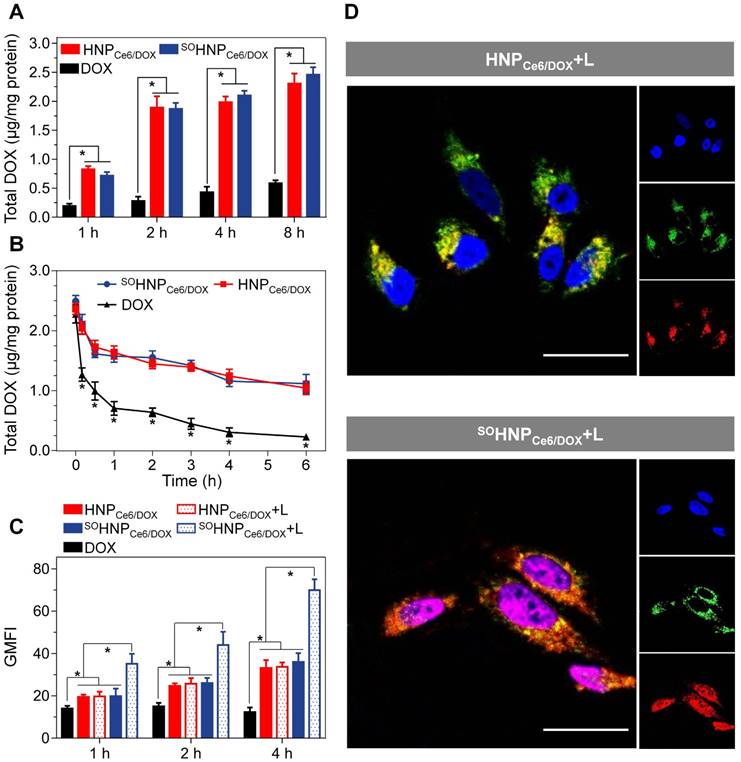
Subsequently, we further evaluated whether such boosted DOX released during the PDT could be realized within tumor cells. For this aim, MCF-7/ADR cells were incubated with SOHNPCe6/DOX or HNPCe6/DOX for 1 h and then washed twice, exposed to 660-nm laser irradiation for 15 min, and collected for flow cytometry analysis. As shown in Figure 4C, without light irradiation, the SOHNPCe6/DOX and HNPCe6/DOX groups showed comparable intracellular fluorescence signals that were much higher than that of free DOX at each time point, which is in good agreement with the result shown in Figure 4A. The 660-nm laser irradiation did not remarkably increase the fluorescence intensity of DOX when MCF-7/ADR cells were treated with HNPCe6/DOX (HNPCe6/DOX+L). In contrast, cells incubated with SOHNPCe6/DOX plus 660-nm laser irradiation (SOHNPCe6/DOX+L) exhibited significantly stronger intracellular fluorescence than those that did not receive 660-nm laser irradiation. As intracellular SO was generated after laser activation (Figure S11) and the fluorescence of DOX was partially quenched in SOHNPCe6/DOX (Figure S8), the elevated DOX fluorescence intensity was due to the SO-enhanced release of DOX, demonstrating that the light-induced PDT process boosted the release of encapsulated DOX from SOHNPCe6/DOX.
Such boosted DOX release during the PDT process for SOHNPCe6/DOX was further visualized with confocal laser scanning microscopy (CLSM). In the absence 660-nm laser irradiation, the fluorescence signals of DOX were mainly co-localized in lyso/endosomes when the cells were treated with HNPCe6/DOX and SOHNPCe6/DOX (Figure S12). After 660-nm laser irradiation, the DOX signal in the SOHNPCe6/DOX group was mainly observed in cell nuclei (Figure 4D), which further verified that the light-induced PDT process boosted the release of encapsulated DOX from SOHNPCe6/DOX. In contrast, the light irradiation did not affect the co-localization of lyso/endosomes and DOX in the tumor cells, because of the inefficient DOX release from HNPCe6/DOX during the PDT process.
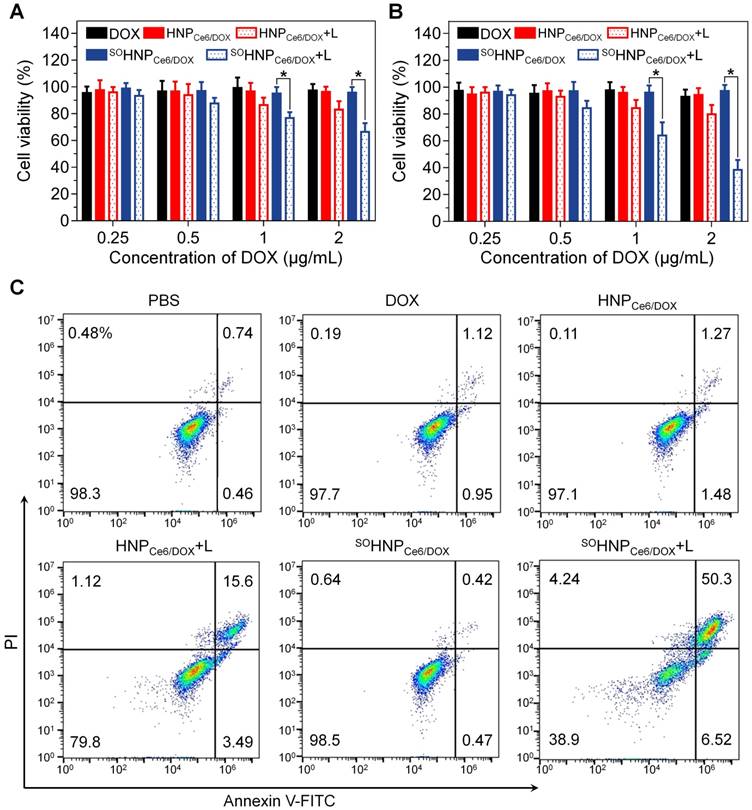
Rapid intracellular DOX release from nanoparticles has been demonstrated to be beneficial in terms of overcoming drug resistance. Based on the above results, it is reasonable to propose that such boosted intracellular DOX release during the PDT process could be beneficial in terms of enhancing the cancer cell-killing efficacy and overcoming drug resistance. Thereby, the anticancer efficacy of SOHNPCe6/DOX and the controlled formulations against MCF-7/ADR cells were evaluated using a 3-(4,5-dimethylthiazol-2-yl)-2,5-diphenyltetrazolium bromide (MTT) assay. The MCF-7/ADR cells were incubated with the above-mentioned formulations for 12 h, washed with FBS-free medium, exposed to 660-nm laser irradiation, and further cultured for 12 h or 60 h for MTT assay (Figure 5A-B). As expected, free DOX at concentrations of 0.25, 0.5, 1 and 2 μg/mL exhibited no noticeable cytotoxicity to MCF-7/ADR cells at 24 h and 72 h. Similarly, treatment with HNPCe6/DOX and SOHNPCe6/DOX in the absence of 660-nm laser irradiation also showed negligible cytotoxicity. HNPCe6/DOX (HNPCe6/DOX+L) showed moderately higher cytotoxicity after laser irradiation than without laser irradiation, which could be due to the PDT effect of the encapsulated Ce6. In addition, the cell viability was decreased to 80.46±6.31% (Figure 5B) at the highest DOX concentration at 72 h. In contrast, the SOHNPCe6/DOX plus light irradiation (SOHNPCe6/DOX+L) group exhibited much higher anticancer efficacy than the HNPCe6/DOX+L group, and nearly 60% of MCF-7/ADR cells were destroyed at 72 h at the highest DOX concentration. Compared with the HNPCe6/DOX+L group, the enhanced anticancer efficacy could be attributed to the boosted DOX released during the PDT process. In addition, it is worth noting that treatment with SOHNPDOX and HNPDOX plus 660-nm light induced negligible toxicity and was biocompatible with the MCF-7/ADR cells (Figure S13). Moreover, the synergistic anticancer effect was further evaluated by determining cell apoptosis. Following staining with Annexin-V-FITC and propidine iodide (PI), incubation with SOHNPCe6/DOX plus 660-nm irradiation induced the highest cell apoptosis (56.82%), while SOHNPCe6/DOX without the light-activated drug release behavior did not promote cell apoptosis.
Cytotoxicity of DOX, HNPCe6/DOX, or SOHNPCe6/DOX against MCF-7/ADR cells. The cells were incubated with nanoparticles for 12 h. After laser exposure for 30 min, the cells were further incubated with fresh medium for 12 h (A) or 60 h (B). The laser power density was 0.1 W/cm2. *p < 0.05. (C) Flow cytometry analysis of MDA-MB-231 cell apoptosis induced by different formulations based on Annexin V-FITC/PI staining. Early apoptotic cells are shown in the lower right quadrant, and late apoptotic cells are shown in the upper right quadrant.
Pharmacokinetics and biodistribution of SOHNPCe6/DOX in vivo
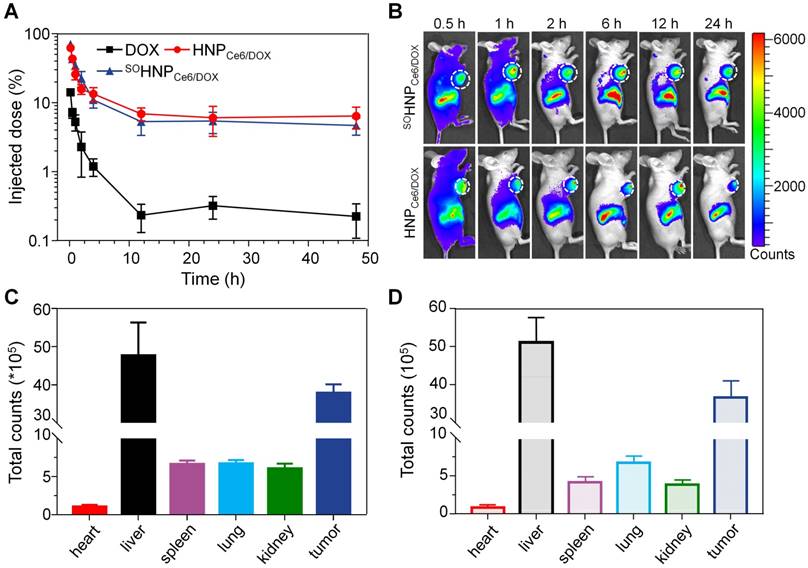
Encouraged by the superior anticancer efficacy of SOHNPCe6/DOX under 660-nm laser in vitro, we then carried out in vivo animal experiments to confirm our hypothesis that the boosted DOX release during the PDT process could significantly improve the anticancer efficacy. To evaluate the anticancer efficacy, the pharmacokinetics and biodistribution of SOHNPCe6/DOX and HNPCe6/DOX were first determined. It was clearly observed that HNPCe6/DOX and SOHNPCe6/DOX exhibited comparable pharmacokinetic curves, which significantly prolonged circulation compared with free DOX (Figure 6A). In comparison with free DOX, both nanoparticles significantly increased the area under the curve (AUC) by 12.53 and 11.26 orders of magnitude, respectively (Table S2). Additionally, SOHNPCe6/DOX and HNPCe6/DOX showed comparable DOX accumulation in tumor tissues at either 0.5 h, 1 h, 2 h, 6 h, 12 h or 24 h post-injection (Figure 6B) by using a Xenogen IVIS® Lumina system. After the mice were sacrificed, the total fluorescence counts in different organs from both groups were measured. A similar phenomenon was observed in that DOX accumulation in the main organ and tumor tissue was similar (Figure S14). The region-of-interest (ROI) analysis shown in Figure 6C-D further confirmed this result.
(A) Pharmacokinetic profiles of DOX after intravenous administration of different DOX formulations (mean±SD, n = 4). (B) In vivo fluorescence images of the MCF-7/ADR tumor-bearing mice at 0.5, 1, 2, 6, 12 and 24 h after i.v. injection of SOHNPCe6/DOX or HNPCe6/DOX. The tumor site was circled with a white line. Semiquantitative biodistribution of SOHNPCe6/DOX (C) and HNPCe6/DOX (D) in various organs at 24 h determined by the Ce6 fluorescence intensity. The data are shown as the mean±SD.
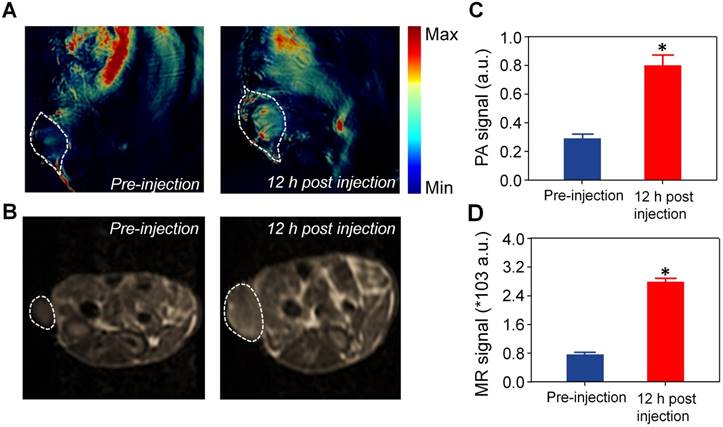
Precisely focusing the laser beam on the tumor area is critical for realizing the boosted DOX release during the PDT process. The tumor areas could be detected by photoacoustic (PA) and magnetic resonance (MR) bimodal imaging of SOHNPCe6/DOX. SOHNPCe6/DOX with strong absorbance at 680 nm can be employed for in vivo PA imaging using a Nexus 128 PA imaging system. As shown in Figure 7A, C, intravenous injection of SOHNPCe6/DOX exhibited significantly enhanced PA signals in the tumor tissue after 12 h post-injection; the quantitative results demonstrate that SOHNPCe6/DOX exhibited a 2.87-fold higher PA signal at tumor sites 12 h post-injection. In addition, Ce6 has been demonstrated to be a chelating agent that captures Gd3+ for MR imaging [45, 46]. In comparison with commercial Magnevist® (gadopentetate dimeglumine), the relaxivity (r1) of SOHNPCe6-Gd/DOX and HNPCe6-Gd/DOX was increased to 13.08 mM-1s-1 (Figure S15), which was measured by using a 3T MRI scanner. At 12 h post-systemic injection of SOHNPCe6-Gd/DOX, the significantly enhanced T1 signals were observed at the tumor sites (Figure 7B, D). Collectively, based on PA and MR bimodal imaging, the 660-nm laser could be precisely focused on the tumor areas to boost DOX release from SOHNPCe6/DOX during PDT process.
(A) PA imaging of tumor regions imaged before and 12 h post-injection of SOHNPCe6/DOX nanoparticles. The tumor site was circled with a white line. (B) T1-weighted tumor contrast enhancement before and 12 h post-injection of SOHNPCe6/DOX nanoparticles. The tumor site was circled with a white line. Semiquantitative analysis of the PA (C) and MR signal (D) in the tumor site, as performed in (A) and (B). *p < 0.05.
Under the guidance of PA and MR bimodal imaging, the in vivo anticancer efficacy of SOHNPCe6/DOX under 660-nm laser irradiation was subsequently evaluated in MCF-7/ADR tumor-bearing mice. A total of 35 tumor-bearing mice were randomly divided into seven groups (n = 5). Various samples were administered via the tail vein at a DOX concentration of 2.5 mg/kg or a Ce6 concentration of 2.0 mg/kg. Under the guidance of the PA and MR bimodal imaging, the tumor tissue was precisely irradiated with 660-nm laser light 12 h post-injection. The tumor sizes were monitored over the following 16 days (Figure 8A). Treatment with free DOX did not show tumor growth inhibition compared with PBS treatment due to the DOX resistance of MCF-7/ADR tumor xenografts. Administration of HNPCe6/DOX without laser irradiation slightly induced tumor growth inhibition, and treatment with HNPCe6/DOX with 660-nm laser irradiation (HNPCe6/DOX +L) led to slight inhibition of tumor growth because of the PDT effect. In contrast, treatment with SOHNPCe6/DOX plus laser irradiation (SOHNPCe6/DOX+L) resulted in the highest inhibition efficacy toward tumor growth (p < 0.05), while the SOHNPCe6 plus laser irradiation (SOHNPCe6+L, PDT effect) and SOHNPCe6/DOX without laser irradiation (chemotherapy) groups only mildly inhibited tumor growth, indicating that the boosted DOX release during the PDT process could significantly induce cascade-amplifying synergistic effects of chemo-photodynamic therapy. The boosted DOX released from SOHNPCe6/DOX was capable of arousing a cascade of chemotherapy to synergistically destroy the remaining tumor cells after previous PDT, thus realizing the synergistic therapeutic effects of chemo-photodynamic therapy with great antitumor efficacy.
(A) Tumor growth inhibition in MCF-7/ADR tumor xenograft-bearing nude mice after different treatments (n = 5). The injections were performed on days 0, 7 and 14 with an equivalent DOX dose of 2.5 mg/kg or a Ce6 dose of 2.0 mg/kg (mean±SD, n = 5). *p < 0.05. (B) The weight of the MCF-7/ADR xenograft tumor mass excised after the treatment. (C) Body weight monitoring of the mice that received treatment with various samples. (D) Enzyme-linked immunosorbent examination of mouse alanine aminotransferase (ALT, U/L), aspartate transaminase (AST, U/L) and blood urea nitrogen (BUN, 10 μmol/L) in the serum after receiving different treatments. *p < 0.05, vs. DOX.
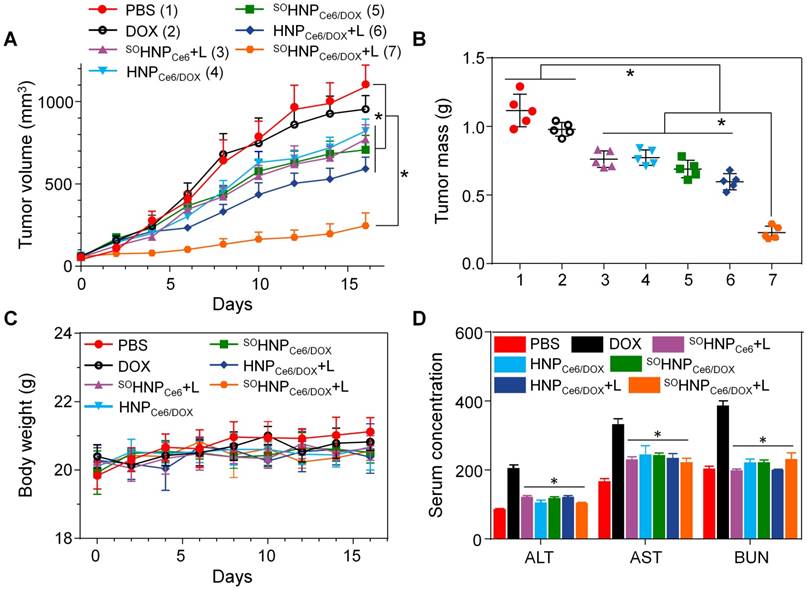
In addition, inspection of the tumor weight in Figure 8B after treatment also indicated that the SOHNPCe6/DOX+L group exhibited the highest anticancer effect among these formulations. Furthermore, the immunohistochemical studies of tumor slices were highly supportive of the anticancer effect after the treatment (Figure S16). Extensive regions of apoptotic (TUNEL-positive) and non-proliferative cells (Ki67-negative) were observed in mice treated with SOHNPCe6/DOX+L. It should be noted that the body weight of the mice treated with these formulations showed no noticeable change during the therapeutic period (Figure 8C). Furthermore, the hematoxylin and eosin (H&E) stained images of major organs (Figure S17) and the analysis of alanine aminotransferase, aspartate aminotransferase and blood urea nitrogen (Figure 8D) also demonstrated that polyphosphate-based SOHNPCe6/DOX had no obvious toxicity to the liver and kidney. In comparison with the control group, hematological assessment (Figure S18) showed no significant differences among all the examined parameters after SOHNPCe6/DOX+L treatment, suggesting that SOHNPCe6/DOX enhanced the therapeutic efficacy toward MCF-7/ADR tumors without obvious side effects.
Conclusion
We successfully synthesized an SO-responsive hyperbranched polyphosphate and then used this polymer to simultaneously encapsulate Ce6 and DOX to confer cascade-amplifying synergistic therapeutic effects of chemo-photodynamic therapy. The obtained nanocarrier SOHNPCe6/DOX can produce SO under 66-nm light irradiation, which not only can induce tumor cell death through the PDT effect but can also rapidly destroy the structure of SOHNPCe6/DOX. The disassembled nanoparticles subsequently boosted DOX release during the light-induced PDT process in vitro and in vivo, thus activating cascaded chemotherapy to synergistically destroy the remaining tumor cells after the initial round of PDT. In addition, the nanocarrier SOHNPCe6/DOX could also precisely detect the tumor area by PA and MR bimodal imaging. Under the guidance of bimodal imaging, the SOHNPCe6/DOX realized cascade-amplifying synergistic therapeutic effects of chemo-photodynamic therapy, resulting in superior anticancer activity even in the DOX-resistant tumor model. This study provides a promising avenue for cascade-amplifying therapeutic effects of chemo-photodynamic therapy.
Methods
Materials and characterization
Monomethoxy poly(ethylene glycol) (mPEG, Sigma-Aldrich Chemical) with a molecular weight of 2000 was dried by azeodistillation of anhydrous toluene twice before use. Phosphorus oxychloride (Xiya Reagent) was distilled under reduced pressure just before use. Chloroform (CHCl3) was obtained from Duksan Pure Chemicals Co., Ltd. (Korea) and purified through a Vigor solvent purification system. 1,7-Diaminoheptane was purchased from TCI Shanghai Development Co., Ltd. 3-(4,[zol-2-yl)-2,5-diphenyl tetrazolium bromide (MTT) was purchased from Sigma-Aldrich Chemical Co., Ltd. Chlorin e6 (Ce6) was obtained from J&K Chemical Ltd. Doxorubicin (DOX) was purchased from Wuhan Dahua Co. Ltd. All other reagents and solvents were of analytical grade and used as received.
The proton nuclear magnetic resonance (1H NMR) spectra were recorded in deuterated dimethyl sulfoxide (DMSO-d6) on a 400-MHz spectrometer (Avance Ш, Bruker, Germany). The size and zeta potential measurements were carried out in aqueous solution using a Malvern ZS90 dynamic light scattering instrument with a He-Ne laser (633 nm) and 90° collecting optics. The data were analyzed using Malvern Dispersion Technology Software 5.10. Transmission electron microscopy (TEM) measurements were made using a JEOL 2010 high-resolution transmission electron microscope with an accelerating voltage of 200 kV. The concentrations of Ce6 and DOX were determined by Agilent high-performance liquid chromatography (HPLC) according to previous methods [42, 47].
Cell lines and animals
The human breast adenocarcinoma (MCF-7) cell line was obtained from the American Type Culture Collection (ATCC, MD, USA), and the P-gp overexpressing human breast carcinoma cell line (DOX-resistant MCF-7 cell line, MCF-7/ADR) was kindly provided by Prof. Jun Wang (University of Science and Technology of China). Both cell types were cultured in RPMI 1640 medium (Gibco, China) supplemented with 10% fetal bovine serum (FBS, ExcellBio, China) at 37 °C using a humidified 5% CO2 incubator. MCF-7/ADR cells were maintained with free DOX at 5 μg/mL. BALB/c nude mice (female, 6 weeks old) and ICR mice (6 weeks old) were purchased from Vital River Laboratory Animal Technology Co., Ltd. (Beijing, China). All animals received care in compliance with the guidelines outlined in the Guide for the Care and Use of Laboratory Animals, and all procedures were approved by the Tianjin Medical University Animal Care and Use Committee. The xenograft tumor model was generated by injection of 5×10⁶ MCF-7/ADR cells (100 μL) with 50% Matrigel® Matrix (Corning, Bedford, MA) into the mammary fat pad of female BALB/c nude mice.
Synthesis of PDSE
In a typical reaction, a mixture of cysteamine hydrochloride (11.36 g, 100 mmol) and anhydrous acetone (15.6 g, 269 mmol) were saturated with dry hydrogen chloride and stirred at room temperature for 8 h. After the reaction, the product was filtered and washed twice with chloroform. Then, the product was dried and recrystallized from 6 M NaOH aqueous solution three times. Finally, the product was extracted with CH2Cl2 to obtain the product (6.33 g, 65% yield).
Synthesis of SO-responsive hyperbranched copolymer
Anhydrous mPEG (0.500 g, 0.25 mmol) was dissolved in 10 mL dry chloroform, and phosphorus oxychloride (0.450 g, 2.93 mmol) in 10 mL of CHCl3 was then added. After stirring for 2 h at 25 ºC, the mixture was added slowly to a CHCl3 solution of PDSE (1 g, 5.2 mmol) and triethylamine (1.26 g, 12.5 mmol) at -5 ºC. After reaction for 12 h, the salts were removed by filtration, and the liquid phase was washed by dilute hydrochloric acid (1 M), saturated NaHCO3 aqueous solution and saturated brine. The organic phase was separated, collected, dried with magnesium sulfate anhydrous and precipitated into anhydrous diethyl ether at 0 ºC twice. The obtained product was dried to give a pale-yellow powder with a typical yield of approximately 79%. The non-responsive hyperbranched copolymer was synthesized by a similar method while the PDSE was replaced by 1,7-diaminoheptane.
Preparation of nanoparticles
The corresponding nanoparticles were fabricated using a solvent exchange method. Briefly, 10 mg RHPPE or HPPE was dissolved in 0.5 mL DMSO. Under moderate stirring, 5 mL ultrapurified water (Millipore Milli-Q Synthesis, 18.2 MΩ) was immediately added. The mixture was stirred for 15 min at ambient temperature, followed by dialysis to remove the organic solvents (Spectra/Por, Float-A-Lyzer, MWCO 3500). The obtained nanoparticles were denoted SOHNP or HNP, respectively. For Ce6/DOX loading, 10 mg RHPPE or HPPE were mixed with 1 mg DOX and 1 mg Ce6 in 0.5 mL DMSO, and 5.0 mL H2O was immediately added. The DMSO was removed by dialysis. After centrifugation at 3000 ×g to remove unencapsulated photosensitizer/drug, the obtained nanoparticles were denoted SOHNPDOX/Ce6 or HNPDOX/Ce6, respectively. The DLC and encapsulation efficiency (EE) of Ce6 and DOX were determined by the UV-vis method at 660 nm and 490 nm after the lyophilized nanoparticles were dissolved in DMSO.
Production of SO under 660-nm laser irradiation
The generation of SO from Ce6-loaded nanoparticles under laser irradiation was detected by dichlorofluorescein diacetate. [28] First, SOHNPCe6, HNPCe6 and SOHNP were prepared as described above and incubated in phosphate buffer (PB, 20 mM) at pH 7.4. Second, 1.0 mL dichlorfluorescein diacetate in ethanol was mixed with 4.0 mL NaOH aqueous solution (10 mM) for 1 h at room temperature. Then, the mixture was transferred to the PBS containing nanoparticles on ice. The nanoparticles in the above solution were exposed to 660-nm laser with a power density of 0.2 W/cm2. The emission fluorescence change at 525 nm was recorded when excited at 485 nm.
Degradation measurements of nanoparticles
SOHNPCe6, HNPCe6 and SOHNP prepared as described above were suspended in phosphate buffer at pH 7.4 at a Ce6 concentration of 2.5 μg/mL. The nanoparticles were then exposed to 660-nm laser with the power density of 0.2 W/cm2. The degradation rate at 10, 20, 30, 40, 50 and 60 min were detected by the 5,5'-dithiobis(2-nitrobenzoic acid) (DTNB) method, as reported in a previous study [48].
DOX release in vitro
The doxorubicin release profiles from SOHNPCe6/DOX or HNPCe6/DOX in vitro were studied in a buffer solution at pH 7.4 or 5.5, respectively. DOX-loaded nanoparticles were transferred into a dialysis tube and immersed in 15 mL buffer at 37 °C. At the predetermined time, the inner buffer was irradiated by 660-nm laser (0.2 W/cm2), and the external buffer was collected to measure the concentration of DOX via HPLC analysis after lyophilization. The tube was immersed in fresh buffer prewarmed to 37 °C for further release experiments.
Cellular internalization of nanoparticles in vitro
MCF-7/ADR cells were seeded in 24-well plates at a density of 5 × 10⁴ cells per well in 0.5 mL RPMI 1640 medium overnight. DOX, SOHNPCe6/DOX or HNPCe6/DOX were incubated at pH 7.4 for 2 h, washed twice with cold PBS and harvested by trypsin treatment. The harvested cells were further washed twice with PBS by centrifuging at 152 ×g for 5 min at 4 °C. After two cycles of washing and centrifugation, the intracellular fluorescence of DOX was detected by flow cytometry (BD FACSVerse). Additionally, cells treated with DOX, SOHNPCe6/DOX or HNPCe6/DOX were similarly washed with cold PBS twice and lysed with 1% Triton X-100 in PBS (250 μL) at 37 °C for 30 min, followed by three freeze-thaw cycles. The concentration of DOX in the cell lysates was measured by HPLC, which was normalized to the total cellular protein content determined by a BCA Protein Assay Kit (Pierce, Rockford, IL).
Laser-triggered intracellular drug release in vitro
MCF-7/ADR cells were seeded in 24-well plates at a density of 5 × 10⁴ cells per well in 0.5 mL RPMI 1640 medium overnight. SOHNPCe6/DOX or HNPCe6/DOX were incubated at pH 7.4 for 2 h. Then, the medium was replaced with fresh RPMI 1640 medium, and the cells were irradiated by 660-nm laser for 15 min. After irradiation, the cells were further incubated at 37 °C for 2 h, washed twice with cold PBS and harvested by trypsin treatment. The harvested cells were further washed twice with PBS by centrifuging at 152 ×g for 5 min at 4 °C. After two cycles of washing and centrifugation, the intracellular fluorescence of DOX was detected by flow cytometry.
For CLSM observations, MCF-7/ADR cells were seeded onto 12-mm coverslips in 24-well plates with 20,000 cells per well in 0.5 mL RPMI 1640 medium and incubated in a humidified 5% CO2 atmosphere for 12 h. SOHNPCe6/DOX or HNPCe6/DOX were incubated at pH 7.4 for 2 h. Then, the medium was replaced with fresh RPMI 1640 medium without nanoparticles, and the cells were irradiated by a 660-nm laser for 15 min. After irradiation, the cells were further incubated at 37 °C. After 2 h of incubation, the cells were washed with cold PBS and fixed with 4% paraformaldehyde for 15 min at room temperature; they were then stained with LysotrackerTM Green (Invitrogen, Carlsbad, CA) and 4ʹ,6-diamidino-2-phenylindole (DAPI) sequentially following the standard protocol of the manufacturer before imaging on an Olympus FV1200 confocal microscope.
In vitro cytotoxicity
MCF-7/ADR cells were seeded in 96-well plates at 5000 cells per well in 100 µL complete 1640 medium supplemented with 10% FBS. Subsequently, the cells were incubated with 1640 medium containing SOHNPCe6/DOX or HNPCe6/DOX with different concentrations of DOX for 12 h. Then, the culture medium was replaced with fresh complete 1640 medium at pH 7.4 and exposed to light irradiation with a power density of 0.1 W/cm2 for 30 min. After irradiation, the cells were further incubated at 37 °C for 12 or 60 h, and MTT stock solution was added to the wells to achieve a final concentration of 1 mg/mL. After incubation for another 2 h, 100 µL extraction buffer (20% SDS in 50% N,N-dimethylformamide, pH 4.7, prepared at 37 °C) was added and incubated overnight at 37 °C. The absorbance was measured at 570 nm using a Bio-Rad 680 microplate reader (Bio-Rad, USA). Cell viability was normalized to that of cells cultured in the culture medium with PBS treatment, which served as the indicator of 100% cell viability.
Apoptosis assay
MCF-7/ADR cells were seeded in the 12-well plates (10×104 cells/well). After incubation at 37 °C overnight, the medium was replaced with fresh RPMI 1640 medium containing DOX, SOHNPCe6/DOX or HNPCe6/DOX ([DOX] = 2 μg/mL). After incubation for 12 h, MCF-7/ADR cells were washed twice with PBS and exposed to 660-nm laser at a power of 0.1 W/cm2 for 30 min. The cells were further incubated for 60 h, collected and treated using an Annexin V-FITC apoptosis detection kit I (BD Biosciences) according to the manufacture's procedure.
Pharmacokinetic studies
Female 6-week-old ICR mice were used to study the pharmacokinetics of SOHNPCe6/DOX and HNPCe6/DOX. DOX-loaded SOHNPCe6/DOX and HNPCe6/DOX in PBS (0.01 M, pH 7.4) were injected intravenously into the tail vein at an equivalent dose of 10 mg DOX per kg of mouse body weight (n = 5 for each group). After a predetermined time (0.167, 0.5, 1, 2, 6, 12, 24 and 48 h), blood samples were collected from the retro-orbital plexus of the mouse eye, and 100 μL of plasma was obtained. The concentration of DOX in the plasma was analyzed according to previously reported method. [43]
Biodistribution of SOHNPCe6/DOX in vivo
Following intravenous injection of SOHNPCe6/DOX into nude mice bearing MCF-7/ADR xenografts, the in vivo fluorescence distribution in tumor-bearing mice was detected at predetermined time points by using a Xenogen IVIS® Lumina system (Caliper Life Sciences, USA). At 24 h post-injection, the mice were sacrificed, and the solid tumor tissues were collected, washed with PBS, and imaged by the Xenogen IVIS Lumina system. The quantitative distribution of DOX in various tissues was detected according to the previous method. [43]
Furthermore, to evaluate in vivo tumor PA/MR imaging, SOHNPCe6/DOX at the dose of 5 mg/kg Ce6 was intravenously injected into the mice bearing MCF-7/ADR tumors. Then, the tumor region of the mice was observed using an Endra Nexus 128 with an excitation wavelength of 680 nm or a 3.0 T clinical MR system with a small animal receiver coil (GE Signa Excite). The imaging intensity at the tumor was analyzed at different time points. The statistical differences were analyzed using t-tests, where a P value of <0.05 was considered significant.
Tumor growth inhibition in vivo
The mice bearing the MCF-7/ADR xenograft were divided randomly into seven groups and received an intravenous injection once a week of PBS, free DOX (2.5 mg/kg), SOHNPCe6/DOX, HNPCe6/DOX (equivalent DOX dose of 2.5 mg/kg) or SOHNPCe6 (equivalent Ce6 dose of 2.0 mg/kg) when the tumor volume was approximately 50 mm3. Tumor growth was monitored every 2 days using calipers to measure the perpendicular diameters. The tumor volume was calculated using the following formula: tumor volume = 0.5 × length × width2.
The day after the last evaluation time point, the tumor tissue was excised and fixed with 4% paraformaldehyde overnight at 4 °C and embedded in paraffin for analysis. The tissue sections (6 μm) were stained with H&E. Paraffin-embedded 5-μm tumor sections were obtained for terminal transferase dUTP nick end labeling (TUNEL) or Ki67 assay immunohistochemical staining.
In vivo toxicity studies
Mice were treated daily with various formulations at a dose of 2.5 mg/kg DOX for three days, and then euthanized on day 4. Serum was collected and mouse alanine aminotransferase (ALT), aspartate transaminase (AST) and blood urea nitrogen (BUN) were measured using quantitative enzyme-linked immunosorbent assay (ELISA) kits, following validation of each ELISA kit, according to the manufacturer's instructions. Absorbance was read using a Bio-Rad microplate reader (Hercules, CA, USA) at 450 nm.
For organ damage analysis, mice were euthanized after the ELISA study, and major organs were collected and fixed in 4% (w/v) PBS-buffered paraformaldehyde overnight and finally embedded in paraffin. The paraffin-embedded organ tissues were cut to a thickness of 5 µm, stained with H&E and observed by optical microscope (Nikon, TE2000U).
Statistical analysis
The statistical significance of treatment outcomes was assessed using Student's t-test (two-tailed); p < 0.05 was considered statistically significant in all analyses (95% confidence level).
Abbreviations
ALT: alanine aminotransferase; AST: aspartate aminotransferase; AUC: area under the curve; BUN: blood urea nitrogen; Ce6: chlorin e6; CLSM: confocal laser scanning microscopy; DAPI: 4ʹ,6-diamidino-2-phenylindole; DCF-DA: 2',7'-dichlorofluorescin diacetate; DLC: loading content; DMSO: dimethyl sulfoxide; DOX: doxorubicin; EE: encapsulation efficiency; FBS: fetal bovine serum; GMFI: geometric mean fluorescence intensity; HPLC: high-performance liquid chromatography; HPPE: insensitive hyperbranched polyphosphate; mPEG: monomethoxy poly(ethylene glycol); MR: magnetic resonance; MSNs: mesoporous silica nanoparticles; MTT: 3-(4,5-dimethylthiazol-2-yl)-2,5-diphenyltetrazolium bromide; NMR: nuclear magnetic resonance; PA: photoacoustic; PB: phosphate buffer; PDSE: 2,2'-(propane-2,2-diylbis(sulfanediyl))bis(ethan-1-amine); PDT: photodynamic therapy; PEG: polyethylene glycol; P-gp: P-glycoprotein; PI: propidine iodide; PSs: photosensitizers; RHPPE: SO-responsive PEGylated hyperbranched polyphosphates; ROI: region-of-interest; ROS: reactive oxygen species; SDS: sodium dodecyl sulfate; SO: singlet oxygen; TEM: transmission electron microscope; TUNEL: TdT-mediated dUTP nick end labeling; UV-vis: ultraviolet-visible.
Supplementary Material
Supplementary figures and tables.
Acknowledgements
This work was supported by the National Natural Science Foundation of China (51603150, 51473043, 51773067), the National Key R&D Program of China (2017YFA0205601), and Tianjin Municipal Science and Technology Commission (17JCQNJC02200). The authors thank Prof. Chun-Sheng Kang and Dr. Qi-Xue Wang for the help with confocal microscopy observation.
Competing Interests
The authors have declared that no competing interest exists.
References
1. Agostinis P, Berg K, Cengel KA, Foster TH, Girotti AW, Gollnick SO. et al. Photodynamic therapy of cancer: an update. CA Cancer J Clin. 2011;61:250-81
2. Lucky SS, Soo KC, Zhang Y. Nanoparticles in photodynamic therapy. Chem Rev. 2015;115:1990-2042
3. Dolmans D, Fukumura D, Jain RK. Photodynamic therapy for cancer. Nat Rev Cancer. 2003;3:380-7
4. Fan WP, Huang P, Chen XY. Overcoming the Achilles' heel of photodynamic therapy. Chem Soc Rev. 2016;45:6488-519
5. Liu K, Xing RR, Zhou QL, Ma GH, Möhwald H, Yan XH. Simple peptide-tuned self-assembly of photosensitizers towards anticancer photodynamic therapy. Angew Chem Int Ed. 2016;55:3036-9
6. Zhuang XX, Ma XW, Xue XD, Jiang Q, Song LL, Dai LR. et al. A photosensitizer-loaded DNA origami nanosystem for photodynamic therapy. ACS Nano. 2016;10:3486-95
7. Tian JW, Zhou JF, Shen Z, Ding L, Yu JS. A pH-activatable and aniline-substituted photosensitizer for near-infrared cancer theranostics. Chem Sci. 2015;6:5969-77
8. Brown SB, Brown EA, Walker I. The present and future role of photodynamic therapy in cancer treatment. Lancet Oncol. 2004;5:497-508
9. Ethirajan M, Chen YH, Joshi P, Pandy RK. The role of porphyrin chemistry in tumor imaging and photodynamic therapy. Chem Soc Rev. 2011;40:340-62
10. Wang GD, Nguyen HT, Chen HM, Cox PB, Wang LC, Nagata K. X-Ray induced photodynamic therapy: a combination of radiotherapy and photodynamic therapy. Theranostics. 2016;6:2295-305
11. Peterson CM, Lu JM, Sun Y, Peterson CA, Shiah JG, Straight RC. et al. Combination chemotherapy and photodynamic therapy with N-(2-hydroxypropyl)methacrylamide copolymer-bound anticancer drugs inhibit human ovarian carcinoma heterotransplanted in nude mice. Cancer Res. 1996;56:3980-5
12. Huang HC, Mallidi S Liu J, Chiang CT Mai ZM, Goldschmidt R et al. Photodynamic therapy synergizes with irinotecan to overcome compensatory mechanisms and improve treatment outcomes in pancreatic cancer. Cancer Res. 2016;76:1066-77
13. Cheng L, Wang C, Feng LZ, Yang K, Liu Z. Functional nanomaterials for phototherapies of cancer. Chem Rev. 2014;114:10869-939
14. Liu LH, Qiu WX, Li B, Zhang C, Sun LF, Wan SS. et al. Mesoporous silica-based versatile theranostic nanoplatform constructed by layer-by-layer assembly for excellent photodynamic/chemo therapy. Biomaterials. 2017;117:54-65
15. Chen Q, Wang X, Wang C, Feng LZ, Li YG, Liu Z. Drug-induced self-assembly of modified albumins as nano-theranostics for tumor-targeted combination therapy. ACS Nano. 2015;9:5223-33
16. Zhao N, Wu BY, Hu XL, Xing D. NIR-triggered high-efficient photodynamic and chemo-cascade therapy using caspase-3 responsive functionalized upconversion nanoparticles. Biomaterials. 2017;141:40-9
17. Dong ZL, Feng LZ, Zhu WW, Sun XQ, Gao M, Zhao H. et al. CaCO3 nanoparticles as an ultra-sensitive tumor-pH-responsive nanoplatform enabling real-time drug release monitoring and cancer combination therapy. Biomaterials. 2016;110:60-70
18. He C, Liu D, Lin WB. Self-assembled core-shell nanoparticles for combined chemotherapy and photodynamic therapy of resistant head and neck cancers. ACS Nano. 2015;9:991-1003
19. Wang S, Yang WT, Cui J, Li X, Dou Y, Su L. et al. pH- and NIR light responsive nanocarriers for combination treatment of chemotherapy and photodynamic therapy. Biomater Sci. 2016;4:338-45
20. Khdai A, Chen D, Patil Y, Ma L, Dou QP, Shekhar MPV. et al. Nanoparticle-mediated combination chemotherapy and photodynamic therapy overcomes tumor drug resistance. J Controlled Release. 2010;141:137-44
21. Fan WP, Lu N, Xu C, Liu YJ, Lin J, Wang S. et al. Enhanced afterglow performance of persistent luminescence implants for efficient repeatable photodynamic therapy. ACS Nano. 2017;11:5864-72
22. Zhou FY, Feng B, Wang TT, Wang DG, Cui ZR, Wang SL. et al. Theranostic prodrug vesicles for reactive oxygen species-triggered ultrafast drug release and local-regional therapy of metastatic triple-negative breast cancer. Adv Funct Mater. 2017;27:1703674
23. Yang T, Liu L, Deng YB, Guo ZQ, Zhang GB, Ge ZS. et al. Ultrastable near-infrared conjugated-polymer nanoparticles for dually photoactive tumor inhibition. Adv Mater. 2017;29:1700487
24. Li H, Li JJ, Ke WD, Ge ZS. A near-infrared photothermal effect-responsive drug delivery system based on indocyanine green and doxorubicin-loaded polymeric micelles mediated by reversible diels-alder reaction. Macromol Radpi Comun. 2015;36:1841-9
25. Li JJ, Wei K, Zuo S, Xu YX, Zha ZS, Ke WD. et al. Light-triggered clustered vesicles with self-supplied oxygen and tissue penetrability for photodynamic therapy against hypoxic tumor. Adv Funct Mater. 2017;27:1702018
26. Cao Z, Ma Y, Sun C, Lu Z, Yao Z, Wang J. et al. ROS-sensitive polymeric nanocarriers with red light-activated size shrinkage for remotely controlled drug release. Chem Mater. 2018;30:517-25
27. Yue CX, Zhang CL, Alfranca G, Yang Y, Jiang XQ, Yang YM. et al. Near-infrared light triggered ROS-activated theranostic platform based on Ce6-CPT-UCNPs for simultaneous fluorescence imaging and chemo-photodynamic combined therapy. Theranostics. 2016;6:456-69
28. Yang GB, Sun XQ, Liu JJ, Feng LZ, Liu Z. Light-responsive, singlet-oxygen-triggered on-demand drug release from photosensitizer-doped mesoporous silica nanorods for cancer combination therapy. Adv Funct Mater. 2016;16:4722-32
29. Hu JJ, Lei Q, Peng MY, Zheng DW, Chen YX, Zhang XZ. A positive feedback strategy for enhanced chemotherapy based on ROS-triggered self-accelerating drug release nanosystem. Biomaterials. 2017;128:136-46
30. Gu LN, He XM, Wu ZY. Mesoporous Fe3O4/hydroxyapatite composite for targeted drug delivery. Mater Res Bull. 2014;59:65-8
31. Lim EY, Huh YM, Yang J, Lee K, Suh JS. pH-Triggered drug-releasing magnetic nanoparticles for cancer therapy guided by molecular imaging by MRI. Adv Mater. 2011;23:2436-42
32. Yue CX, Yang YM, Zhang CL, Alfranca G, Cheng SL, Ma LJ. et al. ROS-responsive mitochondria-targeting blended nanoparticles: chemo- and photodynamic synergistic therapy for lung cancer with on-demand drug release upon irradiation with a single light source. Theranostics. 2016;6:2352-66
33. Yuan YY, Feng GX, Qin W, Tang BZ, Liu B. Targeted and image-guided photodynamic cancer therapy based on organic nanoparticles with aggregation-induced emission characteristics. Chem Commun. 2014;50:8757-60
34. Alifu N, Dong XB, Li DY, Sun XH, Zebibula A, Zhang DQ. et al. Aggregation-induced emission nanoparticles as photosensitizer for two-photon photodynamic therapy. Mater Chem Front. 2017;1:1746-53
35. Hou LC, Xie KL, Qin MZ, Peng DR, Ma SR, Lei S. et al. Effects of reactive oxygen species scavenger on the protective action of 100% oxygen treatment against sterile inflammation in mice. Shock. 2010;33:646-54
36. Shim MS, Xia YN. A reactive oxygen species (ROS)-responsive polymer for safe, efficient, and targeted gene delivery in cancer cells. Angew Chem Int Ed. 2013;52:6926-9
37. Xu QH, He CL, Xiao CS, Chen XS. Reactive oxygen species (ROS) responsive polymers for biomedical applications. Macromol Biosci. 2016;16:635-46
38. Saravanakumar G, Kim J, Kim WJ. Reactive-oxygen-species-responsive drug delivery systems: promises and challenges. Adv Sci. 2017;4:1600124
39. Chen WH, Luo GF, Qiu WX, Lei Q, Liu LH, Zheng DW. et al. Tumor-triggered drug release with tumor-targeted accumulation and elevated drug retention to overcome multidrug resistance. Chem Mater. 2016;28:6742-52
40. He QJ, Gao Y, Zhang LX, Zhang ZW, Gao F, Ji XF. et al. A pH-responsive mesoporous silica nanoparticles-based multi-drug delivery system for overcoming multi-drug resistance. Biomaterials. 2011;32:7711-20
41. Li ZH, Wang HB, Chen YJ, Wang Y, Li H, Han HJ. et al. pH- and NIR light-responsive polymeric prodrug micelles for hyperthermia-assisted site-specific chemotherapy to reverse drug resistance in cancer treatment. Small. 2016;12:2731-40
42. Sun CY, Dou S, Du JZ, Yang XZ, Li YP, Wang J. Doxorubicin conjugate of poly(ethylene glycol)-block-polyphosphoester for cancer therapy. Adv Healthcare Mater. 2014;3:261-72
43. Yuan YY, Mao CQ, Du XJ, Du JZ, Wang F, Wang J. Surface charge switchable nanoparticles based on zwitterionic polymer for enhanced drug delivery to tumor. Adv Mater. 2012;24:5476-80
44. Wang F, Wang YC, Dou S, Xiong MH, Sun TM, Wang J. Doxorubicin-tethered responsive gold nanoparticles facilitate intracellular drug delivery for overcoming multidrug resistance in cancer cells. ACS Nano. 2011;5:3679-92
45. Zhou LJ, Yang T, Wang JX, Wang QL, Lv XY, Ke HT. et al. Size-tunable Gd2O3@albumin nanoparticles conjugating chlorin e6 for magnetic resonance imaging-guided photo-induced therapy. Theranostics. 2017;7:764-74
46. Song XJ, Liang C, Gong H, Chen Q, Wang C, Liu Z. Photosensitizer-conjugated albumin-polypyrrole nanoparticles for imaging-guided in vivo photodynamic/photothermal therapy. Small. 2015;11:3932-41
47. Ding F, Li HJ, Wang JX, Tao W, Zhu YH, Yu Y. et al. Chlorin e6-encapsulated polyphosphoester based nanocarriers with viscous flow core for effective treatment of pancreatic Cancer. ACS Appl Mater Interfaces. 2015;7:18856-65
48. Zou XY, Yin YB, Zhao YB, Chen DY, Dong S. Synthesis of ferriferrous oxide/l-cysteine magnetic microspheres and their adsorption capacity for Pb (II) ions. Mater Lett. 2015;150:59-61
Author contact
![]() Corresponding author: E-mail: chunshuiyuedu.cn (C. S. Yu), yangxzedu.cn (X. Z. Yang)
Corresponding author: E-mail: chunshuiyuedu.cn (C. S. Yu), yangxzedu.cn (X. Z. Yang)