Impact Factor
- Issue 14; 2026
- Issue 13; 2026
- Issue 12; 2026
- Issue 11; 2026
- Issue 10; 2026
- Volume 16; 2026
- Advance Articles
- Past Issues
- Cover Images
- Cover Suggestion
- Index & Coverage
- Special Issues
Introduction
Methods
Results
Discussion
Conclusion
Abbreviations
Supplementary Material
Acknowledgements
References
International Journal of Biological Sciences
International Journal of Medical Sciences
 Global reach, higher impact

Theranostics 2018; 8(10):2657-2671. doi:10.7150/thno.23206 This issue Cite
Research Paper
Caveolae-mediated mesenchymal stem cell labelling by PSS-coated PLGA PFOB nano-contrast agent for MRI
Hieu Vu Quang1*, Chi-Chih Chang1* ![]() , Ping Song1, Ellen-Margrethe Hauge2,3, Jørgen Kjems1
, Ping Song1, Ellen-Margrethe Hauge2,3, Jørgen Kjems1
1. Interdisciplinary Nanoscience Center (iNANO), Aarhus University, Denmark, Center for Cellular Signal Patterns (CellPat), Aarhus University, Denmark
2. Department of Clinical Medicine, Aarhus University, Aarhus, Denmark
3. Department of Rheumatology, Aarhus University Hospital, Aarhus, Denmark
* equal contribution
Received 2017-10-7; Accepted 2018-2-23; Published 2018-4-3
Abstract

Rationale: Non-invasive tracking of transplanted cells is critical in evaluating delivery, migration and prognosis of cell therapies.
Methods: We formulated a nano-contrast agent consisting of a perfluorooctylbromide (PFOB) core within a shell of poly (lactic-co-glycolic acid) (PLGA) followed by a coat of polystyrene sulfonate (PSS) for 19F MRI. The nano-contrast agent (PSS-NP) was characterised by DLS and the uptake efficiency of the nano-contrast agent (PSS-NP) was tested using flow cytometry, in vitro MRI and confocal microscopy. In vitro and in vivo assays of labelled cells were tested for their ability to provide an MRI signal while retaining their osteoblastic differentiation capabilities.
Results: PSS-NPs were internalised via caveolae-mediated endocytosis in mesenchymal stromal/stem cells without affecting cell proliferation and differentiation in osteoblasts, both in vitro and in vivo. Furthermore, labelled cells were monitored by 19F MRI for up to 2 months after transplantation in mice. In particular, PSS-NP-labelled cells can be used to monitor the enhanced immune rejection of grafted human cells in normal BALB/c mice compared to immune-compromised NOD/SCID mice. One week after transplantation, 40% of the 19F MRI signal was lost in normal mice, whereas only 10% was lost in immune-compromised mice.
Conclusion: Overall, these results show that PSS-NPs can label MSCs effectively, and be employed in vivo as a novel nano-contrast agent for non-invasive cell tracking using clinically relevant 19F MRI techniques.
Keywords: stem cell therapy, MRI, contrast agent, caveolae-mediated endocytosis, mesenchymal stem cells, nanoparticles
Introduction
Stem cells and their versatility in replenishing various cells in our body provided the ground for modern regenerative medicine. In particular, adult stem cells are an attractive source because of their accessibility and multipotency. One of the most well-studied subsets of multipotent stem cells is mesenchymal stromal/stem cells (MSCs), which can differentiate into cells of mesodermal origin such as adipose, bone, cartilage and muscle tissue [1]. There are multiple sources of MSCs including the bone marrow, adipose tissues and the umbilical cord. An important aspect of stem cell therapeutic approaches is the ability to monitor and track the transplanted stem cells in order to better understand treatment prognosis, stem cell survival and stem cell distribution. This has propagated the need for noninvasive techniques that allow us to monitor the distribution, migration, survival, and differentiation of transplanted stem cells in vivo.
Currently, there are several methods that can be used to track stem cells after transplantation. For example, radioactive agents such as 99mTc, 111In, and 18F have been used to track cell migration in combination with radionuclide imaging [2]. Since radioactive agents detected by positron emission tomography (PET) or single photon emission computed tomography (SPECT) enable high sensitivity, a small amount of tracer material is sufficient for cell tracking. However, the spatial resolution of PET and SPECT is relatively low when compared to magnetic resonance imaging (MRI). Other agents such as gold nanoparticles can also be used to label stem cells using computed tomography (CT); however, this has low sensitivity and is not ideal for repeated exposures for long-term tracking [3]. Optical imaging, where fluorophore-labelled nanoparticles (NPs) and quantum dots are used, is also an established imaging technique for stem cells [4-6]. This approach is fast; however, it lacks anatomical information and is currently limited to the pre-clinical phase. MRI, on the other hand, is a noninvasive imaging method that can monitor tissues and cells at a high spatial resolution in 3D. MRI can also be used repeatedly in patients without exposure to radiation. A contrast agent that stably associates with the transplanted cells generates the MRI signal, thereby allowing the cells to be discriminated from resident host tissues/cells. To date, several NPs have been developed and are used as contrast agents in MRI, such as superparamagnetic nanoparticles, paramagnetic nanoparticles and fluorinated nanoparticles.
Superparamagnetic iron oxides nanoparticles (SPIONs) are widely used as contrast agents for cell labelling due to their ability to exert strong signal distortions that change the T2 relaxation times to produce a signal in MRI [7, 8]. As a result, MRI signals of SPION-labelled cells are reduced and the contrast between donor cells and recipient tissues are increased. However, SPIONs are limited by the negative contrast they exert on the images. Firstly, it is difficult to discriminate labelled cells from other low signal sources in MRI such as bleeding after invasive interventions or disease-related tissue distortions (e.g., stroke and tumours). Secondly, the highly sensitive magnetic distortion of SPIONs can cause a “blooming” effect in the T2*-weighted MRI, thereby creating a region that is larger than the original transplant [7]. These limitations necessitate alternative cell labelling methods to overcome both sensitivity and specificity.
Fluorinated (19F) contrast agents provide a positive (bright) signal on a dark background since the fluorine content of biological tissues is kept constant and is negligible; this results in a clean background, which deems 19F agents ideal for cell tracking. Additionally, most perfluorocarbons used in MRI are inert, biocompatible and non-radioactive. Some of these have been approved for clinical use such as perfluoroctylbromides (PFOB) [9]. Recent success in clinical trials using perfluoro-crown ether as the source for 19F MRI tracking of human dendritic cells in immunotherapy further potentiates the use of 19F as an MRI contrast agent [10]. However, unlike the sensitive metal-based contrast agents in conventional 1H MRI, 19F MRI requires a high concentration of fluorine in the transplanted cells to generate a detectable signal. Several studies investigated the delivery of fluorinated agents into cells. Among them, fluorinated cationic NPs and nanoemulsions have been investigated [11-16]. Fluorinated cationic NPs can be endocytosed into cells by charged interactions between the cell membrane and the NPs, but delivery is inefficient, toxic and not suitable for all cell types [17]. Furthermore, a prior study in our group demonstrated that the labelling efficiency and the cell viability of cationic PLGA PFOB were unsuitable for long-term imaging because it reduced cell viability and changed the morphology of the cells [11]. Some nanoemulsions have been commercialized, but the mechanism by which they are endocytosed is unclear. Collectively, these necessitate a method of delivery that can enhance the 19F signal, allow for long-term imaging, and allow multiple cell types to be labelled without disturbing cell viability.
Voigt et al. (2014) previously demonstated that lipid NPs modified with different anionic polyelectrolytes affected the lipophilicity and cellular uptake of NPs [18]. Poly(styrene sulfonate) (PSS), an ionic polyelectrolyte polymer with aromatic rings of styrene sulfonate in the repeat unit, not only increased lipophilicity but also facilitated the entry of NPs into cells via caveolae-mediated endocyosis [18, 19]. They observed that PSS-modified NPs colocalized with caveolin-1 (CAV-1). CAV-1 is present on the plasma membrane of many cell types (including hMSCs) and is important in endocytosis, transcytosis and cell signaling [20, 21]. After ligands are bound to CAV-1, the budded caveolae fuse with the caveosome and enter the cytoplasm. Caveolae-mediated endocytosis is an energy-dependent process that requires the hydrolysis of GTP for caveolae fission [22-24]. The versatility of PSS potentiates its use as a coating material to facilitate NP delivery without affecting cell viability.
The present study exploits FDA-approved materials to form a fluorinated nano-contrast agent for 19F MRI that effectively labels MSCs via caveolae-mediated endocytosis. Poly(lactide-co-glycolic acid) (PLGA) NPs containing PFOB are coated with PSS, thereby forming PSS PLGA PFOB NPs (PSS-NPs). Here we demonstrate that PSS-NPs are internalized via caveolae-mediated endocytosis to enhance the intracellular fluorine concentration in transplanted cells to generate a high 19F MRI signal. Using hMSC-TERT cells as a model, we demonstrated the cell tracking potential of PSS-NPs in vitro and in vivo without altering the proliferative and differentiation capabilities of the cells.
Methods
Nanoparticle preparation
PLGA NPs were formulated by single emulsion evaporation as described before [25]. In brief, 100 mg of PLGA and 60 µL of PFOB were dissolved in 4 mL of organic dichloromethane. The mixture was emulsified in 20 mL of 1.5% sodium cholate by vortexing and sonicating each for 1 min in an ice bath. The dichloromethane was allowed to evaporate over 6 h with magnetic stirring at 300 rpm. PSS (Mw 70 kDa) was added to the NPs to a final concentration of 1% and incubated for 5 days. The NPs were collected twice by centrifugation at 237 ×g and 7000 ×g for 30 min. The NPs were resuspended in distilled water. The mass of the NPs in water was weighed by freeze-drying. From henceforth, these NPs will be termed PSS-NP. Poly (vinyl alcohol) nanoparticles (PVA-NPs) were formulated as described before [25]. The fluorophore-labelled nanoparticles used were formulated by adding Coumarin-6 (10 µg) (Sigma Aldrich, St Louis, MO, USA) to the organic phase before emulsion. The fluorescent nanoparticles were then prepared as described above. Fluorescent nanoparticles were used in confocal laser scanning microscopy (CLSM) and flow cytometry analysis.
Size and zeta potential
The size, polydispersity index (PDI), and surface charge of the NPs were measured using the Zetasizer Nano ZS (Malvern Instrument Ltd., Worcestershire, UK). The NPs were suspended in distilled water to give optimal signal intensity. The measurements were performed 4 times at 25 °C with a scattering angle of 173°.
Transmission electron microscopy
The morphology of the nanoparticles was determined using negative stain transmission electron microscopy (TEM). A 10 µL aliquot of nanoparticles was loaded onto a carbon film-coated 200 mesh copper grid (Ted Pella Inc., Redding, CA, USA) for 1 min and then stained with 10 µL of uranyl acetate for an additional 30 s. The TEM images were acquired using a TE microscope (Technai G2 Spirit, Oregon, USA) at 120 kV.
Cell culture and osteoinduction
hMSC-TERT is a cell line immortalized by overexpressing the human telomerase reverse transcriptase (TERT) in bone marrow-derived hMSCs [26]; these cells exhibit all the characteristics of a primary bone marrow-derived MSC. hMSC-TERT-GFP is a reporter cell line generated by cotransduction with EGFP [27]. Cells were cultured in growth medium (Minimum Essential Medium (MEM) supplemented with 10% FBS and 1% penicillin/streptomycin (PS)) at 37 °C and 5% CO2. Osteoblastogenesis was induced with osteoinduction media, which contained growth media supplemented with 0.01 μM dexamethasone (Sigma), 0.2 mM l-ascorbic acid (Sigma), 10 mM β-glycerophosphate (Sigma) and 10 mM 1.25-vitamin D3 (Sigma). Differentiation media was made fresh and changed every 2-3 days.
Cell labelling
hMSC-TERT was seeded a day before treating them with PSS-NP for the indicated times. After labelling, cells were washed three times with PBS before adding growth or osteoinduction media.
MTT assay
hMSC-TERT cells were seeded in 96 wells plates (10000 cells per well) and incubated in growth media overnight. Cells were incubated with PSS polymer, PSS-NPs and PVA-NPs at concentrations of 0.2, 0.5, 1 and 1.5 mg/mL for 1 and 3 days. The cell viability was then measured by MTT (3-(4,5-Dimethylthiazol-2-yl)-2,5-diphenyltetrazolium bromide) assay according to the manufacturer's protocol (Sigma). Untreated cells were used as controls.
Flow cytometry analysis
hMSC-TERT was labelled with Coumarin 6 loaded NPs by incubating the cells in growth media containing NPs at a final concentration of 0.5 mg/mL for 4 h in 12-well plates. The cells were washed thoroughly with PBS, harvested and analyzed with the Gallios Flow cytometer (Beckman Coulter, CA, USA). For pharmacological inhibition of caveolae-mediated endocytosis, the cells were pre-treated with 5 mM of methyl-beta-cyclodextrin (MβCD) (Sigma) for 4 h, fresh media was then added containing PSS-NPs. To elucidate whether free PSS polymer can compete with PSS-NPs for uptake through caveolae-dependent endocytosis, PSS polymer was added to the media at a final concentration of 0.5 mg/mL before treatment.
ALP activity
Cells were seeded in 96-well plates at a density of 10000 cells per well in culture media. Cells were labelled with PSS-NPs, PVA-NPs, free PVA or free PSS polymer as controls. After that, cells were rinsed three times with PBS and incubated with induction media. ALP activities were assessed on day 7 of induction as previously described [28]. Briefly, cell viability was determined by adding CellTiter-Blue (Promega) to the cell media according to the manufacturer's protocols. The cells were incubated at 37 ºC for 1 h and the fluorescence was measured at (560EX/590EM). The cells were then washed in PBS and the ALP substrate was added (1 mg/mL of p-nitrophenyl phosphate in 50 mM NaHCO3, pH 9.6, and 1 mM MgCl2) and incubated at 37 ºC for 20 min. The absorbance was measured at 405 nm.
Alizarin Red S staining
Alizarin Red S (ARS) staining was performed to stain mineralized nodules formed by osteoblasts. Cells were first fixed with cold 70% ethanol at -20 °C for 1 h. They were then washed with PBS and stained with 40 mM Alizarin red S (pH 4.2) for 10 min at room temperature. The mineralized nodules were observed with light microscopy (Olympus IX71 Microscope). ARS stain complexed with calcium was eluted and quantified using acetic acid extraction as previously described [29].
RT-QPCR
Cells were collected and total RNA was extracted with TRIzol reagent (Invitrogen), cDNA was prepared with the qScriptTM cDNA SuperMix kit (Quanta), and QPCR was performed with Platinum® SYBR Green qPCR SuperMix-UDG (Invitrogen) on the LightCycler® 480 Instrument II (Roche). The following primers were used for QPCR: ALP (Fwd: 5-ACGTGGCTAAGAATGTCATC-3', Rev:5'-CTGGTAGGCGATGTCCTTA-3') [30]; RUNX2 (Fwd: 5'-CCATAACGGTCTTCACAAATCCT-3'; Rev: 5'-TCTGTCTGTGCCTTCTTGGTTC-3') [31]; BGLAP (Fwd: 5'-CATGAGAGCCCTCACA-3'; Rev: 5'-AGAGCGACACCCTAGAC-3') [32]; COL1A1 (Fwd: 5'-TGACGAGACCAAGAACTG-3'; Rev: 5'-CCATCCAAACCACTGAAACC-3') [32]; CAV1 (Fwd: 5'-GGGCAACATCTACAAGCCCAACAA-3'; Rev: 5'-CTGATGCACTGAATCTCAATCAGGAA-3') and GAPDH (Fwd: 5'-GAAGGTGAAGGTCGGAGT-3'; Rev: 5'-GAAGATGGTGATGGGATTTC-3').
Magnetic resonance imaging
All MRI experiments were performed with a 25 mm double-tuned 1H/19F coil in the 16.4 T vertical bore Bruker Advance II system (Bruker BioSpin, Rheinistten Germany). Images and data were analyzed using MATLAB 2015b (Mathworks, Natick, MA, USA). The 19F-MRI signal to noise ratio (SNR) maps were obtained by dividing the signal from the images over the mean signal of the non-spin area. The 1H channel was used for sample localization and anatomical reference images. The 19F channel was used to acquire the signal from the NPs.
In vitro 19F MRI
To assess the duration of the signal from PSS-NPs, labelled cells were seeded at a density of 106 cells per T75 flask and collected at day 0, day 3, day 7 and day 14 and fixed in 4% HCHO at 4 °C before 19F-MRI scanning. Two T75 flasks were collected for each time point and measured. Two tubes of PFOB in CDCl3 (3.85 µmol and 1.92 µmol) were used as references. The number of moles of PFOB in the cells was calculated by dividing the number of moles of PFOB with the total number of cells in one tube. 1H MRI were taken using fast low angle shot sequence (FLASH) with a repetition time (TR) of 100 ms, echo time of 4 ms, slice thickness (TH) of 0.5 mm, number of scans (ns) 10, matrix size of 64×64 and a field of view (FOV) of 24×24 mm2. 19F MRI images were taken using multi-spin echoes (MSME) sequence with a TR of 5000 ms, TE of 7.64 ms, number of slice 1, TH of 20 mm, ns of 15, matrix size of 32x32, and FOV of 24x24 mm2. The excitation frequency at -83 ppm was carefully chosen following the suggestions from another study [33].
In vivo MRI of heterotopic bone
One million labelled or unlabelled hMSC-TERTs or hMSC-TERT-GFP were seeded on 40 mg of hydroxyapatite/tricalcium phosphate (HA/TCP) granules at 106 cells per scaffold. The cells were allowed to attach overnight in the incubator (at 37 °C and 5% CO2). The implants (scaffold and cells) were then implanted subcutaneously on the dorsal side of the mice. Details of the procedure are described by Abdalla et al (2008) [34]. For in vivo MRI, mice were anaesthetized with 200 µL of Ketamin/Xylazine/PBS with a volume ratio of 1/0.25/3.75 and 1H MRI images were taken using gradient echo with a matrix size of 64×64, slice thickness of 0.5 mm. 19F MRI images were taken using MSME sequence with an echo time of 40 ms with TE of 2.34 ms, TR 5000 ms, matrix size of 32×32, slice thickness of 30 mm, and a ns of 13. The images were post-processed by the sum of 40 echo images using Matlab 2012b Natick, USA. All mice experiments were approved by the Danish Animal Ethics Council.
Histology
Histology was performed as previously described [34]. Scaffolds collected at the end of in vivo MRI tracking were dehydrated and embedded following the manufacturer's protocol using Technovit® 9100 (Electron Microscopy Sciences, PA, United States) to embed mineralized tissues. After embedding and polymerization, the scaffolds were cut in 7 µm thick sections using a Jung model K microtome (R. Jung GmbH, Heidelberg, Germany) equipped with a tungsten carbide knife and stained with Masson-Goldner Trichrome and Von Kossa.
Statistical Analyses
All results are shown as mean ± SD. For comparisons, two-tailed t-tests were used and probabilities were significant when P < 0.05.
Results
NP synthesis and characterization
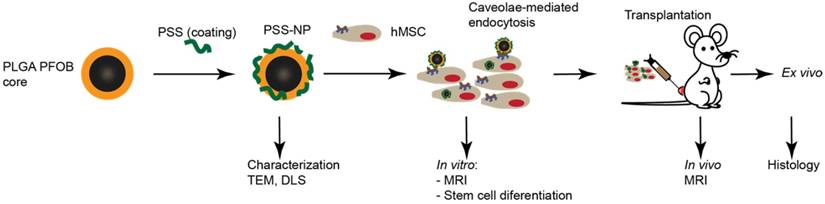
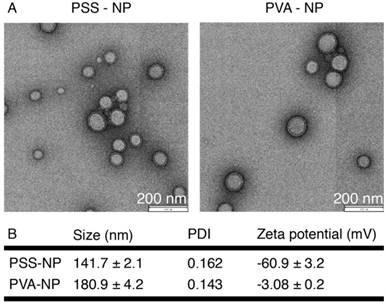
The overall scheme of the study is shown in Figure 1. NPs were formulated according to Pisani et al. (2009) [12, 35-37], a protocol that yielded a high PFOB encapsulation efficiency (up to 60%) with a well-defined core-to-shell structure: PFOB as the core and PLGA forming a solid wall. The core-to-shell ratio can be adjusted by changing the weight ratios between PFOB and PLGA [37]. The NPs were subsequently coated with PSS polymer to form PSS-NP. As a control, PLGA NPs were coated with PVA (forming PVA-NPs) because naked PLGA NPs aggregated in PBS (data not shown). TEM was performed to evaluate the morphology of the NPs after coating. Both PSS-NPs and control PVA-NPs appeared spherical in shape (Figure 2A). Post-modification of PSS on NPs after the evaporation of organic solvents did not alter NP morphology. However, PSS-NPs had a hydrodynamic size of ~140 nm, which was smaller than PVA-NPs with ~180 nm (Figure 2B). Both types of NPs had a narrow size distribution (PDI < 0.2) after purification. The different coating materials on the NP surfaces affected their respective zeta potentials: the charge of PSS-NPs and PVA-NPs were about -60 mV and -3 mV respectively (Figure 2B). Furthermore, the PDI of PSS-NP in media was slightly higher than PSS-NP in water (Table S1). However, extended culturing (up to 8 h) of PSS-NP in media did not further increase the PDI of PSS-NPs (Table S1), and no aggregates were formed during this time (data not shown). The slight increase in PDI from water to media could be attributed to the adherence of proteins onto the surface of NPs.
Experimental workflow showing nanoparticle formulation, uptake and in vitro and in vivo studies. PLGA nanoparticles containing PFOB were coated with PSS to form PSS-NPs. The PSS-NPs were internalized by hMSC-TERTs via caveolae-mediated endocytosis. Cellular proliferation and osteogenic differentiation were tested after the cells were labelled with PSS-NPs. The sensitivity of PSS-NPs in labelled cells was assessed both in vitro and in vivo.
Nanoparticle characterization. Size, PDI and zeta potential of the nanoparticles in 1 mM KCl, pH 5.8, n = 4.
Cells incubated with PSS-NP were viable when labelled for up to 3 days
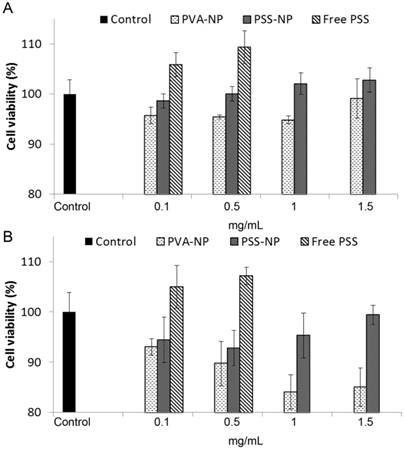
The cell viability of PVA-NPs and PSS-NPs was studied with increasing particle concentrations and incubation times using the MTT assay. No significant changes in cell viability were seen in PSS-NP labelled cells: cell viability was above 92% at all concentrations tested, even after extended exposure times of up to three days (Figure 3A-B). However, PVA-NPs were slightly toxic to the treated cells: cell viability was reduced to 85% at a particle concentration of 1.5 mg/mL when incubated for 3 days (Figure 3B). Interestingly, high PSS polymer concentrations (0.1 mg/mL and 0.5 mg/mL) induced cell proliferation or cell activation in a dose-dependent manner. Since the various concentrations of NPs did not affect cell viability, we proceeded to use 1 mg/mL of NPs in the subsequent experiments.
Cell viability of hMSC-TERT treated with NPs. Cells were labelled with 0.1, 0.5, 1 and 1.5 mg/mL of particles for (A) 1 day and (B) 3 days. MTT assay with n = 4.
PSS-NPs enter the cell via caveolae-mediated endocytosis
Lipid NPs coated with PSS has been shown to colocalize with CAV1 in HUVEC cells through the PSS coating, leading to caveolin-mediated endocytosis; in accordance with this, free PSS polymer inhibited the uptake of NPs in HUVEC cells [18]. CAV1 and the formation of caveolae have also been implicated in hMSCs and their differentiation [21]. Additionally, we have also shown that CAV1 is expressed on the hMSC-TERT cells and that differentiation for 10 days upregulated its expression (Figure S4A), which is consistent with previous studies. Thus, we investigated whether the uptake of the PSS-NPs prepared in our study followed the same mechanisms.
Methyl-β-cyclodextrin (MβCD) is a commonly used pharmacological inhibitor of caveolae-mediated endocytosis and it has also been used in the study of caveolae-mediated signalling in osteogenesis of hMSCs [20]. The cells retained their cell viabilities at 5 mM MβCD for at least 4 h (Figure S3). To test the relevance of caveolae-mediated endocytosis in our system, cells were pre-incubated with and without MβCD for 4 h prior to the addition of PSS-NPs loaded with Coumarin 6. The results show that the mean fluorescence intensity of cells pre-treated with MβCD was 41% of cells treated only with PSS-NPs, demonstrating that PSS-NPs enter the cells via caveolae-mediated endocytosis (Figure 4A-B). Additionally, free PSS was used as a competitor to compete with PSS-NPs from interacting with the cells for uptake. The result showed that the mean fluorescence intensity of free PSS-treated cells with PSS-NPs was 58.8% of cells only treated with PSS-NP (Figure 4A-B). Caveolae-mediated endocytosis is an energy-dependent process and requires GTP for caveolae fission [22-24]. Incubation of cells at 4 °C reduces cellular metabolism. The mean fluorescence intensity of cells incubated with PSS-NP at 37 °C and 4 °C were 34.4 ± 1.18 and 10.17 ± 1.24, respectively (Figure S4B-C), which indicates that the shift in temperature affected cellular metabolism and uptake. Furthermore, the difference between PSS-NP-labelled cells, when incubated with or without free PSS polymer, was abolished at 4 °C (10.17 ± 1.24 versus 11.13 ± 0.57; Figure S4C). Overall, these results show that most PSS-NPs enter the cell via caveolae-mediated endocytosis. Furthermore, the results imply that uptake of PSS-NPs is mediated by PSS through an energy-dependent process, which is in accordance with caveolae-mediated endocytosis.
PSS-NPs are taken up by hMSC-TERT via the caveolae-dependent pathway. hMSC-TERT were treated with NPs at different conditions and analysed. (A) The uptake of PSS-NP in cells pre-incubated with and without MβCD, and PSS-NP in the presence of free PSS as a competitor, were assessed by flow cytometry. The graph (B) presents the mean signal intensity from the cells. Total cell count: 10000 (C-E) CLSM image of Coumarine 6-loaded NPs in hMSCs after 4 h of incubation. (C) PVA-NP, (D) PSS-NP, (E) PSS-NP with free PSS as its competitor. Blue: DAPI, Red: ConA-Alexa 647, Green: Coumarin 6-loaded nanoparticles, scale bar: 50 µm. (F) In vitro 1H and 19F MR imaging of cells treated with PSS-NP, PSS-NP with free PSS, and PVA-NP. (G) Quantification of PFOB in the cells. REF: reference amount of PFOB in CDCl3 (high signal: 3.85 µmol and low signal: 1.92 µmol); number of tubes: 2.
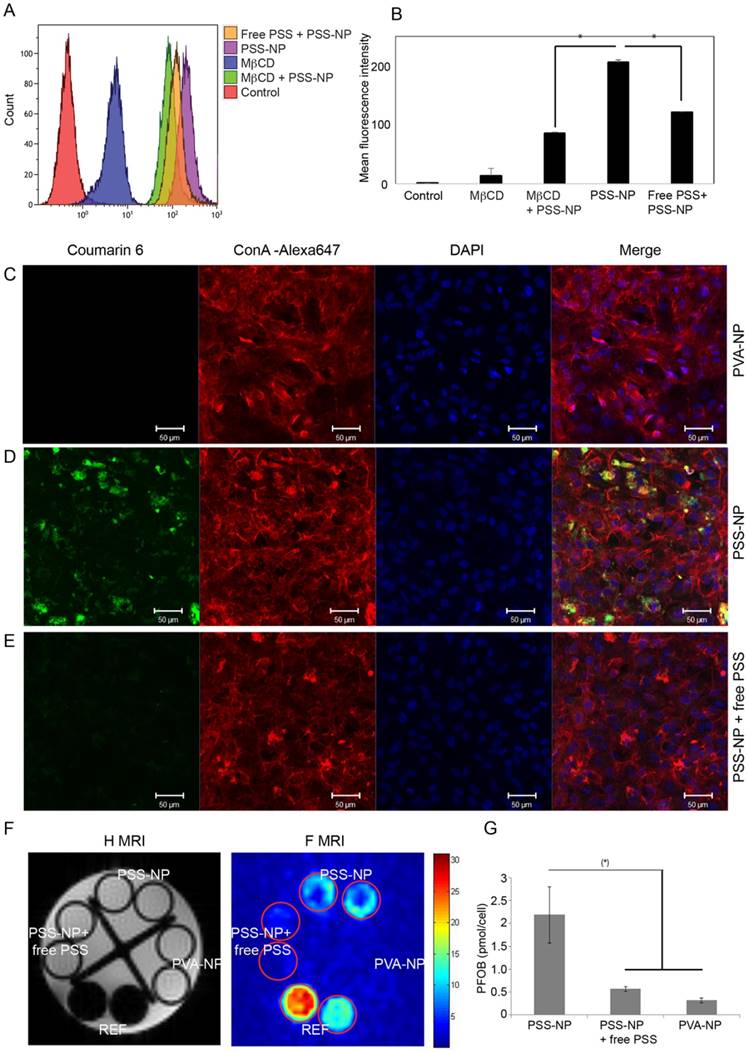
To visualize the uptake of NPs, CLSM and in vitro 19F MRI were performed. The fluorescence intensity of PSS-NP (green) in the cytoplasm was significantly higher (Figure 4D) than for the PVA-NP control (Figure 4C) and cells treated with free PSS polymer as a competitor (Figure 4E). Next, in vitro 19F MRI analysis was performed by incubating cells with PSS-NPs and PVA-NPs (Figure 4F-G). PFOB references containing 3.85 µmol and 1.92 µmol in CDCl3 were included. The concentration of fluorine in the PSS-NP-labelled cells ranged from 1.5-3 pmol/cell, which was clearly detectable by the 19F MRI scanner, and was significantly higher than cells treated with 19F PVA-NPs or free PSS polymer. Taken together, these results indicate that PSS-NPs enter the cell via caveolae-mediated endocytosis and were capable of labelling cells for MRI detection.
When visualizing the labelled cells using all three methods, a lower signal was detected from PVA-NP and PSS-NP with free PSS polymer-treated cells. This indicates background or a low amount of uptake via other pathways since no signal was detected in the control (untreated) cells using flow cytometry.
PSS-NP did not affect in vitro proliferation and differentiation
Human MSCs are often studied in regenerative medicine to improve the regenerative capabilities of tissues such as bone, cartilage and adipose tissue. Being able to track the cells after implantation therapy is highly desirable for assessing the safety, efficacy and prognosis of treatment. Furthermore, being able to track the viability and biodistribution of the cells in vivo enables clinicians to monitor the progression of the treatment and make adjustments to the protocol. We sought to identify optimal hMSC-TERT labelling conditions to ensure the highest amount of NP uptake without compromising cell viability and differentiation. Various incubation times were tested to determine the most optimal conditions for cellular uptake of PSS-NPs. As shown in Figure S1, increasing the incubation time from one to three days elevated the concentration of PFOB from 2.39 ± 2.2 pmol/cell to 4.48 ± 1.8 pmol/cell. Based on this increase in the 19F MRI signal, and the observation that prolonged incubation did not affect cell viability (Figure 3), three days of incubation was chosen in order to obtain the best 19F MRI signal.
The usual protocol for in vitro differentiation of hMSC-TERTs to osteoblasts takes two weeks for mineralization to occur, hence we first tested whether we could observe a signal two weeks after proliferation. The cells were labelled as above and allowed to proliferate for 14 days. As shown in Figure 5A-B, the total 19F MRI SNR/tube did not change significantly within the 14 days of proliferation. The 20% reduction from day 0 (7.16) to day 14 (5.71) could be a result of NP degradation and cell excretion. When the SNR was normalized to cell number (SNR/cells), the signal per cell was significantly reduced. This was expected because the NPs were carried over into daughter cells during proliferation.
The MRI signal of PSS-NP-labelled hMSC-TERTS last up to two weeks, and labelled cells retain their ability to differentiate into osteoblasts. hMSC-TERT were labelled with PSS-NP for 3 days, after which the cells were allowed to proliferate for up to 14 days. (A) 19F MRI of hMSC-TERT labelled with PSS-NP. The graph represents the ratio between 19F MRI SNR per tube and the ratio of SNR/cell number over time. (B) Representative 19F MRI SNR images of total cells at 0, 3, 7 and 14 days after labelling. Number of replicates n=2; colour bar indicates the SNR scale. For differentiation, cells were treated with PVA or PSS polymer or NP and induced with osteogenic media. (C) ALP activity (ALP/cell viability) of the cells at day 7 of differentiation. (D) Cells were stained with ARS at day 14 of differentiation; stains were eluted and quantified. The representative stained images are also shown.
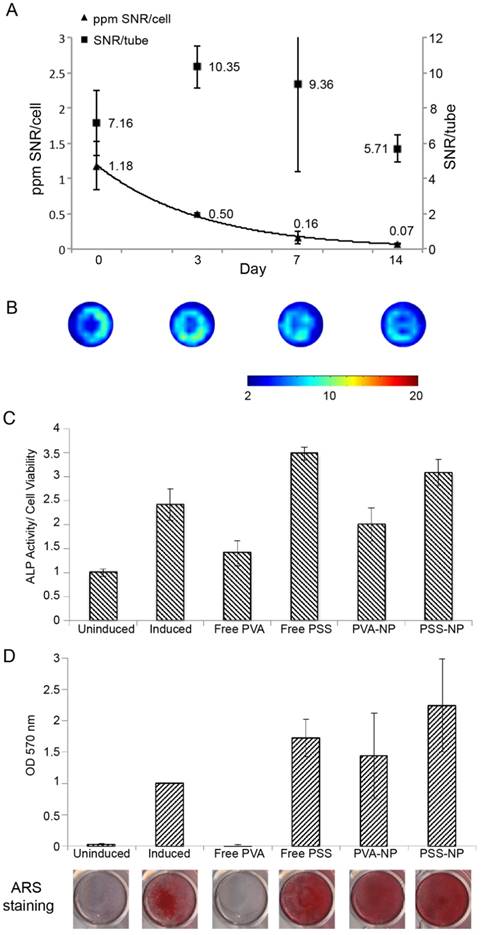
We next tested various differentiation markers to see whether the NPs affected the osteoblastogenesis capabilities of hMSC-TERT to differentiate into osteoblasts after uptake. ALP activity was measured 7 days after osteoinduction, and matrix mineralization by ARS staining was measured at day 14 of osteoinduction. Treating cells with PVA-NP or PSS-NP did not affect ALP activity or matrix mineralization after osteoinduction (Figure 5C-D). In contrast, free PVA-treated cells inhibited ALP activity by 40% when compared to the control (Figure 5C). Furthermore, free PVA completely abolished matrix mineralization (Figure 5D). Interestingly, PVA had no effect on the cell viability of unlabelled but induced cells (Figure S2); this indicates that high PVA concentrations were not toxic to the cells, but interfered with an unknown step of the osteoblastogenic differentiation pathway. Interestingly, free PSS-treated cells exhibited higher ALP activity (by 40%) when compared to the control (Figure 5C). This could be attributed to an increase in proliferation (as seen by the increase in cell viability above) in the free PSS-treated cells, thereby leading to higher ALP activity (Figure 3 and Figure 5C). Finally, NP uptake did not affect the expression of the osteoblastic marker Collagen A1 (COL1A1) after osteoinduction (Figure S5). These results suggest that PSS-NP-labelled cells retained their ability to differentiate into osteoblasts, which is important for the use of PSS-NPs for stem cell tracking in regenerative medicine.
Localized PSS-NP-labelled hMSCs can be tracked in vivo
Seeing that the cells can be labelled in vitro for 14 days, we investigated the tracking potential of PSS-NP by 19F MRI in vivo after implantation. hMSC-embedded implants are used in the treatment of orthopaedic conditions [38, 39] and we used a similar model for in vivo stem cell tracking. Biphasic HA/TCP granules are FDA-approved materials known to stimulate osteogenesis and are used in orthopaedic and dental implants [40, 41]. They were therefore chosen as the scaffold material onto which the cells can adhere to study in vivo MRI tracking while undergoing in vivo heterotopic bone formation.
Three scaffolds were prepared: control (blank scaffold), PSS-NP (labelled cells on the scaffold) and unlabelled (cells on the scaffold). Control, unlabelled cells and NP-labelled cells were seeded onto the HA/TCP granules and subcutaneously transplanted into pouches formed by blunt dissection on the posterior surface of the mouse—two at the front and two at the rear end. The mice were scanned at different time points using both 19F MRI and 1H MRI scans.
Labelled (red circle) and unlabelled (green circle) scaffolds are shown in Figure 6A. The scaffolds appeared dark alongside the mice organs in the 1H MRI images, while the 19F MRI signals appeared as clear hot spots without background when cells were labelled with PSS-NP, which is absent from the unlabelled cells. The HA/TCP scaffolds are solid with a short T2 relaxation time; as a result, they have a low signal in the 1H MRI images. PSS-NP-labelled cells on the scaffolds yielded a high signal in the 19F MRI images, but without anatomical information. By overlaying 1H MRI and 19F MRI images, we obtained detailed images showing the exact position of the cell-scaffold mix on the mice. We performed a time course experiment to determine the half-life of the 19F MRI signal in vivo. The 19F MRI signal gradually decreased over time. We were able to monitor the labelled stem cells up until 60 days after transplantation, with the cells retaining 10% of the initial signal at day 60 (Figure 6A-B). Importantly, this time period is comparable to the time taken for heterotopic bone formation to occur in this model [40]. The reduction in 19F MRI signal could be a result of natural degradation, exocytosis of nanoparticles or cell migration.
19F MRI signal is retained in PSS-NP-labelled hMSC-TERT throughout ectopic bone formation in vivo. hMSC-TERT were labelled with PSS-NPs for 3 days and seeded onto HA/TCP granules for 1 day. The cell/scaffold mixture was implanted subcutaneously onto the dorsal side of NOD/SCID mice. Live MRI signals were tracked over time. At the end of 60 days, the scaffolds were collected for QPCR and histological analyses. (A)1H MRI and 19F MRI of PSS-NP labelled hMSC on HA/TCP scaffold on days 3, 7, 11 and 60 post-transplantation. Open red circles are indicative of scaffolds seeded with PSS-NP labelled cells, green circles are scaffolds seeded with unlabelled cells, and white circles indicate the reference. Ref: 106 PSS-NP labelled cells fixed and stored at 4 °C (the same number seeded onto each scaffold). Color bar: signal intensity after background normalization. (B) SNR of the 19F MRI signal over time. Scaffolds containing differentiated hMSC-TERTs were collected after 60 days for QPCR and histological analyses. (C) QPCR of osteogenic markers after 60 days. (D) Representative images of scaffolds stained with Masson-Goldner Trichrome (top row) and von Kossa staining (bottom row). F is for fibrosis, S is for scaffold and M is for mineralized tissue.
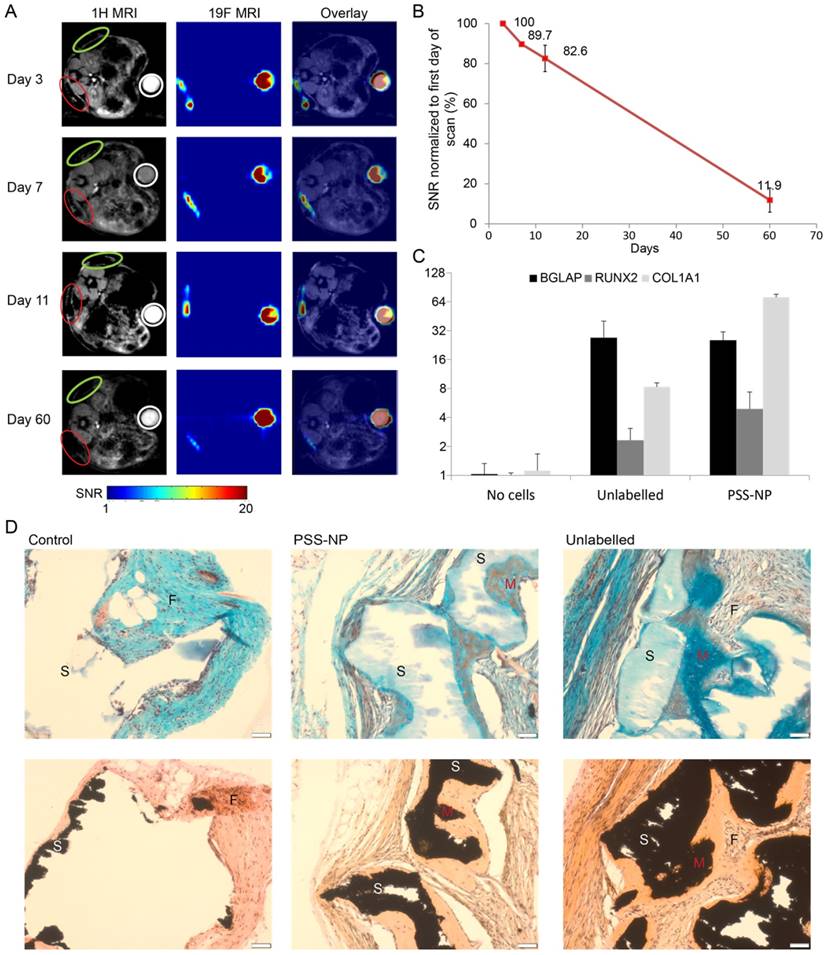
PSS-NP-labelled cells formed heterotopic bone formation in vivo
It is well documented that hMSC-TERT undergo osteoblastogenesis to form heterotopic bone when seeded on HA/TCP granules (scaffold) and implanted subcutaneously in immunodeficient mice [40]. We wanted to test whether the osteogenic potential of hMSC-TERTs was affected in vivo after labelling with PSS-NPs. The scaffolds from the MRI-scanned mice were collected two months after transplantation and stained with Masson-Goldner Trichrome stain and von Kossa stain (Figure 6D). Von Kossa staining stains for calcium, which appears black, while the Trichrome staining provides cellular detail. Since von Kossa staining stains both the HA/TCP scaffolds and mineralization by osteoblasts, von Kossa staining was compared with Trichrome staining of sections adjacent to the same location. The scaffolds stained black in the von Kossa staining, while it stained light blue or appeared white with Trichrome staining (as indicated by S). Mineralized tissues stained black using von Kossa staining, while they stained a darker blue when observed with Trichrome staining (as indicated by M). We observed that hMSC-TERT on HA/TCP scaffolds formed mineralized tissue (M in Figure 6D) in both unlabelled and PSS-NP- labelled cells. The osteoid can also be seen in PSS-NP-labelled cells (red amongst the blue). Additionally, osteogenesis of hMSC-TERTs and mineralization occurred adjacent to the scaffolds. The control (scaffold without cells), exhibited no bone formation; instead, fibrosis had occurred (indicated by F). Further analysis was performed on the harvested scaffolds to follow the expression of osteogenic markers: COL1A1, RUNX2 and BGLAP. All three markers were induced when compared to the blank control (Figure 6C). The expression of osteogenic markers, RUNX2 and BGLAP, was comparable in PSS NP-labelled and unlabelled cells; however, the expression of COL1A1 in the PSS-NP-labelled cells was significantly higher than that of the unlabelled control. Perhaps the PSS-NP stimulates the expression of COL1A1 but not the other factors that contribute towards osteoblastogenesis.
Overall, these results show that hMSC-TERT labelled with PSS-NPs can be observed for at least 60 days in vivo and that PSS-NP-labelled cells are viable and differentiated in vivo. Additionally, the differentiation of PSS-NP-labelled cells was comparable to that of untreated cells. At the end of the study, prior to harvesting the scaffolds, around 12% of PFOB remained in the implants after 60 days. Generally, when cells die their mRNA is degraded rapidly, but in our study specific primers for human osteoblastic markers (BGLAP, RUNX2 and COL1A1) confirmed cell viability and differentiation. This is further corroborated by cell differentiation as visualized by histological images in Figure 6D.
PSS-NP-labelled cells can be used as a prognostic indicator for immune rejection in stem cell therapy
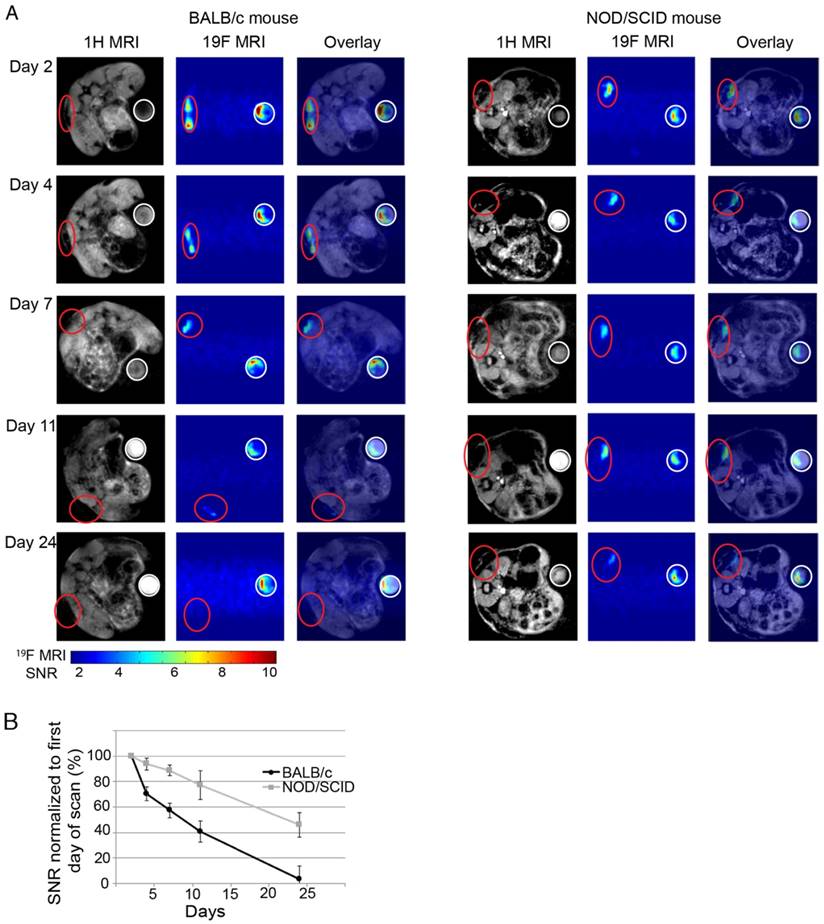
One of the applications of stem cell tracking is to determine immunorejection of cells after therapy. The use of autologous MSCs often comes with a number of limitations, which has led to a more attractive source—allogeneic MSCs [42]. Despite numerous advantages of allogeneic MSCs, there are still drawbacks. Allogeneic MSCs are not fully immune privileged and donor cells are can still be recognized as antigens in the recipient and rejected. Here we tested whether PSS-NP-labelled cells can be tracked by MRI during immune rejection by comparing an immunodeficient and an immunocompetent model. NOD/SCID mice were used as our immunodeficient model (they have severe defects in both innate and adaptive immunity), while BALB/c mice were used as our immunocompetent model (the original Prkdcscid mutation was from BALB/c mice). PSS-NP-labelled hMSC-TERT-EGFP cells were seeded onto HA/TCP, and implanted subcutaneously as described above onto immunodeficient and immunocompetent mice. The 19F MRI signals in the implants were compared over time in the two mouse strains. The 19F MRI signal decreased significantly faster in BALB/c mice than in NOD/SCID mice, suggesting that the cells were subject to immune clearance in BALB/c mice (Figure 7). Only 60% of the original 19F signal remained in the BALB/c mice one week after implantation and the signal completely disappeared after 24 days, while the NOD/SCID mice retained 90% and 50% of the signal at day 7 and 24, respectively (Figure 7B).
Immuno-rejection of PSS-NP-labelled hMSC-TERT on HA/TCP scaffolds. hMSC-TERT were labelled with PSS-NP for 3 days and seeded onto HA/TCP granules for 1 day. The cell/scaffold mixture was implanted subcutaneously onto the dorsal side of NOD/SCID and BALB/c mice. Live MRI signals were tracked over time. (A) 1H MRI and 19F MRI images of hMSC-TERT on HA/TCP on day 2, 4, 7, 16, and 24 post-transplantation on BALB/c and NOD/SCID mice. Open red circles indicate scaffolds embedded with PSS-NP labelled cells and white circles indicate the reference. Ref: 106 PSS-NP labelled cells fixed and stored at 4 °C (the same number seeded onto each scaffold). Color bar: signal intensity after background normalization. (B) SNR of 19F MRI signal over time.
The scaffolds were harvested with mice tissues attached, which made it difficult to determine cell viability of the transplanted cells. To determine cell viability, the expression of EGFP and human GAPDH in the transplanted cells were used as a marker of cell viability because these two genes are only expressed in hMSC-TERT-GFP and not in mice (Figure S6). RNA from hMSC-TERT-GFP (directly from culture) was used as a positive control and scaffolds containing heat-shocked cells (dead cells) were used as negative control. The Ct values for EGFP and GAPDH were under 15 and 20, respectively, in hMSC-TERT-GFP from culture, while the Ct values for EGFP and GAPDH of the heat-shocked cells were above 30 and 35, respectively (Figure S6). Scaffolds recovered from BALB/c mice had Ct values above 30 for EGFP and 35 for GAPDH, while scaffolds from NOD/SCID mice had Ct values below 25 for EGFP and below 30 for GAPDH. The higher expressions of EGFP and GAPDH from the cells recovered from NOD/SCID mice indicate that hMSC-TERT-GFP were retained in the scaffolds in NOD/SCID mice, while hMSC-TERT-GFP were cleared more rapidly in BALB/c mice. We also observed swollen lymph nodes in BALB/c mice (data not shown). We conclude that PSS-NPs are useful for monitoring stem cell clearance and survival in vivo, which is a valuable indicator for prognosis of therapy.
Overall, we demonstrated the viability of the transplanted cells by amplifying GAPDH and EGFP (Figure S6) in the immune rejection model. Figure 7 shows the decrease in 19F signal as rejection occurs or when cells are cleared away, and this is consistent with the higher Ct value of cells transplanted into BALB/c mice (Figure S6). In contrast, cells transplanted into NOD/SCID mice are viable cells since they have lower Ct values (Figure S6) and the 19F signal is visible (Figure 7). This demonstrates that the 19F signal is not retained after cell death.
Discussion
Here we have described the development and the application of PSS-NPs, a nano-contrast agent that enables tracking of the delivery, retention and migration of hMSCs in vivo using MRI. MSCs are labelled by caveolae-mediated endocytosis of PSS-NPs, facilitated by the PSS coating on the NP. The PSS-NPs were smaller than PVA-NPs (140 nm vs. 180 nm), a difference that could be explained by the different coating materials on the NPs. PSS polymers adsorb onto the surface of PLGA NPs via hydrophobic interactions between the PSS and PLGA polymers, thus creating a hydrophobic NP [18]. In contrast, PVA is attached to the NP through weak ester bonds between the hydroxyl group on PVAs and the carboxylic groups on PLGAs, thereby creating NPs with a covalently attached hydrophilic shell [25]. The difference in hydrophilicity on the outer layer of the NPs could explain the difference in the hydrodynamic size of the NPs.
PLGA NPs alone have a negative charge (-45 mV) in neutral buffer due to its carboxylic groups [43]. The PSS-NPs are also negatively charged, a result of the negatively charged sulfonate group on the PSS polymer, which potentiates the endocytic uptake of the NPs via the caveolae-mediated pathway [18]. Hydrogen bonding of PVA to the surface of PLGA NPs caused its zeta potential to be less negative because the hydroxyl group of PVA is protonated to OH2+. In fact, PVA-NPs are almost neutral in our study. PVA-NPs can have different pharmaceutical properties, which affect their abilities to be taken up by cells; however, the mechanism by which this occurs remains unknown [43].
The viability and differentiation potential of cells labelled with NPs were also tested. PSS-NPs did not affect cell viability when treated up to 3 days, but a high concentration of free PSS polymer stimulated cell proliferation. So far, the effect of PSS on cell proliferation has been confounding—one study showed an increase in cell metabolic activity (from MTT assay) when cultured on PSS-grafted surfaces [44], while another showed that cell proliferation (from cell counting) was not enhanced by PSS-coated films [45]. We used MTT assay (metabolic activity) as a representation of cell viability, thus it seems that our results are in line with the increase in metabolic activity of cells grown on PSS films. In vitro differentiation results showed that neither PVA-NP nor PSS-NP affected the ALP activity or mineralization of the cells, while free PVA polymer inhibited and free PSS polymer increased ALP activity. The observed increase in ALP activity in the presence of free PSS polymer is consistent with another study [45]. However, this study only looked at ALP activity and did not look at mineralization. Perhaps cells treated with a high concentration of PSS polymer have increased metabolic and ALP activities; however, the increase in ALP did not affect mineralization according to our study. It is also important to note that the PSS delivery methods in these studies are completely different and the results observed could be an effect of the substrate and delivery method instead of PSS. Finally, we note that the expression of COL1A1 was significantly higher in the PSS-NP-labelled cells than that of the unlabelled cells in vivo; however, the difference in expression was not observed in vitro. The reason for the discrepancy observed is unknown but it could be attributed to the higher complexity of signalling cascades in vivo than in vitro.
We envision that the main application of PSS-NPs will be to track the transplanted cells in a localized region. We observed that cells labelled with PSS-NP remained localized and traceable for up to 2 months after transplantation in immunodeficient mice, and the cells retained their ability to form heterotopic bone similar to unlabelled cells. This shows that PSS-NP-labelled cells retained their osteogenic potential in vivo, which is important for the practical use of labelled MSCs as a theranostic agent.
We have also shown that the signal from the transplanted cells can provide an indication of immune rejection and hence be used as a prognostic marker in connection with tissue regeneration. Importantly, for the clinical translation process, our NPs are composed of FDA-approved materials (albeit for other applications) such as PFOB, PSS and PLGA. However, pharmacokinetics and pharmacodynamics studies for the combined materials are needed before clinical applications. In fact, clinical trials have been done with commercial fluorinated nanoparticles in 19F MRI for cell monitoring [46]. We believe the endocytosis of our PSS-NPs can enhance the concentration of fluorine in the cells and thereby increase the 19F MRI SNR and image quality. One limitation of our study is the use of a 16.4 T MRI scanner that is not applicable to the clinic (1.5 T to 3 T MRIs are usually used in the clinic). However, a whole-body 11.7 T has been developed in France that is more suitable for our PSS-NP [47].
Conclusion
In summary, novel PSS-NP nanoparticles have been formulated for cell labelling. PSS-NPs are below 200 nm with a negative charge to prevent aggregation with positively charged proteins. The PSS-NPs were internalized into the cytoplasm via caveolae-mediated endocytosis, which did not affect hMSC-TERTs proliferation and differentiation. After labelling with PSS-NP, hMSC-TERT cells were readily monitored inside a scaffold by in vivo 19F MRI for at least 2 months when implanted in immune-compromised mice. In contrast, wild-type mice showed a rapid reduction in 19F MRI signal. Importantly, the PSS-NP-labelled cells retained their full ability to form bone in vivo. Our study shows a novel strategy to more strongly label cells with 19F, enabling tracking by MRI without affecting cellular function. This work can contribute to improved theranostic approaches of cell therapy.
Abbreviations
19F: Fluorine-19; ALP: alkaline phosphatase; ARS: Alizarin Red S;BGLAP: bone gamma-carboxyglutamic acid-containing protein; CAV1: Caveolin-1; COL1A1: alpha 1 type 1 collagen; EGFP: enhanced green fluorescent protein; GAPDH: Glyceraldehyde 3-phosphate dehydrogenase; HA/TCP: Hydroxyapatite/tricalcium phosphate; hMSCs: Human Mesenchymal Stem(Stromal) Cells; MRI: Magnetic Resonance Imaging; MTT: 3-(4,5-Dimethylthiazol-2-yl)-2,5-diphenyltetrazolium bromide; NP: nanoparticle; PFOB: perfluorooctylbromide; PLGA: poly(lactic-co-glycolic acid; PSS: polystyrene sulfonate; PVA: poly(vinyl alcohol); QPCR: quantitative polymerase chain reaction; RUNX2: Runt Related Transcription Factor 2; SNR: Signal to noise ratio; TERT: Telomerase reverse transcriptase.
Supplementary Material
Supplementary figures and tables.
Acknowledgements
hMSC-TERT and hMSC-TERT-GFP were kind gifts from Prof. Moustapha Kassem of Southern Denmark University. We would like to thank Dr. Maria Vad Jakobsen for helping us with animal studies and Dr Mads S Vinding for his insight on MRI. We are also grateful to Mr. Claus Bus and Ms. Rita Rosendahl at iNANO, and Ms. Jette Barlach at the Institute for Clinical Medicine (Aarhus University) for their technical assistance. This study was supported by the Lundbeck Foundation to the LUNA Centre (the Lundbeck Foundation Nanomedicine Centre for Individualized Management of Tissue Damage and Regeneration), Innovation Fund Denmark (MUSTER project) and the Danish National Research Foundation (CellPat centre).
Competing Interests
The authors have declared that no competing interest exists.
References
1. Bruder SP, Kurth AA, Shea M, Hayes WC, Jaiswal N, Kadiyala S. Bone regeneration by implantation of purified, culture-expanded human mesenchymal stem cells. J Orthop Res. 1998;16:155-62
2. Rodriguez-Porcel M. In Vivo Imaging and Monitoring of Transplanted Stem Cells: Clinical Applications. Curr Cardiol Rep. 2010;12:51-8
3. Kim T, Lee N, Arifin DR, Shats I, Janowski M, Walczak P. et al. In Vivo Micro-CT Imaging of Human Mesenchymal Stem Cells Labeled with Gold-Poly-l-Lysine Nanocomplexes. Advanced Functional Materials. 2017;27:1604213
4. Accomasso L, Gallina C, Turinetto V, Giachino C. Stem Cell Tracking with Nanoparticles for Regenerative Medicine Purposes: An Overview. Stem Cells Int. 2016;2016:7920358
5. Wang Y, Xu C, Ow H. Commercial nanoparticles for stem cell labeling and tracking. Theranostics. 2013;3:544-60
6. Li J, Lee WY, Wu T, Xu J, Zhang K, Li G. et al. Multifunctional Quantum Dot Nanoparticles for Effective Differentiation and Long-Term Tracking of Human Mesenchymal Stem Cells In Vitro and In Vivo. Adv Healthc Mater. 2016;5:1049-57
7. Himmelreich U, Hoehn M. Stem cell labeling for magnetic resonance imaging. Minim Invasive Ther Allied Technol. 2008;17:132-42
8. Edmundson M, Thanh NTK, Song B. Nanoparticles Based Stem Cell Tracking in Regenerative Medicine. Theranostics. 2013;3:573-82
9. Spence RK. Perfluorocarbons in the twenty-first century: clinical applications as transfusion alternatives. Artif Cells Blood Substit Immobil Biotechnol. 1995;23:367-80
10. Ahrens ET, Helfer BM, O'Hanlon CF, Schirda C. Clinical cell therapy imaging using a perfluorocarbon tracer and fluorine-19 MRI. Magn Reson Med. 2014;72:1696-701
11. Vu-Quang H, Vinding MS, Xia D, Nielsen T, Ullisch MG, Dong M. et al. Chitosan-coated poly(lactic-co-glycolic acid) perfluorooctyl bromide nanoparticles for cell labeling in 19F magnetic resonance imaging. Carbohydr Polym. 2016;136:936-44
12. Srinivas M, Cruz LJ, Bonetto F, Heerschap A, Figdor CG, de Vries IJM. Customizable, multi-functional fluorocarbon nanoparticles for quantitative in vivo imaging using 19F MRI and optical imaging. Biomaterials. 2010;31:7070-7
13. Gaudet JM, Ribot EJ, Chen Y, Gilbert KM, Foster PJ. Tracking the Fate of Stem Cell Implants with Fluorine-19 MRI. PLoS One. 2015;10:e0118544
14. Boehm-Sturm P, Mengler L, Wecker S, Hoehn M, Kallur T. In Vivo Tracking of Human Neural Stem Cells with 19-F Magnetic Resonance Imaging. PLoS One. 2011;6:e29040
15. Srinivas M, Heerschap A, Ahrens ET, Figdor CG, de Vries IJM. (19)F MRI for quantitative in vivo cell tracking. Trends Biotechnol. 2010;28:363-70
16. Srinivas M, Boehm-Sturm P, Figdor CG, de Vries IJ, Hoehn M. Labeling cells for in vivo tracking using 19F MRI. Biomaterials. 2012;33:8830-40
17. Janjic JM, Ahrens ET. Fluorine-containing nanoemulsions for MRI cell tracking. Wiley Interdiscip Rev Nanomed Nanobiotechnol. 2009;1:492-501
18. Voigt J, Christensen J, Shastri VP. Differential uptake of nanoparticles by endothelial cells through polyelectrolytes with affinity for caveolae. Proc Natl Acad Sci U S A. 2014;111:2942-7
19. Pelkmans L, Helenius A. Endocytosis via caveolae. Traffic. 2002;3:311-20
20. Baker N, Sohn J, Tuan RS. Promotion of human mesenchymal stem cell osteogenesis by PI3-kinase/Akt signaling, and the influence of caveolin-1/cholesterol homeostasis. Stem Cell Res Ther. 2015;6:238
21. Baker N, Zhang G, You Y, Tuan RS. Caveolin-1 regulates proliferation and osteogenic differentiation of human mesenchymal stem cells. J Cell Biochem. 2012;113:3773-87
22. Parton RG, Simons K. The multiple faces of caveolae. Nat Rev Mol Cell Biol. 2007;8:185-94
23. Oh P, McIntosh DP, Schnitzer JE. Dynamin at the Neck of Caveolae Mediates Their Budding to Form Transport Vesicles by GTP-driven Fission from the Plasma Membrane of Endothelium. J Cell Biol. 1998;141:101-14
24. Mayor S, Pagano RE. Pathways of clathrin-independent endocytosis. Nat Rev Mol Cell Biol. 2007;8:603-12
25. Diaz-Lopez R, Tsapis N, Santin M, Bridal SL, Nicolas V, Jaillard D. et al. The performance of PEGylated nanocapsules of perfluorooctyl bromide as an ultrasound contrast agent. Biomaterials. 2010;31:1723-31
26. Abdallah BM, Haack-Sorensen M, Burns JS, Elsnab B, Jakob F, Hokland P. et al. Maintenance of differentiation potential of human bone marrow mesenchymal stem cells immortalized by human telomerase reverse transcriptase gene despite [corrected] extensive proliferation. Biochem Biophys Res Commun. 2005;326:527-38
27. Bentzon JF, Stenderup K, Hansen FD, Schroder HD, Abdallah BM, Jensen TG. et al. Tissue distribution and engraftment of human mesenchymal stem cells immortalized by human telomerase reverse transcriptase gene. Biochem Biophys Res Commun. 2005;330:633-40
28. Qiu W, Hu Y, Andersen TE, Jafari A, Li N, Chen W. et al. Tumor necrosis factor receptor superfamily member 19 (TNFRSF19) regulates differentiation fate of human mesenchymal (stromal) stem cells through canonical Wnt signaling and C/EBP. J Biol Chem. 2010;285:14438-49
29. Gregory CA, Gunn WG, Peister A, Prockop DJ. An Alizarin red-based assay of mineralization by adherent cells in culture: comparison with cetylpyridinium chloride extraction. Anal Biochem. 2004;329:77-84
30. Al-Nbaheen M, Vishnubalaji R, Ali D, Bouslimi A, Al-Jassir F, Megges M. et al. Human stromal (mesenchymal) stem cells from bone marrow, adipose tissue and skin exhibit differences in molecular phenotype and differentiation potential. Stem Cell Rev. 2013;9:32-43
31. Wu K, Song W, Zhao L, Liu M, Yan J, Andersen MO. et al. MicroRNA functionalized microporous titanium oxide surface by lyophilization with enhanced osteogenic activity. ACS Appl Mater Interfaces. 2013;5:2733-44
32. Eskildsen T, Taipaleenmaki H, Stenvang J, Abdallah BM, Ditzel N, Nossent AY. et al. MicroRNA-138 regulates osteogenic differentiation of human stromal (mesenchymal) stem cells in vivo. Proc Natl Acad Sci U S A. 2011;108:6139-44
33. Giraudeau C, Flament J, Marty B, Boumezbeur F, Mériaux S, Robic C. et al. A new paradigm for high-sensitivity 19F magnetic resonance imaging of perfluorooctylbromide. Magn Reson Med. 2010;63:1119-24
34. Abdallah BM, Ditzel N, Kassem M. Assessment of Bone Formation Capacity Using In vivo Transplantation Assays: Procedure and Tissue Analysis. In: (ed.) Westendorf JJ. Osteoporosis: Methods and Protocols. Totowa, NJ: Humana Press. 2008:89-100
35. Pisani E, Ringard C, Nicolas V, Raphael E, Rosilio V, Moine L. et al. Tuning microcapsules surface morphology using blends of homo- and copolymers of PLGA and PLGA-PEG. Soft Matter. 2009;5:3054-60
36. Liu X, Zhao J, Guo D, Wang Z, Song W, Chen W. et al. Synthesis and evaluation of perfluorooctylbromide nanoparticles modified with a folate receptor for targeting ovarian cancer: in vitro and in vivo experiments. Int J Clin Exp Med. 2015;8:10122-31
37. Pisani E, Tsapis N, Paris J, Nicolas V, Cattel L, Fattal E. Polymeric Nano/Microcapsules of Liquid Perfluorocarbons for Ultrasonic Imaging: Physical Characterization. Langmuir. 2006;22:4397-402
38. Tang D, Tare RS, Yang LY, Williams DF, Ou KL, Oreffo RO. Biofabrication of bone tissue: approaches, challenges and translation for bone regeneration. Biomaterials. 2016;83:363-82
39. de Misquita MR, Bentini R, Goncalves F. The performance of bone tissue engineering scaffolds in in vivo animal models: A systematic review. J Biomater Appl. 2016;31:625-36
40. Abdallah B, Ditzel N, Kassem M. Assessment of Bone Formation Capacity Using In vivo Transplantation Assays: Procedure and Tissue Analysis. Westendorf J, editor. Osteoporosis: Humana Press. 2008:89-100
41. Krebsbach PH, Kuznetsov SA, Satomura K, Emmons RV, Rowe DW, Robey PG. Bone formation in vivo: comparison of osteogenesis by transplanted mouse and human marrow stromal fibroblasts. Transplantation. 1997;63:1059-69
42. Zhang J, Huang X, Wang H, Liu X, Zhang T, Wang Y. et al. The challenges and promises of allogeneic mesenchymal stem cells for use as a cell-based therapy. Stem Cell Res Ther. 2015;6:234
43. Sahoo SK, Panyam J, Prabha S, Labhasetwar V. Residual polyvinyl alcohol associated with poly (d,l-lactide-co-glycolide) nanoparticles affects their physical properties and cellular uptake. J Control Release. 2002;82:105-14
44. Rohman G, Huot S, Vilas-Boas M, Radu-Bostan G, Castner DG, Migonney V. The grafting of a thin layer of poly(sodium styrene sulfonate) onto poly(epsilon-caprolactone) surface can enhance fibroblast behavior. J Mater Sci Mater Med. 2015;26:206
45. Oughlis S, Changotade S, Poirier F, Cieutat AM, Rohman G, Peltzer J. et al. Improved proliferation and osteogenic differentiation of human mesenchymal stem cells on a titanium biomaterial grafted with poly(sodium styrene sulphonate) and coated with a platelet-rich plasma proteins biofilm. J Bioact Compat Polym. 2016;31:568-82
46. W.M.Bulte J. 19F Hot Spot MRI of Human Adipose-derived Stem Cells for Breast Reconstruction (CS-1000). ClinicalTrialsgov. 2016
47. Vedrine P, Aubert G, Belorgey J, Berriaud C, Bourquard A, Bredy P. et al. Manufacturing of the Iseult/INUMAC Whole Body 11.7 T MRI Magnet. IEEE Trans Appl Supercond. 2014;24:1-6
Author contact
![]() Corresponding author: changau.dk; Interdisciplinary Nanoscience Center (iNANO), Aarhus University, Denmark
Corresponding author: changau.dk; Interdisciplinary Nanoscience Center (iNANO), Aarhus University, Denmark