Impact Factor
- Issue 14; 2026
- Issue 13; 2026
- Issue 12; 2026
- Issue 11; 2026
- Issue 10; 2026
- Volume 16; 2026
- Advance Articles
- Past Issues
- Cover Images
- Cover Suggestion
- Index & Coverage
- Special Issues
Introduction
Results
Discussion
Materials and Methods
Abbreviations
Supplementary Material
Acknowledgements
References
International Journal of Biological Sciences
International Journal of Medical Sciences
 Global reach, higher impact

Theranostics 2018; 8(7):1850-1868. doi:10.7150/thno.22167 This issue Cite
Research Paper
Long Non-coding MIR205HG Depletes Hsa-miR-590-3p Leading to Unrestrained Proliferation in Head and Neck Squamous Cell Carcinoma
Silvia Di Agostino1 ![]() , Fabio Valenti1, Andrea Sacconi1, Giulia Fontemaggi1, Matteo Pallocca2, Claudio Pulito3, Federica Ganci1, Paola Muti4, Sabrina Strano3, Giovanni Blandino1
, Fabio Valenti1, Andrea Sacconi1, Giulia Fontemaggi1, Matteo Pallocca2, Claudio Pulito3, Federica Ganci1, Paola Muti4, Sabrina Strano3, Giovanni Blandino1 ![]()
1. Oncogenomic and Epigenetic Unit, Department of Diagnostic Research and Technological Innovation, IRCCS Regina Elena National Cancer Institute, Rome 00144, Italy
2. SAFU Unit, Department of Diagnostic Research and Technological Innovation, IRCCS Regina Elena National Cancer Institute, Rome 00144, Italy
3. Molecular Chemoprevention Group, Department of Diagnostic Research and Technological Innovation, IRCCS Regina Elena National Cancer Institute, Rome 00144, Italy
4. Dofasco Chair Cancer Experimental Therapeutics, Department of Oncology, Faculty of Health Science, McMaster University, Hamilton, Canada
Received 2017-7-31; Accepted 2017-12-24; Published 2018-2-12
Abstract

Over 70% of head & neck squamous cell carcinoma (HNSCC) patients carry TP53 oncogenic mutations. Here we studied the role of specific tumor-derived mutant p53 proteins in the aberrant transcription of long non-coding (lnc) MIR205HG gene in head and neck cancer cells.
Methods: To understand the role of lncMIR205HG, that we showed to be transcriptionally regulated by mutant p53 in HNSCC, we have employed siRNA and shRNA in CAL27 and FaDu HNSCC cell lines to suppress p53 gene expression in ChIP assays and RT-qPCR. We validated our findings in a cohort of 522 HNSCC patients from The Cancer Genome Atlas Data Portal (TCGA). We further evaluated our results in 63 HNSCC tumor samples collected at our institute, 32 of which were characterized by mutated TP53 (missense mutations) while 31 were characterized by wild-type TP53.
Results: Maturation of pre-MIR205HG transcript produces two non-coding RNAs, lncMIR205HG and hsa-miR-205-5p. Down-regulation of lncMIR205HG expression significantly reduced cell proliferation, cell migration and clonogenic activity of head and neck cancer cells. Expression of MIR205HG was significantly increased in HNSCC with mutated TP53 when compared with matched non-tumoral tissues. Furthermore, MIR205HG expression levels were significantly higher in tumoral samples with mutant p53 than in tumoral tissues expressing wild-type p53. Mechanistically, MIR205HG depletes endogenous miR-590-3p leading to increased cyclin B, cdk1, and YAP protein expression.
Conclusions: Taken together, these findings identify a transcriptional and post-transcriptional molecular network that includes mutant p53 protein, lncMIR205HG, YAP, and other proliferation-related genes, which are enriched in HNSCC patients with poor prognosis.
Keywords: gene-expression/non-coding RNA/proliferation/HNSCC/mutant p53/YAP
Introduction
Somatic missense mutations in TP53 gene occur in over half of all human cancers and may impact the residues involved in direct contact with DNA (DNA contact mutants) or substitute the amino acids required for proper p53 protein folding and structure (conformational mutants) [1, 2]. Mutations in the p53 protein may not only disrupt its wild-type tumor-suppressing function but also confer new oncogenic properties (GOF, gain-of-function) that provide a selective growth advantage to the tumor cells [3]. Mutant p53 (mutp53) proteins with GOF do not recognize specific wt-p53 consensus sequences in the target gene promoters but have been shown to interact with and aberrantly promote the activity of several transcription factors, such as NF-Y, SREBPs, E2F1-4, Ets-1, and YAP [4-9]. Furthermore, mutations in the TP53 gene are associated with poor clinical outcome in several human cancers including head and neck squamous cell carcinoma (HNSCC) [3, 10, 11].
Long noncoding RNAs (lncRNAs) belong to a class of ncRNAs that are longer than 200 nucleotides [12, 13]. Several studies have shown that lncRNAs may act as important cis- or trans-regulators in various biological processes [14-16]. Mutations in lncRNAs or deregulation of their expression are associated with a wide range of diseases, especially cancers and neurodegenerative diseases, through diverse and poorly understood molecular mechanisms [12, 14]. A recurrent theme in lncRNA biology is their ability to function in the recruitment of protein factors for regulation of chromatin states [15]. Moreover, lncRNAs may suppress precursor mRNA splicing by depleting RNA-binding proteins and/or modulate translation by acting as decoys for microRNAs, thus releasing microRNA-mediated inhibition of target mRNA expression [16]. Finally, lncRNAs can influence protein localization and participate in the formation of protein complexes where they perform scaffolding functions [15-18].
MicroRNAs (miRNAs) are 22-nucleotide-long non-coding RNAs (ncRNAs), which can modulate gene expression at the post-transcriptional level. Importantly, tumorigenesis has been linked to the deregulated expression of miRNAs, which could act either as tumor suppressors or oncogenes (oncomirs) and may also contribute to tumor metastasis [19-22]. miRNAs are therefore emerging as markers for diagnosis, staging, and treatment of cancer [19, 23, 24]. Wild-type p53 has been shown to regulate the maturation and expression of miRNAs in cancers [25, 26]. We recently reported that mutp53 could modulate the expression of miRNAs, such as miR-128b-5p and miR-223 [27, 28]. Furthermore, we identified TP53 mutation-associated miR-205-5p to be the best predictor of clinical outcome in HNSCC patients [11]. Recent genomic data have revealed that mutation of TP53 is the most frequent event in HNSCC, occurring in up to 85% of human papillomavirus (HPV)-negative primary tumors [29, 30]. Also, TP53 mutations are associated with poor therapeutic response and decreased survival in HNSCC (http://www-p53.iarc.fr) [31, 32].
It has been reported that miR-205 may act either as a tumour suppressor by inhibiting proliferation and invasion, or as an oncomir facilitating tumor initiation and proliferation, depending on the specific tumor context and target genes [33, 34]. High expression of miR-205 has been associated with tumor progression in HNSCC, ovarian cancer, and lung cancer [35-37].
Herein, we studied the oncogenic role of lncMIR205HG and the transcriptional regulation of both hsa-miR-205-5p and its host gene in HNSCC. Mechanistically, we showed that mutp53 binds to the MIR205HG gene promoter and positively regulates its transcription. Two pools of biologically independent RNAs, lncMIR205HG and miR-205-5p, are formed by processing of MIR205HG pre-mRNA. We have also shown in HNSCC patients that high expression levels of lncMIR205HG are associated with tumoral samples and they depend upon the expression of mutp53 proteins.
We have previously reported that YAP1, the effector of the HIPPO pathway, physically interacts with mutp53, potentiating the transcriptional activity of the mutant p53/NF-Y oncogenic complex on ccna, ccnb1, and cdk1 gene promoters, and causes a dramatic increase in proliferation [9]. In this study, we show that MIR205HG acts as an endogenous sponge for miR-590-3p activity, leading to high CCNB1, Cdk1 and YAP1 protein expression levels and increased proliferation.
Results
NF-Y and E2F1 mediate recruitment of mutant p53 to the MIR205HG promoter and upregulate the expression of lncMIR205HG and miR-205-5p
We previously reported that TP53 mutations are associated with a shorter recurrence-free survival in a cohort of HNSCC patients [11]. Tumors with wild-type TP53 could be discriminated from those carrying the mutated gene, with miR-205-5p serving as the best predictor of clinical outcome in HNSCC patients [11]. We also observed that the hsa-miR-205 was located at the boundary of the third intron and the fourth exon of the MIR205 host gene (MIR205HG; ID: 642587: non-protein coding), which codes for the lncRNA (Figure 1A). Transient depletion of mutp53 protein in CAL27 (mutp53H193L) and FaDu (mutp53R248L) HNSCC cell lines (Figure S1A) significantly decreased miR-205-5p expression (Figure 1B). Similar findings were observed in CAL27 cells whose mutp53 expression was stably blocked (Figure S1B, C). On the other hand, the ectopic expression of five mutant p53 proteins among the most frequently mutated p53 proteins in HNSCC (http://p53.iarc.fr), mutp53R273H (DNA contact mutant), mutp53R175H (conformational mutant), mutp53H179R (conformational mutant), mutp53R248W (DNA contact mutant) and mutp53D281G (DNA contact mutant) in A254 p53-null cells, resulted in significant upregulation of miR-205-5p expression (Figure S1D). Similarly, we observed downregulation of MIR205HG transcript in CAL27 and FaDu cell lines upon mutp53 depletion (Figure 1C and Figure S1B, C) whereas ectopic expression of mutp53 in A254 cells enhanced MIR205HG mRNA level as evaluated by two different pairs of primers in the RT-qPCR analysis (Figure S1E).
NF-Y and E2F1 transcription factors mediate the recruitment of mutant p53 on the MIR205HG promoter and upregulate the expression of both lncMIR205HG and miR-205-5p. (A) Schematic representation of the MIR205HG locus gene (Chr. 1, NC_000001.11; ID: 642587) and the position of miR-205 (miRbase accession: MI0000285) at the junction of the third intron and the fourth exon of the gene. (B) miR-205-5p expression was analyzed by Taq-Man assay in RNA samples derived from CAL27 (mutp53H193L) and FaDu (mutp53R248L) cells transfected with si-GFP oligos and two different si-RNAs against p53, si-p53#1 and si-p53#2. The expression was normalized versus RNU49. p-values were calculated with two-tailed Student's t-test. Statistically significant results are indicated with *p-value < 0.005 and **p-value < 0.05. (C) MIR205HG expression was analyzed by RT-qPCR in cDNA derived from CAL27 and FaDu cells described in (B). Statistically significant results are indicated with *p-value < 0.005 and **p-value < 0.05. (D) Schematic representation of the MIR205HG gene promoter and the third intron. (E, F) Western blotting panel: immunoblotting of p53 and GAPDH (loading control) proteins from whole protein lysates of CAL27 cells transfected with si-GFP and si-p53#1 oligos. For convenience, si-p53#1 oligonucleotides are called si-p53. The cross-linked chromatin purified by these cells was used in ChIP experiments. A representative image is shown. ChIP analysis of mutp53, DNA Polimerase II (PolII) (E), and H4 acetylated histone- (H4) and H4 Lys5acetylated histone- (H4AcK5) (F) enrichments from CAL27 cells transfected with si-p53 or si-GFP as a negative control. The experiment was performed in biological triplicate. The MIR205HG promoter and the third intron occupancy were analyzed by qPCR. Normalization was performed to the amount of input chromatin. The ChIP samples were further tested by qPCR of a region that was negative for mutp53 recruitment [66]. In all experiments, bars represent mean ± SD from three biological replicates. p-values were calculated with two‐tailed Student's t‐test. Statistically significant results are indicated with *p-value < 0.05. (G) ChIP analysis of mutp53 from CAL27 cells transfected with a commercial smart pool of siRNA oligos targeting NF-Y (si-NF-Y) or si-GFP as a negative control. The experiment was performed in biological triplicate. The MIR205HG promoter was analyzed by qPCR. Normalization was performed to the amount of input chromatin. p-values were calculated with two-tailed Student's t-test. Statistically significant results are indicated with *p-value < 10-4. (H) MIR205HG, ccnb and cdk1 gene expressions were analyzed by RT-qPCR in CAL27 cells described in (G). Bars represent mean ± SD from three biological replicates. p-values were calculated with two-tailed t-test. Significant p-values are indicated as *p-value < 0.05 and **p-value < 0.01. (I) MIR205HG expression was analyzed by RT-qPCR ins CAL27 cells transfected with siGFP and two different siRNAs against E2F1 transcript, si-E2F1#1 and si-E2F1#2 oligos. (J) MIR205HG and pre-miR-205-5p expression were analyzed by RT-qPCR from CAL27 and FaDu cells transfected with ASO-control and ASO-MIR205HG oligos. (K) pre-miR-205 and MIR205HG expressions were analyzed by RT-qPCR in CAL27 and FaDu cells transfected with LNA-control and LNA-miR205 oligos. In all experiments, bars represent mean ± SD from three biological replicates. p-values were calculated with two-tailed t-test. Significant p-values are indicated as *p-value < 0.05.
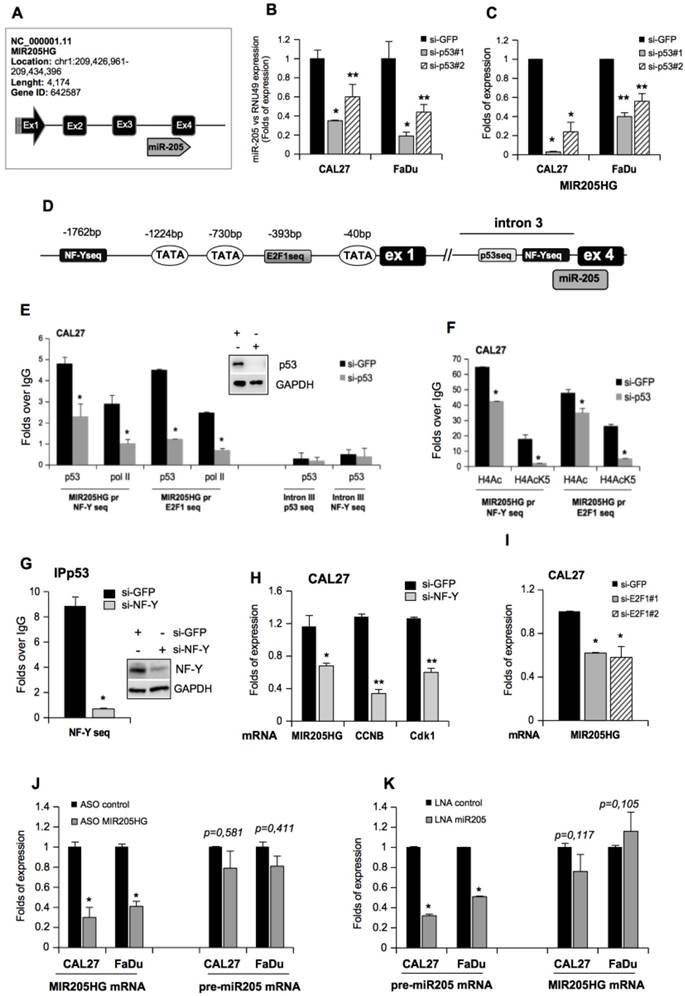
It has been demonstrated that mutant p53 proteins physically interact with NF-Y and E2F1 transcription factors and that this interaction occurs, respectively, on the CCAAT and E2F consensus sequences of gene promoters (ccna, ccnb, cdc25c, cdk1 and id4) leading to increased protein expression [5, 6, 9, 38]. Therefore, we evaluated the potential recruitment of mutp53 onto the regulatory elements located in the upstream region of the first exon of MIR205HG and the third intron preceding miR-205-5p (Figure 1D). By using MatInspector software (www.genomatix.de), we identified the CCAAT and E2F1 consensus sequences potentially involved in the recruitment of mutp53 protein (Figure 1D).
Chromatin immunoprecipitation analyses (ChIP) of si-GFP CAL27 cells revealed that mutp53 and polymerase II were recruited to the CCAAT box (-1762bp; Figure 1E) and the E2F1 consensus sequence (-393bp; Figure 1F). This recruitment was impaired in si-p53 CAL27 cells (Figure 1E, F) and correlated with pan-acetylation of histone H4 and lysine 5 acetylation of histone H4 (Figure 1F), which were significantly decreased following mutant p53 depletion. Accordingly, miR-205-5p and MIR205HG expressions were significantly reduced in si-p53 CAL27 cells (Figure 1B, C).
It has previously been shown that wild-type p53 binds to the region in the third intron immediately upstream of miR-205-5p (Figure 1D) [39]. Indeed, a consensus site for wt-p53 is present in this intron. As expected, endogenous mutp53 protein in CAL27 cells was unable to bind to the wt-p53 consensus (Figure 1E). Thus, this region served as an internal negative control for mutp53 chromatin enrichment. Also, the CCAAT box present in the MIR205HG third intron did not show significant mutp53 enrichment, suggesting that this genomic region is not responsible for mutp53-dependent regulation of miR-205-5p (Figure 1E). Wild-type p53 protein could bind to its p53-consensus sequence in the third intron to induce the transcription of miR-205 [39].
Since wild-type p53-carrying HNSCC cell lines are not available, endogenous mutp53 was knocked down by si-RNA transfection in CAL27 cells for 24 h and subsequently replaced by transfecting ectopic wild type p53 for an additional 24 h (Figure S1F). As expected, the silencing of endogenous mutp53 decreased lncMIR205HG expression, while the reintroduction of wt-p53 protein did not affect it (Figure S1G). This result suggested that the MIR205HG transcription was regulated by mutant p53. Interestingly, analysis of ChIP-seq raw data generated by Vaughan and colleagues, who mapped the recruitment of ectopic mutp53R273H protein on the genome of H1299 p53 null cells, revealed enrichment on the MIR205HG promoter (Figure S2A) [40]. Further analysis of the same ChIP-seq dataset showed that the region immediately upstream of miR-205-5p in the third intron was devoid of mutp53 binding, which was consistent with our chromatin immunoprecipitation results (Figure S2A and Figure 1E).
Given that mutp53 requires a physical interaction with NF-Y and E2F1 proteins on their respective consensus sequences to transcribe target genes [5, 6, 9, 38], we examined whether mutp53 recruitment on MIR205HG promoter was dependent on NF-Y and E2F1 transcription factors. We found that depletion of NF-Y expression by siRNA transfection caused a strong reduction of mutp53 occupancy on CCAAT box (Figure 1G) accompanied by a significant decrease in MIR205HG expression (Figure 1H). We previously demonstrated that mutp53/NF-Y interaction on the CCAAT boxes led to increased transcription of cell cycle regulatory genes (ccna, ccnb, cdc25C, and cdk1) and to high proliferation rates in cancer cells [5, 9]. Accordingly, we found reduced mRNA levels of cyclinB and cdk1 genes after NF-Y depletion (Figure 1H).
MIR205HG expression also decreased upon E2F1 depletion by siRNA transfection (Figure 1I and Figure S2B). As the negative control, we examined the recruitment of the transcription factor ZEB, which did not have consensus sequences on the MIR205HG gene promoter, by MatInspector analysis. Accordingly, we observed that ZEB down-regulation by specific si-RNA transfection did not affect MIR205HG mRNA expression in CAL27 cells (Figure S2C). These results suggested that both NF-Y and E2F1 transcription factors were crucial mediators of the aberrant MIR205HG gene expression driven by mutp53.
To investigate the relationship between MIR205HG and miR-205-5p mature transcripts, we engineered the down-regulation of MIR205HG expression using highly potent single-stranded antisense oligonucleotides (ASO) for silencing lncRNAs. The results indicated that ASO-MIR205HG transfection in CAL27 and FaDu cells significantly decreased MIR205HG expression (Figure 1J). Interestingly, in these cells, we ascertained that silencing of MIR205HG did not affect miR-205-5p expression (Figure 1J). As further controls, before the splicing process, we designed two pairs of primers encompassing the sequence at the first exon (pre-MIR205HG#1 primers), and the sequence at the first exon and first intron junction (pre-MIR205HG#2 primers) to amplify the mRNA precursor of MIR205HG (pre-MIR205HG (Figure S2D and Table S1). In CAL27 cells transfected with ASO-MIR205HG, we did not observe a decrease in pre-MIR205HG mRNA compared to the control (Figure S2D), indicating the specificity of the ASO-MIR205HG oligonucleotide for the mature MIR205HG transcript and the independence between lncMIR205HG and miR-205-5p mature RNA products.
We also transfected CAL27 and FaDu cells with an LNA-modified 8-mer seed-targeting anti-miR-205-5p to obtain an efficient knock-down of miR-205-5p expression (Figure 1K). Silencing of miR-205-5p did not influence lncMIR205HG expression (Figure 1K). This intriguing result led us to hypothesize that mutp53 induces the transcription of a unique pool of immature mRNAs that are processed in two different and independent mature RNAs, lncMIR205HG and miR-205-5p.
LncMIR205HG is required for pro-tumorigenic activities of the mutant p53 protein
Has-miR-205 has been shown to serve as a prognostic and diagnostic biomarker in various squamous cell carcinomas [35, 41, 42]. However, not much is known about the tissue expression and biological functions of its host gene, lncMIR205HG. To provide a more detailed molecular characterization of lncMIR205HG, we analyzed its expression levels and histone modification data in eight HNSCC cell lines [43]. We found that MIR205HG was expressed at high levels (FPKM > 100) in 6 out of 8 HNSCC cell lines (Figure 2A).
LncMIR205HG is required for pro-tumorigenic activities of mutant p53 protein. (A) UCSC Genome Browser screenshots for MIR205HG locus. The displayed track shows RNA-seq expression level in 8 different HNSCC cell lines (GSE68872). (B) Total RNA was isolated from FaDu and ASO-contr and ASO-MIR205HG CAL27 cells, respectively. 6 μg of RNA was subjected to Northern blot using MIR205HG biotin-labelled oligos (Table S3). Ethidium bromide staining of 28S rRNA and 18S rRNA is shown as a loading control. (C) Fractionation of nuclei (N) and cytosol (C) from CAL27 and FaDu cells. Control of fractions was monitored by Western blot using anti-nucleolin and anti-actin as markers of nucleus and cytosol, respectively. MIR205HG expression was analyzed by RT-qPCR from nuclei (RNU49 expression was used to normalize) and cytosol (actin expression was used to normalize) fractions. The experiment conducted in two biological replicates obtained the same results. (D) FISH analysis was performed on CAL27 and FaDu cells with Stellaris FISH technology where a probe set of 27 multiple singly labelled oligonucleotides hybridize along each MIR205HG molecule and the signal is only detectable when tens of probes are bound (red). The DNA was stained with TO-PRO-3 (Blu). Representative images are shown. (E) MIR205HG and miR-205-5p expression was analyzed by RT-qPCR from CAL27 cells transfected with ASO-control and ASO-MIR205HG oligos. Bars represent mean ± SD from three biological replicates. p-values were calculated with two-tailed t-test. Significant p-values are indicated as *p-value < 0.05 versus the control sample. (F) CAL27 cells transfected for 48 h with ASO-control and ASO-MIR205HG oligos were labelled with PI staining solution and analyzed by flow cytometry (pre-G1, G0/G1, S, and G2/M). Experiments performed in triplicate yielded similar results. Statistical analysis of the number of cells (%) in G1, S and G2 phases is shown. Data are presented as mean ± SD of three independent tests. *p-value < 0.05. (G) Cells treated as in (E) were incubated with BrdU for 20 min. The BrdU-positive cells were then identified by immunofluorescence staining and observed under a fluorescence microscope. Data are expressed as the mean of the percentage of BrdU-positive cells ± SD. *p-value < 0.05. (H) MIR205HG and CCNB1 expressions were analyzed by RT-qPCR in cDNA derived from the H1299 clone 41 cell induced by ponasterone A (Pon+) to express mutp53R175H protein; H1299 clone 41 cell not induced (Pon-) was used as control. Data are presented as mean ± SD of three independent experiments. *p-value < 0.05, **p-value < 10-4. (I) and (J) The abundances of CCNB1 (I) and lncMIR205HG (J) transcripts in the polysome and non-polysome fractions from Pon- and Pon+ H1299 clone 41 cells were measured by RT-qPCR and normalized by total CCNB1 and lncMIR205HG mRNAs, respectively, in all fractions. Bars represent mean ± SD from 3 replicates; a representative experiment is shown.
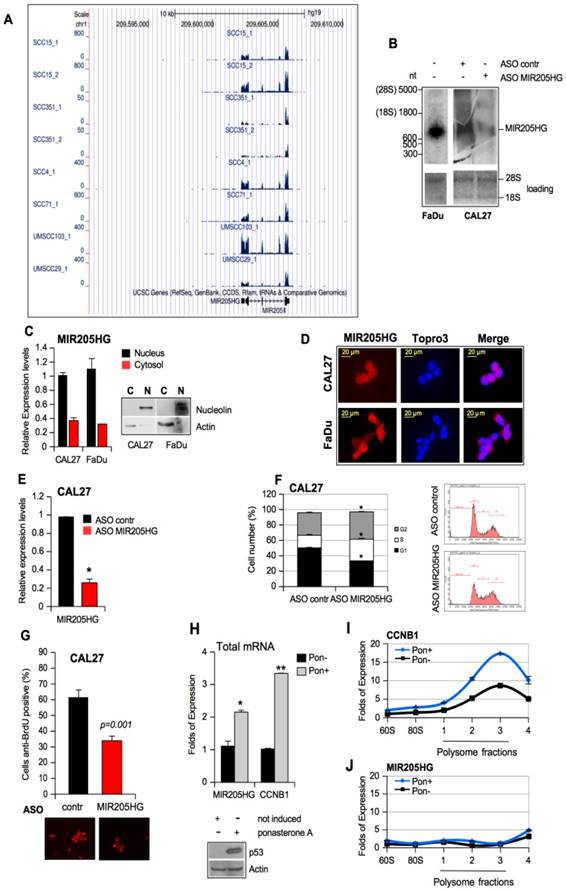
ChIP-seq data on CAL27 showed enrichment of H3K27ac and H3K4me3 on the MIR205HG locus (Figure S3A, red graphs), suggesting efficient transcriptional activity [44]. The histone modification profiles on 7 ENCODE cell lines confirmed similar patterns on the NHEK cell lines (Keratinocytes) (Figure S3A, pink graphs). Furthermore, repressive marker H3K27me3 was absent from the locus (Figure S3A). The same tracks were observed for CCNB1 locus, which was actively transcribed in cancer cell lines showing high expression and a similar histone modification pattern (Figure S3B). In parallel, we performed Northern blotting on RNAs isolated from FaDu cells and ASO-MIR205HG and ASO-control CAL27 cell lines. As shown in Figure 2B, one transcript of approximately 900 nucleotides was detected by a specific pool of biotinylated probes (Table S3), which matched the length of the lncMIR205HG gene transcripts (899 nt; NR_145437.1). The Northern blot of CAL27 cells showed downregulation of the band corresponding to the size of the lncMIR205HG transcript of 899nt (Figure 2B). We confirmed the quantitative ratio of MIR205HG mRNA between CAL27 and FaDu cells by RT-qPCR (Figure 3C).
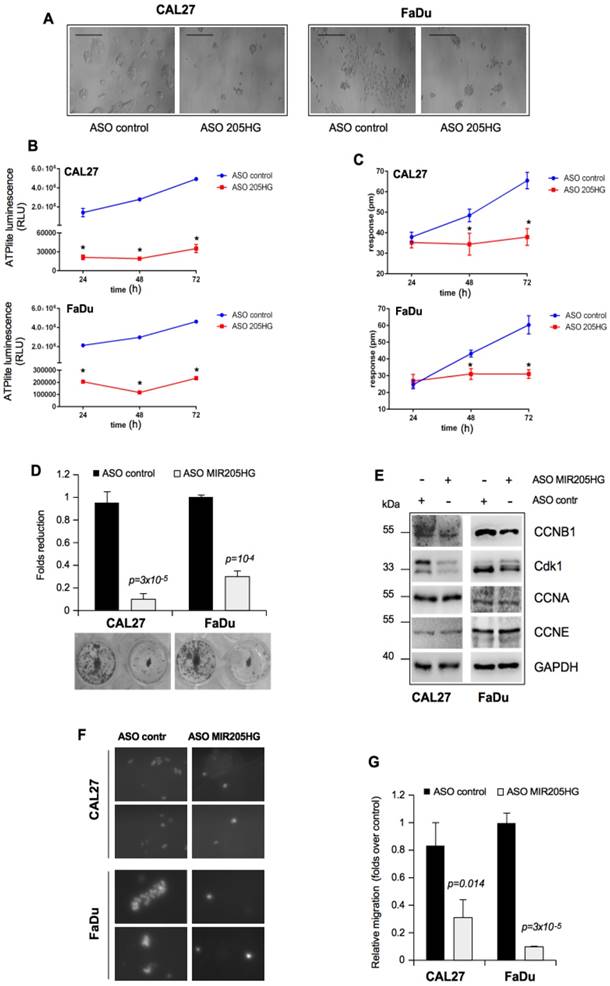
LncMIR205HG is involved in colony formation and migration of HNSCC cells. (A) Effect of MIR205HG depletion on cell morphology. CAL27 and FaDu cells were transfected with ASO-MIR205HG and ASO-control and cell morphology was observed and photographed by phase contrast microscopy (Scale bars, 100 υm). (B) Label-free assay in CAL27 and FaDu cells transiently transfected with ASO-MIR205HG or ASO-control at the indicate time points. ATP amount was expressed as relative light units (RLU). Values are mean ± SD obtained from 2 separate experiments in quintuplicate. p-values were calculated with two-tailed t-test. Significant p-values are indicated as *p-value < 0.01 versus the control sample. (C) DMR label-free assay in cells treated as in (B). The change in impedance (pm) of CAL27 and FaDu cells is represented by the graph. Values are mean ± SD obtained from 2 separate experiments in quintuplicate. p-values were calculated with two-tailed t-test. Significant p-values are indicated as *p-value < 0.01 versus the control sample. (D) Colony formation assay was performed in CAL27 and FaDu cells transfected with ASO-control and ASO-MIR205HG. The data was obtained by analysing the colonies with ImageJ software. (E) Western blot analysis performed in CAL27 and FaDu cells for CCNB1, Cdk1, CCNA, CCNE and GAPDH (loading control) protein expression in lysates from ASO-control and ASO-MIR205HG. (F) Representative images from the transwell migration assay by Boyden chamber in CAL27 and FaDu cells. Magnification, 400x. (G) Data represent the mean ± SD from three biological replicates of the transwell migration assay, each point repeated in technical quadruplicates. p-values were calculated with two-tailed t-test.
To study the cellular localization of MIR205HG, we performed fractionation of nuclear and cytoplasmic RNAs and proteins from CAL27 and FaDu cells (Figure 2C). The RT-qPCR analysis revealed that MIR205HG transcript was localized mainly in the nucleus with a minor fraction residing in the cytosol in both cell lines (Figure 2C). These results were further confirmed by mRNA detection using Stellaris FISH technology where a probe set of 27 multiple singly-labelled oligonucleotides hybridized along each MIR205HG molecule (Figure 2D and Table S4). The signal was only detectable when numerous probes were bound, thereby strongly reducing the number of false positives.
We next investigated the potential involvement of MIR205HG in pro-tumorigenic activities, considered to be a hallmark of mutp53 proteins, such as increased cell proliferation, colony formation ability, and cell motility [3, 7]. Toward this end, we depleted MIR205HG expression using ASOs and a scrambled sequence as the control in CAL27 and FaDu cells (Figure 2E and Figure S4A). The cytofluorimetric analysis performed after 48 h of ASO-MIR205HG and ASO-control transfection revealed G2-M phase cell accumulation (Figure 2F and Figure S4B). We employed the BrdU incorporation assay using the same experimental conditions to further investigate the significant increase of S phase in CAL27 cells (Figure 2F). The ASO-MIR205HG transfection caused a reduction of BrdU incorporation, thus leading to a lengthening of S phase (Figure 2G and Figure S4C). The reduced proliferation of MIR205HG-depleted cells compared to control cells was evaluated by MTT assay performed at the same time point (Figure S4D, E).
Finally, to confirm that MIR205HG had no coding potential and did not associate with the translational machinery, ribosome- and polysome-associated cell fractions were isolated. We evaluated the distribution of lncMIR205HG transcript and the CCNB1 mRNA as a control in fractions with different translational rates in mutant p53R175H-ponasteron-inducible H1299 clone 41 cells [6]. As expected, we observed the upregulation of both MIR205HG and CCNB1 expression in the total mRNA samples prepared from these cells after induction (Pon+) of mutp53R175H (Figure 2H). However, compared to the non-induced counterparts (Pon-), a reproducible increase of CCNB1 mRNA level in the polysomal, actively translating fractions was seen upon induction with mutant p53 (Pon+) (Figure 2I). On the other hand, the MIR205HG transcript was not associated with the polysomal fractions in both H1299 cells with or without induction, thus validating MIR205HG as a lncRNA (Figure 2J).
LncMIR205HG is involved in colony formation and migration of HNSCC cells
It is well established that the in vitro GOF activities of mutp53 are manifested in the increased colony-forming ability and cell motility [45]. In this context, we found that MIR205HG depletion caused significant morphological changes in both CAL27 and FaDu cell lines, which included tight clumping of cells with the cobblestone-like appearance of the epithelial cell phenotype (Figure 3A). To further address this morphological change, we first monitored the concentration of cellular ATP over 72 h as an indication of the metabolic activity. Both CAL27 and FaDu cells depleted of MIR205HG were metabolically much less active 24 h after the transfection than the control cells during that time (Figure 3B). In parallel, we monitored the dynamic mass redistribution (DMR) of these cells by measuring the wavelength shift. This label-free analysis showed that MIR205HG inhibition caused full repression of DMR in both cell lines (Figure 3C).
We also observed that depletion of MIR205HG severely impaired the formation of colonies of CAL27 and FaDu cells (Figure 3D). To further examine the impact of MIR205HG on cell growth, we evaluated the expression of cell cycle checkpoints regulatory proteins. Down-regulation of MIR205HG caused decreased expression of CCNB1 and Cdk1 proteins, components of the mitotic complex regulating G2/M transition (Figure 3E). Interestingly, we previously reported the important role of mutant p53 in CCNB1- and Cdk1-positive transcriptional regulation [5, 9]. As a control, we checked the expression of CCNA and CCNE, two cyclins involved in the regulation of G1/S phase, which were not modulated (Figure 3F).
The role of MIR205HG in cell motility was studied by performing an in vitro transwell invasion assay in CAL27 and FaDu cells. As shown in Figure 3G, H, depletion of MIR205HG expression decreased migration of both cell lines. Taken together, these findings show that lncMIR205HG probably mediates the oncogenic properties exerted by GOF mutp53 proteins.
TP53 mutations are associated with high expression of lncMIR205HG in HNSCC patients
Based on the above results, we hypothesized that expression of MIR205HG in HNSCC might be higher in tumoral than in non-tumoral tissues. To test this hypothesis, we compared its expression in tumoral and non-tumoral HNSCC tissue samples using our collection at the Regina Elena Cancer Institute and the Cancer Genome Atlas Data Portal (TCGA). In the first phase of our exploratory analysis, we hypothesized that TP53 status might affect the expression of MIR205HG. To test this hypothesis, we randomly selected 63 HNSCC from the 121 tissues samples collected at the Regina Elena National Cancer Institute of Rome described in our previous publication [11]. Out of the 63 tumor samples, 32 had TP53 missense mutations while 31 had wild-type TP53 (tumor and normal matched tissues for each patient) (Table S5). In the original study, we had observed that among the 121 patients those who carried TP53 mutations in the tumor exhibited a shorter recurrence-free survival (RFS) than those with wt-p53 protein [11].
In the present study, we confirmed by RT-qPCR analysis that MIR205HG was upregulated in tumor tissues compared with matched non-tumoral tissues (Figure 4A). Interestingly, there was a significant upregulation of MIR205HG in the mutp53-carrying tumors (Figure 4B) compared with the group of wt-p53 samples (Figure 4C).
TP53 mutations are associated with high expression of lncMIR205HG in HNSCC patients. (A) Box-plot analysis representing the association of MIR205HG expression levels with the tumoral and normal tissues from the HNSCC cohort of Regina Elena National Cancer Institute of Rome (I.R.E.). The expression of MIR205HG was measured by RT-qPCR in cDNA obtained from each normal and tumoral matched tissues and analyzed in association with the tumoral and normal tissues. The 63 matched samples are composed of tumors carrying missense mutations in TP53 (mutp53 n=32) and tumors with wild-type TP53 (WTp53 n=31). (B, C) RT-qPCR in cDNA obtained from each normal and tumoral matched tissues and analyzed in the sub-group of HNSCC patients carrying missense mutations in the TP53 gene (B) and in the sub-group of HNSCC patients with wild type TP53 gene (C). (D) Box-plot analysis representing the association of MIR205HG expression level with the tumoral and normal tissues from HNSCC by TCGA. 522 total patients: 478 tumoral and 44 normal samples. (E) Box-plot analysis representing the association of MIR205HG expression levels within the following sub-groups of 42 matched samples from TCGA: mutant p53, tumors carrying mutations in TP53 (n=31); wt p53, tumors with wild-type TP53 (n=11). (G) Schematic model representing the two ncRNA products (lncRNA and micro-RNA) derived from the positive regulation of mutant p53 protein on the MIR205HG locus gene.
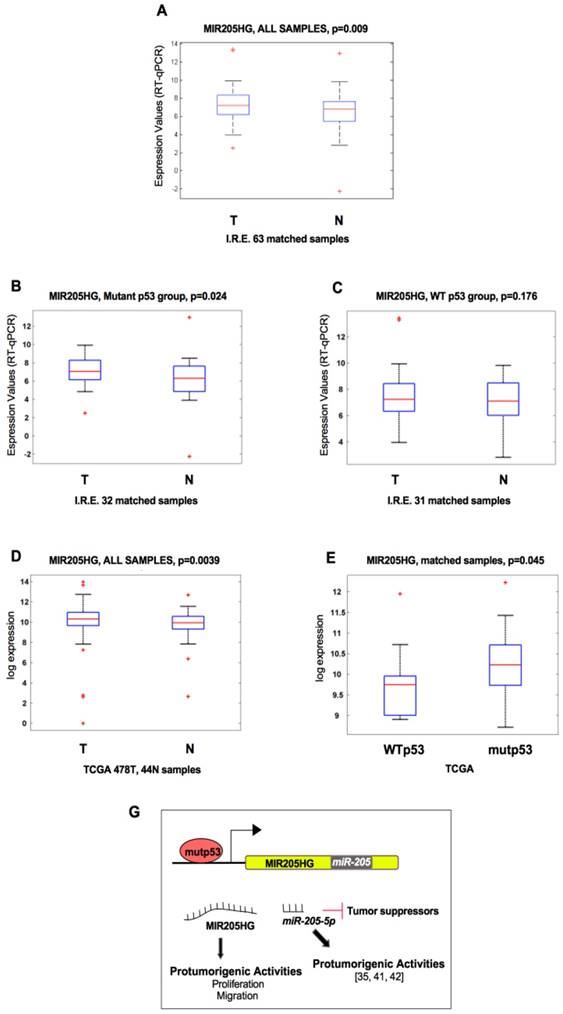
The preferential association of MIR205HG expression with the mutp53-carrying samples was further confirmed in the HNSCC TCGA (Figure 4D, E). Indeed, we found increased expression of MIR205HG in tumoral compared to non-tumoral tissues (Figure 4D). We also evidenced that the expression of MIR205HG was significantly higher in samples carrying TP53 mutations when compared with those with intact TP53 (Figure 4E). Furthermore, expression of lncMIR205HG and miR-205-5p, both derived from a unique pre-mRNA (Figure S2D), were highly correlated in the group of 478 HNSCC samples (correlation coefficient R=0.67; p-value=10-60). This significant correlation indicates that MIR205HG and miR-205-5p transcripts are highly co-expressed in the HNSCC tissues.
To further validate the analysis performed in TGCA subgroups, we considered PDGFRB as a gene transcriptionally regulated by mutant p53 [46] and MDM2 as a bona-fide target of wild-type p53. As expected, the analysis performed on the HNSCC TCGA database highlighted that PDGFR expression was significantly associated with mutant p53 samples (p=6.7×10⁻¹⁰) and MDM2 expression was significantly associated with wild-type p53 samples (p=2.1×10⁻¹³) (Figure S4F, G). Taken together, these findings provide clinical relevance to the in vitro data and suggest that lncMIR205HG, together with miR-205-5p, could be relevant effectors in the pro-oncogenic GOF of the mutp53 protein (Figure 4G).
LncMIR205HG acts as a natural decoy for miR-590-3p, leading to elevated expression of Cyclin B and Cdk1 proteins
Emerging evidence highlights that lncRNAs elicit post-transcriptional actions by competing or cooperating with RNA-binding proteins, microRNAs, and likely other lncRNAs [12, 13]. We explored diverse putative biological functions of lncMIR205HG, including the possibility that MIR205HG could act as the “competing endogenous” RNA using specific miRNA target sites to post-transcriptionally modulate gene expression, as was previously described [47, 48].
Bioinformatics analysis of miRNA recognition sequences on MIR205HG revealed the presence of a putative sequence for miR-590-3p binding (Figure 5A and Figure S5A). Initially, we used Northern blotting to confirm the presence of a mature miR-590-3p in the small RNAs-purified fraction of CAL27 cells (Figure S5B). We employed mimic 590-3p and mimic 205-5p as positive and negative controls, respectively (Figure S5B). Furthermore, we analysed data from a micro-RNA sequencing (NGS technology) performed in CAL27 cells present in our laboratory. The analysis provided a further proof of mir-590-5p expression in CAL27 cells (RPM>5, Figure S5C).
LncMIR205HG acts as a natural decoy for miR-590-3p, leading to elevated expression of Cyclin B and Cdk1 proteins. (A) Schematic representation of MIR205HG and miR-590-3p nucleotides involved in the RNA-RNA interaction. This model was created using Inta RNA-RNA interaction software (43). (B) Representation of pairing between miR-590-3p and the 3'UTR of its validated mRNA targets, ccnb1 and cdk1 mRNAs [47, 48]. (C) Hypothetical model where lncMIR205HG binds and sequesters miR-590-3p, allowing the production of CCNB1 and Cdk1 proteins, both involved in the increase of cell proliferation. (D) Left side: miR-590-3p expression was analyzed by Taq-Man assay with a specific probe on RNA derived from CAL27 cells transfected with mimic control and mimic miR-590-3p oligos. The expression was normalized versus RNU48. Bars represent mean ± SD from three biological replicates. P-values were calculated with two-tailed t-test. Right side: a representative immunoblotting analysis of CCNB1, Cdk1, p21 and GAPDH (loading control) in CAL27 cells transfected with either mimic control or mimic miR-590-3p oligos. (E) MIR205HG, ccnb1 and cdk1 expression was analyzed by RT-qPCR in CAL27 cells transfected with either mimic control or mimic miR-590-3p oligos. (F) ChIRP-Taqman Assay analysis of miR-590-3p reveals the co-precipitation with lncMIR205HG transcript in CAL27 cells. Values represent the mean fold enrichment of miR-590-3p after precipitation with specific biotinylated oligos for MIR205HG and LacZ transcripts (LacZ as control). Bars represent mean ± SD from three biological replicates. P-values were calculated with two-tailed t-test. (G, H) MIR205HG, ccnb1 and cdk1 expression was analyzed by RT-qPCR in CAL27 (G) and FaDu (H) cells transfected with either ASO-control or ASO-MIR205HG oligos. Bars represent mean ± SD from three biological replicates. p-values were calculated with two-tailed t-test. Significant p-values are indicated as *P-value <0.05 and **P-value <0.01
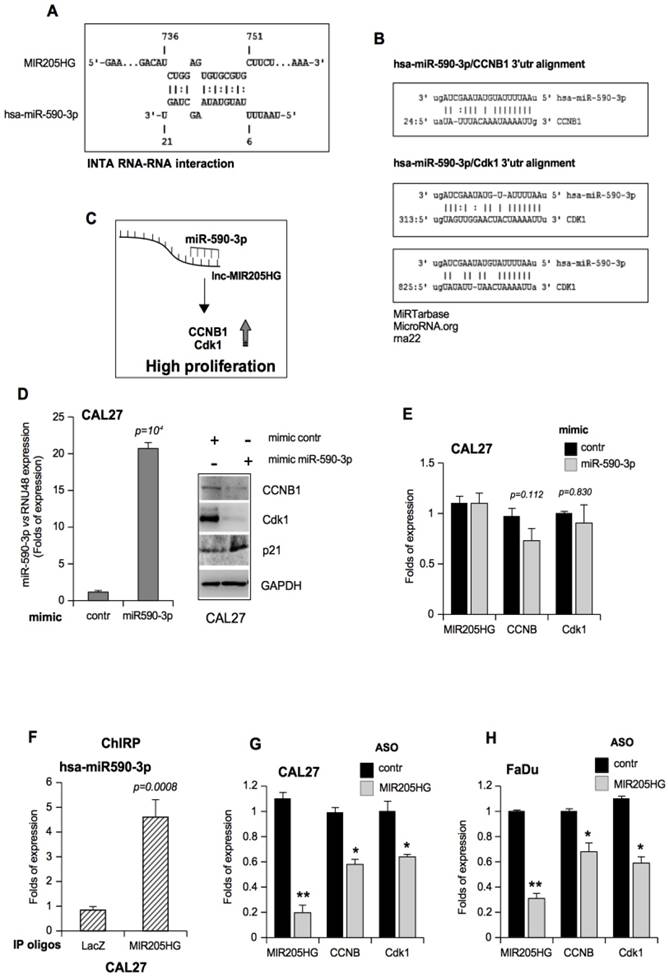
Among the transcripts related to miR-590-3p, ccnb1 and cdk1 mRNAs were of interest for our study [47, 48]. The location of ccnb1 and cdk1 mRNAs, containing target recognition sequences for miR-590-3p, are shown in Figure 5B. We tested the hypothesis that MIR205HG, by depleting miR-590-3p, sustains elevated endogenous levels of ccnb1 and cdk1 mRNAs (Figure 5C). To this end, using mimic oligonucleotides, we first overexpressed miR-590-3p in CAL27 and FaDu cells to bypass the decoy effect of MIR205HG on endogenous miR-590-3p (Figure 5D and Figure S5D). Overexpression of miR-590-3p mimic resulted in a marked decrease of CCNB1 and Cdk1 protein expression with the concomitant up-regulation of p21 protein (Figure 5D and Figure S5D). We verified that miR-590-3p mimic transfection did not affect lncMIR205HG, ccnb1 or cdk1 transcript levels, indicating that it acts through a canonical RNA-induced silencing complex (RISC) pathway, where there is a direct interaction between the miRNA and its ccnb1 and cdk1 mRNA targets (Figure 5E and Figure S5E).
We next explored whether miR-590-3p was effectively bound by MIR205HG. To test this, we recovered all MIR205HG-associated RNAs through ChIRP assay (chromatin isolation by RNA purification) by using a pool of biotinylated antisense-oligos for theMIR205HG mRNA sequence in CAL27 cells. Antisense oligos for LacZ mRNA sequence were used as a control. As displayed in Figure 5F, miR-590-3p was significantly enriched in the MIR205HG RNA-precipitated samples compared to the LacZ control. The specificity of MIR205HG precipitation by biotinylated tiling antisense-oligos is shown in Figure S5F.
Down-regulation of MIR205HG by ASO transfection was expected to increase in free miR-590-3p. Surprisingly, it caused not only a decrease of CCNB1 and Cdk1 protein expression but also of ccnb1 and cdk1 transcription (Figure 5G, H), which was contrary to the observation following transfection with mimic miR-590-3p (Figure 5E and Figure S3C). This suggests the existence of additional regulatory mechanisms to regulate the expression of CCNB1 and Cdk1 through yet unexplored networks of biological activities of lncMIR205HG.
To address the inverse correlation between miR-590-3p and ccnb/cdk1 in tumors, we first evaluated the miR-590-3p expression in the TCGA dataset of HNSCC (Figure S6). Interestingly, miR-590-3p expression was not deregulated in 42 tumors vs. matched normal samples (Figure S6A) nor in the entire tumor series (478 tumors) vs. 44 un-matched normal tissues (Figure S6B). This observation supports our hypothesis that in HNSCC cells the regulation of miR-590-3p activity is mainly modulated by the MIR205HG decoy effect rather than by modulation of its levels. Accordingly, there was a significant association between high levels of MIR205HG and ccnb1 and cdk1 mRNAs when analyzed in 42 matched tumoral and non-tumoral samples (Figure S6C, D) and in 478 tumoral and 44 un-matched normal tissues (Figure S6E, F). Of note, lncMIR205HG, ccnb1 and cdk1 were also positively correlated in the tumor samples series as assessed by computing the Pearson correlation coefficient (R) (Table 1). These data strongly implied that the MIR205HG/miR-590-3p ncRNA complex could be a relevant executor of the pro-oncogenic functions of mutant p53.
Results of Pearson correlation analysis relative to MIR205HG, CCNB1 and Cdk1 in 522 HNSCC samples from TCGA (478T).
| N° | R Pearson | p-value |
|---|---|---|
| CCNB1/Cdk1 | 0.81 | 1.130×10-121 |
| MIR205HG/CCNB1 | 0.17 | 1.1×10⁻⁴ |
| MIR205HG/Cdk1 | 0.15 | 8.25×10⁻⁴ |
LncMIR205HG depletes miR-590-3p and induces high levels of YAP protein
Recently, we identified the transcriptional co-factor YAP1 (Yes-associated protein) as a partner of GOF mutp53 proteins in diverse types of tumors [9]. Amplified or hyperactivated YAP1 functions as an oncogene in numerous human solid tumors. It is the main effector of the HIPPO tumor suppressor pathway [49, 50]. We showed that YAP1 is an important cofactor for the aberrant transcriptional activity of the mutant p53/NF-Y oncogenic complex to modulate the expression of ccna, ccnb, and cdk1 genes in cancer cells [9]. miR-590-3p did not affect the MIR205HG expression nor ccnb1 and cdk1 transcript levels, indicating that it acts through a canonical RISC pathway (Figure 5E). We reasoned that another parallel MIR205HG-driven mechanism might affect CCNB1 and Cdk1 expressions based upon the results obtained after MIR205HG depletion (Figure 5G, H). Therefore, we tested the hypothesis that MIR205HG could modulate the expression of YAP and consequently that of ccnb and cdk1 genes. Indeed, we found that the ASO-MIR205HG transfection caused a strong down-regulation of YAP protein expression but not that of other transcription factors that we evaluated to check the specificity (Figure 6A and Figure S7A). The reduction in YAP's transcriptional ability in MIR205HG-depleted cells was further confirmed by the relative decrease of the mRNAs of ctgf and ankrd1, well-defined transcriptional targets of YAP (Figure 6B). This led us to explore whether YAP mRNA could be targeted by miR-590-3p and whether MIR205HG sponge activity for miR-590-3p could counteract such effect and contribute to maintaining high levels of YAP protein.
LncMIR205HG sponges miR-590-3p and unleashes high levels of YAP protein. (A) Immunoblotting to detect YAP and GAPDH (loading control) proteins in whole protein extracts from CAL27 cells transfected with ASO-control and ASO-MIR205HG. Representative images are shown. (B) ctgf and ankrd1 expression was analyzed by RT-qPCR in CAL27 treated as in (A). (C) Immunoblotting to detect YAP and GAPDH (loading control) proteins in whole protein extracts from CAL27 cells transfected with mimic control and mimic miR-590-3p. Representative images are shown. (D) ctgf, ankrd1 and yap1 expression was analyzed by RT-qPCR in CAL27 treated as in (C). In all RT-qPCRs, bars represent mean ± SD from three biological replicates. p-values were calculated with two-tailed t-test. Significant p-values are indicated as *p-value < 0.05. (E) Scheme of pairing between the sequences of miR-590-3p and the 3'UTR of YAP1 transcript calculated by the rna22 bioinformatic tool (46). (F) Luciferase activity for YAP-3'UTR-pGL3 plasmid was determined after 24 h of transfection in H1299 cells. The results are representative of three independent experiments. Bars represent mean ± SD from three biological replicates. p-values were calculated with two-tailed t-test. Significant p-values are indicated. (G) CAL27 cells treated as indicated were transiently transfected with pCCAAT-B2LUC (100 ng) or pmutCCAAT-B2LUC (100 ng) luciferase reporter vectors. (H) Immunoblotting from whole protein extracts of A254 cells transfected as indicated to detect CCNB1, Cdk1, YAP, p53 and GAPDH (as loading control). Representative images are shown. (I) Western blot analysis for YAP, CCNB, Cdk1 and GAPDH (loading control) protein expression in lysates from control (si-GFP) and p53-depleted (si-p53) CAL27 cell lines. In the lines 1 and 2, the expression vectors were co-transfected with mimic control. Representative images are shown. (G) Viability of the CAL27 cell line transfected as described in (J) and reported in the legend to the graph was determined by ATPlite luminescence analysis. ATP amount was expressed as relative light units (RLU). All the values are mean ± SD of six replicates from three independent experiments. (K) Schematic representation summarizing cell cycle gene regulation by mutp53 throughout the transcription of lncMIR205HG and miR-205-5p.
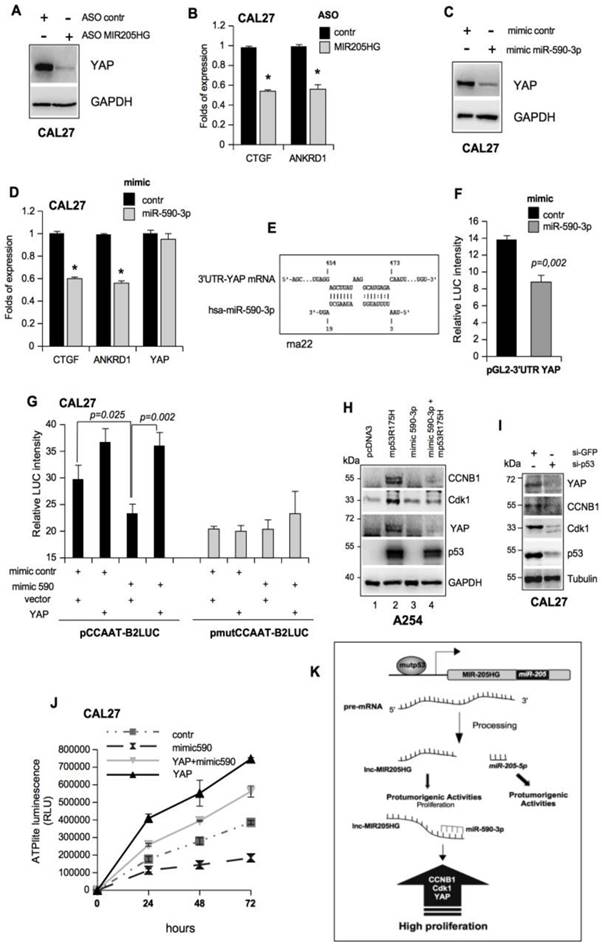
To test this hypothesis, we transfected mimic miR-590-3p in CAL27 cells and observed the downregulation of YAP protein and the relative decrease of ctgf and ankrd1 mRNAs (Figure 6C, D). We obtained similar results in the FaDu cell line (Figure S7B, C). Furthermore, a seed-targeting sequence for miR-590-3p was detected in the 3'UTR of YAP mRNA, suggesting a direct regulation of YAP expression by miR-590-3p (Figure 6E). This prompted us to clone a 285 bp of YAP-3'UTR encompassing the binding site for miR-590-3p downstream from the luciferase sequence. This vector was co-transfected with mimic miR-590-3p or a mimic control in the H1299 cell line. Luciferase assay showed that the YAP 3'UTR was specifically targeted by mimic-590-3p (Figure 6F). Since we have previously shown that human mutp53 physically interacts with YAP and NF-Y on the CCAAT boxes of the promoters of cell cycle-regulatory genes [9], we evaluated the impact of miR-590-3p on mutp53/YAP/NF-Y transactivation. To this end, we performed luciferase assays using a reporter vector (pCCAAT-B2LUC), which contained three CCAAT boxes from the murine cyclin B2 promoter [5, 9]. As a confirmation of the ability of miR-590-3p to downregulate YAP, we found that overexpression of mimic miR-590-3p significantly reduced cyclin B2 promoter activity (Figure 6G, black columns and Figure S7D, E). By transfecting a vector with three mutated CCAAT-boxes (pmutCCAAT-B2LUC), which could not be bound by NF-Y, we observed no significant modulations (Figure 6G, grey columns and Figure S7D, E). Notably, the concomitant overexpression of YAP and miR-590-3p was able to overcome miR-590-3p-dependent down-regulation of the CCNB2 promoter (Figure 6G). These results highlighted that miR-590-3p had a strong impact on the YAP/mutantp53 complex that was required to support NF-Y-aberrant transactivation activity in tumor cells.
Previously, we showed that mutp53 overexpression was able to induce CCNB2 and Cdk1 mRNA and protein expression [5, 9]. To further dissect the mutp53/MIR205HG/miR-590-3p pathway, we expressed mutp53R175H protein in an A254 p53 null cell line. As expected, we observed an increase in CCNB1, Cdk1, and YAP mRNA and protein expressions compared with the control (Figure 6H, lines 1 and 2 and Figure S7F). Under these conditions, concomitant mimic miR-590-3p expression almost completely prevented the mutant p53-induced increase in CCNB1, Cdk1, and YAP protein levels (Figure 6H and Figure S7G). These results implied that, downstream of mutant p53, the MIR205HG sponge activity was required to eliminate miR-590-3p in tumor cells. The knock-down of mutp53 protein in different cell lines elicited the downregulation of CCNA, CCNB1, Cdk1, and Cdc25C, as the mutp53/NF-Y/YAP oncogenic complex modulated their mRNA transcription (Figure S7H) [5, 9]. Also, we observed the down-regulation of CCNB1, Cdk1, and YAP, both at protein and mRNA levels (Figure 6I and Figure S7I-K) in HNSCC cell lines when mutp53 was knocked down. Thus, mutp53 could regulate the cancer cell proliferation rate by at least two pathways: by the direct induction of cell-cycle-related genes, such as CCNB1 and Cdk1, and by inducing the MIR205HG lncRNA, which sponges miR-590-3p that targets CCNB1, Cdk1, and YAP (Figure S7H). In turn, YAP participates in the mutp53/NF-Y oncogenic complex to sustain the cell-cycle-related gene expression, forming a regulatory loop [5, 9] (Figure S7H).
We have previously described that the YAP/mutant p53 complex strongly enhances cancer cell proliferation [9]. In this study, we confirmed that ectopic expression of YAP increases cell proliferation in CAL27 cells (Figure 6J). Strikingly, the transfection of mimic 590-3p significantly impaired the proliferation rate of CAL27 cells. The concomitant overexpression of YAP and miR-590-3p rescued miR-590-3p-dependent inhibition of cell growth of CAL27 cells, demonstrating that miR-590-3p impacts the functional axis driven by YAP/mutant p53 to sustain proliferation of HNSCC cells (Figure 6J, K and Figure S7L).
Discussion
About 70% of the human genome is transcribed, but less than 2% of the genome encodes proteins. Noncoding RNAs (ncRNAs) can be classified as small (≤200 base pairs) or long ncRNAs (lncRNA, >200 base pairs). The human genome encodes around ten thousand lncRNA genes [51] and, like protein-coding genes, some lncRNAs can mediate oncogenesis or tumor suppression and are, therefore, a potential new class of cancer therapeutic targets [52]. Despite this relevance to cancer, only a small number of lncRNAs have been functionally characterized.
Here, we provide insights into the oncogenic crosstalk between mutp53 proteins and ncRNAs. Missense mutations in the TP53 tumour suppressor gene are known to be associated with tumour progression, metastasis, and poor survival. In vivo studies have provided evidence that an oncogenic cellular context can activate GOF mutp53 protein [53]. In this study, we have shown that mutp53 is involved in the aberrant transcriptional up-regulation of miR-205-5p and MIR205HG lncRNA, contributing to cancer proliferation in HNSCC. Previous studies revealed that miR-205 might have contradictory roles in malignancy [35]. Experimental research work revealed the tumor-suppressive function of miR-205 in prostate cancer, where miR-205 sustains epithelial cell phenotype by repressing genes involved mostly in the acquisition of invasive behaviour and increasing cell-to-cell adhesion [33]. On the other hand, miR-205-5p is a well-characterized oncomir in ovarian cancer and HNSCC [36, 54]. We previously reported that miR-205-5p belongs to a signature of 12 miRNAs that predicts the risk of recurrence in HNSCCs [11]. However, the function that miR-205 exerts in different cancer tissues depends on the cellular context and is specific to the tumour subtype, as well as its cellular origin and stage of tumor progression. Our in vitro studies have shown that the regulation of the entire MIR205HG locus encompassing miR-205-5p is driven by mutp53 protein, which aberrantly induces miR-205-5p expression (Figure 1).
MIR205HG is a 4173bp long (Gene ID: 642587) intergenic non-protein coding RNA (lncRNA). Pre-miR-205 resides at the boundary of the third intron and the fourth exon of the MIR205-host gene (Figure 1A, D). So far, very little, if any, evidence is available for any biological or molecular functions of lncMIR205HG in physiological or disease processes in humans. However, it is becoming clear that lncRNAs can have numerous molecular functions, including modulating transcriptional patterns, regulating protein activities, serving structural or organizational roles, altering RNA processing events, and serving as precursors to small RNAs [55]. Diverse studies have implicated many dysregulated lncRNAs in various human diseases including cancers, although it is not clear whether these lncRNAs are causal or symptomatic of the disease state [14, 52]. Several questions are being actively investigated such as the number of lncRNAs that are transcribed in mammals, the biological functions of lncRNAs and how lncRNAs exert their effects.
Here we report the characterization of the MIR205HG gene promoter and the regulation of lncMIR205HG expression in HNSSC bearing mutations in the TP53 gene. We showed that mutp53 is recruited on specific DNA sequences of the MIR205HG promoter region (CCAAT and E2F1 binding sequences) thereby augmenting the expression of mRNA (Figure 1). We demonstrated high expression of MIR205HG in tumor samples from TCGA and also in a cohort of HNSCC patients previously analyzed by our group (Figure 4A, D) [11]. Furthermore, we established the close correlation between high expression of MIR205HG in HNSCC tumors carrying mutations in the TP53 gene compared to those with wild-type TP53 (Figure 4B, C, E). Consistent with this, expression of MIR205HG was associated with pro-tumorigenic functional activities such as increased cell proliferation, cell motility, and ability to form colonies (Figure 2 and Figure 3). Collectively, these results suggest a model whereby mutp53 protein promotes the transcription of MIR205 pre-mRNA by regulating the promoter region upstream of the first exon, then, the splicing process produces the mature lncMIR205HG and hsa-miR-205-5p (Figure 4G).
Our study also focused on dissecting the molecular mechanisms by which lncMIR205HG increased proliferation in HNSCC cancer cells. Sequestration of ncRNA and/or proteins is a documented mechanism by which lncRNAs exert their regulatory function [56]. An in silico analysis, aimed at examining the functional RNA domains of MIR205HG, highlighted a region involved in binding to miR-590-3p (Figure S5A). Interestingly, Cyclin B and Cdk1, which are key regulators of cell cycle progression and are upregulated by mutant p53/NF-Y/YAP oncogenic complex, have also been reported as targets of miR-590-3p [5, 9, 47, 48]. We showed that high expression of MIR205HG driven by GOF mutp53 proteins depleted miR-590-3p and induced Cyclin B and Cdk1 expression, thereby leading to increased cell proliferation (Figure 5 and Figure 6). Consistent with these findings, high expression of MIR205HG is associated with elevated levels of ccnb and cdk1 in HNSCCs carrying mutated TP53. Furthermore, we have demonstrated here that YAP, which appears to be crucial for mutp53 GOF, is a direct target of miR-590-3p. Hence, sequestering of miR-590-3p by MIR205HG allows concomitant transcription of ccnb and cdk1 genes by YAP/mutant p53 complex followed by translation of the functional Cyclin B and Cdk1 proteins, leading to increased proliferation of head and neck cancer cells (Figure 6I).
Taken together, our study attempted to decipher the molecular network including lncRNAs, miRNAs, and mRNAs whose dysregulation may have a significant impact on tumors carrying TP53 mutations. Our results also have therapeutic implications by identifying potential new therapeutic targets for designing more effective drugs.
Materials and Methods
Cells
Head and neck cancer CAL27 (mutp53H193L), FaDu (mutp53R248L), A254 (p53 null) and lung cancer H1299 (p53 null) cell lines were cultured in RPMI medium (Invitrogen, Carlsbad, CA, USA). H1299 clone 41 cells were cultured and induced as previously reported [6]. Media were supplemented with 10% (v/v) FBS (Invitrogen, Carlsbad, CA, USA). All cell lines were purchased from ATCC and were authenticated by STR genotyping with Promega PowerPlex® 1.2 system and the Applied Biosystems Genotyper 2.0 software for analysis of the amplicons. Cells were maintained in culture for no more than six passages. All cell lines have been tested by PCR/IF for Mycoplasma presence.
Plasmids and RNA transfection
Mutant p53 and YAP exogenous expression were performed using pcDNA3-p53-R175H, pcDNA3-p53-R273H, and pcDNA3-YAP vectors, and empty pcDNA3 was used as the control [9]. Cells were transfected with Lipofectamine 2000 following the manufacturer's instructions (Invitrogen, Carlsbad, CA, USA).
The following sequences were employed for si-RNA oligonucleotides transfection: si-p53#1 and si-p53#2 oligos were previously described [5, 9]; si-GFP employed as non-silencing control was 5'-GGCTACGTCCAGGAGCGCACC-3' [5, 9]; si-NF-YB was a smart pool of three target-specific oligos (sc-29945 Santa Cruz Biotechnology) [9]; si-E2F1#1 and si-E2F1#2 oligos were previously described [6].
To knock-down hsa-miR-205-5p and hsa-miR-590-3p expression, we used miRCURY LNATM miRNA Inhibitor purchased from Exiqon. These miRCURY LNATM miRNA inhibitors contained phosphorothioate bonds. The sequences were: "LNA-miR-205-5p":5'-AGACTCCGGTGGAATGAAGG-3' (n°410131-00); "LNA-miR-590-3p":5'- ACTAGCTTATACATAAAATTA” (n° 4105239-001); "LNA-miR-control": 5'-GTGTAACACGTCTATACGCCCA-3' (n° 199004-00).
To overexpress hsa-miR-590-3p, we used CONmiR mimic purchased from Riboxx GmbH: mimic miR-590-3p n° M-00306-0005; mimic negative n° K-01001-0005.
To down-regulate lncMIR205HG expression, we used Exiqon LNA™ GapmeR antisense technology. The LNA™-containing flanking regions confer nuclease resistance to the antisense oligo while at the same time increase target binding affinity regardless of the GC content. The central DNA “gap” activates RNase H cleavage of the target RNA upon binding. Antisense oligonucleotide (ASO) was 16 nucleotides long containing LNA™ in the flanking regions and DNA in a LNA™ free central gap. We used the Exiqon online design tool to produce the following antisense oligo at the junction of two exons: ASO-MIR205HG, 5'-GTGTCCTATATAAAGC-3'; ASO-negative control A supplied by Exiqon n°300610.
RNAs were transfected with RNAiMax reagent following the manufacturer's instructions (Invitrogen, Carlsbad, CA, USA).
RNA isolation, quantitative real-time PCR analysis
Total RNA was extracted from cells using TRI Reagent (Invitrogen, ThermoFisher Scientific USA) according to the manufacturer's instructions. 5 μg of total RNA was reverse-transcribed at 37°C for 60 min in the presence of random hexamers and Moloney murine leukemia virus reverse transcriptase (Invitrogen, ThermoFisher Scientific USA). The small RNA fraction was isolated from cultured cells using NucleoSpin miRNA (MACHEREY-NAGEL GmbH & Co.) according to the manufacturer's instructions.
To analyze the expression of miRs, 30 ng RNA was retro-transcribed using TaqMan microRNA Reverse Transcription Kit (Applied Biosystems) and real-time PCR of miR expression was carried out in a final volume of 10 μl using TaqMan MicroRNA® Assays (Applied Biosystems) and normalized using RNU48, RNU49 and RNU19 as endogenous controls. TaqMan probes for miRNAs and RNU were purchased from Applied Biosystems.
PCR analyses were carried out using specific oligonucleotides for genes listed in Table S1. To analyze MIR205HG transcript (Figure S1E), we used both MIR205HG_1 and MIR205HG_2 pairs of primers in RT-qPCRs; in the figures of the manuscript only the experiments with the MIR205HG_1 Forward and Reverse primers are reported. The mRNA expression was measured by real-time PCR using the SYBR Green assay (Applied Biosystems, Carlsbad, CA, USA) on a StepOne instrument and 7500 Fast Real-Time PCR System (Applied Biosystems). All primer sets worked under identical quantitative PCR cycling conditions with similar efficiencies to obtain simultaneous amplification in the same run. The 2-ΔΔCT method for relative quantitation of gene expression was used to determine mRNA expression levels. GAPDH and beta-actin gene expression were used as endogenous controls to standardize mRNA expression. All reactions were performed in triplicate. p-values were calculated with two-tailed Student's t-test. Statistically significant results are indicated by a p-value < 0.05.
Northern blotting
To detect mature miR-590-3p, the small RNA fraction was separated on a denaturing 12% polyacrylamide gel containing 8 M urea, transferred to Nytran N membrane (Amersham Hybond -N+) and fixed by ultraviolet cross-linking. Membranes were probed with the LNA-biotinylated miR-590-3p oligonucleotide, complementary to the mature microRNA, the sequence of which was 5'- 5Biosg-ACTAGCTTATACATAA-3' (IDT, Belgium).
To study lncMIR205HG transcript, total RNA was separated by electrophoresis in 1% agarose gel containing 2% formaldehyde, followed by blotting to a positively charged nylon membrane (Amersham Hybond -N+). The blotted RNAs were fixed to the membrane by UV irradiation. The membrane was incubated with antisense biotinylated RNA probes whose sequences are listed in Table S3. Prehybridization and hybridization of the filters were carried out in PerfectHyb Plus Hybridization Buffer (Sigma, Life Science) according to the manufacturer's instructions at 40°C. After hybridization, the membranes were washed at low stringency in 2×SSC, 0.1% SDS at room temperature twice for 5 min and at high stringency in 0.5 SSC, 0.1% SDS at 40°C twice for 5 min. The biotin-labelled probes were detected using streptavidin-HRP conjugate antibody (Sigma, Life Science). The immunodetection was performed with the aid of the enhanced chemiluminescence system (Thermo Fisher Scientific, Rockford, IL, USA). The acquisition of the chemiluminescence was performed by using Alliance 4.7 by UVITEC (Eppendorf).
Polysome analysis
We performed polysome purification as previously described [6]. For RT-qPCR, mRNA abundance was calculated with the delta CT method and normalized by total CCNB1 and MIR205HG mRNAs in all the fractions.
Chromatin isolation by RNA purification (ChIRP)
ChIRP was performed as described by Chu and colleagues [57]. Briefly, cells were cross-linked for 10 min with 1% glutaraldehyde at room temperature, and the reaction was quenched with 10% volume of 1.25 M glycine at room temperature for 5 min.
To prepare chromatin, cells were resuspended in Swelling Buffer (0.1 M Tris pH 7.0, 10 mM KOAc, 15 mM MgOAc) supplemented with 1% NP-40, 1 mM DTT, 1 mM PMSF, complete protease inhibitor, and 0.1 U/μL Superase-in (Ambion) for 10 min on ice. The cell suspension was then dounced and pelleted at 2500 × g for 5 min. Nuclei were further lysed in nuclear lysis buffer (50 mM Tris 7.0, 10 mM EDTA, 1% SDS, 1mM DTT, PMSF, P.I., and Superase-in) on ice for 10 min, and sonicated using Bioruptor (Diagenode) until most chromatin had solubilized and DNA was in the size range of 100-500 bp.
Chromatin was diluted in 2 times volume of hybridization buffer (500 mM NaCl, 1% SDS, 100 mM Tris 7.0, 10 mM EDTA, 15% formamide, with DTT, PMSF, P.I, and Superase-in freshly added). 100 pmol probes was added to 3 mL of diluted chromatin, which was mixed by end-to-end rotation at 37°C for 4 h. Streptavidin-magnetic C1 beads were blocked with 1 mg/mL BSA for 1 h at room temperature and washed three times with nuclear lysis buffer. Beads:biotin-probes:RNA:chromatin adducts were captured by magnets (Invitrogen) and washed five times with 40× beads volume of wash buffer (2× SSC, 0.5% SDS, with DTT and PMSF freshly added). After the last wash buffer was removed, beads were resuspended in 10× original volume of RNA pK buffer (100 mM NaCl, 10 mM Tris 7.0, 1 mM EDTA, 0.5% SDS) and 0.2 U/μL Proteinase K (Invitrogen). pK treatment was carried out at 65°C for 45 min, followed by boiling for 15 min, and trizol:chloroform extraction. Eluted RNA was subjected to quantitative reverse-transcription PCR (qRT-PCR) for the detection of enriched transcripts. 10 oligonucleotides against MIR205HG mRNA and 2 against LacZ as the control were designed using an online designer at www.singlemoleculefish.com. All probes were BiotinTEG-modified at the 3-prime end (Exiqon). ChIRP oligos are listed in Table S3.
Head and neck tumour tissue samples
The head and neck squamous cell carcinoma patients were previously described by Ganci and colleagues (Table S5) [11, 58]. Briefly, patients with primary HNSCC and no previous treatment with radiotherapy or chemotherapy who underwent resection in the Otolaryngology Head&Neck Surgery Department of Regina Elena National Cancer Institute in Rome were used in this study. The Scientific Ethic Committee of the Regina Elena National Cancer Institute approved the study protocol (CE/379/08). TP53 mutations in these samples were evaluated by sequencing of exons 2 through 11 of the TP53 gene. lncMIR205HG was analyzed by RT-qPCR in a group of 63 HNSCC tumor samples and their normal counterparts. Normal samples were collected from the surgery resection margin from each patient and were all histologically checked for the absence of tumor cells [11]. Normal samples were also subjected to TP53 sequencing and were negative for mutations.
Bioinformatic analyses
The mature miR sequences were taken from the miRBase database [59]. lncMIR205HG was displayed using the UCSC genome browser [60]. The likelihood of binding of a mature miR-590-3p to lncMIR205HG was evaluated using the MiRbase and MiRwalk packages [59, 61] and further validated using the Inta-RNA-interaction tool [62].
After evaluation of common binding sequences, the putative pairing sequence of miR-590-3p on MIR205HG was identified and is shown in Figure S5A. CCNB1 and Cdk1 were validated targets of miR-590-3p. Furthermore, we searched for their "seed sequence" on CCNB1 and Cdk1 mRNA using MiRTarbase, as shown in Figure 5A [63]. We confirmed this analysis also using MicroRNA.org [64] and rna22 packages [65].
ChIP-seq re-analysis
Aligned SAM files were kindly provided by the authors of [40]. We converted all of them back to FASTQ with Picard to use our custom analysis pipeline from scratch. Three replicates of p53 Ab in the H1299 cell line were merged for downstream analysis. ~22 million reads were aligned with Bowtie2 [66] and bigWig files were generated from MACS2 [67] bedgraph enrichment track.
RNA-Seq analysis
RNA-Seq data were analyzed via our cloud pipeline of choice, RAP [68], a Tuxedo-Suite-based workflow. RNA-seq bigWigs were generated from Tophat mapping data [69].
Statistical analysis
Data are presented as mean ± SD or SEM, derived from at least three independent experiments. ANOVA analysis was performed by R project tool. Student's t-test (two-tailed) was also conducted. A p-value < 0.05 was indicated as statistically significant.
Abbreviations
HNSCC: Head and neck squamous cell carcinoma; GOF: gain-of-function; lncRNA: long non coding RNA; ChIP: chromatin immunoprecipitation; ChIRP: chromatin isolation by RNA purification; CCNB: cyclin B; Cdk1: Cyclin-dependent kinase 1; YAP: Yes associated protein.
Supplementary Material
Supplementary figures and tables.
Acknowledgements
This work was supported by Italian Association for Cancer Research (AIRC) (Grant n. 16984) and Italian Ministry of Health (Grant n. GR-2011-02348813) to SDiA. This work was also supported by the Italian Association for Cancer Research (AIRC) (Grant n. 20613) to GB, from Epigenomics Flagship Project (EPIGEN; sub-project 7.6) to GB and by BR-Pharma. The authors thank Dr. Francesco Fazi for the assistance in FISH experiments. The authors thank TCGA group (TCGA Research Network: http://cancergenome.nih.gov/).
Author contributions
S. Di A., G.B. and F.V. conceived and designed experiments and analyzed the data. A.S. and M.P. performed statistical analysis, biostatistics and computational analysis. S. Di A., F.V. and F.G. performed experiments and analyzed the data. C.P. performed the label-free assays. S. Di A., G.B., S.S., G.F and P.M. wrote and reviewed the manuscript. S. Di A. and G.B. conceived the project and supervised the study.
Competing Interests
The authors have declared that no competing interest exists.
References
1. Ory K, Legros Y, Auguin C, Soussi T. Analysis of the most representative tumour-derived p53 mutants reveals that changes in protein conformation are not correlated with loss of transactivation or inhibition of cell proliferation. EMBO J. 1994;13:3496-3504
2. Kandoth C, McLellan MD, Vandin F. et al. Mutational landscape and significance across 12 major cancer types. Nature. 2013;502:333-339
3. Muller PA, Vousden KH. p53 mutations in cancer. Nat Cell Biol. 2013;15:2-8
4. Sampath J, Sun D, Kidd VJ. et al. Mutant p53 cooperates with ETS and selectively up-regulates human MDR1 not MRP1. J Biol Chem. 2001;276:39359-39367
5. Di Agostino S, Strano S, Emiliozzi V. et al. Gain of function of mutant p53: the mutant p53/NF-Y protein complex reveals an aberrant transcriptional mechanism of cell cycle regulation. Cancer Cell. 2006;10:191-202
6. Fontemaggi G, Dell'Orso S, Trisciuoglio D. et al. The execution of the transcriptional axis mutant p53, E2F1 and ID4 promotes tumor neo-angiogenesis. Nat Struct Mol Biol. 2009;16:1086-1093
7. Freed-Pastor WA, Mizuno H, Zhao X. et al. Mutant p53 disrupts mammary tissue architecture via the mevalonate pathway. Cell. 2012;148:244-258
8. Valenti F, Ganci F, Fontemaggi G. et al. Gain of function mutant p53 proteins cooperate with E2F4 to transcriptionally downregulate RAD17 and BRCA1 gene expression. Oncotarget. 2014;6:5547-5566
9. Di Agostino S, Sorrentino G, Ingallina E. et al. YAP enhances the pro-proliferative transcriptional activity of mutant p53 proteins. EMBO Rep. 2016;17:188-201
10. Molina-Vila MA, Bertran-Alamillo J, Gascó A. et al. Nondisruptive p53 mutations are associated with shorter survival in patients with advanced non-small cell lung cancer. Clin Cancer Res. 2014;20:4647-4659
11. Ganci F, Sacconi A, Bossel Ben-Moshe N. et al. Expression of TP53 mutation-associated microRNAs predicts clinical outcome in head and neck squamous cell carcinoma patients. Ann Oncol. 2013;24:3082-3088
12. Mercer TR, Dinger ME, Mattick JS. Long noncoding RNAs: insights into functions. Nat Rev Genet. 2009;10:155-159
13. Gutschner T, Diederichs S. The hallmarks of cancer: a long non-coding RNA point of view. RNA Biol. 2012;9:703-719
14. Esteller M. Non-coding RNAs in human disease. Nat Rev Cancer. 2011;12:861-874
15. Campos EI, Reiberg D. Histones: annotating chromatin. Annu Rev Genet. 2009;43:559-599
16. Filipowicz W, Bhattacharyya SN, Sonenberg N. Mechanisms of post-transcriptional regulation by micrornas: are the answers insight? Nat Rev Genet. 2008;9:102-114
17. Schmitt AM, Chang HY. Long Noncoding RNAs: At the Intersection of Cancer and Chromatin Biology. Cold Spring Harb Perspect Med. 2017;7:pii a026492
18. Vance KW, Ponting CP. Transcriptional regulatory functions of nuclear long noncoding RNAs. Trends Genet. 2014;30:348-355
19. Esquela-Kerscher A, Slack FJ. Oncomirs - microRNAs with a role in cancer. Nat Rev Cancer. 2006;6:259-269
20. Zhao Y, Srivastava D. A developmental view of microRNA function. Trends Biochem Sci. 2007;32:189-197
21. Frixa T, Donzelli S, Blandino G. Oncogenic MicroRNAs: Key Players in Malignant Transformation. Cancers (Basel). 2015;7:2466-2485
22. Slack FJ. Oncomirs - microRNAs with a role in cancer. Nat Rev Cancer. 2006;6:259-269
23. Di Leva G, Croce CM. miRNA profiling of cancer. Curr Opin Genet Dev. 2013;23:3-11
24. Muti P, Sacconi A, Hossain A. et al. Downregulation of microRNAs 145-3p and 145-5p is a long-term predictor of postmenopausal breast cancer risk: The ORDET prospective study. Cancer Epidemiol Biomarkers Prev. 2014;23:2471-2481
25. Hermeking H. p53 enters the microRNA world. Cancer Cell. 2007;12:414-8
26. Liao JM, Cao B, Zhou X, Lu H. New insights into p53 functions through its target microRNAs. J Mol Cell Biol. 2014;6:206-213
27. Donzelli S, Fontemaggi G, Fazi F. et al. MicroRNA-128-2 targets the transcriptional repressor E2F5 enhancing mutant p53 gain of function. Cell Death Diff. 2012;19:1038-1048
28. Masciarelli S, Fontemaggi G, Di Agostino S. et al. Gain-of-function mutant p53 downregulates miR-223 contributing to chemoresistance of cultured tumor cells. Oncogene. 2014;33:1601-1608
29. Stransky N, Egloff AM, Tward AD. et al. The mutational landscape of head and neck squamous cell carcinoma. Science. 2011;333:1157-1160
30. Cancer Genome Atlas Network. Comprehensive genomic characterization of head and neck squamous cell carcinomas. Nature. 2015;517:576-82
31. Poeta ML, Manola J, Goldwasser MA. et al. TP53 mutations and survival in squamous-cell carcinoma of the head and neck. N Engl J Med. 2007;357:2552-2561
32. Lindenbergh-van der Plas M, Brakenhoff RH, Kuik DJ. et al. Prognostic significance of truncating TP53 mutations in head and neck squamous cell carcinoma. Clin Cancer Res. 2011;17:3733-3741
33. Orang AV, Safaralizadeh R, Hosseinpour Feizi MA. Insights into the diverse roles of miR-205 in human cancers. Asian Pac J Cancer Prev. 2014;15:577-583
34. Vosgha H, Salajegheh A, Smith RA, Lam AK. The important roles of miR-205 in normal physiology, cancers and as a potential therapeutic target. Curr Cancer Drug Targets. 2014;14:621-637
35. Hezova R, Kovarikova A, Srovnal J. et al. MiR-205 functions as a tumor suppressor in adenocarcinoma and an oncogene in squamous cell carcinoma of esophagus. Tumour Biol. 2016;37:8007-8018
36. Iorio MV, Visone R, Di Leva G. et al. MicroRNA signatures in human ovarian cancer. Cancer Res. 2007;67:8699-8707
37. Zarogoulidis P, Petanidis S, Kioseoglou E. et al. MiR-205 and miR-218 expression is associated with carboplatin chemoresistance and regulation of apoptosis via Mcl-1 and Survivin in lung cancer cells. Cell Signal. 2015;27:1576-1588
38. Acin S, Li Z, Mejia O, Roop DR. et al. Gain-of-function mutant p53 but not p53 deletion promotes head and neck cancer progression in response to oncogenic K-ras. J Pathol. 2001;225:479-489
39. Piovan C, Palmieri D, Di Leva G. et al. Oncosuppressive role of p53-induced miR-205 in triple negative breast cancer. Mol Oncol. 2012;6:458-472
40. Vaughan CA, Deb SP, Deb S, Windle B. Preferred binding of gain-of-function mutant p53 to bidirectional promoters with coordinated binding of ETS1 and GABPA to multiple binding sites. Oncotarget. 2014;5:417-427
41. Pan F, Mao H, Bu F. et al. Sp1-mediated transcriptional activation of miR-205 promotes radioresistance in esophageal squamous cell carcinoma. Oncotarget. 2017;8:5735-5752
42. Lebanony D, Benjamin H, Gilad S. et al. Diagnostic assay based on hsa-miR-205 expression distinguishes squamous from nonsquamous non-small-cell lung carcinoma. J Clin Oncol. 2009;27:2030-2037
43. Sethi I, Romano RA, Gluck C. et al. A global analysis of the complex landscape of isoforms and regulatory networks of p63 in human cells and tissues. BMC Genomics. 2015;16:584
44. Zhou VW, Goren A, Bernstein BE. Charting histone modifications and the functional organization of mammalian genomes. Nat Rev Genet. 2011;12:7-18
45. Walerych D, Lisek K, Del Sal G. Mutant p53: One, No One, and One Hundred Thousand. Front Oncol. 2015;5:289. doi: 10.3389/fonc.2015.00289
46. Weissmueller S, Manchado E, Saborowski M. et al. Mutant p53 drives pancreatic cancer metastasis through cell-autonomous PDGF receptor β signaling. Cell. 2014;157:382-394
47. Hafner M, Landthaler M, Burger L. et al. Transcriptome-wide identification of RNA-binding protein and microRNA target sites by PAR-CLIP. Cell. 2010;141:129-141
48. Karginov FV, Hannon GJ. Remodeling of Ago2-mRNA interactions upon cellular stress reflects miRNA complementarity and correlates with altered translation rates. Genes Dev. 2013;27:1624-1632
49. Johnson R, Halder G. The two faces of Hippo: targeting the Hippo pathway for regenerative medicine and cancer treatment. Nat Rev Drug Discov. 2014;13:63-79
50. Yu FX, Zhao B, Guan KL. Hippo Pathway in Organ Size Control, Tissue Homeostasis, and Cancer. Cell. 2015;163:811-828
51. Derrien T, Johnson R, Bussotti G. et al. The GENCODE v7 catalog of human long noncoding RNAs: analysis of their gene structure, evolution, and expression. Genome Res. 2012;22:1775-1789
52. Prensner JR, Chinnaiyan AM. The emergence of lncRNAs in cancer biology. Cancer Discov. 2011;1:391-407
53. Wang Y, Suh YA, Fuller MY. et al. Restoring expression of wild-type p53 suppresses tumor growth but does not cause tumor regression in mice with a p53 missense mutation. J Clin Invest. 2011;121:893-904
54. Kimura S, Naganuma S, Susuki D. et al. Expression of microRNAs in squamous cell carcinoma of human head and neck and the esophagus: miR-205 and miR-21 are specific markers for HNSCC and ESCC. Oncol Rep. 2010;23:1625-1633
55. Wilusz JE, Sunwoo H, Spector DL. Long noncoding RNAs: functional surprises from the RNA world. Genes Dev. 2009;23:1494-1504
56. Cesana M, Cacchiarelli D, Legnini I. et al. A long noncoding RNA controls muscle differentiation by functioning as a competing endogenous RNA. Cell. 2011;147:358-69
57. Chu C, Qu K, Zhong FL. et al. Genomic maps of long noncoding RNA occupancy reveal principles of RNA-chromatin interactions. Mol Cell. 2011;44:667-78
58. Ganci F, Conti S, Fontemaggi G. et al. Allelic expression imbalance of TP53 mutated and polymorphic alleles in head and neck tumors. OMICS. 2011;15:375-381
59. Kozomara A, Griffiths-Jones S. miRBase: annotating high confidence microRNAs using deep sequencing data. Nucleic Acids Res. 2014;42(Database issue):D68-73
60. Speir ML, Zweig AS, Rosenbloom KR. et al. The UCSC Genome Browser database: 2016 update. Nucleic Acids Res. 2016;4:44 (D1) D717-25
61. Dweep H, Gretz N, Sticht C. miRWalk database for miRNA-target interactions. Methods Mol Biol. 2014;1182:289-305
62. Wright PR, Georg J, Mann M. et al. CopraRNA and IntaRNA: predicting small RNA targets, networks and interaction domains. Nucleic Acids Res. 2014;42:W119-W123
63. Chou CH, Chang NW, Shrestha S. et al. miRTarBase 2016: updates to the experimentally validated miRNA-target interactions database. Nucleic Acids Res. 2016:44 (Database Issue), D239-47
64. Betel D, Wilson M, Gabow A. et al. The microRNA.org resource: targets and expression. Nucleic Acids Res. 2008:36 (Database Issue), D149-53
65. Miranda KC, Huynh T, Tay Y. et al. A Pattern-based method for the identification of MicroRNA binding sites and their corresponding heteroduplexes. Cell. 2006;126:1203-1217
66. Langmead B, Salzberg SL. Fast gapped-read alignment with Bowtie 2. Nat Methods. 2012;9:357-359
67. Zhang Y, Liu T, Meyer CA. et al. Model-based analysis of ChIP-Seq (MACS). Genome Biol. 2008;9:R137
68. D'Antonio M, D'Onorio De Meo P, Pallocca M. et al. RAP: RNA-Seq Analysis Pipeline, a new cloud-based NGS web application. BMC Genomics. 2015; 16: S3Chu C, Qu K, Zhong FL, et al. Genomic maps of long noncoding RNA occupancy reveal principles of RNA-chromatin interactions. Mol Cell. 2011;44:667-78
69. Orjalo AV Jr, Johansson HE. Stellaris® RNA Fluorescence In Situ Hybridization for the Simultaneous Detection of Immature and Mature Long Noncoding RNAs in Adherent Cells. Methods Mol Biol. 2016;1402:119-34
70. Biagioni F, Bossel Ben-Moshe N, Fontemaggi G. et al. miR-10b*, a master inhibitor of the cell cycle, is down-regulated in human breast tumours. EMBO Mol Med. 2012;4:1214-1229
Author contact
![]() Corresponding authors: Dr. Giovanni Blandino, Oncogenomic and Epigenetic Unit, Department of Diagnostic Research and Technological Innovation, IRCCS Regina Elena National Cancer Institute, Rome 00144, Italy; Tel.: +39 0652665327; E-mail: giovanni.blandinogov.it; Dr. Silvia Di Agostino, Oncogenomic and Epigenetic Unit, Department of Diagnostic Research and Technological Innovation, IRCCS Regina Elena National Cancer Institute, Rome 00144, Italy; Tel.: +39 0652662878; E-mail: silvia.diagostinogov.it
Corresponding authors: Dr. Giovanni Blandino, Oncogenomic and Epigenetic Unit, Department of Diagnostic Research and Technological Innovation, IRCCS Regina Elena National Cancer Institute, Rome 00144, Italy; Tel.: +39 0652665327; E-mail: giovanni.blandinogov.it; Dr. Silvia Di Agostino, Oncogenomic and Epigenetic Unit, Department of Diagnostic Research and Technological Innovation, IRCCS Regina Elena National Cancer Institute, Rome 00144, Italy; Tel.: +39 0652662878; E-mail: silvia.diagostinogov.it