Impact Factor
- Issue 14; 2026
- Issue 13; 2026
- Issue 12; 2026
- Issue 11; 2026
- Issue 10; 2026
- Volume 16; 2026
- Advance Articles
- Past Issues
- Cover Images
- Cover Suggestion
- Index & Coverage
- Special Issues
Introduction
Materials and methods
Results
Discussion and Conclusion
Abbreviations
Acknowledgements
Supplementary Material
References
International Journal of Biological Sciences
International Journal of Medical Sciences
 Global reach, higher impact

Theranostics 2018; 8(6):1624-1635. doi:10.7150/thno.23531 This issue Cite
Research Paper
Gelatin Nanoparticle-Coated Silicon Beads for Density-Selective Capture and Release of Heterogeneous Circulating Tumor Cells with High Purity
Qinqin Huang1,2,6, Fu-Bing Wang3, Chun-Hui Yuan3, Zhaobo He2, Lang Rao2, Bo Cai2, Bolei Chen5, Susu Jiang1,6, Zhiqiang Li1, Jincao Chen1, Wei Liu2, Feng Guo4, Zheng Ao4 ![]() , Shi Chen1,6
, Shi Chen1,6 ![]() , Xing-Zhong Zhao2
, Xing-Zhong Zhao2 ![]()
1. Brain Center, Zhongnan Hospital, Wuhan University, Wuhan 430071, China.
2. Key Laboratory of Artificial Micro- and Nano-Structures of Ministry of Education, School of Physics and Technology, Wuhan University, Wuhan 430072, China.
3. Department of Laboratory Medicine, Zhongnan Hospital, Wuhan University, Wuhan 430071, China.
4. Department of Intelligent Systems Engineering, Indiana University, Bloomington, IN 47405, USA.
5. Institute for Interdisciplinary Research, Jianghan University, Wuhan 430056, China.
6. Key Laboratory of Combinatorial Biosynthesis and Drug Discovery of Ministry of Education, School of Pharmaceutical Sciences, Wuhan University, Wuhan 430071, China.
Received 2017-10-28; Accepted 2017-12-16; Published 2018-2-7
Abstract

Background: Circulating tumor cells (CTCs) are a burgeoning topic in cancer biomarker discovery research with minimal invasive blood draws. CTCs can be used as potential biomarkers for disease prognosis, early cancer diagnosis and pharmacodynamics. However, the extremely low abundance of CTCs limits their clinical utility because of technical challenges such as the isolation and subsequent detailed molecular and functional characterization of rare CTCs from patient blood samples.
Methods: In this study, we present a novel density gradient centrifugation method employing biodegradable gelatin nanoparticles coated on silicon beads for the isolation, release, and downstream analysis of CTCs from colorectal and breast cancer patients.
Results: Using clinical patient/spiked samples, we demonstrate that this method has significant CTC-capture efficiency (>80%) and purity (>85%), high CTC release efficiency (94%) and viability (92.5%). We also demonstrate the unparalleled robustness of our method in downstream CTC analyses such as the detection of PIK3CA mutations.
Conclusion: The efficiency and versatility of the multifunctional density microbeads approach provides new opportunities for personalized cancer diagnostics and treatments.
Keywords: circulating tumor cells, cell isolation, heterogeneous cells, precision medicine
Introduction
Circulating tumor cells (CTCs) are cancer cells found in peripheral blood that originate from primary tumors or metastatic sites [1, 2]. CTCs contribute to the spread of cancer to distant sites and have been attributed to >80% of cancer-related mortalities [3, 4]. Therefore, CTCs have been used as a valuable “liquid biopsy” biomarker to monitor cancer progression and metastasis [5]. Compared with gold standard biopsies, which involve the invasive removal of tissues or cells and are often associated with significant risks during the sampling process, the analysis of CTCs permits noninvasive cancer diagnostics [6]. The idea of interrogating cancer through a minimally invasive blood draw has attracted broad attention for prognostic and diagnostic applications in cancer management [7]. Extensive clinical studies have shown that the enumeration of CTCs provides critical information for cancer prognoses in breast, colorectal and prostate cancers [8, 9]. However, the limited predictive value of CTCs allows only the use of enumeration data to guide treatment decisions [10]. A recently study profiling AR-v7 expression in CTCs showed that the nuclear expression of the AR-v7 protein can predict patient response to therapy in metastatic castration-resistant prostate cancer [11]. The results of the study emphasize the applicability of molecular and functional profiling of CTCs for broader use in clinical settings.
In the past decade, many technologies have been developed to enrich and enumerate CTCs from peripheral blood. These technologies can generally be divided into two categories: affinity-based capture [12] and physical property-based capture [13]. Affinity-based CTC capture utilizes the concept that CTCs inheritably express tumor antigens that distinguish them from leukocytes and erythrocytes [14, 15]. However, antigen-based capture methods are typically biased because tumors are highly heterogeneous and dynamically evolving [16]. Although attempts have been made to discover more universal tumor signature antigens, antigen-based capture methods have failed to comprehensively capture all CTCs [17]. A notable example is the most common target antigen used for affinity-based capture, which is epithelial cell adhesion molecule (EpCAM) [18-20]. Although a large portion of tumor cells express EpCAM, a subpopulation of tumor cells tend to undergo a process called the epithelial-mesenchymal transition (EMT) [21, 22] during which they shed off EpCAM expression. This alteration renders EpCAM-based capture technologies ineffective. Furthermore, the cells that undergo EMT may be the “real culprits” that lead to metastasis [23]. The physical property-based CTC-capture technologies isolate CTCs based on their physical properties, such as size, deformability and density [24-27]. These technologies are antigen agnostic, which usually results in lower purity due to the large overlap in physical properties between CTCs and certain large monocytes. Most current CTC-capture technologies immobilize the captured cells, and this can limit available downstream analyses, such as single cell genomics/transcriptomics, or prevent the successful establishment of CTC cultures for drug sensitivity tests. There are a limited number of technologies that allow the release of high-purity and viable CTCs from capture platforms and these features are critical for accurate and robust downstream analyses of CTCs including sequencing or culturing [28, 29]. Most of these technologies require complicated microfluidic set-ups, which may hamper their utility in a clinical environment. Thus, there is a need to develop a technology that is simple to use and allows minimally biased, high-purity capture and release of CTCs with high efficiency and viability.
Herein, we report a multifunctional microbead-based density gradient centrifugation method that enables the high-purity isolation of CTCs (EpCAM positive and negative) and maintains CTC integrity. This approach involves the functionalization of gelatin nanoparticle-coated silicon microbeads (SiO2@Gel MBs) with anti-EpCAM and anti-CD146 antibodies to enhance the capture of mesenchymal CTCs, which have low EpCAM expression. SiO2@Gel MBs were synthesized based on our previously reported method (see Supplementary Material) [30]. The gelatin coating can be degraded by matrix metalloproteinase-9 enzyme (MMP-9), enabling a high-efficiency, low-impact method of releasing the captured CTCs. To increase the purity of the separated CTCs, we developed a novel optimized gradient centrifugation medium. The use of this medium, in addition to the large size and high density of SiO2@Gel MBs, enables sensitive and selective CTC isolation, even when EpCAM is low. The synergistic topographic features of gelatin nanocoatings effectively enhanced the interaction with cell filopodias compared to bare silicon microbeads (SiO2 MB) and further improved the cell-capture efficiency. Furthermore, the transparency of SiO2@Gel MBs enables precise cellular and subcellular imaging of isolated CTCs without the solar-like fluorescence blocking associated with opaque beads (i.e., magnetic beads). Compared with traditional EpCAM-based capturing methods, this novel method showed significantly superior capture efficiency (>80%) and purity (>85%). In addition, with the gelatin coating, the captured CTCs can be released with up to 94% efficiency and 92.5% viability, which is comparable to other CTC release methods [31, 32]. This simple method also benefits from ease of instrumentation in the clinical setting since it requires only standard centrifuge equipment, which is common in clinical diagnostics labs. Utilizing this method, we detected CTC in 19/20 (95%) analyzed samples from breast and colorectal cancer patients. The robust capture and release feature of the technology permitted the analysis of the PIK3CA oncogene mutation in these patient's CTCs. Our results indicated that 1 out of 10 colorectal cancer cases and 2 out of 10 breast cancer cases were positive for the 3140A/G (H1047R) heterozygous mutation in the PIK3CA oncogene, which could be clinically relevant for treatment decisions. We also envision these released, viable CTC could be utilized for various downstream assays such as DNA/RNA/protein analysis and for ex vivo culture to guide individualized therapy.
Materials and methods
Establishment of selective sedimentation method
To improve the separation purity of the targeted cells, we performed density-based cell isolation using Percoll media with different densities. The density of Percoll solution should be high enough to prevent the sedimentation of erythrocytes (1.10-1.15 g mL-1) and leukocytes (1.07-1.09 g mL-1). In this study, a low-density (1.077 g mL-1) Percoll solution was prepared by diluting a stock solution (1.13 g mL-1) with 10X concentrated phosphate-buffered saline (PBS, 1.075 g mL-1) at a 9:1 (v/v) ratio. A high-density (1.15 g mL-1) Percoll solution was prepared by mixing the original Percoll solution with 2.5 M (1.316 g mL-1) sucrose solution at a 9:1 (v/v) ratio.
The sedimentation rate of a particle in suspension is determined by the size of the particle and the difference in density between the particle and the surrounding solution [25, 26]. The sedimentation rate increases dramatically as the size and density of the particles increase. Thus, to maximize the difference in sedimentation rates between cell-immobilized beads and normal blood cells (i.e., leukocytes and erythrocytes), we used larger beads with higher density. In this study, antibody-modified SiO2@Gel MBs with a 2 g mL-1 density and 40 μm diameter were used for the selective density amplification of targeted CTCs from other blood cells in patient blood samples.
Cell lines and blood sample processing
The breast carcinoma cell lines (MCF-7 and MDA-MB-231), colorectal cancer cell lines (HCT116 and HT-29), and all blood samples were obtained from Zhongnan Hospital of Wuhan University. The blood samples were obtained from healthy donors and from breast and colorectal cancer patients under an approved institutional review board (IRB) protocol. The samples were maintained at 4 °C in ethylenediaminetetraacetic acid (EDTA)-containing vacutainer tubes and processed within 24 h. The desired concentration of cells (i.e., MDA-MB-231, MCF-7 HCT116 and HT-29 cell lines) was prepared by serial dilution of the original cell suspension in Dulbecco's modified Eagle's medium (DMEM). The cell-capture experiments with artificial blood samples were prepared by spiking carboxyfluorescein succinimidyl ester (CFSE, 5 μg mL-1 in PBS) pre-labeled cancer cells into 1 mL of whole blood acquired from a healthy donor, with final cancer cell concentrations of 20, 50, 100, 250 cells mL-1. Then, cancer-specific antibody-functionalized (anti-EpCAM /CD146, anti-EpCAM or anti-CD146 alone) SiO2@Gel MBs were added to the artificial blood sample to target the cancer cells. After incubation for 20 min at room temperature on a rotator (10 rpm), the treated blood sample was carefully layered on a 2 mL improved density gradient (Percoll, 1.15 g mL-1). After centrifugation, cell-attached beads (cell beads) were effectively separated from hematopoietic cells via selective density gradient sedimentation. The number of fluorescent cells identified as cancer cells captured on microbeads was counted from 10 randomly chosen low-magnification fields from 5 drops of cell-bead solution and used to determine the capture efficiency. The cell capture efficiency was defined as the ratio of attached cells to the number of loaded cells. In the cell-capture experiments from patient blood samples, a 2 mL volume of peripheral blood from each donor was divided into two equal parts for CTC enumeration in parallel (anti-EpCAM/CD146 capture or anti-EpCAM capture alone).
Flow cytometry analysis
The EpCAM and CD146 expression levels on cancer cells (i.e., MDA-MB-231, MCF-7, HCT116 and HT-29) were determined by fluorescence-activated cell sorting (FACS). The cell suspensions (106 cells mL-1) were washed with PBS containing 1% bovine serum albumin (BSA) and incubated with phycoerythrin (PE)-labeled anti-CD146 (PE-anti-CD146, 10 μg mL-1 in BSA) and/or allophycocyanin (APC)-labeled anti-EpCAM (APC-anti-EpCAM, 10 μg mL-1 in PBS) for 10 min. Unstained cells were used as negative controls. The cells were washed, collected and measured by a flow cytometer (Accuri C6, BD Biosciences). The cell viability was determined by incubating the cells with CFSE (5 μg mL-1 in PBS) and propidium iodide (PI, 5 μg mL-1 in PBS) for 10 min. The cells were then suspended in ice-cold PBS prior to measurement on the flow cytometer.
Confocal immunofluorescence imaging
The cultured cells were incubated with PE-anti-CD146 (10 μg mL-1 in BSA) and APC-anti-EpCAM (10 μg mL-1 in PBS) for 10 min at room temperature (RT). The cells were then fixed with 4% paraformaldehyde (PFA) for 10 min at RT. Nuclear staining was performed with 4′,6-diamidino-2-phenylindole (DAPI, 4 μg mL-1) for another 10 min before observation. The cells were imaged under a laser scanning confocal microscope (LCS SP8 STED Leica, Germany).
Western blotting
Western blotting was performed according to a previously described protocol [33]. In brief, total cells were lysed in radioimmunoprecipitation assay (RIPA) buffer and separated by SDS-PAGE. The proteins were transferred to a polyvinylidene fluoride (PVDF) membrane and incubated at 4 °C overnight with the following primary antibodies: anti-CD146 (Abcam), anti-EpCAM (Abcam), anti-E-cadherin (Abcam) and anti-GAPDH (Abcam). The protein bands were detected with HRP-conjugated secondary antibodies and visualized using an enhanced chemiluminescence system (Millipore, MA, USA).
PIK3CA mutation analysis
A micromanipulator (Narishige) was fitted to a microscope stage and a disposable glass capillary was mounted on the output of the manipulator to extract a target cell. Genomic DNA (gDNA) from each CTC was extracted and amplified using a Whole Genome Amplification Kit (WGA kit, Sigma-Aldrich). The PIK3CA gene was amplified from gDNA by PCR amplification in the presence of PIK3CA exon 9- and exon 20-specific primers. A 1 μL sample of the WGA product was used for quality control by gel electrophoresis. Genomic DNA isolated from blood samples showed amplification of exon 20 and exon 9 of the PIK3CA gene, with amplicon sizes of 250 and 241 bp, respectively. All amplicons were sent for Sanger sequencing (Tsing Ke Biological Technology). Additionally, all appropriate controls were run with cell lines and white blood cells.
The PCR amplification was performed as previously described [34, 35] with the following primers to detect PIK3CA mutations:
PIK3CA-Exon9-Forward (5'-GGGAAAAATATGACAAAGAAAGC-3'), PIK3CA-Exon9-Reverse (5'-CTGAGATCAGCCAAATTCAGTT-3'), PIK3CA-Exon9-Sequencing (5'-TAGCTAGAGACAATGAATTAAGGGAAA-3'),
PIK3CA-Exon20-Forward (5'-CTCAATGATGCTTGGCTCTG-3'), PIK3CA-Exon20-Reverse (5'-TGGAATCCAGAGTGAGCTTTC-3'), PIK3CA-Exon20-Sequencing (5'-TTGATGACATTGCATACATTCG-3').
Cell viability assay
Cell viability was evaluated using a dual-fluorescence viability assay with CFSE/PI staining to stain live and dead cells, respectively. The viability of cells captured on SiO2@Gel MBs was assessed by adding 0.5 mL of CFSE/PI (both 5 μg mL-1 in PBS) solution to the cell-bead solution and incubating at 37 °C for 10 min. The viability testing of cells after MMP-9 stimuli release was performed by staining cells with 0.5 mL of CFSE/PI solution, and incubating the cells at 37 °C for 10 min. The cells were immediately examined under a fluorescence microscope on a glass slide. As a control, cell viability was also tested prior to the cell capture-release experiments. The cell viability was quantified by counting the number of live and dead cells observed under a fluorescence microscope from 10 randomly chosen low-magnification fields. The percentage of cell viability was defined as the ratio of viable cells relative to the total cell number. All images were taken using Image-Pro Plus (IPP) software (Media Cybernetics Inc., Silver Spring, USA). The color and fluorescence images were taken using a microscope (IX81, Olympus, Japan) with a color CCD (DP72, Olympus, Japan).
Staining and identification of captured cells
After purification through selective sedimentation in a density gradient, the cancer cells captured on SiO2@Gel MBs were released and collected after MMP-9 stimulation. Subsequently, PFA (4% in PBS) was added to the tube to fix cells for 10 min and washed with PBS three times. Afterward, the cells were permeabilized with 0.2% Triton X-100 for 10 min for intracellular staining. Then, the cells were blocked for 30 min using a blocker (5% normal goat serum, 3% BSA and 0.1% Tween-20 in PBS) to decrease non-specific binding during immunofluorescence staining. Finally, the cells were stained with 10 μL of fluorescein isothiocyanate (FITC)-labeled anti-CD45 stock solution (FITC-anti-CD45, a marker for leukocytes), 10 μL of APC-anti-EpCAM (a surface marker for epithelial cells), and either 10 μL of PE-anti-CD146 stock solution or 10 μL of PE-labeled anti-cytokeratin (CK) stock solution (PE-anti-CK, a protein marker for epithelial cells) at 4 °C in the dark for approximately 2 h. The cells were then stained with DAPI for 10 min before observation. All bright-field and fluorescence images were taken under an IX81 microscope and analyzed using IPP software. The process to identify CTCs involved scanning for cells that showed bright orange fluorescence (indicating the presence of CK or CD146) but lacked the ring-shaped green fluorescence emitted by CD45 on the cell surface. Each candidate CTC was then carefully analyzed based on a clear DAPI signal and an intact membrane shape in the bright-field image. The red color for CTCs confirmed the presence of EpCAM. All identified CTCs were labeled by DAPI and anti-EpCAM, anti-CK or anti-CD146 but not anti-CD45. Cells showing the bright green fluorescence emitted by FITC-anti-CD45 were classified as leukocytes.
Results
Design, preparation and validation of the CTC-beads
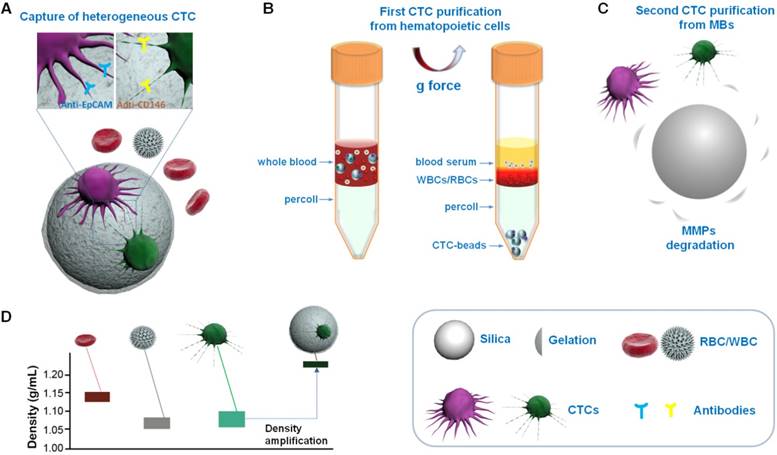
A schematic overview of our method is shown in Figure 1. Multifunctional microbeads, or “CTC-beads”, have previously been prepared by functionalizing anti-EpCAM and anti-CD146 antibodies with biodegradable gelatin nanoparticles [30, 36] onto silica microbeads (SiO2 MBs). CD146 has been discovered in many types of cancers and plays an important role in tumor progression as an EMT inducer [37, 38]. Thus, CD146 serves as an ideal surrogate marker for mesenchymal CTCs with down-regulated EpCAM levels [39, 40]. As shown in Figure 1A, heterogeneous CTCs were first immobileized onto the CTC-beads (anti-EpCAM&anti-CD146 SiO2@Gel MBs). Then, the CTC-beads with attached CTCs were isolated from blood by density gradient centrifugation (Figure 1B). The synergistic effect of the optimized centrifugation medium and CTC-beads significantly enhanced the CTC separation. To efficiently and noninvasively release CTCs after centrifugation, the gelatin nanoparticle-based CTC-beads were dissolved with MMP-9 (Figure 1C) [41, 42]. This strategy provides a low-cost and efficient means for the detection and subsequent study of CTCs and can be utilized in early cancer diagnoses and treatments. This CTC isolation protocol uses common equipment such as centrifuges and could be easily translated into clinical settings as a standardized test for CTCs.
Schematic overview of CTC isolation and release protocol using multifunctional microbead-based density gradient centrifugation. (A) High-efficiency CTC isolation with CTC-beads (anti-EpCAM, anti-CD146 and gelatin nanoparticle-coated SiO2@Gel MB). (B) First purification: centrifugation of live CTCs from hematopoietic cells by selective sedimentation with an improved centrifugation medium (Percoll) and CTC-beads. (C) Second purification: release of live CTCs with enzyme-induced gelatin degradation. (D) Density distribution of hematopoietic cells, CTCs and CTC-bead-conjugated CTCs.
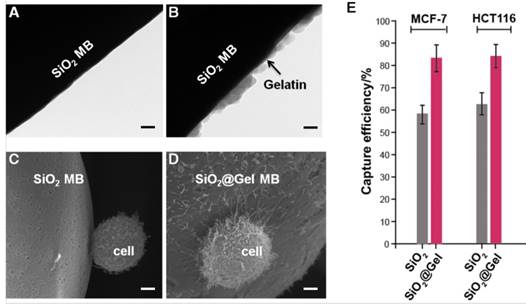
We confirmed the composition of the SiO2@Gel MBs by using Fourier transform infrared (FTIR) and X-ray diffraction (XRD) spectroscopy (Figure S1). The morphology of the SiO2@Gel MBs was analyzed by transmission electron microscopy (TEM) and scanning electron microscopy (SEM), as shown in Figure 2A-D. The TEM results (Figure 2A,B) revealed that the gelatin coating formed nanostructures on the surfaces of the CTC-beads and that these nanostructures might increase the cell-substrate affinity [43-45]. We next determined whether the CTC-beads provided higher cell-capture efficiency than the non-gelatin-coated beads (anti-EpCAM & anti-CD146 SiO2 MBs). We performed the cell-capture experiments using cancer cell lines (MCF-7 and HCT116) with cell suspensions of 105 cells mL-1 in cell culture medium (i.e., DMEM). SEM showed that the cells captured on the nanostructures of the CTC-beads could wrap around the bead due to the rougher surface nanostructures, which offer a larger cell-surface contact area compared with that of the bare SiO2 MB (Figure 2C,D). The cell-capture rate increased over 20% on the gelatin nanoparticle-coated beads compared to the non-gelatin coated beads (Figure 2E). To further study the effect of bead density on the cell-capture efficiency, we performed cell-capture experiments of different numbers (i.e., 1×10⁴ and 1×10⁵ cells mL-1) of cancer cells (i.e., MCF-7 and HCT116) using various concentrations of microsphere suspensions. The maximum cell-capture efficiency was achieved at 1.5×10⁵ beads mL-1 (Figure S2). The lowest capture efficiency was at a low concentration of MBs (less than 104 beads mL-1) and was likely due to the low rate of cell-bead interactions.
The gelatin coating-formed nanostructures on the surface of silica microbeads enhanced cell capture. TEM images of (A) anti-EpCAM and anti-CD146-coated SiO2 MB and (B) CTC-beads (anti-EpCAM&anti-CD146 SiO2@Gel MBs). SEM images of target cells captured on (C) anti-EpCAM and anti-CD146-coated SiO2 MB and (D) on CTC-beads. (A, B, scale bar, 50 nm; C, D, scale bar, 3 μm). (E) Cell-capture efficiency for two cell lines (MCF-7 and HCT116, 105 cells mL-1 in DMEM) using bare silica microbeads (SiO2 MBs) and gelatin nanoparticle-coated silica microbeads (SiO2@Gel MBs). All beads were functionalized with anti-EpCAM and anti-CD146. Error bars represent the standard deviations (n≥3).
To examine the cell-capture efficiency of SiO2@Gel MBs of different sizes, we performed cell capture and purification experiments using beads of 5, 10, 15, 30, and 40 μm size. As shown in Figure S3, beads ranging in size from 5 to 10 μm showed good cancer cell binding. However, staining and immunofluorescence identification of captured cells based on cancer cell surface markers (e.g., APC-anti-EpCAM and PE-anti-CD146) interfered with the beads (bead size less than 15 μm) coated on the cell surface. More importantly, many cells bound to silica microbeads less than 10 μm in size were found on the top of a high-density Percoll solution (1.15 g mL-1) containing a large number of erythrocytes. These results indicated that the smaller beads were not optimal for cancer cell purification. This finding might be due to the significantly decreased sedimentation rate of the smaller beads in the high-density Percoll solution. The coverage of 15 μm beads on the cell surface was significantly reduced, and fewer binding sites on the beads (bead sizes range from 15-30 μm) led to a reduction in cell trapping efficiency. The binding sites on the large beads (bead size larger than 30 μm) were significantly increased and allowed cancer cells to be efficiently captured. In our study, 40 μm SiO2@Gel MBs achieved the highest cancer cell capture efficiency and purification after centrifugation with a high-density Percoll solution.
Dual antibody-coated microbeads for enhanced CTC capture
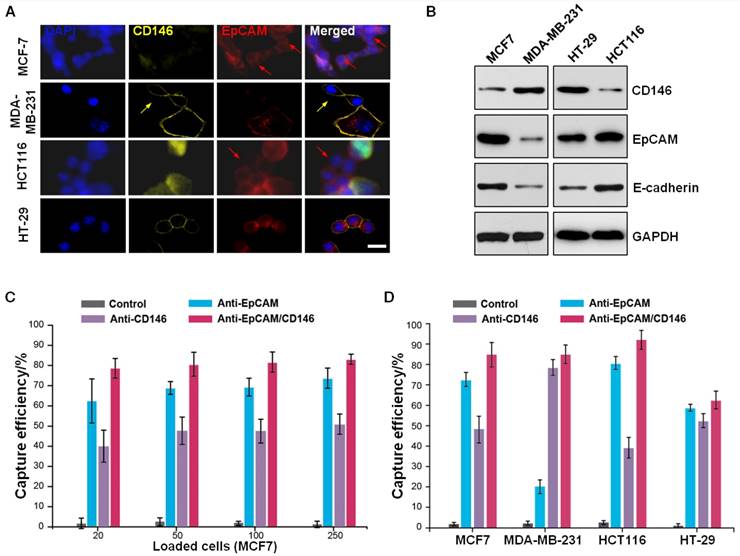
Subsequently, we determined whether a better cell-capture efficiency was achieved using CTC-beads with the additional functionalized anti-EpCAM and anti-CD146 antibodies. To compare the cell-capture performance, we used two breast carcinoma cell lines (MCF-7 and MDA-MB-231) and two colorectal cancer cell lines (HCT116 and HT-29), which express different levels of EpCAM or CD146, as the target cells. As shown by confocal microscopy (Figure 3A) and immunoblotting (Figure 3B), the MDA-MB-231 cells expressed high levels of CD146 (CD146high) and low levels of EpCAM (EpCAMlow). Conversely, the MCF-7 and HCT116 cells were CD146low/EpCAMhigh. These three cell lines had negative correlations between EpCAM and CD146 expression. The HT-29 cells maintained moderate expression levels of CD146 and EpCAM. We further confirmed the expression of CD146 and EpCAM in MCF-7 and MDA-MB-231 cells using immunofluorescence and flow cytometry (Figure S4A,B). The results revealed a subpopulation of cells expressing only one of these two antigens. These results indicated that the use of anti-EpCAM as a single capture agent would result in the loss of EpCAM-low and EpCAM-negative cancer cells. Furthermore, we found cells exhibiting high CD146 expression levels and low E-cadherin (an EMT marker) [46, 47] expression levels, indicating decreased cell-cell contact and shifts toward mesenchymal phenotypes. Therefore, the use of anti-EpCAM and anti-CD146 together would enhance CTC capture by collecting the subpopulation of EpCAM-free, post-EMT cells during the metastatic process.
Dual antibody-coated microbeads for enhanced cell capture. (A) Confocal microscopy images of different cell lines (MCF-7, MDA-MB-231, HCT116 and HT-29) after treatment with DAPI, PE-anti-CD146, and APC-anti-EpCAM, followed by 2 h of incubation at 37 °C. The scale bar is 20 μm. (B) Western blot analysis of cell surface proteins (CD146, EpCAM and E-cadherin) of MCF-7, MDA-MB-231, HCT116 and HT-29 cells. (C) Cell-capture efficiency of MCF-7 cells with different cell concentrations (20, 50, 100, 250 cells mL-1 in whole blood) and using anti-EpCAM- and anti-CD146-coated SiO2@Gel MBs and three different controls (no antibody, only anti-EpCAM-coated, and only anti-CD146-coated) for comparison. Error bars represent the standard deviations (n≥3). (D) Cell-capture efficiency of different cell populations (MCF-7, MDA-MB-231, HCT116 and HT-29 cells with a fixed cell concentration of 100 cells mL-1 in whole blood) under four different capture conditions (no antibody and single or dual antibody-coated SiO2@Gel MBs).
To evaluate the cell-capture efficiency of CTC-beads (anti-EpCAM&anti-CD146 SiO2@Gel MBs), we performed parallel experiments with four cell lines (MCF-7, MDA-MB-231, HCT116 and HT-29) under four different conditions: i) SiO2@Gel MBs without any surface modification, ii) SiO2@Gel MBs with only anti-EpCAM modification, iii) SiO2@Gel MBs with only anti-CD146 modification, and iv) CTC-beads. First, cell suspensions (105 cells mL-1) were prepared by spiking cancer cells (i.e., MCF-7 and HCT116) in DMEM and mixing them with SiO2@Gel MBs. The capture efficiency shown in Figure S5 demonstrated that the CTC-beads yielded the highest efficiency. We then evaluated the performance of our system with whole blood by spiking various numbers of cancer cells into blood samples from healthy donors to simulate CTC capture from actual patient samples. A total of 20, 50, 100 and 250 cancer cells from all four cancer cell lines (MCF-7, MDA-MB-231, HCT116 and HT-29, respectively) were individually spiked into 1 mL of healthy human blood. Then, the cells were isolated using 1.5×10⁵ SiO2@Gel MBs functionalized with anti-EpCAM and anti-CD146, anti-EpCAM alone or anti-CD146 alone. As summarized in Figure 3C,D, the combined use of anti-EpCAM and anti-CD146 appeared to yield a higher capture efficiency than the use of anti-EpCAM or anti-CD146 alone. The bare SiO2@Gel MBs captured very few cancer cells.
In our study, CTC-beads were treated with excess biotinylated anti-EpCAM (10 μg mL-1) and anti-CD146 (10 μg mL-1). Both antibodies are evenly distributed on the surface of the CTC-beads. We further investigated the effect of the ratio of these two antibodies on the efficiency of cell capture by performing cell-capture experiments with SiO2@Gel MBs coated with different ratios of anti-EpCAM and anti-CD146 (i.e., 1/0, 5/1, 2/1, 1/1, 1/2, 1/5 and 0/1). The total concentration of the two antibodies was 20 μg mL-1. The cell suspensions (1 mL in DMEM) containing MCF-7 (104 cells, CD146low/EpCAMhigh) and MDA-MB-231 (104 cells, CD146high/EpCAMlow) were employed as model systems. The confocal microscopy images of cancer cells isolated using SiO2@Gel MBs with anti-EpCAM and anti-CD146 mixed at a ratio of 5:1 showed that most of the cells captured were EpCAM-expressing cells. This finding suggested that CD146-low and CD146-negative cancer cells were lost (Figure S6A). However, the majority of cells captured with a 1:5 mix of anti-EpCAM and anti-CD146 were CD146-expressing cells, which indicated the ratio was not able to effectively capture EpCAM-expressing cells (Figure S6B). As shown in Figure S6C, EpCAM and CD146 expressing cells were successfully captured using two comparable concentrations of antibodies. These results indicated that reducing antibody modification will affect the ability of dual antibody-coated SiO2@Gel MBs to capture the corresponding antigen-expressing cells. As shown in Figure S6D, the highest cell-capture efficiency was obtained with the same concentrations of anti-EpCAM and anti-CD146. This result might be due to the sufficient binding sites for rare cell targeting (e.g., CTCs) due to the large size of the beads (large surface area) and the rough surface nanostructures formed by the gelatin nanoparticles.
Optimization of the gradient centrifugation medium for high-purity CTC isolation
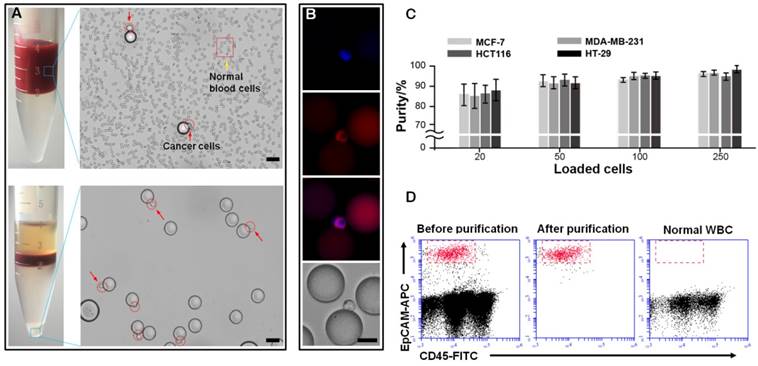
We further improved the separation purity by optimizing the gradient centrifugation medium. The cancer cell purification performance was tested using the following different types of Percoll media: samples were diluted 1:1 in PBS, layered onto Percoll density gradient solutions with different densities (1.077, 1.13 and 1.15 g mL-1), and centrifuged for separation to different layers (Figure S7). Our examinations of the different gradient fractions showed that large numbers of erythrocytes deposited at the bottoms of the centrifuge tubes containing Percoll density gradients of 1.077 and 1.13 g mL-1. This result indicated that the commonly used density media were not optimal for isolating cells at sufficiently high purity. In contrast, centrifugation with the high-density Percoll gradient medium (1.15 g mL-1) in combination with our CTC-beads resulted in high-purity cancer cell enrichment (Figure 4A-C). The optical transparency of the silica beads enabled accurate subcellular imaging of the CTC-bead complex cells without interference from the microbeads. The high-purity cancer cell isolation from human blood was confirmed via flow cytometry (Figure 4D). The samples were stained with APC-anti-EpCAM for MCF-7 cells and FITC-anti-CD45 for white blood cells (WBCs). Our method achieved a purity of over 85% in separating cancer cells from normal blood cells and from a spiked blood sample and surpassed other density-based methods [26]. In contrast, no EpCAM-positive cells were observed in normal WBC samples, as expected.
Purification of cancer cells from hematopoietic cells. (A) Microscopic images of MCF-7 cells captured by CTC-beads (top). Microscopic images of cell beads purified from hematopoietic cells by selective sedimentation in an improved density gradient medium (Percoll) (bottom). The scale bars are 50 μm. (B) The fluorescence images and corresponding bright-field image of purified cell beads. The scale bar is 20 μm. (C) Purity of cancer cells (MCF-7, MDA-MB-231, HCT116 and HT-29) after centrifugation with Percoll. Error bars represent the standard deviations (n≥3). (D) Flow cytometry scatter plots summarizing the MCF-7 cell and WBC distribution before and after the cell capture-release process. The samples were stained with APC-anti-EpCAM for MCF-7 cells and FITC-anti-CD45 for WBCs. No EpCAM-positive cells were observed in the normal WBC sample.
Optimization of viable cell release
To non-invasively collect CTCs from our CTC-beads, we developed a simple substrate-sacrificing method by digesting gelatin nanoparticles using MMP-9 (Figure 5A-D). As shown in Figure 5E and Figure S8, nearly all cells effectively detached from the microbeads in a noncontact manner. The efficiency of cell release was defined as the ratio of the number of released cells to the total number of attached cells.
Second purification of cancer cells (MCF-7, MDA-MB-231, HCT116 and HT-29) from microbeads via enzyme-induced gelatin degradation. TEM images of (A) a gelatin nanoparticle-coated silica microbead (SiO2@Gel MB) and (B) a SiO2@Gel MB after gelatin degradation induced by the MMP-9 enzyme. (C-D) Microscopic images of specifically captured MCF-7 cells purified from microbeads after MMP-9 treatment. (A, B, scale bar, 50 nm; C, D, scale bar, 50 μm). (E) Recovery efficiency of MCF-7, MDA-MB-231, HCT116 and HT-29 cells after purification from microbeads. (F) The bright-field and corresponding fluorescence images of the cultured cells from day 1 to day 5 after the cell capture-release cycle. The scale bar is 20 μm. (G) Viability of cancer cells after the cell capture-purification cycle. Error bars represent the standard deviations (n≥3).
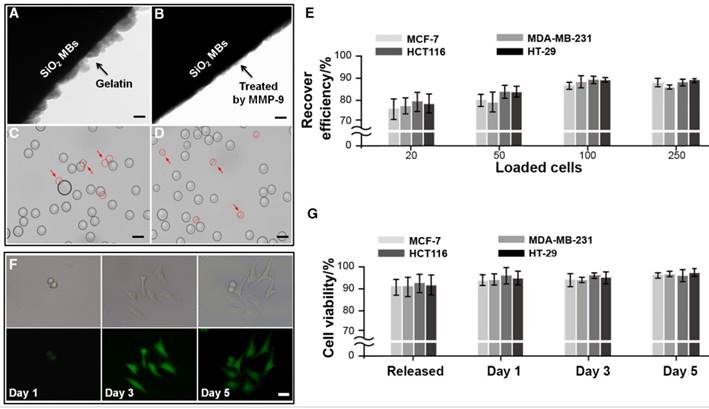
The cell release efficiency was optimized to maintain high cell viability by altering the working concentration and the incubation time of MMP-9. As shown in Figure S9, a maximum retrieval rate of 94% cell release was achieved using an MMP-9 solution of 0.1 mg mL-1 and an incubation time of 10 min at 37 °C. After cell release, the viability of the released cells was determined using live/dead cell staining and flow cytometry (Figure 5F,G and Figure S10). The results showed that the percentage of viable cells was 92.5% after cell release, which was similar to the cell viability of the control cells (94.9%). After centrifugation, the released cancer cells and leukocytes were re-suspended in 0.2 mL of DMEM medium in a 96-well plate and placed in the cell culture incubator (37 °C, 5% CO2) for 5 days. During this period, cancer cells adhered to the surfaces of the culture plate and proliferated, whereas WBCs experienced apoptosis. This result indicated that the capture and release of cancer cells using our approach had no significant effects on cell viability or proliferative potential.
CTC enumeration and characterization using CTC-beads
To further validate our method in a clinical setting, we processed peripheral blood samples from 20 patients with clinically confirmed colorectal and breast cancers and 6 samples from healthy donors. For each individual, 1 mL of blood was processed with our technology using anti-EpCAM/CD146 capture; 1 mL of blood was processed using anti-EpCAM capture alone for comparison. The enriched cells were stained with DAPI for cellular nuclei, the epithelial markers EpCAM and cytokeratin (CK), and the leukocyte marker CD45 (Figure 6A). CTCs were identified as cells with intact nuclei, CK or EpCAM expression, and the absence of CD45. CD146 was chosen as a supplementary marker to prevent false-negative identification of CTCs that did not express EpCAM or expressed low EpCAM antigen (Figure 6B). The cells stained as DAPI+/CD45-/CK+ or DAPI+/CD45-/EpCAM+ were identified as CTCs, whereas cells stained as DAPI+/CD45+ were scored as WBCs. As shown in Figure 6C, the CTC counts in patient samples were typically higher when using beads functionalized with anti-EpCAM/CD146 than those for CTC capture using anti-EpCAM alone. This finding indicated that anti-CD146 captured a subpopulation of CTCs that were negative for EpCAM or expressed low levels of EpCAM. This DAPI+/CD45-/CD146+ cell population may be of clinical significance because CD146 expression has been correlated with cancer dissemination processes.
Capture and analysis of CTCs from the whole blood of cancer patients. (A) Fluorescence images of CTCs isolated from blood samples from a breast cancer patient. A four-color immunocytochemistry method based on DAPI nuclear staining, APC-anti-EpCAM, PE-anti-CK, and FITC-anti-CD45 was used to identify and enumerate CTCs. The scale bars are 10 μm. (B) Fluorescence images of a CTC from a breast cancer patient (#13), which is positive for CD146 and negative for EpCAM. The scale bar is 10 μm. (C) CTCs isolated from 2.0 mL blood samples from colorectal (#1-10) and breast (#11-20) cancer patients using anti-EpCAM/CD146 capture (red dots) and anti-EpCAM capture alone (blue dots) for comparison. (D) CTCs isolated from blood samples from colorectal and breast cancer patients. The scale bar is 5 μm. Middle: images of the amplified DNA of the single CTCs. Right: Sanger sequencing of the individually isolated cells. The 3140A/G (H1047R) point mutation in the PIK3CA oncogene was detected.
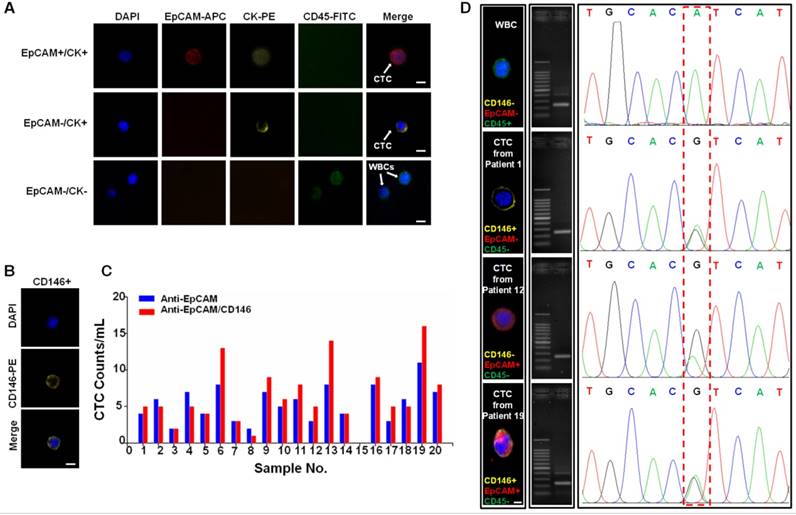
CTCs harbor distinctive mutations from primary tumors and can potentially be probed as a biomarker to detect early mutational events to guide treatment decisions [48]. Thus, we analyzed single gene mutations on the released CTCs as a proof-of-concept experiment to validate the compatibility of our technology with robust downstream single cell genomics study. We chose to analyze the PIK3CA gene in CTC because it is frequently mutated in several types of human cancer and could be a potential diagnostic biomarker or a promising therapeutic target in the future [49-52]. In this study, PIK3CA mutational analyses were performed on exon 9 and exon 20 of PIK3CA via PCR of genomic DNA extracted from CTCs and was followed by Sanger sequencing [53]. CTCs were isolated from one colorectal and two breast cancer patients whose metastatic tumors were confirmed as positive for the 3140A/G (H1047R) heterozygous mutations in the PIK3CA oncogene (Figure 6D). As a negative control, WBCs isolated from the same patients showed no PIK3CA mutation. This result has shown that the superior viability and purity of the CTCs isolated using our technology permits direct bulk analysis of CTC mutations, which to date has been demonstrated by very few other available technologies.
Discussion and Conclusion
Liquid biopsy techniques such as CTC-based diagnostics have been frequently used to determine cancer prognoses and diagnoses. However, cancer metastases and CTC properties, including their broad heterogeneity, indistinguishable primary and metastatic characteristics, and dormancy mechanics, remain largely unknown. These issues have hindered the application of CTC analysis in clinical settings and are primarily due to poor CTC-capture technologies that yield biased or low-purity samples and thus have poor downstream analysis potential. In this study, we reported a density-based CTC capture and release method with high efficiency (>80%) and purity (>85%). The significance of this novel CTC capture and release methodology is three-fold. First, we employed a combination strategy to capture CTCs using CTC-beads functionalized with both anti-EpCAM and anti-CD146 antibodies. This strategy allows the capture of CTCs that had undergone the EMT process, which had shed off their EpCAM expression. Second, we employed density-based separation utilizing a common lab test that can be easily established in clinical labs. This methodology is low cost, can be easily standardized with high-throughput capacity and provides rapid, highly efficient recovery with a high purity of viable CTCs from whole patient blood. Third, the gelatin coating on these beads can be dissolved by MMP-9 to isolate CTCs with minimal contamination and negligible disruption of the viability and function of the CTCs. These attributes ensure the versatility and compatibility of the technology with numerous downstream applications. To demonstrate the feasibility of these beads, we showed that this technology can be applied to analyze PIK3CA point mutations in CTCs from patient blood samples and thus might be applicable to drug treatment guidance. Overall, this method answered many unmet needs in CTC isolation and recovery for downstream analyses.
Abbreviations
CTCs: circulating tumor cells; DAPI: 4′,6-diamidino-2-phenylindole; WBC: white blood cells; FTIR: Fourier transform infrared; XRD: X-ray diffraction; TEM: transmission electron microscopy; SEM: scanning electron microscopy; MMP-9: matrix metalloproteinase-9 enzyme; EpCAM: epithelial cell adhesion molecule; CK: cytokeratin; DMEM: Dulbecco's modified Eagle's medium; PBS: phosphate-buffered saline; FACS: fluorescence-activated cell sorting; BSA: bovine serum albumin; EDTA: ethylenediaminetetraacetic acid; CFSE: carboxyfluorescein succinimidyl ester; PVDF: polyvinylidene fluoride; FITC: fluorescein isothiocyanate; PE: phycoerythrin; APC: allophycocyanin; PI: propidium iodide; RIPA: radioimmunoprecipitation assay; PFA: paraformaldehyde.
Acknowledgements
This work was supported by the National Natural Science Foundation for Major Research Instruments (Grant No. 81527801), National Natural Science Foundation of China (No. 81371897), China Postdoctoral Science Foundation (2016M602367, 2017T100571), National Key Research and Development Project (2016YFC1000700), and Hubei Province's Outstanding Medical Academic Leader Program, and the Young One Thousand Talent program of China.
Supplementary Material
Supplementary figures and tables.
Competing Interests
The authors have declared that no competing interest exists.
References
1. Chambers AF, Groom AC, MacDonald IC. Dissemination and growth of cancer cells in metastatic sites. Nat Rev Cancer. 2002;2:563-72
2. Chaffer CL, Weinberg RA. A Perspective on Cancer Cell Metastasis. Science. 2011;331:1559-64
3. Marx V. Tracking metastasis and tricking cancer. Nature. 2013;494:133-8
4. Pantel K, Brakenhoff RH, Brandt B. Detection, clinical relevance and specific biological properties of disseminating tumour cells. Nat Rev Cancer. 2008;8:329-40
5. Pantel K, Alix-Panabières C. Circulating tumour cells in cancer patients: challenges and perspectives. Trends Mol Med. 2010;16:398-406
6. Di Meo A, Bartlett J, Cheng Y, Pasic MD, Yousef GM. Liquid biopsy: a step forward towards precision medicine in urologic malignancies. Mol Cancer. 2017;16:80
7. Kaiser J. Cancer's Circulation Problem. Science. 2010;327:1072-4
8. Kling J. Beyond counting tumor cells. Nat Biotechnol. 2012;30:578-80
9. de Bono JS, Scher HI, Montgomery RB, Parker C, Miller MC, Tissing H. et al. Circulating tumor cells predict survival benefit from treatment in metastatic castration-resistant prostate cancer. Clin Cancer Res. 2008;14:6302-9
10. Smerage JB, Barlow WE, Hortobagyi GN, Winer EP, Leyland-Jones B, Srkalovic G. et al. Circulating tumor cells and response to chemotherapy in metastatic breast cancer: SWOG S0500. J Clin Oncol. 2014;32:3483-9
11. Scher HI, Lu D, Schreiber NA. et al. Association of ar-v7 on circulating tumor cells as a treatment-specific biomarker with outcomes and survival in castration-resistant prostate cancer. JAMA Oncol. 2016;2:1441-9
12. Ao Z, Cote RJ, Datar RH. Affinity-Based Enrichment of Circulating Tumor Cells. In: (ed.) Cote RJ, Datar RH. Circulating Tumor Cells. New York: Springer. 2016:17-28
13. Ao Z, Moradi K, Cote RJ, Datar RH. Size-Based and Non-Affinity Based Microfluidic Devices for Circulating Tumor Cell Enrichment and Characterization. In: (ed.) Cote RJ, Datar RH. Circulating Tumor Cells. New York: Springer. 2016:29-45
14. Zhang N, Deng Y, Tai Q, Cheng B, Zhao L, Shen Q. et al. Electrospun TiO2 nanofiber-based cell capture assay for detecting circulating tumor cells from colorectal and gastric cancer patients. Adv Mater. 2012;24:2756-60
15. Huang Q, Chen B, He R, He Z, Cai B, Xu J. et al. Capture and release of cancer cells based on sacrificeable transparent MnO2 nanospheres thin film. Adv Healthc Mater. 2014;3:1420-5
16. Mohamadi RM, Besant JD, Mepham A, Green B, Mahmoudian L, Gibbs T. et al. Nanoparticle-Mediated Binning and Profiling of Heterogeneous Circulating Tumor Cell Subpopulations. Angew Chem Int Ed. 2015;54:139-43
17. Alix-Panabieres C, Pantel K. Challenges in circulating tumour cell research. Nat Rev Cancer. 2014;14:623-31
18. Stott SL, Hsu CH, Tsukrov DI, Yu M, Miyamoto DT, Waltman BA. et al. Isolation of circulating tumor cells using a microvortex-generating herringbone-chip. Proc Natl Acad Sci U S A. 2010;107:18392-7
19. Racila E, Euhus D, Weiss AJ, Rao C, McConnell J, Terstappen LWMM. et al. Detection and characterization of carcinoma cells in the blood. Proc Natl Acad Sci U S A. 1998;95:4589-94
20. Lowes LE, Goodale D, Ying X, Postenka C, Piaseczny MM, Paczkowski F. et al. Epithelial-to-mesenchymal transition leads to disease-stage differences in circulating tumor cell detection and metastasis in pre-clinical models of prostate cancer. Oncotarget. 2016;7:76125
21. Bednarz-Knoll N, Alix-Panabieres C, Pantel K. Plasticity of disseminating cancer cells in patients with epithelial malignancies. Cancer Metast Rev. 2012;31:673-87
22. Plaks V, Koopman CD, Werb Z. Circulating Tumor Cells. Science. 2013;341:1186-8
23. Yu M, Bardia A, Wittner BS, Stott SL, Smas ME, Ting DT. et al. Circulating Breast Tumor Cells Exhibit Dynamic Changes in Epithelial and Mesenchymal Composition. Science. 2013;339:580-4
24. El-Ali J, Sorger PK, Jensen KF. Cells on chips. Nature. 2006;442:403-11
25. Gertler R, Rosenberg R, Fuehrer K, Dahm M, Nekarda H, Siewert JR. Detection of circulating tumor cells in blood using an optimized density gradient centrifugation. Recent Results Cancer Res. 2003;162:149-55
26. Yoo CE, Moon HS, Kim YJ, Park JM, Park D, Han KY. et al. Highly dense, optically inactive silica microbeads for the isolation and identification of circulating tumor cells. Biomaterials. 2016;75:271-8
27. Kim YJ, Koo GB, Lee JY, Moon HS, Kim DG, Lee DG. et al. A microchip filter device incorporating slit arrays and 3-D flow for detection of circulating tumor cells using CAV1-EpCAM conjugated microbeads. Biomaterials. 2014;35:7501-10
28. Yu M, Bardia A, Aceto N, Bersani F, Madden MW, Donaldson MC. et al. Ex vivo culture of circulating breast tumor cells for individualized testing of drug susceptibility. Science. 2014;345:216-20
29. Shemesh J, Arye TB, Avesar J, Kang JH, Fine A, Super M. et al. Stationary nanoliter droplet array with a substrate of choice for single adherent/nonadherent cell incubation and analysis. Proc Natl Acad Sci U S A. 2014;111:11293-8
30. Huang Q, Cai B, Chen B, Rao L, He Z, He R. et al. Efficient Purification and Release of Circulating Tumor Cells by Synergistic Effect of Biomarker and SiO2 @Gel-Microbead-Based Size Difference Amplification. Adv Healthc Mater. 2016;5:1554-9
31. Shi W, Wang S, Maarouf A, Uhl CG, He R, Yunus D. et al. Magnetic particles assisted capture and release of rare circulating tumor cells using wavy-herringbone structured microfluidic devices. Lab Chip. 2017;17:3291-9
32. Huang C, Yang G, Ha Q, Meng J, Wang S. Multifunctional “Smart” Particles Engineered from Live Immunocytes: Toward Capture and Release of Cancer Cells. Adv Mater. 2015;27:310-3
33. Chen M, Hu W, Xiong CL, Qu Z, Yin CQ, Wang YH. et al. miR-22 targets YWHAZ to inhibit metastasis of hepatocellular carcinoma and its down-regulation predicts a poor survival. Oncotarget. 2016;7:80751-64
34. Mei ZB, Duan CY, Li CB, Cui L, Ogino S. Prognostic role of tumor PIK3CA mutation in colorectal cancer: a systematic review and meta-analysis. Ann Oncol. 2016;27:1836-48
35. Moroni M, Veronese S, Benvenuti S, Marrapese G, Sartore-Bianchi A, Di Nicolantonio F. et al. Gene copy number for epidermal growth factor receptor (EGFR) and clinical response to antiEGFR treatment in colorectal cancer: a cohort study. Lancet Oncol. 2005;6:279-86
36. Reategui E, Aceto N, Lim EJ, Sullivan JP, Jensen AE, Zeinali M. et al. Tunable nanostructured coating for the capture and selective release of viable circulating tumor cells. Adv Mater. 2015;27:1593-9
37. Wang Z, Yan X. CD146, a multi-functional molecule beyond adhesion. Cancer lett. 2013;330:150-62
38. Mostert B, Kraan J, Bolt-de Vries J, van der Spoel P, Sieuwerts AM, Schutte M. et al. Detection of circulating tumor cells in breast cancer may improve through enrichment with anti-CD146. Breast Cancer Res Tr. 2011;127:33-41
39. Zeng Q, Zhang P, Wu Z, Xue P, Lu D, Ye Z. et al. Quantitative proteomics reveals ER-alpha involvement in CD146-induced epithelial-mesenchymal transition in breast cancer cells. J proteomics. 2014;103:153-69
40. Zeng Q, Li W, Lu D, Wu Z, Duan H, Luo Y. et al. CD146, an epithelial-mesenchymal transition inducer, is associated with triple-negative breast cancer. Proc Natl Acad Sci U S A. 2012;109:1127-32
41. Gupta GP, Massagué J. Cancer Metastasis: Building a Framework. Cell. 2006;127:679-95
42. Xu J-H, Gao F-P, Li L-L, Ma HL, Fan Y-S, Liu W. et al. Gelatin-mesoporous silica nanoparticles as matrix metalloproteinases-degradable drug delivery systems in vivo. Micropor Mesopor Mater. 2013;182:165-72
43. Cukierman E, Pankov R, Stevens DR, Yamada KM. Taking Cell-Matrix Adhesions to the Third Dimension. Science. 2001;294:1708-12
44. Zhang P, Chen L, Xu T, Liu H, Liu X, Meng J. et al. Programmable fractal nanostructured interfaces for specific recognition and electrochemical release of cancer cells. Adv Mater. 2013;25:3566-70
45. Ouyang J, Chen M, Bao W-J, Zhang Q-W, Wang K, Xia X-H. Morphology Controlled Poly(aminophenylboronic acid) Nanostructures as Smart Substrates for Enhanced Capture and Release of Circulating Tumor Cells. Adv Funct Mater. 2015;25:6122-30
46. Perl AK, Wilgenbus P, Dahl U, Semb H, Christofori G. A causal role for E-cadherin in the transition from adenoma to carcinoma. Nature. 1998;392:190-3
47. Kang Y, Massague J. Epithelial-mesenchymal transitions: twist in development and metastasis. Cell. 2004;118:277-9
48. Huang Q, Wang Y, Chen X, Wang Y, Li Z, Du S, Wang L, Chen S. Nanotechnology-Based Strategies for Early Cancer Diagnosis Using Circulating Tumor Cells as a Liquid Biopsy. Nanotheranostics. 2018;2:21-41
49. Samuels Y, Wang Z, Bardelli A, Silliman N, Ptak J, Szabo S. et al. High frequency of mutations of the PIK3CA gene in human cancers. Science. 2004;304:554
50. Lee JW, Soung YH, Kim SY, Lee HW, Park WS, Nam SW. et al. PIK3CA gene is frequently mutated in breast carcinomas and hepatocellular carcinomas. Oncogene. 2005;24:1477-80
51. Van Keymeulen A, Lee MY, Ousset M, Brohee S, Rorive S, Giraddi RR. et al. Reactivation of multipotency by oncogenic PIK3CA induces breast tumour heterogeneity. Nature. 2015;525:119-23
52. Bingham C, Fernandez SV, Fittipaldi P, Dempsey PW, Ruth KJ, Cristofanilli M. et al. Mutational studies on single circulating tumor cells isolated from the blood of inflammatory breast cancer patients. Breast Cancer Res Tr. 2017;163:219-30
53. Pestrin M, Salvianti F, Galardi F, De Luca F, Turner N, Malorni L. et al. Heterogeneity of PIK3CA mutational status at the single cell level in circulating tumor cells from metastatic breast cancer patients. Mol Oncol. 2015;9:749-57
Author contact
![]() Corresponding authors: Shi Chen (shichenedu.cn), Zheng Ao (zheng.aocom), Xing-Zhong Zhao (xzzhaoedu.cn)
Corresponding authors: Shi Chen (shichenedu.cn), Zheng Ao (zheng.aocom), Xing-Zhong Zhao (xzzhaoedu.cn)