Impact Factor
- Issue 14; 2026
- Issue 13; 2026
- Issue 12; 2026
- Issue 11; 2026
- Issue 10; 2026
- Volume 16; 2026
- Advance Articles
- Past Issues
- Cover Images
- Cover Suggestion
- Index & Coverage
- Special Issues
Introduction
Methods
Results
Discussion
Supplementary Material
Abbreviations
Acknowledgements
References
International Journal of Biological Sciences
International Journal of Medical Sciences
 Global reach, higher impact

Theranostics 2018; 8(6):1468-1480. doi:10.7150/thno.22018 This issue Cite
Research Paper
Urinary Metabolites Associated with Blood Pressure on a Low- or High-Sodium Diet
Yuan Cheng1,2,3,*, Haiying Song1,2,3,*, Xiaoqing Pan3,*, Hong Xue3,4,*, Yifei Wan3, Tao Wang5, Zhongmin Tian6, Entai Hou6, Ian R. Lanza7, Pengyuan Liu3, Yong Liu3, Purushottam W. Laud5, Kristie Usa3, Yongcheng He1,2, ![]() , Mingyu Liang3,
, Mingyu Liang3, ![]()
1. Department of Nephrology, Shenzhen Second People's Hospital, the First Affiliated Hospital of Shenzhen University, Clinical Institute of Anhui Medical University, Shenzhen, Guangdong, P.R. China
2. The Center for Nephrology and Urology at Shenzhen University, Shenzhen University Health Science Center, Shenzhen University, Guangdong, P.R. China
3. Center of Systems Molecular Medicine, Department of Physiology, Medical College of Wisconsin, Milwaukee, WI, USA
4. Department of Physiology and Pathophysiology, Fudan University Shanghai Medical College, Shanghai, P.R. China
5. Division of Biostatistics, Institute for Health and Society, Medical College of Wisconsin, Milwaukee, WI, USA
6. The Key Laboratory of Biomedical Information Engineering of Ministry of Education, School of Life Science and Technology, Xi'an Jiaotong University, Xi'an 710049, China
7. Division of Endocrinology, Department of Medicine, Mayo Clinic, Rochester, MN, USA
*equal contribution
Received 2017-7-20; Accepted 2017-11-14; Published 2018-2-5
Abstract

Dietary salt intake has significant effects on arterial blood pressure and the development of hypertension. Mechanisms underlying salt-dependent changes in blood pressure remain poorly understood, and it is difficult to assess blood pressure salt-sensitivity clinically.
Methods: We examined urinary levels of metabolites in 103 participants of the Dietary Approaches to Stop Hypertension (DASH)-Sodium trial after nearly 30 days on a defined diet containing high sodium (targeting 150 mmol sodium intake per day) or low sodium (50 mmol per day). Targeted chromatography/mass spectrometry analysis was performed in 24 h urine samples for 47 amino metabolites and 10 metabolites related to the tricarboxylic acid cycle. The effect of an identified metabolite on blood pressure was examined in Dahl salt-sensitive rats.
Results: Urinary metabolite levels improved the prediction of classification of blood pressure salt-sensitivity based on race, age and sex. Random forest and generalized linear mixed model analyses identified significant (false discovery rate <0.05) associations of 24 h excretions of β-aminoisobutyric acid, cystine, citrulline, homocysteine and lysine with systolic blood pressure and cystine with diastolic blood pressure. The differences in homocysteine levels between low- and high-sodium intakes were significantly associated with the differences in diastolic blood pressure. These associations were significant with or without considering demographic factors. Treatment with β-aminoisobutyric acid significantly attenuated high-salt-induced hypertension in Dahl salt-sensitive rats.
Conclusion: These findings support the presence of new mechanisms of blood pressure regulation involving metabolic intermediaries, which could be developed as markers or therapeutic targets for salt-sensitive hypertension.
Keywords: hypertension, diet, salt, metabolomics
Introduction
Hypertension is the No. 1 identifiable risk factor for disease burden and deaths worldwide, affecting more than 1 billion people.1,2 Several studies have identified associations between metabolite levels and blood pressure. Levels of hexadecanedioate, a dicarboxylic acid, were significantly associated with systolic and diastolic blood pressure in a non-targeted analysis of 280 fasting blood metabolites in Twins UK females, which was replicated in KORA and Hertfordshire cohorts.3 A metabolomic analysis of the plasma of young hypertensive men identified alterations in several metabolites, particularly amino acids and organic acids.4 Baseline serum levels of serine, glycine, and several phospholipids have been shown to predict incident hypertension in a subcohort of the European Prospective Investigation Into Cancer and Nutrition (EPIC)-Potsdam Study with a mean follow-up of 9.9 years.5 These findings, together with genetic and animal model studies,6-9 support potential roles of cellular metabolic intermediaries in the regulation and abnormalities of blood pressure. However, it is difficult to obtain mechanistic insights or delineate the interplay between metabolites and lifestyle factors known to influence blood pressure in observational studies.
Dietary salt intake influences blood pressure in a large portion of the population and is a major factor in the development of hypertension.10 The mechanisms underlying salt-sensitive hypertension remain incompletely understood. Emerging evidence from studies in animal models suggests abnormalities in cellular intermediary metabolism could contribute to the development of salt-sensitive hypertension.11 For example, Dahl salt-sensitive (SS) rats, a widely-used model of human salt-sensitive hypertension, exhibit insufficiencies of fumarase, an enzyme in the tricarboxylic acid (TCA) cycle, which contribute to the development of hypertension in this model.12,13 However, it is not known whether effects of dietary salt intake on blood pressure in humans are associated with broad changes in cellular metabolic intermediaries.
The Dietary Approaches to Stop Hypertension 2 (DASH2 or DASH-Sodium) study was a multicenter, randomized clinical trial carried out in 1997-2002 to examine the effect of dietary sodium intake on blood pressure.14 A total of 412 study participants were randomized in a crossover design to low (targeting 50 mmol/day), intermediate (100 mmol/day), or high (150 mmol/day) sodium intake, each for 30 days in a random order, on a defined dietary background of either a typical US diet or a DASH diet rich in fruits, vegetables, and low-fat dairy. Urine samples were collected during the final 9 days of each intervention feeding period. The study demonstrated significant effects of dietary sodium intake on blood pressure especially for participants on the typical US diet.14
The goal of the present study was to utilize urine samples from the DASH-Sodium trial and a targeted metabolomic approach to identify associations of urinary metabolites with blood pressure phenotypes on low- or high-sodium intake. Significant associations were identified for several metabolites including metabolites previously not known to influence blood pressure. A proof-of-principle experiment performed in SS rats demonstrated a previously unknown effect of one of the identified metabolites on salt-induced hypertension.
Methods
Study participants and samples
The design of the DASH-Sodium trial was described previously.14,15 Briefly, a total of 412 persons with higher than optimal blood pressure or Stage 1 hypertension (SBP, 120-159 mmHg; DBP, 80-95 mmHg) were randomized to a diet that is typical of what many Americans eat (n=204) and a DASH diet rich in fruits, vegetables, and low-fat dairy. Each dietary arm was further randomized in a crossover design so that each participant was fed their respective diet containing low (targeting 50 mmol/day), intermediate (100 mmol/day), or high (150 mmol/day) sodium content, each for 30 days in a random order. Study staff prepared all meals and snacks in research kitchens. Urine and blood samples were collected during the final 9 days of each intervention feeding period.
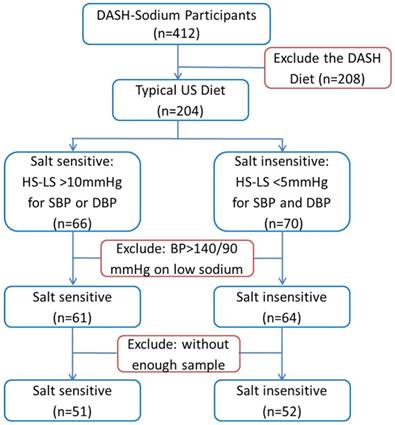
A subset of the participants of the DASH-Sodium trial was selected for the current study as described in Figure 1. We chose to focus on participants who were on the typical US diet because sodium intake had greater effects in this group than in participants on the DASH diet. Moreover, the study would be confounded by metabolite differences resulting directly from the numerous differences between the typical US diet and the DASH diet if participants on both diets were included in our study. Substantial salt-sensitivity was defined, for the purpose of the current study, as systolic or diastolic pressure being at least 10 mmHg higher after 30 days on the high-sodium intake compared to the values after 30 days on the low-sodium intake. Participants whose systolic and diastolic pressures differed by less than 5 mmHg between high- and low-sodium intakes were considered salt-insensitive. Several participants whose blood pressure was greater than 140/90 mmHg on the low-sodium intake or without sufficient urine samples available from the sample repository were excluded from the current study. The small number of participants with low-sodium blood pressure greater than 140/90 mmHg were excluded so that the analysis could focus on participants whose blood pressure levels on the low-sodium intake were relatively homogeneous.16
Selection of participants of the DASH-Sodium trial for metabolomic analysis. HS: high-sodium intake; LS: low-sodium intake; SBP: systolic blood pressure; DBP: diastolic blood pressure.
At the time of urine collection in the DASH-Sodium trial, each 24 h urine sample was mixed to ensure a uniform sample and aliquoted. Two drops of 6 N HCl were added to each 5 mL aliquot of urine, and the samples have been stored at -80°C since then. The samples were thawed once at the Biologic Specimen and Data Repository Information Coordinating Center (BioLINCC) at the National Heart, Lung, and Blood Institute. BioLINCC approved our request to access urine samples from the selected participants. The urine samples were shipped to our laboratory on dry ice and stored at -80°C until analysis.
Targeted liquid chromatography/mass spectrometry (LC/MS) analysis for amino metabolites
Urine samples were spiked with internal standards then deproteinized with cold methanol followed by centrifugation at 10,000 × g for 5 min. The supernatant was immediately derivatized with 6-aminoquinolyl-N-hydroxysuccinimidyl carbamate according to Waters' MassTrak kit. A 10-point calibration standard curve underwent a similar derivatization procedure after the addition of internal standards. Both derivatized standards and samples were analyzed on a triple quadrupole mass spectrometer coupled with an Ultra Pressure Liquid Chromatography system. Data acquisition was done using select ion monitor (SIM). Concentrations of 47 analytes, including 5 neurotransmitters and 42 other amino metabolites, in each sample were calculated against each perspective calibration curve.
Targeted gas chromatography/mass spectrometry (GC/MS) analysis for tricarboxylic acid metabolites
Urine samples were derivatized with ethoxime and then with MtBSTFA + 1% tBDMCS (N-Methyl-N-(t-Butyldimethylsilyl)-Trifluoroacetamide + 1% t-Butyldimethylchlorosilane) before analysis on an Agilent 5975C GC/MS under electron impact and single ion monitoring conditions. Concentrations of lactic acid (m/z 261.2), fumaric acid (m/z 287.1), succinic acid (m/z 289.1), oxaloacetic acid (m/z 346.2), ketoglutaric acid (m/z 360.2), malic acid (m/z 419.3), cis-aconitic acid (m/z459.3), citric acid (m/z 591.4), isocitric acid (m/z 591.4) and glutamic acid (m/z 432.4) were measured against 7-point calibration curves that underwent the same derivatization.
Animal experiment
Experiments were performed in inbred, male Dahl salt-sensitive (SS) rats maintained at Medical College of Wisconsin.12,17 Rats were fed an AIN-76A diet containing 0.4% NaCl since weaning. At about 6 weeks of age, rats were anesthetized with a mixture of ketamine (75 mg/kg IP), xylazine (10 mg/kg IP), and acepromazine (2.5 mg/kg IP), and a telemetry transmitter (model HD-S10, Data Systems International) for measuring arterial blood pressure was implanted in the right carotid artery.18 Antibiotics and analgesics were administered after surgery to control infection and pain. Rats were returned to the home cages with free access to water and chow. Blood pressure was measured from 9 am to 12 pm daily. Starting from the third day after surgery, rats were treated with BAIBA (DL-3-Aminoisobutyric acid, Creative Peptides) in their drinking water at a target dose of 100 mg/kg/day for the remainder of the study.19 Control rats received regular drinking water. Seven days after the initiation of the BAIBA treatment, the rats were switched to an AIN-76A diet containing 4% NaCl. Water intake was recorded daily and BAIBA concentration was adjusted according to the volume consumed and the animal's body weight. The estimated dose of BAIBA was 112 ± 20 mg/kg/day throughout the protocol. The animal experiments were performed in accordance with the recommendations in the Guide for the Care and Use of Laboratory Animals of the National Institutes of Health. The animal protocols were approved by the Institutional Animal Care and Use Committee at the Medical College of Wisconsin (AUA206).
Statistical analysis
Urinary concentrations of the 57 metabolites measured were converted to 24 h urinary excretion for regression analysis. Urinary metabolite/creatinine ratios were also calculated and tested for regression. The results were generally similar to 24 h excretion and are not shown.
Random forest, an ensemble machine learning method,20 was applied to identify associations between urinary metabolites and blood pressure phenotypes including SBP or DBP on the low- or high-sodium intake and predict the classification of study participants as salt-sensitive and salt-insensitive (as defined above). Random forest was used because of its efficiency in variable selection and classification. Prediction of the classification of study participants as salt-sensitive and salt-insensitive was achieved by R package “randomForest”21 with tuned parameters including the minimum node size and the number of variables at each split through R package “Caret”.22 The performance of the classification model was evaluated by out-of-bag (OOB) error and the area under the curve (AUC) for the receiver operating characteristic (ROC) curve. Urinary metabolites associated with blood pressure phenotypes were identified by R package “Boruta”,23 which is a feature selection method paired with random forest and selects features that have discriminating importance scores (Z-scores) greater than random permuted features (shadow matrixes).
For metabolites that were nominated by the random forest analysis, generalized linear mixed model (GLMM) was further performed to generate p values and false discovery rates to correct for testing multiple metabolites using the Benjamini-Hochberg procedure. Since metabolite data typically shows a lognormal distribution, metabolites were first log transformed. The GLMM analysis was then performed with or without the incorporation of demographic factors. Backward stepwise GLMM, followed by the multicollinearity test, was used to identify demographic factors that were associated with blood pressure phenotypes for incorporation into GLMM analysis of metabolites.
For the analysis of metabolite and blood pressure differences between the low- and high-sodium intakes (high sodium values minus low sodium values), random forest analysis suffered from convergence issue. In addition, within-subject correlation was not an issue when differences between the low- and high-sodium intakes were analyzed. Generalized linear model (GLM) was, therefore, used and all measured metabolites were analyzed. The Benjamini-Hochberg procedure was used for controlling false discovery rates in testing multiple metabolites.
Blood pressure data from the animal study were analyzed using 2-way repeated measure ANOVA followed by Holm-Sidak test. P<0.05 was considered significant. The data are presented as mean ± s.e.m.
Results
Demographic and clinical characteristics of the study participants
The process of selecting participants from the DASH-Sodium trial for inclusion in the current metabolomic analysis is described in Figure 1 and in Methods. Of the 51 salt-sensitive participants, 18 were men and 40 were blacks. Average systolic blood pressure (SBP) was 123 ± 8 mmHg on the low-sodium intake and 140 ± 6 mmHg on the high-sodium intake. Average diastolic blood pressure (DBP) was 78 ± 9 mmHg and 87 ± 6 mmHg on the two levels of sodium intake, respectively. The differences between the low- and high-sodium intakes ranged from 10.4 to 31.5 mmHg for SBP and 0.6 to 25.8 mmHg for DBP. The difference was greater than 10 mmHg for SBP, DBP, or both for each of the 51 subjects. Of the 52 salt-insensitive participants, 25 were men and 22 were blacks. The means and standard deviations of their blood pressures were nearly identical between low- and high-sodium intakes (123 ± 7 mmHg and 80 ± 5 mmHg, respectively, for SBP and DBP). The differences between the low- and high-sodium intakes were less than 5 mmHg for both SBP and DBP for all individuals in the salt-insensitive group.
Urinary metabolite levels and their stability
The concentrations of 47 amino metabolites and 10 TCA cycle-related metabolites were measured with LC/MS or GC/MS in urine samples collected from the 103 subjects following nearly 30 days of low- or high-sodium feeding. Complete data of 24 h excretion of the 57 metabolites in the 206 samples are available in Supplemental Material (Supplemental Dataset).
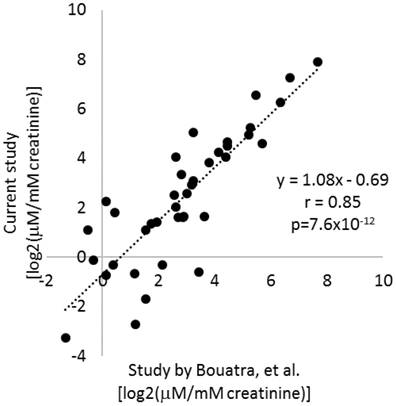
The urine samples analyzed had been stored at -80°C since sample collection in 1997-2002. Several studies have examined human urine samples stored for up to several months and found metabolite profiles to be highly stable if urine samples were frozen at even just -20ºC.24,25,26 To further examine the stability of urinary metabolites, we retrieved the data from a widely recognized study by Bouatra, et al., that analyzed the urine metabolome in normal adults.27 Of the 57 metabolites analyzed in the current study, quantitative data were available for 39 in the study by Bouatra, et al.27 Average levels of the 39 metabolites as measured in the current study were highly correlated with the data reported by Bouatra, et al. (r=0.85, p=7.6×10⁻¹²) (Figure 2). Moreover, the slope of the linear regression line was close to 1 (Figure 2). That was despite several differences in sample handling and analytical techniques between the two studies. In the study by Bouatra, et al., urine samples were treated with sodium azide to a final concentration of 2.5 mM typically within 1 h of collection, centrifuged, aliquoted for storage at -20°C, and centrifuged again prior to analysis. These findings suggest urinary levels of metabolites had been, in general, preserved in the urine samples analyzed in the current study during storage. It would require further investigation to know whether degradation of all metabolites was prevented.
Stability of urinary metabolite levels. Average levels of 39 metabolites measured in the current study in urine samples after >14 years of storage were compared to average levels in normal adults reported in a human urine metabolome study by Bouatra, et al. (ref. 24).
Using urinary metabolites to predict the classification of study participants as salt-sensitive and salt-insensitive
We examined the ability of the 57 metabolites measured in the urine to classify study participants as salt-sensitive and salt-insensitive as defined in Methods. A random forest analysis of 24 h excretion data on low- or high-sodium intake identified several metabolites that classified blood pressure salt-sensitivity better than shadow matrixes (Figure 3). The metabolites were fumarate, alanine, citrate, proline and isocitrate. GLMM analysis of these metabolites, however, did not identify any individual metabolite able to significantly (FDR<0.05) classify blood pressure salt-sensitivity.
Classification of blood pressure salt-sensitivity based on metabolite levels on low- or high-sodium intake. Box plots of discriminating importance scores (Z-scores) from up to 500 regression trees are shown for each metabolite analyzed. ShadowMax was the maximum Z-score calculated from randomly permuted features. Metabolites with average Z-scores greater than average shadownMax are shown in green.
The area under the curve (AUC) for the receiver operating characteristic (ROC) curve was 0.64 ± 0.08 when levels of all metabolites on low- or high-sodium intake were used, indicating a modest ability of the urinary levels of the metabolites analyzed to classify blood pressure salt-sensitivity. Race, age and sex also had a modest ability to classify blood pressure salt-sensitivity (AUC, 0.70 ± 0.01). Adding levels of blood renin, SBP and DBP on the low-sodium diet to race, age and sex did not improve the prediction (AUC, 0.64 ± 0.01). Adding the urinary metabolites to race, age and sex improved the prediction performance (AUC, 0.80 ± 0.01). Adding SBP and DBP on the high-sodium diet, as expected, improved the performance even more (AUC, 0.91 ± 0.01).
Urinary metabolites associated with SBP on low- or high-sodium intake
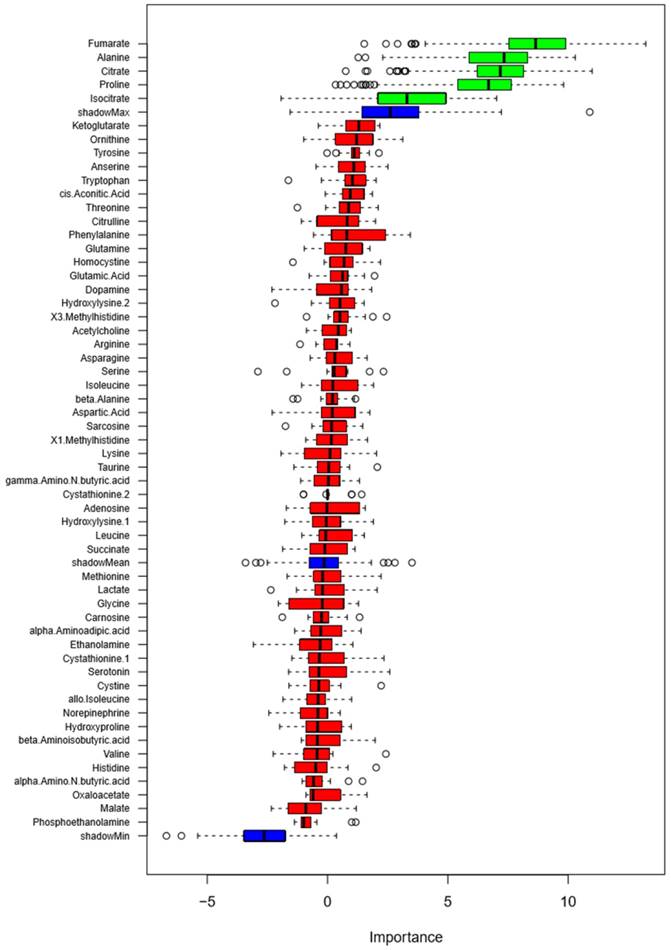
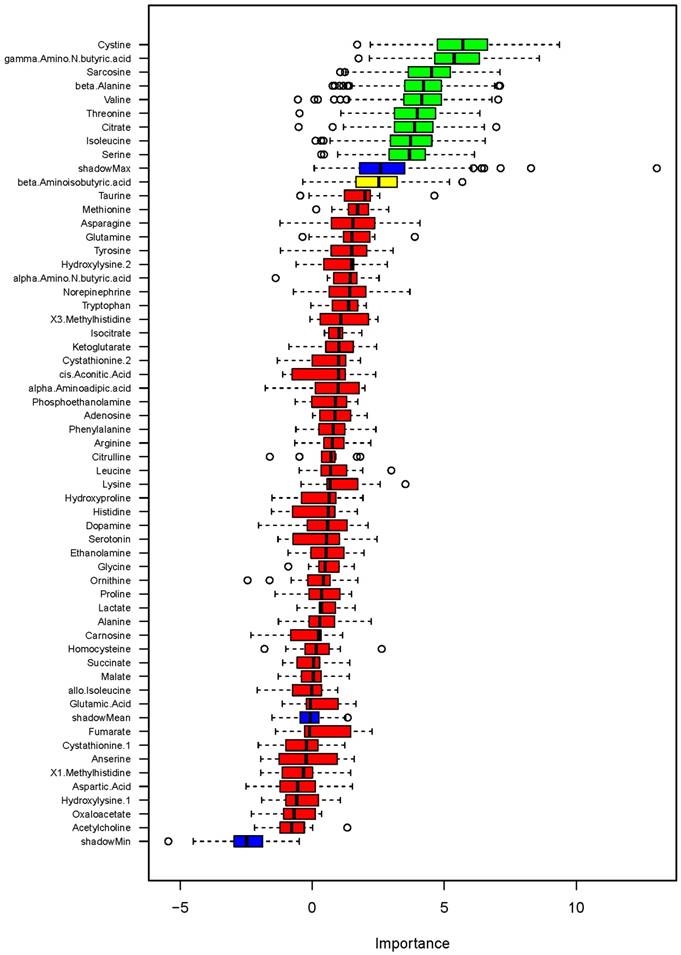
We then examined associations of urinary metabolites with blood pressure as a quantitative variable. A random forest analysis identified several metabolites showing associations with SBP on low- or high-sodium intake at levels greater than shadow matrixes (Figure 4). The identified metabolites were β-aminoisobutyric acid (BAIBA), cystine, citrulline, homocysteine, lysine and cis-aconitic acid. GLMM analysis of the metabolites nominated by the random forest analysis confirmed significant associations with SBP at the level of FDR<0.05 for ΒΑΙΒΑ, cystine, citrulline, homocysteine, and lysine but not cis-aconitic acid (Table 1). The associations were significant regardless of whether demographic factors identified by backward stepwise GLMM analysis, which were race, age and height, were considered. None of the metabolites showed significant association with SBP at the level of FDR<0.05 when differences between low- and high-sodium intakes were analyzed by GLM.
Association of metabolites with systolic blood pressure (SBP) on low- or high-sodium intake based on random forest analysis. Box plots of discriminating importance scores (Z-scores) from up to 500 regression trees are shown for each metabolite analyzed. ShadowMax was the maximum Z-score calculated from randomly permuted features. Metabolites with average Z-scores greater than average shadowMax are shown in green.
Results of generalized linear mixed model (GLMM) analysis of metabolites nominated by random forest analysis as being associated with blood pressure on low- or high-sodium intake.
| α | p | FDR | α | p | FDR | |
|---|---|---|---|---|---|---|
| (adjusted for covariates) | ||||||
| SBP | ||||||
| β-Aminoisobutyric acid | -1.6 | 0.014 | 0.026 | -1.3 | 0.026 | 0.032 |
| Cystine | 1.9 | 0.015 | 0.026 | 1.9 | 0.008 | 0.018 |
| Citrulline | 1.9 | 0.009 | 0.026 | 2.0 | 0.003 | 0.015 |
| Homocysteine | 8.6 | 0.018 | 0.026 | 7.6 | 0.025 | 0.032 |
| Lysine | 1.2 | 0.022 | 0.026 | 1.3 | 0.009 | 0.018 |
| cis-Aconitic Acid | -1.3 | 0.373 | 0.373 | -0.5 | 0.757 | 0.757 |
| DBP | ||||||
| Cystine | 1.3 | 0.004 | 0.032 | 1.3 | 0.005 | 0.048 |
| γ-Amino-N-butyric acid | -1.4 | 0.077 | 0.305 | -1.3 | 0.097 | 0.285 |
| Sarcosine | 1.3 | 0.130 | 0.305 | 1.3 | 0.127 | 0.285 |
| β-Alanine | 0.3 | 0.416 | 0.467 | 0.2 | 0.584 | 0.658 |
| Valine | 0.0 | 0.934 | 0.934 | -0.3 | 0.661 | 0.661 |
| Threonine | 0.6 | 0.200 | 0.359 | 0.5 | 0.235 | 0.423 |
| Citrate | 0.7 | 0.136 | 0.305 | 0.8 | 0.101 | 0.285 |
| Isoleucine | 0.6 | 0.275 | 0.413 | 0.4 | 0.457 | 0.658 |
| Serine | 0.3 | 0.406 | 0.467 | 0.2 | 0.576 | 0.658 |
FDR: false discovery rate (Benjamini-Hochberg); SBP and DBP: systolic and diastolic blood pressure. Adjusted covariates were selected by backward stepwise GLMM analysis and included race, age and height for SBP and sex for DBP.
Urinary metabolites associated with DBP on low- or high-sodium intake
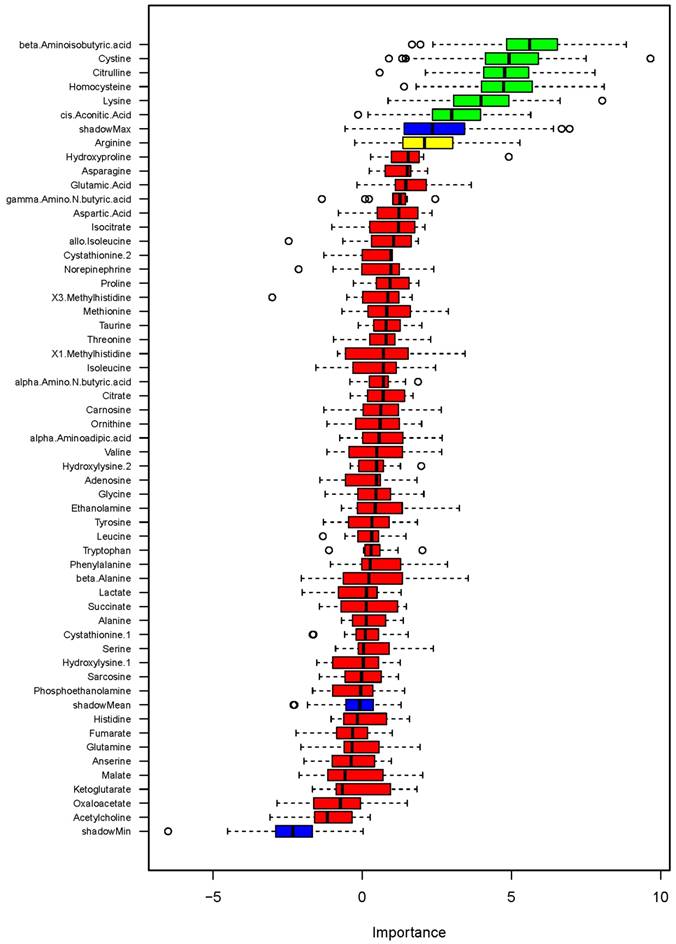
Random forest analysis also identified several metabolites showing associations with DBP on low- or high-sodium intake at levels greater than shadow matrixes (Figure 5). The identified metabolites were cystine, γ-amino-N-butyric acid, sarcosine, β-alanine, valine, threonine, citrate, isoleucine and serine. GLMM analysis of these metabolites confirmed significant associations with DBP at the level of FDR<0.05 for cystine but not the other metabolites (Table 1). The associations between cystine and DBP were significant regardless of whether the demographic factor identified by backward stepwise GLMM analysis, which was sex, was considered.
Association of metabolites with diastolic blood pressure (DBP) on low- or high-sodium intake based on random forest analysis. Box plots of discriminating importance scores (Z-scores) from up to 500 regression trees are shown for each metabolite analyzed. ShadowMax was the maximum Z-score calculated from randomly permuted features. Metabolites with average Z-scores greater than average shadowMax are shown in green.
When metabolite and DBP differences between low- and high-sodium intakes were analyzed by GLM, homocysteine was the only metabolite significantly associated with DBP. The α, p and FDR values for the association between high sodium minus low sodium levels of homocysteine and DBP were 9.9, 0.0009 and 0.050 without incorporation of demographic covariates and 9.7, 0.0006 and 0.035 when the demographic factor identified by backward stepwise GLM, which was race, was incorporated.
A subset of urinary metabolites predict the classification of blood pressure salt-sensitivity
The 57 metabolites measured had a modest ability to predict the classification of blood pressure salt-sensitivity as indicated above. We tested the ability of a subset of the metabolites identified in the regression analysis of SBP or DBP, including BAIBA, homocysteine, citrulline, lysine and cystine, to predict the classification of blood pressure salt-sensitivity. The five metabolites performed as well as all 57 metabolites in the prediction (AUC of ROC, 0.63 ± 0.08). In addition, the five metabolites improved the prediction based on race, age and sex (AUC, 0.77 ± 0.01).
BAIBA attenuates salt-induced increases of blood pressure in SS rats
BAIBA was negatively associated with SBP (see Figure 4 and Table 1). The association between BAIBA and DBP was just below the maximum shadow matrix (see Figure 5). The negative association was observed in all subgroups of data divided based on levels of blood pressure salt-sensitivity or sodium intake, except DBP in the salt-insensitive group (Figure 6A-D).
Inverse correlation between urinary levels of β-aminoisobutyric acid (BAIBA) and blood pressure. Correlations between levels of 24 h urinary excretion of BAIBA and systolic or diastolic blood pressure (SBP and DBP) in subgroups of participants were plotted. A. Correlation with SBP of salt-sensitive or salt-insensitive participants. High and low refer to high- and low-sodium diet. B. Correlation with SBP on high- or low-sodium intake. C. Correlation with DBP of salt-sensitive or salt-insensitive participants. D. Correlation with DBP on high- or low-sodium intake. The correlation with SBP in all participants was significant at FDR<0.05, with or with adjustment for race, age and height based on a GLMM analysis (see Table 1). In addition, urinary levels of BAIBA on the low-sodium intake were compared between the 103 subjects used in the metabolomic analysis (BP on low-sodium <140/90 mmHg) and 9 subjects excluded from the metabolomic analysis because their low-sodium BP was >140/90 mmHg (see Figure 1). E. Urinary BAIBA/creatinine ratios. *, p<0.05. F. 24 h urinary excretion of BAIBA. p=0.16.
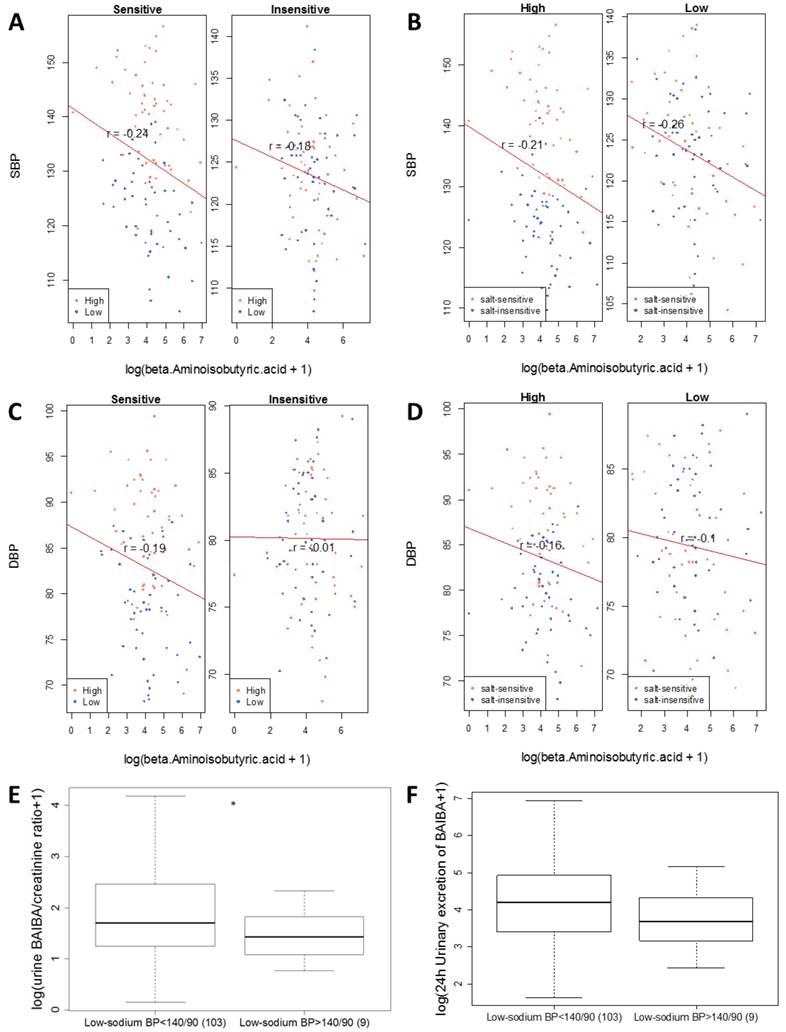
Eleven subjects were excluded from the current metabolomic analysis because their low-sodium SBP or DBP was greater than 140 and 90 mmHg, respectively (Figure 1). Urine samples were available for 9 of these 11 subjects. SBP and DBP of these 9 subjects on the low-sodium intake were significantly (p<0.05) higher, while urinary levels of BAIBA were lower, than the 103 subjects included in the metabolomic analysis (Figure 6E, F). These findings further supported the presence of an inverse relationship between BAIBA and blood pressure. The 9 subjects included 5 salt-sensitive subjects and 4 salt-insensitive subjects. However, the sample size was too small for subgroup analysis within the 9 subjects.
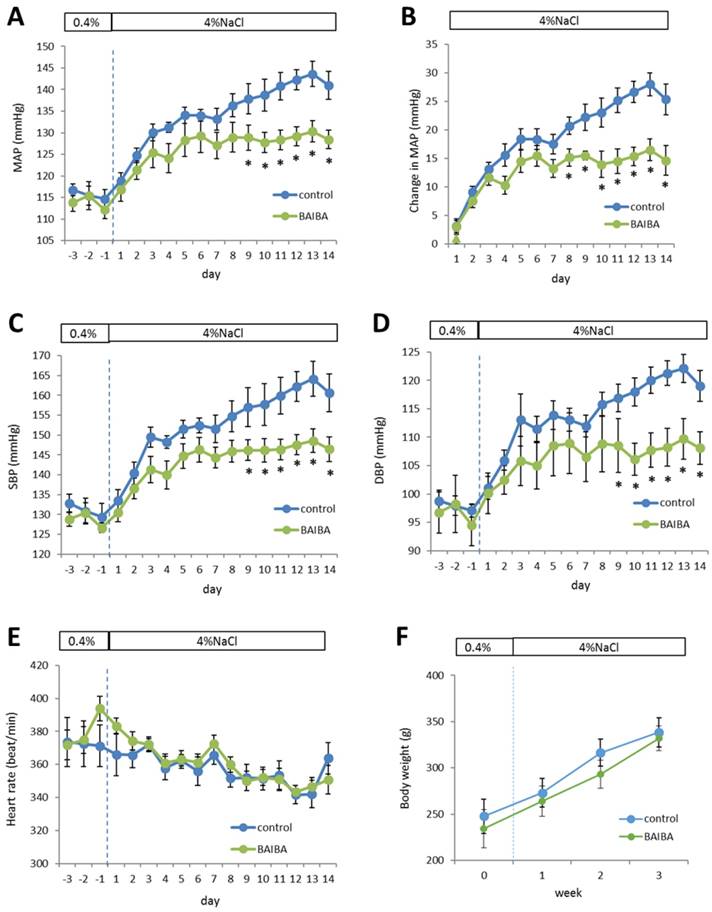
The effect of BAIBA on blood pressure was unknown. We performed a proof-of-principle experiment to test the hypothesis that BAIBA could attenuate salt-induced increases of blood pressure in SS rats. SS rats are a commonly used model of human salt-sensitive hypertension.10 Treatment with BAIBA in the drinking water at an estimated dose of 112 ± 20 mg/kg/day indeed attenuated the high salt diet-induced increase of blood pressure. The initial increases of mean arterial pressure (MAP) in the first few days after the initiation of a high-salt diet appeared similar between the vehicle control and BAIBA-treated groups (Figure 7A, B). MAP continued to increase after the first week on the high-salt diet, which is typical of SS rats. However, this further increase of MAP was abolished in BAIBA-treated SS rats (Figure 7A, B). Changes in systolic and diastolic blood pressure followed a similar pattern (Figure 7C, D). Heart rate was not significantly different between the two groups (Figure 7E). Long-term (>10 weeks) treatment with BAIBA at a similar dose reduced body weight in mice.19 Body weight was not different between the two groups of SS rats over the three weeks of treatment (Figure 7F).
DL-3-Aminoisobutyric acid (BAIBA) attenuates high-salt-induced increases of blood pressure in Dahl SS rats. SS rats were treated with BAIBA in drinking water at 112 ± 20 mg/kg/day starting 7 days before the rats were switched from a 0.4% NaCl diet to a 4% NaCl diet. A. Mean arterial blood pressure (MAP). B. Changes of MAP on the 4% NaCl diet compared to the 0.4% NaCl diet. C. Systolic blood pressure (SBP). D. Diastolic blood pressure (DBP). E. Heart rate. F. Body weight. n=9; *, p<0.05 vs. vehicle control, 2-way repeated measure ANOVA followed by Holm-Sidak test.
Discussion
We have identified significant associations of urinary levels of several metabolites, notably BAIBA and homocysteine, with blood pressure phenotypes on low- or high-sodium intake in a subset of the participants of the DASH-Sodium trial. The association suggests metabolites such as BAIBA and homocysteine might influence, or be influenced by, sodium-dependent or -independent BP variations. Metabolite levels in body fluids can be influenced directly by dietary components, independent of cellular regulatory mechanisms. Non-sodium components of a diet can also influence blood pressure salt-sensitivity.28 In this regard, an advantage of studying the subset of DASH-Sodium participants selected for analysis in the present study is that non-sodium dietary effects were largely controlled for since sodium intake was the only difference between the foods prepared and provided to the participants.
BAIBA is a catabolic product of valine and thymine. Urine contains primarily the R-enantiomer of BAIBA, which is derived from thymine. BAIBA has been shown to attenuate obesity and may be released from exercised muscles and contribute to the beneficial metabolic effects of exercise.19,29 Genetic variance at rs37369 in AGXT2, which encodes alanine-glyoxylate aminotransferase 2, was identified as the genetic basis of hyper-β-aminoisobutyric aciduria.30 BAIBA is inversely associated with cardiometabolic risk factors.19 Similarly, we found an inverse correlation between BAIBA and blood pressure on low- or high-sodium intake. We further showed BAIBA attenuated salt-induced increases of blood pressure in SS rats, a commonly used animal model of human salt-sensitive hypertension. These findings suggest a novel role of BAIBA in the regulation of salt-dependent changes in blood pressure in both human and rat.
While the inverse association of BAIBA with SBP reached statistical significance, BAIBA also appears to have an inverse association with DBP that is just below the maximum shadow matrix. These human data, together with the findings from the Dahl rats, suggest BAIBA might influence both SBP and DBP, although the relationship between BAIBA and DBP in humans may need to be examined with a larger sample size.
The mechanism by which BAIBA attenuates salt-induced hypertension should be investigated in future studies. BAIBA enhances several metabolic activities in fat and liver via mechanisms involving peroxisome proliferator-activated receptor α.19 Metabolic deficiencies exist in SS rats and appear to contribute to salt-induced hypertension.11-13,31,32 It remains to be determined whether the effect of BAIBA on salt-induced hypertension is mediated by metabolic or other effects of BAIBA.
Homocysteine is synthesized from methionine and an adenosine group from ATP via several steps including a reaction catalyzed by S-adenosyl-methionine synthetase. A methyl group is released and can be used for several processes relevant to hypertension, including DNA methylation.33 Homocysteine can be converted back to methionine or to cysteine. Hyperhomocysteinemia is associated with vascular injury and cardiovascular diseases including hypertension.34-36 The functional role of homocysteine in cardiovascular diseases including its role in the effect of dietary sodium intake on blood pressure, however, is less clear. In the present study, homocysteine was the only metabolite showing a significant association with differences in blood pressure, specifically DBP, between low- and high-sodium intakes, which suggests homocysteine might have a particularly important relationship with changes in sodium intake that warrants further investigation.
Several other metabolites that showed associations with the blood pressure phenotypes are known to be important in blood pressure regulation. Examples include fumarate and citrulline. Fumarate is the top metabolite nominated by random forest analysis as being associated with the classification of blood pressure salt-sensitivity in the present study, although the association did not reach statistical significance in the subsequent GLMM analysis. Fumarate is increased in SS rats probably because of insufficiencies in fumarase, the enzyme converting fumarate to L-malate in the TCA cycle.12,13 Intravenous infusion of a fumarate precursor exacerbates salt-induced increases of blood pressure in rats, while transgenic overexpression of fumarase attenuates hypertension in SS rats.13,37 Malate attenuates hypertension in SS rats via a novel malate-aspartate-arginine-NO pathway that we recently discovered.32 Citrulline is produced when arginine is used by nitric oxide synthases to generate nitric oxide, a potent regulator of blood pressure. Citrulline can, in turn, be used to re-generate arginine. In fact, the association between arginine and SBP was just below the maximum association of shadow matrix in the present study.
For the identified metabolites without a known mechanistic role in blood pressure regulation, specific interventional experiments would be necessary to examine if they are mechanistic modulators or just biomarkers of blood pressure or blood pressure salt-sensitivity. It is important to recognize that while urinary levels of metabolites can be influenced by cellular metabolism in the kidneys, they can also be influenced by metabolism in other organs or renal reabsorption or secretion of the metabolites. One should be cautious in extrapolating differences in urinary metabolite levels to changes in cellular metabolism in a specific organ when designing any follow-up mechanistic experiments.
Analysis of larger cohorts would be important for firmly establishing the association between any of the metabolites identified in the present study with blood pressure response to dietary salt intake. It is, however, challenging to test the findings of the present study in separate cohorts because of the cost and logistic difficulties in implementing the type of multiple-week sodium diet feeding protocols used in the DASH-Sodium trial. On the other hand, even the 30-day intervention periods used in the DASH-Sodium trial were short, and one should be cautious in extrapolating our findings to the general population.
In summary, the present study was one of the first to examine metabolomic changes associated with the effect of dietary salt intake on blood pressure in human. The findings support the presence of potential new mechanisms of blood pressure regulation involving metabolic intermediaries. The identified metabolites could be further developed as diagnostic markers or therapeutic targets for salt-sensitive hypertension.
Supplementary Material
Supplemental Dataset: Complete data from targeted metabolomic analysis of urine samples from DASH-Sodium Trial.
Abbreviations
DASH-Sodium trial: Dietary Approaches to Stop Hypertension-Sodium trial; EPIC-Potsdam Study: European Prospective Investigation Into Cancer and Nutrition-Potsdam Study; SS: salt-sensitive; TCA: tricarboxylic acid; SBP: systolic blood pressure; DBP: diastolic blood pressure; BioLINCC: Biologic Specimen and Data Repository Information Coordinating Center; LC/MS: liquid chromatogramphy/mass spectrometry; SIM: select ion monitor; GC/MS: gas chromatography/mass spectrometry; MtBSTFA: N-Methyl-N-(t-Butyldimethylsilyl)-Trifluoroacetamide; tBDMCS: t-Butyldimethylchlorosilane; OOB: out-of-bag; AUC: area under the curve; ROC: receiver operating characteristic; GLMM: generalized linear mixed model; GLM: Generalized linear model; BAIBA: β-aminoisobutyric acid; MAP: mean arterial pressure; BP: blood pressure.
Acknowledgements
This work was supported by US National Institutes of Health grant HL116264, U24DK100469 and UL1 TR000135, the National Science Foundation of China grants No. 81400717, 81270767 and 81570655, and the American Heart Association (15SFRN23910002).
Author contributions
ML conceived the study. ML, HS, ZT and YH designed and developed the study. YC, HS, EH, IRL and KU obtained, processed and analyzed the human samples. HX performed the animal experiment. YC, XP, YW, TW, PL, YL and PWL analyzed the data.
Competing Interests
The authors have declared that no competing interest exists.
References
1. Lim SS, Vos T, Flaxman AD. et al. A comparative risk assessment of burden of disease and injury attributable to 67 risk factors and risk clusters in 21 regions, 1990-2010: a systematic analysis for the Global Burden of Disease Study 2010. Lancet. 2012;380:2224-2260
2. Forouzanfar MH, Afshin A, Alexander LT. et al. Global, regional, and national comparative risk assessment of 79 behavioural, environmental and occupational, and metabolic risks, 1990-2015: a systematic analysis for the Global Burden of Disease Study 2015. Lancet. 2016;388:1659-1724
3. Menni C, Graham D, Kastenmüller G. et al. Metabolomic identification of a novel pathway of blood pressure regulation involving hexadecanedioate. Hypertension. 2015;66:422-429
4. Wang L, Hou E, Wang L. et al. Reconstruction and analysis of correlation networks based on GC-MS metabolomics data for young hypertensive men. Anal Chim Acta. 2015;854:95-105
5. Dietrich S, Floegel A, Weikert C. et al. Identification of Serum Metabolites Associated With Incident Hypertension in the European Prospective Investigation into Cancer and Nutrition-Potsdam Study. Hypertension. 2016;68:471-477
6. Wilson FH, Hariri A, Farhi A. et al. A cluster of metabolic defects caused by mutation in a mitochondrial tRNA. Science. 2004;306:1190-1194
7. Wang S, Li R, Fettermann A. et al. Maternally inherited essential hypertension is associated with the novel 4263A>G mutation in the mitochondrial tRNAIle gene in a large Han Chinese family. Circ Res. 2011;108:862-870
8. He W, Miao FJ, Lin DC. et al. Citric acid cycle intermediates as ligands for orphan G-protein-coupled receptors. Nature. 2004;429:188-193
9. Lee H, Abe Y, Lee I. et al. Increased mitochondrial activity in renal proximal tubule cells from young spontaneously hypertensive rats. Kidney Int. 2014;85:561-569
10. Kotchen TA, Cowley AW Jr, Frohlich ED. Salt in health and disease-a delicate balance. N Engl J Med. 2013;368:1229-1237
11. Liang M. Hypertension as a mitochondrial and metabolic disease. Kidney Int. 2011;80:15-16
12. Tian Z, Greene AS, Usa K. et al. Renal regional proteomes in young Dahl salt-sensitive rats. Hypertension. 2008;51:899-904
13. Tian Z, Liu Y, Usa K. et al. Novel role of fumarate metabolism in dahl-salt sensitive hypertension. Hypertension. 2009;54:255-260
14. Sacks FM, Svetkey LP, Vollmer WM, et al; DASH-Sodium Collaborative Research Group. Effects on blood pressure of reduced dietary sodium and the Dietary Approaches to Stop Hypertension (DASH) diet. DASH-Sodium Collaborative Research Group. N Engl J Med. 2001;344:3-10
15. Svetkey LP, Sacks FM, Obarzanek E. et al. The DASH Diet, Sodium Intake and Blood Pressure Trial (DASH-sodium): rationale and design. DASH-Sodium Collaborative Research Group. J Am Diet Assoc. 1999;99:S96-104
16. Montasser ME, Douglas JA, Roy-Gagnon MH. et al. Determinants of blood pressure response to low-salt intake in a health adult population. J Clin Hypertens. 2011;13:795-800
17. Liu Y, Singh RJ, Usa K. et al. Renal medullary 11 beta-hydroxysteroid dehydrogenase type 1 in Dahl salt-sensitive hypertension. Physiol Genomics. 2008;36:52-58
18. Kriegel AJ, Baker MA, Liu Y. et al. Endogenous microRNAs in human microvascular endothelial cells regulate mRNAs encoded by hypertension-related genes. Hypertension. 2015;66:793-739
19. Roberts LD, Boström P, O'Sullivan JF. et al. β-Aminoisobutyric acid induces browning of white fat and hepatic β-oxidation and is inversely correlated with cardiometabolic risk factors. Cell Metab. 2014;19:96-108
20. Breiman L. Random forests. Machine Learning. 2001;45:5-32
21. Liaw A, Wiener W. Classification and Regression by randomForest. R News. 2002;2:18-22
22. Kuhn M. Caret package. J Stat Softw. 2008;28:1-26
23. Kursa MB, Rudnicki WR. Feature selection with the Boruta package. J Stat Softw. 2010;36:1-13
24. Lauridsen M, Hansen SH, Jaroszewski JW, Cornett C. Human urine as test material in 1H NMR-based metabonomics: recommendations for sample preparation and storage. Anal Chem. 2007;79:1181-6
25. Gika HG, Theodoridis GA, Wilson ID. Liquid chromatography and ultra-performance liquid chromatography-mass spectrometry fingerprinting of human urine: sample stability under different handling and storage conditions for metabonomics studies. J Chromatogr A. 2008;1189:314-22
26. Laparre J, Kaabia Z, Mooney M. et al. Impact of storage conditions on the urinary metabolomics fingerprint. Anal Chim Acta. 2017;951:99-107
27. Bouatra S, Aziat F, Mandal R. et al. The human urine metabolome. PLoS One. 2013;8:e73076
28. Geurts AM, Mattson DL, Liu P. et al. Maternal diet during gestation and lactation modifies the severity of salt-induced hypertension and renal injury in Dahl salt-sensitive rats. Hypertension. 2015;65:447-455
29. Begriche K, Massart J, Abbey-Toby A. et al. Beta-aminoisobutyric acid prevents diet-induced obesity in mice with partial leptin deficiency. Obesity (Silver Spring). 2008;16:2053-2067
30. Suhre K, Wallaschofski H, Raffler J. et al. A genome-wide association study of metabolic traits in human urine. Nat Genet. 2011;43:565-569
31. Wang L, Hou E, Wang Z. et al. Analysis of metabolites in plasma reveals distinct metabolic features between Dahl salt-sensitive rats and consomic SS.13 (BN) rats. Biochem Biophys Res Commun. 2014:18 450: 863-869
32. Hou E, Sun N, Zhang F. et al. Malate and Aspartate Increase L-Arginine and Nitric Oxide and Attenuate Hypertension. Cell Rep. 2017;19:1631-1639
33. Kotchen TA, Cowley AW Jr, Liang M. Ushering Hypertension Into a New Era of Precision Medicine. JAMA. 2016;315:343-344
34. Clarke R, Daly L, Robinson K. et al. Hyperhomocysteinemia: an independent risk factor for vascular disease. N Engl J Med. 1991;324:1149-1155
35. Boushey CJ, Beresford SA, Omen GS, Motulsky AG. A quantitative assessment of plasma homocysteine as a risk factor for vascular disease. Probable benefits of increasing folic acid intakes. JAMA. 1995;274:1049-1057
36. Sutton-Tyrrell K, Bostom A, Selhub J, Zeigler-Johnson C. High homocysteine levels are independently related to isolated systolic hypertension in older adults. Circulation. 1997;96:1745-1749
37. Usa K, Liu Y, Geurts AM. et al. Elevation of fumarase attenuates hypertension and can result from a nonsynonymous sequence variation or increased expression depending on rat strain. Physiol Genomics. 2017;49:496-504
Author contact
![]() Corresponding author: Mingyu Liang, Email: mliangedu, Phone: 1-414-955-8539 or Yongcheng He, Email: heyongchengcom.cn, Phone: 86-755-83366388
Corresponding author: Mingyu Liang, Email: mliangedu, Phone: 1-414-955-8539 or Yongcheng He, Email: heyongchengcom.cn, Phone: 86-755-83366388