Impact Factor
- Issue 14; 2026
- Issue 13; 2026
- Issue 12; 2026
- Issue 11; 2026
- Issue 10; 2026
- Volume 16; 2026
- Advance Articles
- Past Issues
- Cover Images
- Cover Suggestion
- Index & Coverage
- Special Issues
Introduction
Results and Discussion
Conclusion
Abbreviations
Acknowledgements
Supplementary Material
References
International Journal of Biological Sciences
International Journal of Medical Sciences
 Global reach, higher impact

Theranostics 2018; 8(5):1411-1420. doi:10.7150/thno.22252 This issue Cite
Research Paper
Naphthalene-based fluorescent probes for glutathione and their applications in living cells and patients with sepsis
Jun Li1,†, Younghee Kwon2,†, Kyung Soo Chung3,†, Chang Su Lim5,†, Dayoung Lee1, Yongkang Yue4, Jisoo Yoon1, Gyoungmi Kim1, Sang-Jip Nam1, Youn Wook Chung2, Hwan Myung Kim5, ![]() , Caixia Yin4,
, Caixia Yin4, ![]() , Ji-Hwan Ryu2,
, Ji-Hwan Ryu2, ![]() , Juyoung Yoon1,
, Juyoung Yoon1, ![]()
1. Department of Chemistry and Nano Science, Ewha Womans University, Seoul 120-750, Korea
2. Severance Biomedical Science Institute, Brain Korea 21 PLUS Project for Medical Science, Yonsei University College of Medicine, Seoul 120-752, Korea.
3. Division of Pulmonology, Department of Internal Medicine, Institute of Chest Disease, Severance Hospital, Yonsei University College of Medicine, Seoul 120-752, Korea.
4. Key Laboratory of Chemical Biology and Molecular Engineering of Ministry of Education, Key Laboratory of Materials for Energy Conversion and Storage of Shanxi Province, Institute of Molecular Science, Shanxi University, Taiyuan 030-006, China.
5. Department of Chemistry and Energy Systems Research, Ajou University, 443-749, Suwon, Korea.
† These authors contributed equally to this work
Received 2017-8-6; Accepted 2017-11-14; Published 2018-2-3
Abstract

Rationale: Among the biothiols-related diseases, sepsis is defined as life-threatening organ dysfunction caused by a dysregulated host response to infection and can result in severe oxidative stress and damage to multiple organs. In this study, we aimed to develop a fluorescence chemosensor that can both detect GSH and further predict sepsis.
Methods: In this study, two new naphthalene dialdehyde compounds containing different functional groups were synthesized, and the sensing abilities of these compounds towards biothiols and its applications for prediction of sepsis were investigated.
Results: Our study revealed that the newly developed probe 6-methoxynaphthalene-2, 3-dicarbaldehyde (MNDA) has two-photon is capable of detecting GSH in live cells with two-photon microscopy (TPM) under the excitation at a wavelength of 900 nm. Furthermore, two GSH detection probes naphthalene-2,3-dicarboxaldehyde (NDA) and 6-fluoronaphthalene-2,3-dicarbaldehyde (FNDA) not only can detect GSH in living cells, but also showed clinical significance for the diagnosis and prediction of mortality in patients with sepsis.
Conclusions: These results open up a promising direction for further medical diagnostic techniques.
Keywords: fluorescence probe, GSH, Sepsis, cell imaging, diagnosis
Introduction
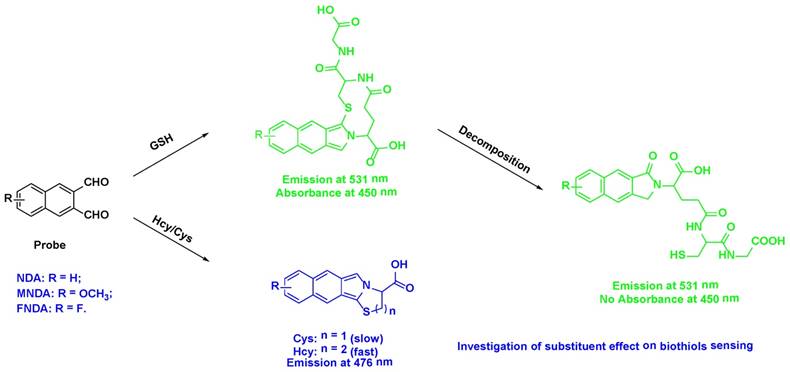
Biothiols, including glutathione (GSH), cysteine (Cys) and homocysteine (Hcy), play important roles in biological systems and physiological processes. Abnormal levels of GSH are associated with many diseases, such as sepsis, liver damage, cancer, AIDS, osteoporosis, and Alzheimer's, heart, inflammatory bowel, and cardiovascular diseases.[1-5] Cys deficiency is involved in many syndromes, including slow growth in children, hair depigmentation, oedema, lethargy, liver damage, loss of muscle and fat, skin lesions, and weakness.[6] A high level of Hcy in the blood (hyperhomocysteinaemia) makes a person more prone to endothelial cell injury, which leads to inflammation in the blood vessels and results in ischaemic injury.[7] Therefore, the detection of biothiol levels in the human biological system may help in the diagnosis of related diseases. Among the biothiols-related diseases, sepsis is defined as life-threatening organ dysfunction caused by a dysregulated host response to infection [8, 9] and can result in severe oxidative stress and damage to multiple organs. Patients with sepsis have low plasma GSH peroxidase activity and low GSH levels.[10-12] Although redox therapy in sepsis has rarely been successful in human clinical trials[13], the measurement of GSH levels has clinical significance. Recently, fluorescent probes have been regarded as powerful tools for molecular recognition and imaging. Over the past decade, substantial effort has been devoted to develop a highly selective and sensitive fluorescent probe for GSH detection that exhibits good performance in live cell and tissue imaging.[14-39] Very recently, Wang's group developed a series of GSH reversible probes for real-time imaging of intracellular GSH.[40-43] Despite the great progress in biothiols detection, a fluorescence chemosensor that can both detect GSH and further predict sepsis has not yet been developed. Naphthalene-2, 3-dicarboxaldehyde (NDA) was reported as a fluorescent probe for GSH detection over 20 years ago[44]; however, the sensing mechanism for three biothiols has not been fully confirmed due to the complicated structure of the product that has never been isolated. We envisioned that GSH and Hcy/Cys react with an o-dialdehyde group in different modes, which would exhibit different fluorescence signal responses; by introducing different functional groups on a naphthalene ring (i.e., -H, -OCH3 and -F), the probes may display different sensing abilities towards biothiols. In this paper, we successfully isolated the reaction product of NDA with GSH and further confirmed its structure by NMR and HPLC-Mass. In addition, we firstly found that the newly developed probe MNDA (6-methoxynaphthalene-2, 3-dicarbaldehyde) having an electron-donating group is capable of detecting GSH in live cells with TPM. Last but not least, we revealed that two GSH detection probes (NDA and FNDA) showed clinical significance for the diagnosis and prediction of mortality in patients with sepsis.
Results and Discussion
Synthesis of NDA derivatives
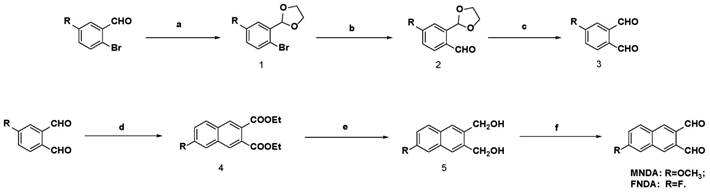
The synthetic methods are detailed in Scheme 1 and Supplementary Material. We successfully obtained the new target compounds MNDA and FNDA by using substituted benzaldehyde as the starting material. Substituted benzaldehyde was subjected to bromination, protection with an aldehyde group by using ethylene glycol to create dioxolane derivatives, the introduction of a new aldehyde group by using n-butyllithium/N, N-dimethylformamide (DMF) as reactants, and de-protection to obtain the key intermediate, a substituted phthalaldehyde. Then, we devised an iterative strategy to construct substituent naphthalene dialdehyde compounds via tandem Wittig olefination and intra-molecular Knoevenagel condensation according to a previous reference [45]. All of the target probes were confirmed via 1HNMR, 13CNMR and HRMS.
Synthetic route of NDA derivatives. Reagents and conditions: (a) ethylene glycol, p-toluenesulfonic acid, toluene, reflux; (b) n-BuLi/DMF, THF, -78 oC, N2; (c) FeCl3.6H2O, acetone or 10% HCl, r.t; (d) PEt3, dimethylmaleate, DBU, CH2Cl2; (e) diisobutylaluminium hydride solution, -50 oC; (f) DMSO, (COCl)2, -78 oC, N2.
UV and fluorescence properties of GSH probes
After obtaining the above probes, we investigated the sensing abilities of the probes for biothiols. NDA, MNDA and FNDA were employed to detect amino acids containing thiol groups. Ultraviolet/visible (UV/Vis) absorption spectroscopy revealed that the addition of 100 µM GSH to the probes (10 µM) in 4-(2-hydroxyethyl)-1-piperazineethanesulfonic acid (HEPES) buffer increased the absorbance at ~450 nm, whereas other amino acids containing thiol groups did not lead to obvious changes at the same wavelength. These changes indicated that NDA, MNDA and FNDA could detect GSH with high selectivity. For Hcy, only MNDA led to a distinct absorbance change at ~315 nm and ~350 nm, suggesting that this probe can also sense Hcy. For Cys, no obvious change was observed using these three probes (Figures S1-S3).
Further assessment of the fluorescence responses of NDA (ɸ = 0.0032, Figure S4), MNDA (ɸ = 0.0035, Figure 2a-b) and FNDA (ɸ = 0.0036, Figure S4) to GSH was conducted with excitation at 450 nm. After the addition of 100 µM GSH to the probes (10 µM) in HEPES buffer, fluorescence enhancement was observed at an emission wavelength of 531 nm (ɸNDA+GSH = 0.32, ɸMNDA+GSH = 0.28, ɸFNDA+GSH = 0.13), whereas other amino acids (including Hcy, Cys, Ala, DTT, Gln, Gly, His, Lys, Met, Pha and Ser) caused no increase in the fluorescence at the same excitation wavelength. Considering the existence of reactive oxygen species (ROS) in the cell and serum, we further checked the probes' responses to ROS including 10 equivalences of H2O2, ONOO- and OCl-. The results indicate that those ROS cannot cause any fluorescence increase after reaction with NDA (Figure S22a), MNDA (Figure S22b) or FNDA (Figure S22c). A time-dependence study showed that the fluorescence intensity at 531 nm approached a maximum within 30 min (Figure S5). The pseudo-first-order rate constant (kobs) of the reaction between the probes and GSH were calculated as 1.4 × 10⁻³ s-1 (NDA), 1.6 × 10⁻³ s-1 (MNDA), and 1.5 × 10⁻³ s-1 (FNDA), respectively. Subsequently, a concentration titration was performed via the addition of increasing concentrations of GSH, and the fluorescence intensity gradually increased at 531 nm. The intensity reached a maximum after the addition of 100 µM GSH. For NDA, a standard curve with a good linear relationship was obtained (Figure S6a), and the detection limit was calculated to be 6.4 ×10⁻⁸ M. For MNDA, the detection limit was 6.8 ×10⁻⁸ M (Figure S6b), and for FNDA the limit was 1.3 ×10⁻⁷ M (Figure S6c; CDL = 3 Sb/k).
Simultaneous sensing of biothiols based on reactions with dialdehyde
(a) Fluorescence responses of the newly developed probe MNDA (10 µM) to various amino acids in the green channel (including GSH, Hcy, Cys, Ala, DTT, Gln, Gly, His, Lys, Met, Pha and Ser, 100 µM each; excitation: 450 nm, slit widths: 3 nm, 3 nm). (b) Gradient titrations of MNDA with GSH in HEPES buffer solution. (c) Fluorescence responses of MNDA (10 µM) to various amino acids in the blue channel (including GSH, Hcy, Cys, Ala, DTT, Gln, Gly, His, Lys, Met, Pha and Ser, 100 µM each; excitation: 350 nm, slit widths: 1.5 nm, 3 nm); (d) Comparison of the sensing abilities of probes toward Hcy (excitation: 350 nm, slit widths: 1.5 nm, 3 nm).
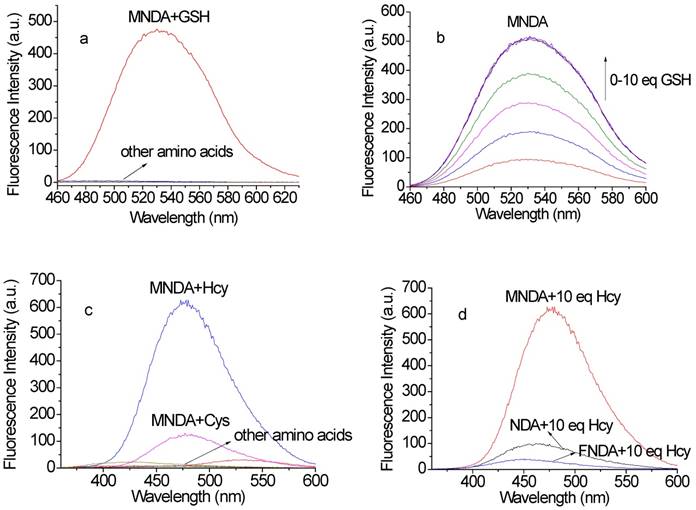
The sensing abilities of these three probes for Hcy and Cys were also investigated (Figure 2c). We found that only MNDA (ɸ=0.014, 10 µM) led to obvious fluorescence enhancement after the addition of 100 µM Hcy (excitation at 350 nm) in HEPES buffer (ɸMNDA+Hcy=0.39, Figure S7a). Thus, the presence of an electron-donating group on the naphthalene ring compared to an electron-withdrawing group increases the sensitivity for Hcy. Other amino acids (including GSH, Cys, Ala, DTT, Gln, Gly, His, Lys, Met, Pha and Ser) did not lead to an obvious increase in the fluorescence at the same excitation wavelength. The time dependence of 100 µM Hcy with 10 µM MNDA in HEPES buffer was also recorded, and the fluorescence intensity approached a maximum within 30 min (Figure S7b). The pseudo-first-order rate constant (kobs) of the reaction between probe MNDA and Hcy was calculated as 1.8 × 10⁻³ s-1. For MNDA, a standard curve of Hcy with a good linear relationship in the 0-10 µM range was obtained (Figure S6d), and the detection limit was determined to be 6.3 ×10⁻⁸ M (CDL = 3 Sb/m). Cys also can lead to fluorescence enhancement in the same signal channel as Hcy; however, the kinetic study indicated that the reaction rate of Cys with MNDA is much slower (kobs= 4.6 S-1). For NDA and FNDA, little fluorescence enhancement was observed after addition of Hcy (Figure 2d). Because Hcy and GSH co-exist in cells, we further performed an experiment reacting MNDA with 100 μM Hcy in the presence of 2 mM GSH (see Figure S23a: the fluorescence intensity saturated at 1 mM GSH and decreased from 2 mM GSH). For the quantification of GSH, the GSH concentration is better no more than 2 mM. When excited at 450 nm, the fluorescence intensity was stable at maximum in the green channel, but when excited at 350 nm, decreased intensity was observed in the blue channel (Figure S23b). Additionally, all three probes showed good stability over pH 3 to 10: for NDA, the fluorescence intensity reached the maximum after addition of 10 equivalences GSH in pH 10, while for the newly developed GSH probes MNDA and FNDA, the maximum fluorescence intensity was stable in the range pH 7-10 after addition of 10 equivalences GSH (Figure S18).
Sensing mechanism of NDA and its derivatives
The reactions of GSH with the three probes mentioned above were monitored by liquid chromatography-mass spectrometry (LC-MS) (Figure S8). We found that the fluorescent derivatives suffer from on-column decomposition or rapid hydrolysis in the relatively aqueous buffer or the mobile phase in HPLC (Figure S12). The mass spectra (Figure S8) showed peaks at m/z of 473.0 (NDA+GSH), 502.9 (MNDA+GSH), and 492.0 (FNDA+GSH). Furthermore, we successfully isolated the product of the reaction of GSH with NDA, and its structure was confirmed by 1D and 2D nuclear magnetic resonance (NMR) (Figure S9). The 1H NMR spectra displayed six aromatic protons [H 8.37, 8.16, 8.12, 8.06, 7.65, and 7.59] and downfield protons [H 4.84, 4.64, 4.42, and 3.72]. Analysing the 2D NMR spectroscopic data, including those collected via correlation spectroscopy (COSY), heteronuclear single quantum coherence (HSQC), and heteronuclear multiple bond correlation (HMBC), indicated the presence of naphthalene [C-12a (C 136.8), H-13 (H 8.12, s)/C-13 (C 122.0), C-13a (C 134.7), H-14 (H 8.06, d, J = 8.0 Hz)/C-14 (C 127.9), H-15 (H 7.65, dd, J = 8.0, 8.0 Hz)/C-15 (C 127.6), H-16 (H 7.59, dd, J = 8.0, 8.0 Hz)/C-16 (C 126.2), H-17 (H 8.16, d, J = 8.0 Hz)/C-17 (C 129.3), C-17a (C 132.3), H-18 (H 8.37, s)/C-18 (C 123.0), C-18a (C 130.0)] and GSH [C-1 (C 172.0), H-2 (H 4.84, dd, J = 11.0, 4.0 Hz)/C-2 (C 53.3), H-3 (H 2.12, m)/C-3 (C 24.8), H-4 (H 2.35, m)/C-4 (C 24.8), C-5 (C 171.2), H-6 (H 4.42, m,)/C-6 (C 54.7), C-7 (C 170.1), H-8 (H 3.72, d, J = 5.0 Hz)/C-8 (C 40.7), C-9 (C 170.8), H-10 (H 2.75, 2.65, d, J = 4.8 Hz)/C-10 (C 26.1)] moieties. Further interpretation of the HMBC spectroscopic data confirmed the chemical structure of the product. The observation of three HMBC bond correlations from an aromatic singlet H-18 (H 8.37, s) to C-11 (C 167.8) and from methylene proton H-12 (H 4.64, d, J = 11.0 Hz) to C-13 (C 122.0) allowed the attachment of C-18/C-11 and C12a/C-12, respectively, permitting the 2,3-dihydro-1H-benzo[f]isoindol-1-one moiety. The connectivity between this fragment and the GSH moiety was determined by analysing the HMBC spectroscopic data. The long-range HMBC correlations from H-2 to C-11 and C-12 (C 46.6) and from H-12 to C-2 elucidated the C-2-N attachment, completing the assignment of the product, as shown in Figure S10. The peak emission wavelength of the product is in agreement with previously collected fluorescence data (Figure S11). The UV absorption spectra, however, do not have any absorbance at ~450 nm, which is different from Figures S1-S3 due to the decomposition as mentioned above. The mechanism underlying the interaction of Hcy and Cys with the probes is a little bit different from that of GSH. The amino group of Hcy/Cys firstly reacts with a dialdehyde group, producing an imine derivative, and then the imine bond undergoes nucleophilic attack by the thiol group of Hcy/Cys to form a stable six- or five-membered ring. Subsequently, the amino group on the six- or five-membered ring reacts with another aldehyde group in the ortho-position to form the final product (Figure S12). The HPLC-MS results support our proposal (Figure S8). For Hcy, the mass spectra showed peaks at m/z 283.2 (NDA+Hcy), 313.4 (MNDA+Hcy), and 302.1 (FNDA+Hcy). For Cys, peaks at m/z 269.6 (NDA+Cys), 299.2 (MNDA+Cys), and 288.1 (FNDA+Cys) were observed.
One photon imaging of probes with GSH
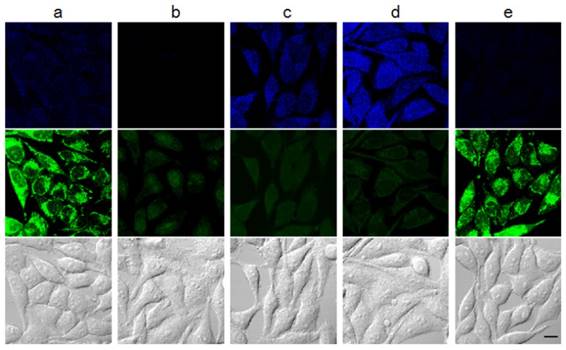
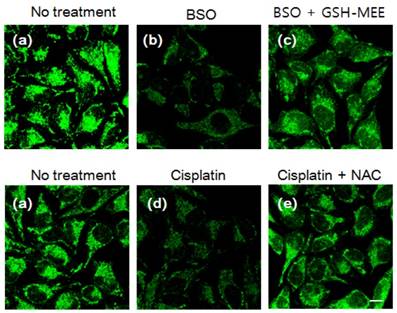
Subsequently, the capabilities of the probes to selectively sense intracellular thiols were established. NDA (Figure S13a), MNDA (Figure 3a) and FNDA (Figure S15a, 3 µM) were incubated for 30 min at 37 °C, and strong green fluorescence was observed in HeLa cells by confocal fluorescence microscopy. This result shows that these probes have excellent cell permeability. After treatment with N-methylmaleimide (NMM, 1 mM), which is commonly employed as a thiol-blocking reagent, for 30 min and incubation with NDA (Figure S13b), MNDA (Figure 3b) and FNDA (Figure S15b, 3 µM), the fluorescence was markedly quenched. Further addition of GSH-monoethyl ester (MEE) resulted in strong fluorescence (Figure S13c, 3e and S15c), demonstrating that these three probes can efficiently monitor intracellular GSH. Very interestingly, probe MNDA can also effectively image Hcy in different signal channels (blue) in HeLa cell (Figure 3d) while Cys only leads to tiny fluorescence enhancement in the same channel (Figure 3c).
Fluorescence imaging in cells. HeLa cells were pre-incubated with the following agents: (a) no treatment; (b) 1 mM NMM for 30 min; (c) 1 mM NMM for 30 min and 300 μM Cys for 30 min; (d) 1 mM NMM for 30 min and 300 µM Hcy for 30 min; (e) 1 mM NMM for 30 min and 1 mM GSH-MEE for 60 min. Cells were then washed with Dulbecco's phosphate-buffered saline (DPBS) and incubated with 10 µM MNDA for 30 min. After washing with DPBS, fluorescence images were acquired by confocal microscopy. Blue: ex. 405 nm/em. 430-455 nm, green: ex. 473 nm/em. 490-540 nm. Scale bar: 10 µm.
The detection of changes in intracellular GSH levels resulting from drug treatment was successfully established using NDA (Figures S14), MNDA (Figures 4) and FNDA (Figures S16). HeLa cells were incubated with 100 µM buthioninesulfoximine (BSO), which is an inhibitor of the γ-glutamylcysteinesynthetase enzyme for GSH synthesis, and weak fluorescence was observed after treatment with the probe (3 µM). The addition of 1 mM GSH-MEE led to significant fluorescence enhancement in the cells. Cisplatin, which is an anticancer drug and a known GSH-oxidizing agent, was employed to test reactivity of the probe to redox status of glutathione in living cells. As expected, the addition of cisplatin (50 µM) caused fluorescence quenching after incubation with the probes (3 µM), whereas further treatment with N-acetyl-l-cysteine (NAC), which can be converted to GSH in cells, significantly increased the green fluorescence. Moreover, a standard 3-(4, 5-dimethylthiazol-2-yl)-2, 5-diphenyltetrazolium bromide (MTT) assay using HeLa cells was performed with different concentrations of probes (MNDA and FNDA, see figure S17). The results showed that even after incubation with 10 μM probes for 24 h, >90% of the HeLa cells survived, indicating that the probes cause low cytotoxicity in living cells. These data demonstrate that NDA, MNDA and FNDA are ideal tools for the intracellular detection of GSH in living cells. Furthermore, we investigated the binding ability of our probes with proteins, many commercial GSH detection kits were removed protein and enzyme which may interfere GSH detection. The total cell was harvested by hypotonic buffer; and the majority of protein and non protein parts were isolated using the Amicon Ultra-15 centrtifugal filter devices which can separate cell lysis solution molecular weight over 3000 Dalton; and the majority of proteins have 3000 Dalton or above. According to Figure S25, both of protein and non protein parts can cause fluorescence enhancement in the present of three probes. Therefore, our probes could also bind with the cell proteins.
Changes in the intracellular GSH level after drug treatment. HeLa cells were incubated with (a) no treatment; (b) 100 µM BSO for 6 h; (c) 100 µM BSO with 1 mM GSH-MEE for 6 h; (d) 50 µM cisplatin for 6 h; (e) 50 µM cisplatin with 2 mM NAC for 6 h. Cells were then stained with 3 µM MNDA for 30 min and imaged withex. 473 nm/em. 490-590 nm. Scale bar: 10 µm.
Two photon imaging of MDNA with GSH
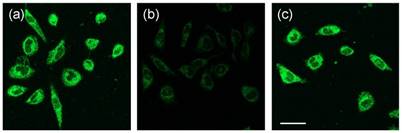
The successful imaging of intracellular GSH in one photon mode motivated us to investigate two photon (TP) properties of the above probes. We found that the TP action spectra of MNDA and the reaction product between MNDA and GSH in HEPES buffer solution showed cross section (Φδ) values of 1.1 and 0.15 GM at 920 nm, respectively (Figure S21). This result indicates a 10-fold increase in the two-photon excited fluorescence (TPEF) intensity. In comparison, for NDA and FNDA, no TP property was observed. Furthermore, we tested the ability of MNDA to detect thiols in live cells by using TPM. The TPM image of the MNDA-labelled HeLa cells was bright, presumably because of their easy loading, convenient rate of thiol-induced decomposition, and the considerable Φδ value of the reaction product (Figure 5a). The TPEF intensity decreased dramatically when the cells were pre-incubated with NMM for 30 min (Figure 5b), and increased significantly upon addition of GSH-MEE (Figure 5c). Hence, MNDA is capable of detecting GSH in live cells with TPM.
TPM images of 10 µM MNDA-labelled HeLa cells. HeLa cells were pre-incubated with the following agents: (a) no treatment; (b) 1 mM NMM for 30 min; (c) 1 mM NMM for 30 min and 1 mM GSH-MEE for 60 min. Cells were then washed with Dulbecco's phosphate-buffered saline (DPBS) and incubated with 10 µM MNDA for 30 min. TPM images were excited at900 nm and acquired at 400-600 nm. Scale bar: 10 µm.
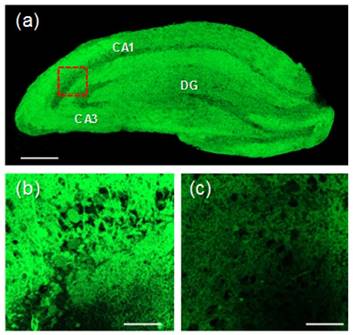
We then investigated the utility of MNDA in live tissue imaging. The TPM image reveals the CA1 and CA3 regions as well as the dentate gyrus (DG; Figure 6a). The TPM image of a part of a fresh rat hippocampal slice incubated with 50 μM MNDA for 50 min shows that thiols are abundant in the CA1 and DG regions at a 90-180 μm depth. The image at a higher magnification clearly reveals the thiol distribution in the CA1 region at a 100 μm depth (Figure 6b). Further, the TPEF intensity decreased dramatically when the tissue slice was pretreated with NMM (Figure 6c). The control image without staining of the probe showed no TPEF, indicating the negligible interference by autofluorescence (Figure S24). These results demonstrate that MNDA is useful for detection of thiols at a 90-180 μm depth in live tissues using TPM.
(a) Accumulated TPM images of a fresh rat hippocampal slice stained with 50 μM MNDA at a depth of 90-180μm with a magnification of 10×. Scale bar: 300 μm. (b) TPM image in the CA1 region (red box) at a depth of ~100 μm with amagnification of100×. Scale bar: 30 μm. (c) TPM image of (b) pretreated with NMM (200 μM) before labelling with 20 μM MNDA. The TPEF were collected at 400-600 nm upon excitation at 900 nm with fs pulse.
Application of GSH probes in serum
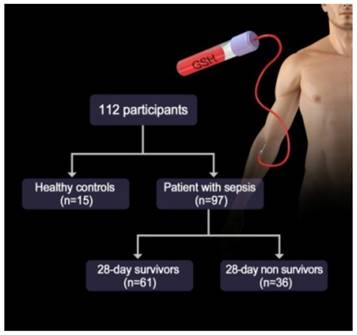
As is well-known, GSH not only exist in the cell but also in serum that is closely associated with several physiological diseases including sepsis. Thus, we investigated whether the probes could detect the alteration of GSH levels in the plasma of patients with sepsis. We first examined the baseline characteristics of all of the participants, including both healthy volunteers and sepsis patients. Among the 112 participants, there were 15 (male = 9, female = 6) healthy controls and 97 (male = 70, female = 27) sepsis patients (Figure 7). The values of inflammatory cytokines, including interleukin (IL)-18, IL-6 and IP-10, were significantly higher in sepsis patients than in healthy controls. Interestingly, the fluorescence intensities of NDA and FNDA were decreased in sepsis patients compared with those in healthy controls (Table S1). These results indicate that two probes, NDA and FNDA, can be used to monitor the decreased plasma GSH concentrations caused by sepsis.
Study diagram of the GSH probe for sepsis.
To determine whether the fluorescence intensities obtained using NDA and FNDA can predict the mortality rate in sepsis patients, we divided sepsis patients into two groups: survivors after 28 days of hospitalization (i.e., 28-d survivors) and non-survivors after 28 days of hospitalization (i.e., 28-d non-survivors) (Table S2). The fluorescence intensities of NDA and FNDA of the 28-d non-survivors were significantly lower than those of the 28-d survivors (Table S2). The APACHE II and SOFA scores were designed to measure the severity of disease in adult patients admitted to intensive care units (ICUs).[46-48] Specifically, an increase in the SOFA score predicts an increased risk of morbidity and mortality due to sepsis.[49, 50] In accordance with the lower fluorescence intensities obtained using NDA and FNDA in the 28-d non-survivors than in the 28-d survivors, the APACHE II and SOFA scores were higher in the 28-d non-survivors than in the 28-d survivors (Table S2).
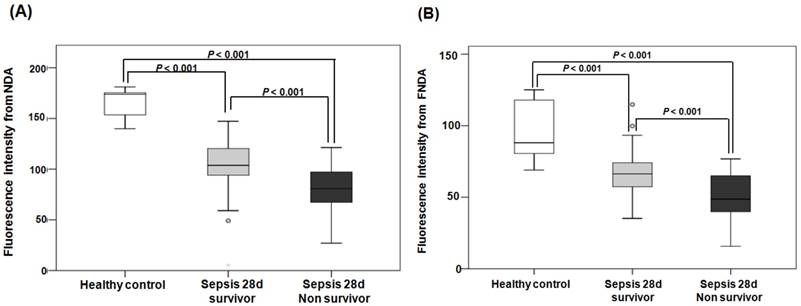
When comparing the fluorescence intensities from NDA and FNDA in the three groups (healthy controls, 28-d survivors, and 28-d non-survivors), the levels gradually decreased as the sepsis conditions increased in severity (Figure 8). HPLC analysis supports these results and confirmed the product in the serum under the same conditions (Figure S 20).
Fluorescence intensities from NDA and FNDA in the following three groups: healthy controls, 28-d survivors, and 28-d non-survivors. (A) The fluorescence intensity of NDA. (B) The fluorescence intensity of FNDA.
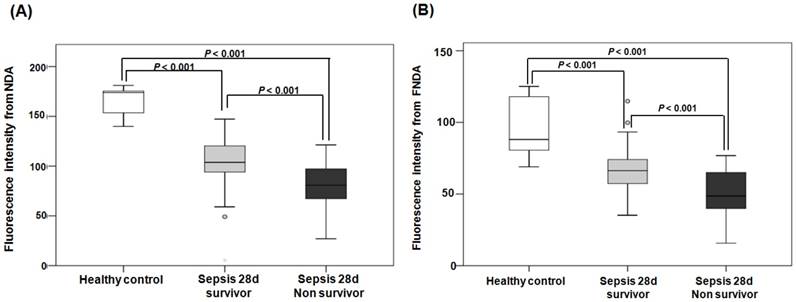
When comparing the SOFA scores with the NDA and FNDA intensities, the SOFA scores showed negative correlations with the NDA (r = -0.329, P = 0.001) and FNDA (r = -0.449, P<0.001) (Figure S19) intensities. To confirm the abilities of NDA and FNDA to predict mortality in sepsis patients, we compared the area under the curve (AUC) and cut-off values of NDA and FNDA with those of the APACHE II and SOFA scores. The AUC of NDA was 0.758 (P< 0.001, 95% CI 0.657-0.858), and the AUC of FNDA was 0.744 (P< 0.001, 95% CI 0.641-0.846) (Figure 9). The cut-off values of NDA and FNDA were 95.6 (sensitivity 0.772, specificity 0.721) and 57.6 (sensitivity 0.772, specificity 0.738), respectively (Table S3). By contrast, the AUCs of the APACHE II and SOFA scores were 0.658 and 0.724, respectively (Table S3), and the cut-off values of the APACHE II and SOFA scores were 28.5 (sensitivity 0.721, specificity 0.639) and 12.5 (sensitivity 0.754, specificity 0.611), respectively (Table S3). The AUC, sensitivity and specificity of NDA and FNDA were superior to those of the APACHE II and SOFA scores, indicating that analysing the fluorescence intensities of NDA and FNDA had a higher diagnostic power for predicting the mortality rate in sepsis patients than analysing the APACHE II and SOFA scores.
ROC curves used to predict mortality in sepsis patients. (A) ROC curves of NDA and FNDA. (B) ROC curves of APACHE II and SOFA scores. (C) The AUC, cut-off, sensitivity and specificity values of NDA, FNDA, the APACHE II score and the SOFA score for the prediction of mortality in sepsis patients.
Conclusion
In summary, we successfully synthesized two NDA derivatives containing an electron-donating group and an electron-withdrawing group. We found that the newly developed probe MNDA, which incorporates an electron-donating group, is capable of detecting GSH in live cells with two-photon microscopy (TPM). All of the NDA derivatives were able to detect intracellular GSH in HeLa cells. Among the three probes, NDA and FNDA were able to identify sepsis and predict mortality in patients with sepsis. In addition, in this study, we didn't quantify the GSH levers in human serum due to the potential interference of related proteins and its complicated environment. Thus, not only GSH, but also related proteins may affect the results.[51] We believe these results open up a promising direction for further medical diagnostic techniques.
Abbreviations
GSH: glutathione; Cys: cysteine; Hcy: homocysteine; TPM: two-photon microscopy; NDA: naphthalene-2,3-dicarboxaldehyde; MNDA: 6-methoxynaphthalene-2, 3-dicarbaldehyde; FNDA: 6-fluoronaphthalene-2,3-dicarbaldehyde; TPEF: two-photon excited fluorescence; ICUs: intensive care units; AUC: area under the curve; SOFA: sepsis-related organ failure assessment; APACHE II: chronic health evaluation II.
Acknowledgements
J.Y. thanks the National Creative Research Initiative Program of the National Research Foundation of Korea (NRF) funded by the Korean government (MSIP) for grant funding (Grant No. 2012R1A3A2048814). J.-H. R. thanks to the support by the Bio & Medical Technology Development Program of the NRF funded by the Korean government, MSIP (2017M3A9F3041229). C.Y. thanks the National Natural Science Foundation of China for grant funding (No. 21472118, 21672131). H.M.K. thanks the National Leading Research Lab Program of the NRF funded by MSIP for grant funding (No. 2016R1E1A1A02920873). Mass spectral data were obtained from the Korea Basic Science Institute (Daegu) using a Jeol JMS 700 high-resolution mass spectrometer.
Contributions
J. Li designed the experiment, synthesized the compounds, and determined the UV/Vis and fluorescence properties in aqueous solution. Y. Kwon and Y.W. Chung determined the fluorescence response of the probes in human serum. K. S. Chung collected human serum from a service hospital (Yonsei University College of Medicine). D. Lee assisted J. Li. J. Yoon isolated the reaction product of GSH with the probes by HPLC. Y. Yue provided advice about the paper. G. Kim performed the cell experiments. S-J Nam confirmed the structures of the isolated reaction products of GSH with the probes. C. S. Lim contributed the two photon imaging work. H. M. Kim, C. Yin, J-H Ryu and J. Yoon guided the project and revised the manuscript.
Supplementary Material
Supplementary figures and tables.
Competing Interests
The authors have declared that no competing interest exists.
References
1. Townsend DM, Tew KD, Tapiero H. The importance of glutathione in human disease. Biomed Pharmacother. 2003;57:145-55
2. Quintana-Cabrera R, Fernandez-Fernandez S, Bobo-Jimenez V, Escobar J, Sastre J, Almeida A. et al. γ-Glutamylcysteine detoxifies reactive oxygen species by acting as glutathione peroxidase-1 cofactor. NatCommun. 2012;3:718
3. Lu SC. Regulation of glutathione synthesis. Aspects Med. 2009;30:42-59
4. Kim JS, Kwon WY, Suh GJ, Kim KS, Jung YS, Kim SH. et al. Plasma glutathione reductase activity and prognosis of septic shock. J Surg Res. 2016;200:298-307
5. You KM, Kwon WY, Suh GJ, Kim KS, Kim JS, Bu J. et al. 975: PLASMA GLUTATHIONE REDUCTASE ACTIVITY IS ASSOCIATED WITH THE PROGNOSIS OF SEPTIC SHOCK. Crit Care Med. 2014;42:A1595
6. Shahrokhian S. Lead phthalocyanine as a selective carrier for preparation of a cysteine-selective electrode. Anal Chem. 2001;73:5972-8
7. Refsum H, Ueland P, Nygård O, Vollset S. Homocysteine and cardiovascular disease. Annu Rev Med. 1998;49:31-62
8. Shankar-Hari M, Phillips GS, Levy ML, Seymour CW, Liu VX, Deutschman CS. et al. Developing a new definition and assessing new clinical criteria for septic shock: for the Third International Consensus Definitions for Sepsis and Septic Shock (Sepsis-3). Jama. 2016;315:775-87
9. Ghezzi P. Role of glutathione in immunity and inflammation in the lung. Int J Gen Med. 2011;4:105
10. Jefferies H, Coster J, Khalil A, Bot J, McCauley RD, Hall JC. Glutathione. ANZ J Surg. 2003;73:517-22
11. Macdonald J, Galley H, Webster N. Oxidative stress and gene expression in sepsis. Br J Anaesth. 2003;90:221-32
12. Biolo G, Antonione R, De Cicco M. Glutathione metabolism in sepsis. Crit Care Med. 2007;35:S591-S5
13. Andrades MÉ, Morina A, Spasić S, Spasojević I. Bench-to-bedside review: sepsis-from the redox point of view. Crit Care. 2011;15:230
14. Işık M, Guliyev R, Kolemen S, Altay Y, Senturk B, Tekinay T. et al. Designing an intracellular fluorescent probe for glutathione: two modulation sites for selective signal transduction. Org lett. 2014;16:3260-3
15. Seungyoon B. Exceptional time response, stability and selectivity in doubly-activated phenyl selenium-based glutathione-selective platform. Chem Sci. 2015;6:5435-9
16. Liu J, Sun Y-Q, Huo Y, Zhang H, Wang L, Zhang P. et al. Simultaneous fluorescence sensing of Cys and GSH from different emission channels. J Am Chem Soc. 2013;136:574-7
17. Liu J, Sun Y-Q, Zhang H, Huo Y, Shi Y, Guo W. Simultaneous fluorescent imaging of Cys/Hcy and GSH from different emission channels. Chem Sci. 2014;5:3183-8
18. Cao M, Chen H, Chen D, Xu Z, Liu SH, Chen X. et al. Naphthalimide-based fluorescent probe for selectively and specifically detecting glutathione in the lysosomes of living cells. Chem Commun. 2016;52:721-4
19. Gao X, Li X, Li L, Zhou J, Ma H. A simple fluorescent off-on probe for the discrimination of cysteine from glutathione. Chem Commun. 2015;51:9388-90
20. Liu Z, Zhou X, Miao Y, Hu Y, Kwon N, Wu X. et al. A Reversible Fluorescent Probe for Real-Time Quantitative Monitoring of Cellular Glutathione. Angew Chem Int Edit. 2017;56:5812-6
21. Umezawa K, Yoshida M, Kamiya M, Yamasoba T, Urano Y. Rational design of reversible fluorescent probes for live-cell imaging and quantification of fast glutathione dynamics. Nat Chem. 2016
22. Niu L-Y, Guan Y-S, Chen Y-Z, Wu L-Z, Tung C-H, Yang Q-Z. BODIPY-based ratiometric fluorescent sensor for highly selective detection of glutathione over cysteine and homocysteine. J Am Chem Soc. 2012;134:18928-31
23. Lou X, Hong Y, Chen S, Leung CWT, Zhao N, Situ B. et al. A selective glutathione probe based on AIE fluorogen and its application in enzymatic activity assay. Sci Rep. 2014:4
24. Redy-Keisar O, Kisin-Finfer E, Ferber S, Satchi-Fainaro R, Shabat D. Synthesis and use of QCy7-derived modular probes for the detection and imaging of biologically relevant analytes. Nat Protoc. 2014;9:27
25. Lee MH, Han JH, Kwon P-S, Bhuniya S, Kim JY, Sessler JL. et al. Hepatocyte-targeting single galactose-appended naphthalimide: a tool for intracellular thiol imaging in vivo. J Am Chem Soc. 2012;134:1316-22
26. Zhai D, Lee S-C, Yun S-W, Chang Y-T. A ratiometric fluorescent dye for the detection of glutathione in live cells and liver cancer tissue. Chem Commun. 2013;49:7207-9
27. Li H, Peng W, Feng W, Wang Y, Chen G, Wang S. et al. A novel dual-emission fluorescent probe for the simultaneous detection of H 2 S and GSH. Chem Commun. 2016;52:4628-31
28. Huang R, Wang B-B, Si-Tu X-M, Gao T, Wang F-F, He H. et al. A lysosome-targeted fluorescent sensor for the detection of glutathione in cells with an extremely fast response. Chem Sci. 2016;52:11579-82
29. Li Y, Liu W, Zhang P, Zhang H, Wu J, Ge J. et al. A fluorescent probe for the efficient discrimination of Cys, Hcy and GSH based on different cascade reactions. Biosens Bioelectron. 2017;90:117-24
30. He L, Xu Q, Liu Y, Wei H, Tang Y, Lin W. Coumarin-based turn-on fluorescence probe for specific detection of glutathione over cysteine and homocysteine. ACS Appl Mater Interfaces. 2015;7:12809-13
31. Lim S-Y, Hong K-H, Kim DI, Kwon H, Kim H-J. Tunable heptamethine-azo dye conjugate as an NIR fluorescent probe for the selective detection of mitochondrial glutathione over cysteine and homocysteine. J Am Chem Soc. 2014;136:7018-25
32. Matsumoto T, Urano Y, Shoda T, Kojima H, Nagano T. A thiol-reactive fluorescence probe based on donor-excited photoinduced electron transfer: key role of ortho substitution. Org Lett. 2007;9:3375-7
33. Li L, Wang X, Li Q, Liu P, Xu K, Chen H. et al. An accurate mass spectrometric approach for the simultaneous comparison of GSH, Cys, and Hcy in L02 cells and HepG2 cells using new NPSP isotope probes. Chem Commun. 2015;51:11317-20
34. Chan J, Dodani SC, Chang CJ. Reaction-based small-molecule fluorescent probes for chemoselective bioimaging. Nat Chem. 2012;4:973-84
35. Tang B, Xing Y, Li P, Zhang N, Yu F, Yang G. A rhodamine-based fluorescent probe containing a Se- N bond for detecting thiols and its application in living cells. J Am Chem Soc. 2007;129:11666-7
36. Yang X-F, Huang Q, Zhong Y, Li Z, Li H, Lowry M. et al. A dual emission fluorescent probe enables simultaneous detection of glutathione and cysteine/homocysteine. Chem Sci. 2014;5:2177-83
37. Liu X-L, Niu L-Y, Chen Y-Z, Yang Y, Yang Q-Z. A multi-emissive fluorescent probe for the discrimination of glutathione and cysteine. Biosens Bioelectron. 2017;90:403-9
38. Cao M, Yu F, Lv C, Choo J, Chen L. Fluorescent chemical probes for accurate tumor diagnosis and targeting therapy. Chem Soc Rev. 2017;46:2237-71
39. Han X, Song X, Yu F, Chen L. A ratiometric fluorescent probe for imaging and quantifying anti-apoptotic effects of GSH under temperature stress. Chem Sci. 2017;8:6991-02
40. Jiang X, Yu Y, Chen J, Zhao M, Chen H, Song X. et al. Quantitative Imaging of Glutathione in Live Cells Using a Reversible Reaction-Based Ratiometric Fluorescent Probe. ACS Chem Biol. 2015;10:864-74
41. Chen J, Jiang X, Carroll SL, Huang J, Wang J. Theoretical and Experimental Investigation of Thermodynamics and Kinetics of Thiol-Michael Addition Reactions: A Case Study of Reversible Fluorescent Probes for Glutathione Imaging in Single Cells. Org Lett. 2015;17:5978-81
42. Chen J, Jiang X, Zhang C, MacKenzie KR, Stossi F, Palzkill T. et al. Reversible Reaction-Based Fluorescent Probe for Real-Time Imaging of Glutathione Dynamics in Mitochondria. ACS Sens. 2017;2:1257-61
43. Jiang X, Chen J, Bajić A, Zhang C, Song X, Carroll SL. et al. Quantitative real-time imaging of glutathione. Nat Commun. 2017;8:16087
44. Orwar O, Fishman HA, Ziv NE, Scheller RH, Zare RN. Use of 2, 3-naphthalenedicarboxaldehyde derivatization for single-cell analysis of glutathione by capillary electrophoresis and histochemical localization by fluorescence microscopy. Anal Chem. 1995;67:4261-8
45. Lin C-H, Lin K-H, Pal B, Tsou L-D. Iterative synthesis of acenesvia homo-elongation. Chem Commun. 2009:803-5
46. Singer M, Deutschman CS, Seymour CW, Shankar-Hari M, Annane D, Bauer M. et al. The third international consensus definitions for sepsis and septic shock (sepsis-3). Jama. 2016;315:801-10
47. Knaus WA, Wagner DP, Draper EA, Zimmerman JE, Bergner M, Bastos PG. et al. The APACHE III prognostic system: risk prediction of hospital mortality for critically III hospitalized adults. Chest. 1991;100:1619-36
48. Knaus WA, Draper EA, Wagner DP, Zimmerman JE. APACHE II: a severity of disease classification system. CritCare Med. 1985;13:818-29
49. Jones AE, Trzeciak S, Kline JA. The Sequential Organ Failure Assessment score for predicting outcome in patients with severe sepsis and evidence of hypoperfusion at the time of emergency department presentation. CritCare Med. 2009;37:1649
50. Minne L, Abu-Hanna A, de Jonge E. Evaluation of SOFA-based models for predicting mortality in the ICU: A systematic review. CritCare. 2008;12:R161
51. Menon D, Board PG. A fluorometric method to quantify protein glutathionylation using glutathione derivatization with 2,3-naphthalenedicarboxaldehyde. Anal. Biochem. 2013;433:132-6
Author contact
![]() Corresponding authors: Juyoung Yoon, e-mail: jyoonac.kr; Ji-Hwan Ryu, e-mail: yjhac; Caixia Yin, e-mail: yincxedu.cn, Hwan Myung Kim, e-mail: kimhmac.kr.
Corresponding authors: Juyoung Yoon, e-mail: jyoonac.kr; Ji-Hwan Ryu, e-mail: yjhac; Caixia Yin, e-mail: yincxedu.cn, Hwan Myung Kim, e-mail: kimhmac.kr.