Impact Factor
- Issue 13; 2026
- Issue 12; 2026
- Issue 11; 2026
- Issue 10; 2026
- Issue 9; 2026
- Volume 16; 2026
- Advance Articles
- Past Issues
- Cover Images
- Cover Suggestion
- Index & Coverage
- Special Issues
Introduction
Results
Discussion
Conclusion
Materials and methods
Abbreviations
Supplementary Material
Acknowledgements
References
International Journal of Biological Sciences
International Journal of Medical Sciences
 Global reach, higher impact

Theranostics 2018; 8(5):1340-1349. doi:10.7150/thno.22806 This issue Cite
Research Paper
Desmin- and vimentin-mediated hepatic stellate cell-targeting radiotracer 99mTc-GlcNAc-PEI for liver fibrosis imaging with SPECT
Deliang Zhang1, Rongqiang Zhuang1, Zhide Guo1, Mengna Gao1, Lumei Huang1, Linyi You1, Pu Zhang1, Jindian Li1, Xinhui Su2, Hua Wu3, Xiaoyuan Chen4, Xianzhong Zhang1, ![]()
1. State Key Laboratory of Molecular Vaccinology and Molecular Diagnostics & Center for Molecular Imaging and Translational Medicine, School of Public Health, Xiamen University, Xiamen 361102, China.
2. Department of Nuclear Medicine, Zhongshan Hospital affiliated to Xiamen University, Xiamen 361004, Fujian, China.
3. Department of Nuclear Medicine, The First Affiliated Hospital of Xiamen University, Xiamen 361003, China.
4. Laboratory of Molecular Imaging and Nanomedicine, National Institute of Biomedical Imaging and Bioengineering, National Institutes of Health, Bethesda, Maryland, 20892 USA.
Received 2017-9-12; Accepted 2017-12-8; Published 2018-2-2
Abstract

Extracellular matrix (ECM) accumulation in liver fibrosis is caused by the activation of hepatic stellate cells (HSCs). The goal of this study was to develop a 99mTc-labeled N-acetylglucosamine (GlcNAc) that specifically interacts with desmin and vimentin expressed on activated HSCs to monitor the progression and prognosis of liver fibrosis using single-photon emission computed tomography (SPECT) imaging.
Methods: GlcNAc-conjugated polyethylenimine (PEI) was first prepared and radiolabeled with 99mTc. Noninvasive SPECT imaging with 99mTc-GlcNAc-PEI was used to assess liver fibrosis in a carbon tetrachloride (CCl4) mouse model. The liver uptake value (LUV) of 99mTc-GlcNAc-PEI was measured by drawing the region of interest (ROI) of the whole liver as previously suggested. The LUV of the CCl4 groups was compared with that of the olive oil group. Next, we estimated the correlation between the results of SPECT imaging and physiological indexes. After treatment with clodronate liposome, the LUV of 99mTc-GlcNAc-PEI in fibrotic mice was compared with that in control mice.
Results: 99mTc-GlcNAc-PEI is a hydrophilic compound with high radiochemical purity (>98%) and good stability. It could specifically target desmin and vimentin on the surface of activated HSCs with high affinity (the Kd values were 53.75 ± 9.50 nM and 20.98 ± 3.56 nM, respectively). The LUV of 99mTc-GlcNAc-PEI was significantly different between the CCl4 and control groups as early as 4 weeks of CCl4 administration (3.30 ± 0.160 vs 2.34 ± 0.114%/cc; P ˂ 0.05). There was a strong correlation between the LUV and Sirius Red quantification (R = 0.92, P ˂ 0.001). Compared with control, clodronate liposome treatment reduced the LUV of 99mTc-GlcNAc-PEI (4.62 ± 0.352 vs 2.133 ± 0.414%/cc; P ˂ 0.05).
Conclusion: 99mTc-GlcNAc-PEI SPECT/CT was useful in assessing liver fibrosis and monitoring the treatment response.
Keywords: hepatic fibrosis, desmin, vimentin, SPECT imaging, hepatic stellate cells, 99mTc-GlcNAc-PEI
Introduction
Liver fibrosis is the result of repeated damage to the liver in conjunction with sustained accumulation of extracellular matrix (ECM) proteins1. The accumulation of ECM proteins substitutes the necrotic tissue with a fibrous scar, which distorts the hepatic architecture and produces liver dysfunction2. The activation and proliferation of HSCs play a major role in the pathogenesis of hepatic fibrosis3. Activated HSCs are characterized by an accelerated rate of proliferation, excessive expression of α smooth muscle actin (α-SMA), sustained syntheses of ECM proteins, and secretion of chemokines and fibrogenic factors2, 4, 5. Therefore, the imaging of activated HSCs may be a good strategy to assess liver fibrosis.
The accurate staging of liver fibrosis in chronic liver diseases is crucial for the prognostic assessment of the disease course and selection of feasible therapies. To this day, liver biopsy remains the gold standard for the assessment of liver fibrosis6,7. However, liver biopsy is an invasive procedure, and there are complications such as bleeding and pain5. There is an urgent need to develop non-invasive ways to assess liver fibrosis in chronic liver disease and monitor fibrosis progression and the treatment response. Many noninvasive methods have been developed in the past decades to assess liver fibrosis, such as MRI imaging of fibrosis in two rodent models with a collagen-specific probe8 and transient elastography of liver fibrosis by measurement of the rigidity of the liver9, and several other methods based on potential serum markers10. Unfortunately, conventional imaging is less accurate in detecting mild fibrosis than that of advanced fibrosis and cirrhosis11,12.
Recently, polymers bearing N-acetylglucosamine (GlcNAc) have been reported with a strong avidity for desmin and vimentin by binding to the rod II domain of the protein on cell surfaces13,14. During HSC activation, the expression of desmin and vimentin is strongly upregulated15, and activated HSCs express more desmin and vimentin protein than quiescent HSCs and other non-parenchymal cells in the liver16, especially in advanced fibrosis15,17. Kim et al.18 reported that fluorescence imaging using an IVIS® Lumina imaging system and a GlcNAc-PEI-ICG/TGFβ1 siRNA complex could assess and treat liver fibrosis. However, a long time is needed for the accumulation of the fluorescence signal in the liver, and quick extinction of its fluorescence signal has restricted its use in clinical settings. Combined SPECT/CT imaging provides accurate anatomic data on CT, as well as functional information on SPECT images, facilitating the accurate staging of liver fibrosis19. Therefore, we developed a small molecular radiotracer 99mTc-GlcNAc-PEI using GlcNAc as the HSC target group incorporating PEI-1800 as the functionalized group for 99mTc labeling. The purpose of this study was to assess the potential usefulness of 99mTc-GlcNAc-PEI for SPECT/CT monitoring of the progression and prognosis of liver fibrosis in a mouse model.
Results
Characterization of GlcNAc-PEI
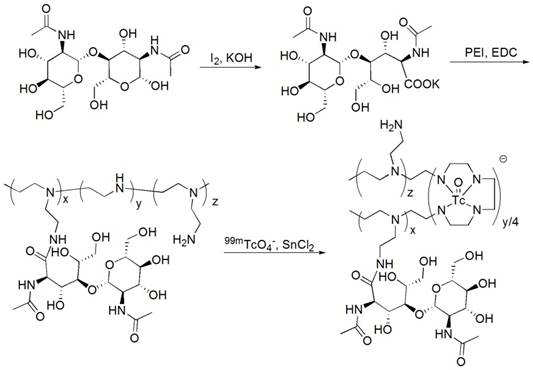
GlcNAc-PEI was synthesized with chitobiose and PEI-1800 (shown in Fig. 1) and was characterized by 1H NMR (Fig. S1A-B) and MODI-TOF-MS (Fig. S1C). The molecular weight of GlcNAc-PEI calculated by MODI-TOF-MS was approximately 3.3 kDa. The sugar content in GlcNAc-PEI was measured by the phenol-vitriol method. After the standard curve of GlcNAc was plotted (Fig. S1D), the mass percent of sugar in GlcNAc-PEI was calculated as 42.3%.
Synthesis and radiolabeling of GlcNAc-PEI with 99mTc.
Radiolabeling of 99mTc-GlcNAc-PEI
The labeling efficiency of 99mTc-GlcNAc-PEI was greater than 95% as determined by TLC. 99mTc-GlcNAc-PEI remained at the spotting point (Rf = 0-0.1), while other radioactive impurities such as hydrolyzed 99mTc and 99mTcO4- moved to the front of the strips (Rf = 0.9-1.0, shown in Fig. S2A). 99mTc-GlcNAc-PEI was obtained with high radiochemical purity (RCP) without purification. The RCP of 99mTc-GlcNAc-PEI was still greater than 92% when incubated in PBS or serum for 4 h, as determined by TLC (shown in Fig. S2B). The lipid-water partition coefficient of 99mTc-GlcNAc-PEI was determined by the shake flask method following the previous method, and the log P value was calculated as -3.15± 0.27 (n = 3), indicating that it was a hydrophilic compound.
Characterization of the liver fibrosis mouse model
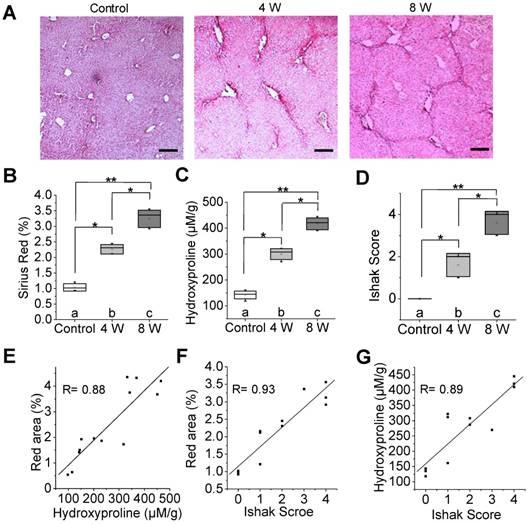
To identify whether 99mTc-GlcNAc-PEI SPECT imaging could be used to assess liver fibrosis, we treated mice with CCl4 or olive oil (as vehicle control) for 4 or 8 weeks to induce varying stages of liver fibrosis. Liver fibrosis gradually progressed with time and gradually developed into progressive hepatic fibrosis after the administration of CCl4 for 8 weeks, as was expected and verified by Sirius Red staining (Fig. 2A-B). After 4 weeks of CCl4 administration, most mice had liver injury with short fibrous septa (control vs 4 W = 1.04% ± 0.12% vs 2.26% ± 0.15%, P ˂ 0.05). In the livers of CCl4-8 W mice, extensive bridging fibrosis, in addition to distortion of the liver architecture with pseudo-lobule formation, was visible (control vs 8 W = 1.04% ± 0.12% vs 3.24% ± 0.28%, P ˂ 0.01). Consistently, we detected the collagen of liver tissue by hydroxyproline analysis, and collagen deposition was increased along with the administration of CCl4 (Fig. 2C). The Ishak score was also increased along with the administration of CCl4 (Fig. 2D). There were strong correlations between the hydroxyproline level and Sirius Red quantification (R = 0.88, Fig. 2E), Sirius Red quantification and the Ishak score (R = 0.93, Fig. 2F), and the hydroxyproline level and Ishak score (R = 0.89, Fig. 2G). 18F-FDG PET/CT imaging and 99mTc-GSA SPECT/CT imaging confirmed the pathologic process of fibrosis in the CCl4 mice (Fig. S3).
Characterization of a CCl4-induced mouse model of liver fibrosis. (A) Representative images of Sirius Red staining after CCl4 administration for 4 or 8 weeks. Scale bar: 200 μm. (B) Red area of Sirius Red staining was quantified using Image pro-pus software. (C) Hydroxyproline level in the liver of CCl4-induced mice was calculated by HPLC analysis. (D) Ishak score of the liver tissue in CCl4-induced fibrotic mice. (E) Correlation between total collagen (hydroxyproline) and red area of Sirius Red staining. (F) Correlation between the total Ishak score and red area of Sirius Red staining. (G) Correlation between the Ishak score and total collagen (hydroxyproline). *P <0.05 and **P <0.01.
99mTc-GlcNAc-PEI SPECT imaging to assess liver fibrosis in the mice
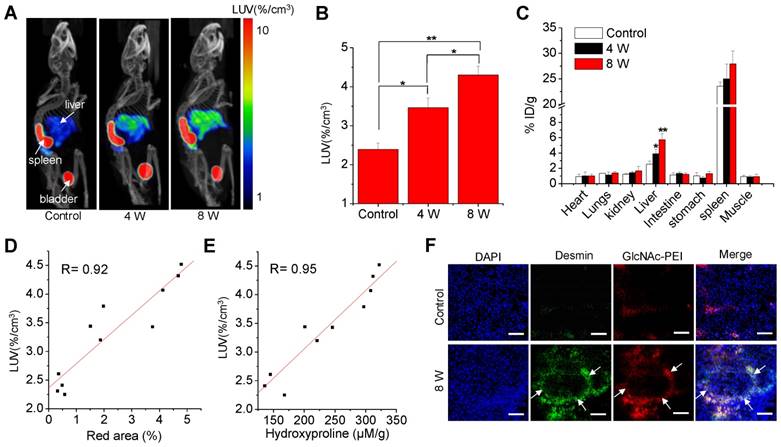
The time-activity curves and representative images derived from the 50-min dynamic SPECT imaging (Fig. S4) showed that the hepatic uptake of fibrotic mice was higher than that of control mice and peaked within 25~30 min after injection. Thus, the static microSPECT scans were performed in control and CCl4 mice at 30 min after injection. Strong contrast between the liver and non-targeted tissues or organs were obtained after 99mTc-GlcNAc-PEI injection. 99mTc-GlcNAc-PEI showed specific and high uptake in the liver of fibrotic mice, except for unexpected high splenic uptake and metabolites in the bladder. The hepatic uptake increased with disease progression in the CCl4-induced fibrotic mice, as seen in Fig. 3A. The LUV of the CCl4-8 W group was higher than that of CCl4-4 W group (4.68 ± 0.11%/cc vs 3.30 ± 0.16%/cc, P ˂ 0.01) and much higher than that of the control group (4.68 ± 0.11%/cc vs 2.34 ± 0.11%/cc, P ˂ 0.001), as shown in Fig. 3B. We obtained a similar result with autoradiography of the liver tissue of the control and fibrotic mice (Fig. S5). 99mTc-GlcNAc-PEI was more likely to combine with fibrotic liver tissues than with normal liver tissues. Similar results were obtained from the biodistribution experiment (Fig. 3C). The liver uptake of 99mTc-GlcNAc-PEI in fibrotic mice was different from that in control mice (control vs 4 W = 2.54 ± 0.40%ID/g vs 4.90 ± 0.58%ID/g, P ˂ 0.05; control vs 8 W = 2.54 ± 0.40%ID/g vs 7.74 ± 0.76%ID/g, P ˂ 0.01). Strong correlations were observed between hepatic uptake measured by SPECT/CT and Sirius Red quantification (R = 0.92, Fig. 3D) and between hepatic uptake and the liver hydroxyproline levels (R = 0.95, Fig. 3E). Immunofluorescent assay showed strong colocalization of anti-desmin (Fig. 3F) and anti-vimentin (Fig. S6) staining (FITC) with Cy5.5-labeled GlcNAc-PEI (GlcNAc-PEI-Cy5.5), confirming that GlcNAc-PEI could target desmin and vimentin on the surface of activated HSCs. However, the liver tissue of the control group lacked the expression of desmin and vimentin and showed less binding of GlcNAc-PEI-Cy5.5. We obtained a similar result using an immunofluorescent colocalization assay with GlcNAc-PEI-Cy5.5 and anti-α-SMA staining (Fig. S7). Biodistribution experiments using 99mTc-GlcNAc-PEI in normal mice showed low uptake in the liver and extensive uptake in the spleen (Fig. S8). Next, we labeled untargeted PEI-1800 with 99mTc using the same method as 99mTc-GlcNAc-PEI for comparison. SPECT imaging of CCl4-induced fibrotic mice with 99mTc-PEI-1800 showed high accumulation in the kidney and low splenic uptake (Fig. S9), a finding that was different from that with 99mTc-GlcNAc-PEI.
MicroSPECT/CT imaging with 99mTc-GlcNAc-PEI to assess liver fibrosis. (A) SPECT/CT imaging of CCl4-induced fibrotic mice with 99mTc-GlcNAc-PEI. Both images were rendered at the same scale. (B) Hepatic uptake of control and fibrotic mice by drawing the ROI of the whole liver. (C) Biodistribution of 99mTc-GlcNAc-PEI in CCl4-induced fibrotic mice (n = 3). (D) Correlation between hepatic uptake and Sirius Red quantification. (E) Correlation between hepatic uptake and total collagen (hydroxyproline). (F) Immunofluorescence co-localization analysis of desmin and GlcNAc-PEI-Cy5.5 in the liver tissue of CCl4-induced fibrotic mice. Scale bar: 200 μm. *P <0.05 and **P <0.01.
Blocking studies of 99mTc-GlcNAc-PEI in fibrotic mice
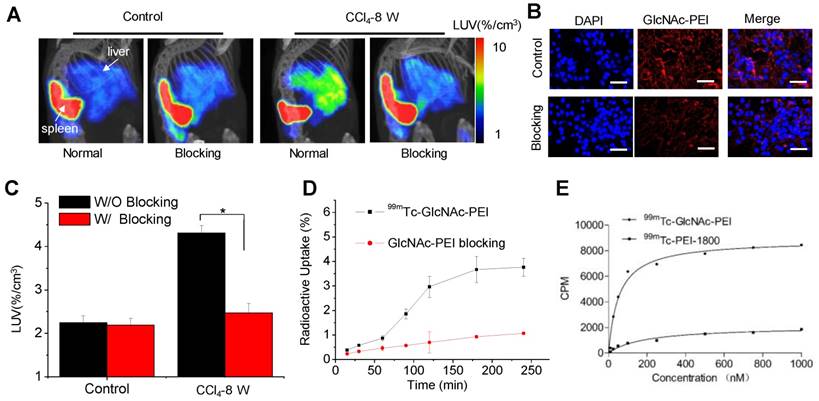
To confirm the desmin and vimentin specificity of 99mTc-GlcNAc-PEI in the fibrotic liver, blocking experiments were performed. After the co-injection of an excess dose of GlcNAc-PEI (500 μg), hepatic uptake was significantly reduced in fibrotic mice (P ˂ 0.01; Fig. 4A, C). By contrast, co-injection of an excess dose of GlcNAc-PEI had no effect on the hepatic uptake of 99mTc-GlcNAc-PEI in the liver of normal mice. Fluorescent cell uptake of GlcNAc-PEI-Cy5.5 was decreased obviously when blocked with excess GlcNAc-PEI in HSCs isolated from the liver of fibrotic mice (Fig. 4B). The radioactive competitive binding assay indicated that cellular uptake of 99mTc-GlcNAc-PEI was significantly decreased when blocking with excess GlcNAc-PEI in the HSCs of fibrotic mice (Fig. 4D). To further assess the binding affinity, saturation binding experiments were performed with 99mTc-GlcNAc-PEI and 99mTc-PEI-1800. We found that 99mTc-GlcNAc-PEI had a classical saturation curve and a high affinity with desmin protein (Kd = 53.75 ± 9.50 nM; as shown in Fig. 4E). However, 99mTc-PEI-1800 had a nearly linear distribution similar to non-specific uptake, indicating the low affinity of 99mTc-PEI-1800. Meanwhile, we found that 99mTc-GlcNAc-PEI had a high affinity with vimentin protein (Kd = 20.98 ± 3.56 nM; as shown in Fig. S10). Through these analyses, we demonstrated that GlcNAc-PEI could specifically target desmin and vimentin on the surface of activated HSCs.
Blocking studies of 99mTc-GlcNAc-PEI in fibrotic mice. (A) SPECT/CT imaging of fibrotic mice at 30 min after the intravenous injection of 99mTc-GlcNAc-PEI (18.5 MBq) with or without GlcNAc-PEI for blocking. Images were adjusted using the same scale for all animals. (B) Cell uptake of GlcNAc-PEI-Cy5.5 in the fibrotic liver tissue. Blue: DAPI; Red: GlcNAc-PEI-Cy5.5. Scale bar: 50 μm. (C) Hepatic uptake of 99mTc-GlcNAc-PEI derived from SPECT imaging by drawing the ROI of the whole liver. (D) Competitive binding assay of 99mTc-GlcNAc-PEI with or without the presence of excess GlcNAc-PEI in HSCs separated from the liver of fibrotic mice. (E) Saturation binding assay of 99mTc-GlcNAc-PEI with desmin protein.
SPECT/CT imaging of liver fibrosis mice with clodronate liposome treatment
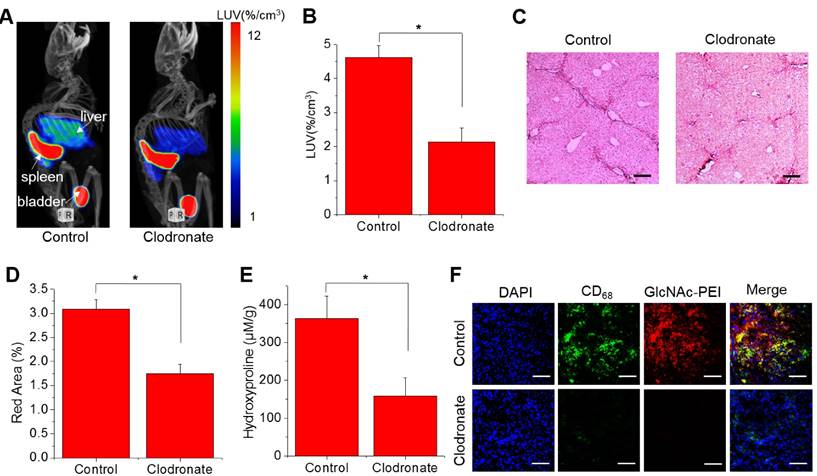
The lack of non-invasive ways to monitor fibrosis progression limited the development of anti-fibrotic drugs20. Here, we developed a method based on SPECT imaging with 99mTc-GlcNAc-PEI to monitor the therapeutic efficacy of liver fibrosis. Clodronate liposomes were used for the treatment of liver fibrosis because it could reduce fibrosis by killing macrophages in the liver. As seen in Fig. 5A-B, the LUV of 99mTc-GlcNAc-PEI was obviously decreased in fibrotic mice treated with clodronate liposomes (control vs clodronate = 4.62 ± 0.35%/cc vs 2.13 ± 0.41%/cc; P ˂ 0.05). 99mTc-GlcNAc-PEI SPECT/CT static imaging could detect the difference between these two groups of mice in the evaluation of liver fibrosis. Histologic analysis of the Sirius Red staining results demonstrated that the collagen fiber was reduced evidently in fibrotic mice after clodronate liposome treatment (Fig. 5C). After clodronate liposome treatment, the fibrous area of most mice was reduced (control vs clodronate = 3.09 ± 0.20% vs 1.75 ± 0.19%, P ˂ 0.05; Fig. 5D). Consistently, collagen deposition was decreased with the administration of clodronate (control vs clodronate = 362.8 ± 59.04 vs 158.3 ± 48.68 μmol/g; P ˂ 0.05; Fig. 5E). Immunohistology studies showed that the expression of CD68 (cell surface marker of macrophage) was obviously decreased in the liver of fibrotic mice when treated with clodronate liposomes (Fig. 5F). Immunofluorescence analysis showed that the expression of α-SMA was significantly reduced in the liver of fibrotic mice after clodronate liposome treatment (Fig. S11). These results suggested that 99mTc-GlcNAc-PEI SPECT/CT imaging could be used as a potent method to monitor fibrosis progression and evaluate the effect of anti-fibrotic drugs.
99mTc-GlcNAc-PEI SPECT/CT imaging of liver fibrosis mice with clodronate liposome treatment. (A) 99mTc-GlcNAc-PEI SPECT/CT imaging of fibrotic mice with clodronate liposome treatment. (B) Hepatic uptake of 99mTc-GlcNAc-PEI by drawing the ROI of the whole liver. (C) Representative images of Sirius Red staining after clodronate liposome treatment. Scale bar: 200 μm. (D) Quantization of the red area of Sirius Red staining after treatment with clodronate liposome. (E) Hydroxyproline level in the liver of CCl4-induced mice after treatment with clodronate liposomes. (F) Immunofluorescence staining of fibrotic liver tissue after treatment with clodronate liposome. Blue: DAPI; green: anti-CD68 staining FITC; Red: GlcNAc-PEI-Cy5.5. Scale bar: 200 μm. *P <0.05 and **P <0.01.
Discussion
Previously, significantly increased expression of desmin and vimentin was reported in the fibrotic liver of mice, especially in advanced fibrosis15,17. In this study, we developed an HSC-targeting radiotracer, 99mTc-GlcNAc-PEI. High-quality images of the whole liver were obtained using 99mTc-GlcNAc-PEI by SPECT/CT imaging in CCl4-induced fibrotic mice. We demonstrated that SPECT/CT imaging with 99mTc-GlcNAc-PEI could reliably identify liver fibrosis as early as 4 weeks after CCl4 treatment. The pathologic process of fibrosis and significantly enhanced desmin and vimentin expression during the progression of liver fibrosis were verified and confirmed by histologic staining in this study. Furthermore, 18F-FDG PET/CT and 99mTc-GSA SPECT/CT imaging were performed to confirm the pathologic process in the CCl4-induced fibrotic mice. Unlike 99mTc-GlcNAc-PEI, the increased uptake of 18F-FDG (Fig. S3A) and decreased uptake of 99mTc-GSA (Fig. S3C) in the fibrotic liver were caused by inflammation and hepatic injury, respectively. Both changes in radioactivity accumulation in the liver do not reflect the degree of fibrosis directly and therefore cannot be used for liver fibrosis diagnosis.
The labeling of 99mTc-GlcNAc-PEI is simple and quick. GlcNAc-PEI was successfully radiolabeled with 99mTc using the multi-amino structure of PEI at room temperature with a high radiolabeling efficiency and radiochemical stability. All the advantages of 99mTc-GlcNAc-PEI might be beneficial for it to be used in the clinic. Since PEI is a good siRNA delivery system, GlcNAc-PEI/siRNA could be used to effectively treat liver fibrosis by targeting HSCs19. Using the competitive binding assay and blocking SPECT imaging, we clearly demonstrated that 99mTc-GlcNAc-PEI could specifically target HSCs, leading to their activation in fibrotic mice. Immunohistology studies of the liver tissue of fibrotic mice showed that GlcNAc-PEI could co-localize with desmin and α-SMA. Using the saturation binding assay, we found that 99mTc-GlcNAc-PEI had a much higher desmin-binding affinity than untargeted 99mTc-PEI-1800.
Interestingly, a very high spleen uptake was found in both SPECT imaging and the biodistribution of 99mTc-GlcNAc-PEI that could not be blocked by the co-injection of cold compound. In the SPECT imaging study, the spleen uptake values in the control and blocking groups were 28.46 ± 2.54%/cc vs 25.40 ± 1.58%/cc (P = 0.15, Fig. 4A), respectively, indicating non-specific uptake. Although the exact mechanism is not clear, it may be related to the lymphocyte activation in the spleen based on the reports that GlcNAc modification of protein may play an important role in lymphocyte activation21.
There were several other radiotracers reported to image liver fibrosis in mouse or rat models. Asialoglycoprotein (ASGP) receptor-targeting radiotracers have been used to assess liver fibrosis by quantifying hepatic function after liver injury22,23. Although these ASGP-R-targeting radiotracers were useful in detecting advanced fibrosis and cirrhosis, they might be not very sensitive in the detection of early and mild fibrosis because they assess liver fibrosis by measuring hepatic function, which did not directly reflect the degree of fibrosis. Furthermore, a series of RGD peptide-based radiotracers had been developed for SPECT imaging by targeting active HSCs24,25. Regarding HSC-target radiotracers, they could reliably reflect the degree of fibrosis and detect early fibrosis. However, the high uptake of those radiotracers in the kidney influenced the quality of liver images and was not good for the quantitation of hepatic uptake. Compared with these previously reported radiotracers, we developed a new agent of 99mTc-GlcNAc-PEI by specifically targeting desmin and vimentin to activate HSCs, reflecting liver fibrosis directly and could be used to detect liver fibrosis as early as 4 weeks after CCl4 treatment. Furthermore, there was a very high binding affinity and lower kidney uptake of 99mTc-GlcNAc-PEI ensuring the high quality of SPECT/CT image which might be beneficial to diagnose early and mild hepatic fibrosis in the clinical setting.
In addition to monitoring the progression of liver fibrosis induced by CCl4 treatment, we also investigated whether 99mTc-GlcNAc-PEI SPECT/CT imaging could be used to monitor the response of drug treatment. Although removing the causative agent is thought to be the most effective intervention in the treatment of liver fibrosis26,27, it is difficult to remove the causative agent of liver diseases (for example, HCV and fatty liver). As reported by Wynn et al.28, macrophages produce profibrotic mediators that directly activate fibroblasts, including transforming growth factor-β1 (TGF-β1) and platelet-derived growth factor (PDGF), and control the ECM turnover by regulating the balance of various matrix metalloproteinases (MMPs) and tissue inhibitors of matrix metalloproteinases (TIMPs). Considering that clodronate could deplete macrophages in the liver29, we used clodronate liposomes to treat liver fibrosis. The results of our study suggested that treatment with clodronate can degrade collagen fibers and reduce liver fibrosis. In the meantime, hepatic uptake of 99mTc-GlcNAc-PEI was obviously decreased in the fibrotic mice after treatment with clodronate. Therefore, 99mTc-GlcNAc-PEI SPECT imaging could be a useful method in monitoring the response to treatment in live fibrosis.
Conclusion
Here, we demonstrated that the non-invasive method based on SPECT/CT imaging with 99mTc-GlcNAc-PEI can be used to monitor fibrosis progression and evaluated the efficacy of anti-fibrotic drugs in a mouse model. SPECT/CT imaging with 99mTc-GlcNAc-PEI may be a potential strategy for noninvasive diagnosis of hepatic fibrosis in the clinic.
Materials and methods
Synthesis of GlcNAc-PEI
GlcNAc-PEI was synthesized according to a previous report with slight modifications30. Briefly, chitobiose (0.1 g) was dissolved in 20% aqueous methanol and was mixed with 0. 285 g of iodine. Next, 1 mol/L of potassium hydroxide solution was slowly dropped into the mixture until the iodine color completely disappeared. Thereafter, the solution was concentrated in vacuo to produce crude chitobionic acid. The 25 mol% chitobionic acid solution was then reacted with PEI-1800 (Sigma-Aldrich, St Louis, MO, USA) using water-soluble carbodiimide [1-ethyl-3-3(-dimethylaminopropyl)carbodiimide hydrochloride (EDC) (Sigma-Aldrich, St Louis, MO, USA) as a coupling agent, under stirring at room temperature. After stirring at room temperature for 24 h, the solution was dialyzed for 48 h using a dialysis membrane with a cutoff of 2500 Da.
Radiolabeling and stability studies
Briefly, 100 μg/100 μL of GlcNAc-PEI and 20 μL of SnCl2 (2 mg/mL in 0.1 M HCl) were mixed in a vial. Next, 185~370 MBq of freshly Na99mTcO4 obtained from Zhongshan Hospital affiliated with Xiamen University was added to the mixture. The reaction mixture was then allowed to incubate at room temperature for 30 min to obtain the resulting radiotracer 99mTc-GlcNAc-PEI. The labeling efficiency of 99mTc-GlcNAc-PEI was determined by instant thin-layer chromatography (ITLC). The chromatography analyses were performed on ITLC silica gel strips (Pall Life Sciences, Ann Arbor, MI, USA) with acid-citrate-dextrose buffer (0.068 M citrate, 0.074 M dextrose, pH 5.0) as a mobile phase. The stability of the radiotracer was tested in the same way after incubation in saline or mice serum at 37 ºC for 4 h. Next, all the strips were detected using a Mini-Scan radio-TLC Scanner (BioScan, Poway, CA, USA).
Liver fibrosis mouse model and antifibrotic therapy
CCl4 (Sigma Aldrich, St Louis, MO, USA) was used to produce hepatic fibrosis in mice. Briefly, CCl4 was dissolved in olive oil (1:4), and 5 mL/kg body weight of CCl4 solution was injected intraperitoneally into 6-week-old female C57BL/6 mice twice a week for 4 or 8 weeks. Control group was administered with same doses of olive oil (n = 5 for each group). All the mice were obtained from the Laboratory Animal Center of Xiamen University. All animal care and experiments were approved by Xiamen University's animal care and use committee.
Clodronate liposome (Clodrosome, Brentwood, TN, USA) was used for the treatment of liver fibrosis. The 8 weeks CCl4-induced fibrotic mice (n = 5) were administered with 5 mL/kg clodronate liposome by tail-vein injection once a week for 2 weeks. The control group was administered the same doses of PBS liposome (n = 5). All the mice were imaged one week after the last injection to avoid the acute effects of CCl4.
SPECT/CT Imaging
SPECT/CT imaging was performed using a pinhole collimator microSPECT/CT scanner (Mediso, Budapest, Hungary) and standard animal scan procedures. Static SPECT/CT imaging of fibrotic (CCl4-4 W and CCl4-8 W) and control mice (n = 4 for each group) were performed at 30 min after tail-vein injection of 18.5 MBq of 99mTc-GlcNAc-PEI. The animals were anesthetized by 2% isoflurane during SPECT imaging. Blocking experiments were performed with the co-injection of an excess dose of GlcNAc-PEI (500 μg). The LUV derived from SPECT/CT imaging was used to assess the stage of liver fibrosis. The LUV was calculated by dividing the radioactivity of the whole liver by the total inject radioactivity and whole liver volume as previously described31.
Biodistribution
To determine the binding of 99mTc-GlcNAc-PEI in liver tissues of fibrotic mice, we divided the mice were divided into 3 groups (control, and CCl4-4 W and CCl4-8 W fibrotic mice, n = 3 for each group). Each mouse was injected with 37 kBq/100 μL of 99mTc-GlcNAc-PEI via the tail vein. The mice were sacrificed under ether narcotization 30 min after injection. Organs and tissues of interest were collected and weighed. The radioactivity of the organs and tissues was measured using a gamma counter (WIZARD 2480, Perkin-Elmer, Downers Grove, IL, USA). The percentage of the injected dose per gram (%ID/g) of organs and tissues was calculated.
Immunofluorescent assay
After imaging, the livers of the control and fibrotic mice were frozen in CRYO GLUE tissue embedding medium (SLEE medical GmbH, Mainz, GER) and were stored in a -80 °C freezer. Subsequently, the specimens were cut into 7-μm slices. The liver tissues were fixed using 4% paraformaldehyde for 10 min. The liver tissues were blocked with 1% bovine serum albumin (BSA) for 30 min, incubated with monoclonal desmin antibodies (1:150 dilution, Abcam, Shanghai, CN), vimentin antibodies (1:100 dilution, Abcam) or α-SMA antibodies (1:100 dilution, Abcam) at 4 °C overnight, and then incubated with FITC-conjugated secondary antibodies (1:200 dilution, Sigma-Aldrich, St Louis, MO, USA) and GlcNAc-PEI-Cy5.5 for 30 min at room temperature. The cell nuclei were stained with 4,6-diamidino-2-phenylindole (DAPI) solution for 10 min. Images were captured by a confocal microscope (FV1200, Olympus, Aizu, JPN).
Radioactive competitive binding assay
Mouse HSCs were isolated from fibrotic mice as previously reported32. Briefly, mouse HSCs were harvested and seeded in 24-well plates at 105 cells per well. Twenty-four hours later, the cells were washed twice with binding buffer (phosphate buffer solution with 0.5% BSA) and for 1 h at 37 °C with 1.85 kBq of 99mTc-GlcNAc-PEI. Blocking group was performed with co-incubation with 500 nM GlcNAc-PEI. After incubation, the cells were washed twice with binding buffer and solubilized with 1 N NaOH. Radioactivity of the cell was measured with a gamma counter (WIZARD 2480, Perkin-Elmer, Waltham, MA, USA).
Saturation binding assay
Briefly, 0.5 mL of 2 μM recombinant human desmin protein (ARP, Waltham, MA, USA) or vimentin protein from bovine lens (ARP) was incubated for 1 h on ice with increasing concentrations of 99mTc-GlcNAc-PEI or 99mTc-PEI-1800 from 0 to 1,000 nmol/L. After incubation, unbound ligand was removed using an Amicon® Ultra-4 10K centrifugal filter (Merck Millipore, Co. Cork, IRL) by centrifugation for 10 min at 1,000 g, and radioactivity was measured in a γ-counter. The data were analyzed using GraphPad Prism 5.
Tissue analysis
Liver tissue was embedded in paraffin, after fixation with paraformaldehyde. Subsequently, the specimens were cut into 5-μm-thick sections and were stained with Sirius Red according to standard procedures. Hydroxyproline in liver tissue was quantified by HPLC analysis according to previous reports33.
Statistical analysis
Quantitative data are presented with error bars as the means ± SD. Statistical differences among groups were determined by Student's t-test. The Pearson correlation coefficient was computed to measure the linear relationship between two quantitative variables, and significance was evaluated by two-tailed test. Differences were considered significant when P values were less than 0.05.
Abbreviations
ECM: extracellular matrix; HSC: hepatic stellate cells; GlcNAc: N-acetylglucosamine; SPECT: single photon emission computed tomography; PEI: polyethylenimine; CCl4: carbon tetrachloride; LUV: Liver uptake value; ROI: region of interest; a-SMA: α smooth muscle actin; RCP: radiochemical purity; ASGP: asialoglycoprotein; TGF-β1: transforming growth factor-β1; PDGF: platelet-derived growth factor; MMPs: matrix metalloproteinases; TIMPs: tissue inhibitors of matrix metalloproteinases; EDC: [1-ethyl-3-3(-dimethylaminopropyl)carbodiimide hydrochloride; ITLC: instant thin-layer chromatography; %ID/g: injected dose per gram; BSA: bovine serum albumin; DAPI: 4,6-diamidino-2-phenylindole.
Supplementary Material
Supplementary figures and methods.
Acknowledgements
This study was financially supported by the National Key Basic Research Program of China (2014CB744503), National Natural Science Foundation of China (21271030, 81471707) and Scientific Research Foundation of State Key Laboratory of Molecular Vaccinology and Molecular Diagnostics (2016ZY002).
Competing Interests
The authors have declared that no competing interest exists.
References
1. Friedman SL. Mechanisms of hepatic fibrogenesis. Gastroenterology. 2008;134:1655-1669
2. Bataller R, Brenner DA. Liver fibrosis. J Clin Invest. 2005;115:209-218
3. Guido M, Rugge M, Chemello L. et al. Liver stellate cells in chronic viral hepatitis: the effect of interferon therapy. J Hepatol. 1996;24:301-307
4. Friedman SL. Liver fibrosis - from bench to bedside. J Hepatol. 2003;38:38-53
5. Reeves HL, Burt AD, Wood SJ. et al. Hepatic stellate cell activation occurs in the absence of hepatitis in alcoholic liver disease and correlates with the severity of steatosis. J Hepatol. 1996;25:677-683
6. Rockey DC, Caldwell SH, Goodman ZD. et al. American Association for the Study of Liver D. Liver biopsy. Hepatology. 2009;49:1017-1044
7. Manning DS, Afdhal NH. Diagnosis and quantitation of fibrosis. Gastroenterology. 2008;134(6):1670-1681
8. Polasek M, Fuchs BC, Uppal R. et al. Molecular MR imaging of liver fibrosis: a feasibility study using rat and mouse models. J Hepatol. 2012;57:549-555
9. Friedrich-Rust M, Ong MF, Martens S. et al. Performance of transient elastography for the staging of liver fibrosis: a meta-analysis. Gastroenterology. 2008;134:960-974
10. Poynard T, Vergniol J, Ngo Y. et al. Staging chronic hepatitis C in seven categories using fibrosis biomarker (FibroTest) and transient elastography (FibroScan(R)). J Hepatol. 2014;60:706-714
11. Ezetimibe for the treatment of nonalcoholic steatohepatitis. assessment by novel magnetic resonance imaging and magnetic resonance elastography in a randomized trial (MOZART trial). Hepatology. 2015;61(4):1239-1250
12. Cohen E, Afdhal NH. Ultrasound-based hepatic elastography: origins, limitations, and applications. J Clin Gastroenterol. 2010;44:637-645
13. Ise H, Kobayashi S, Goto M. et al. Vimentin and desmin possess GlcNAc-binding lectin-like properties on cell surfaces. Glycobiology. 2010;20:843-864
14. Komura K, Ise H, Akaike T. Dynamic behaviors of vimentin induced by interaction with GlcNAc molecules. Glycobiology. 2012;22:1741-1759
15. Niki T, Pekny M, Hellemans K. et al. Class VI intermediate filament protein nestin is induced during activation of rat hepatic stellate cells. Hepatology. 1999;29:520-527
16. Kim SJ, Ise H, Goto M. et al. Interactions of vimentin- or desmin-expressing liver cells with N-acetylglucosamine-bearing polymers. Biomaterials. 2012;33:2154-2164
17. Puche JE, Saiman Y, Friedman SL. Hepatic stellate cells and liver fibrosis. Arch Pathol Lab Med. 2013;3:1473
18. Kim SJ, Ise H, Kim E. et al. Imaging and therapy of liver fibrosis using bioreducible polyethylenimine/siRNA complexes conjugated with N-acetylglucosamine as a targeting moiety. Biomaterials. 2013;34:6504-6514
19. Yoshida M, Shiraishi S, Sakaguchi F. et al. A quantitative index measured on (9)(9)mTc GSA SPECT/CT 3D fused images to evaluate severe fibrosis in patients with chronic liver disease. Jpn J Radiol. 2012;30:435-441
20. Popov Y, Schuppan D. Targeting liver fibrosis: Strategies for development and validation of antifibrotic therapies. Hepatology. 2009;50:1294-1306
21. Kearse KP, Hart GW. Lymphocyte activation induces rapid changes in nuclear and cytoplasmic glycoproteins. Proc Natl Acad Sci U S A. 1991;88:1701-1705
22. Sorensen M, Mikkelsen KS, Frisch K. et al. Regional metabolic liver function measured in patients with cirrhosis by 2-[(1)(8)F]fluoro-2-deoxy-D-galactose PET/CT. J Hepatol. 2013;58:1119-1124
23. Taniguchi M, Okizaki A, Watanabe K. et al. Hepatic clearance measured with (99m)Tc-GSA single-photon emission computed tomography to estimate liver fibrosis. World J Gastroenterol. 2014;20:16714-16720
24. Li F, Song Z, Li Q. et al. Molecular imaging of hepatic stellate cell activity by visualization of hepatic integrin alphavbeta3 expression with SPECT in rat. Hepatology. 2011;54:1020-1030
25. Guo Z, Gao M, Zhang D. et al. Simultaneous SPECT imaging of multi-targets to assist in identifying hepatic lesions. Sci Rep. 2016;6:28812
26. Pares A, Caballeria J, Bruguera M. et al. Histological course of alcoholic hepatitis. Influence of abstinence, sex and extent of hepatic damage. J Hepatol. 1986;2:33-42
27. Arthur MJP. Reversibility of liver fibrosis and cirrhosis following treatment for hepatitis C. Gastroenterology. 2002;122:1525-1528
28. Wynn TA, Barron L. Macrophages: master regulators of inflammation and fibrosis. Semin Liver Dis. 2010;30:245-257
29. Navarro LA, Wree A, Povero D. et al. Arginase 2 deficiency results in spontaneous steatohepatitis: a novel link between innate immune activation and hepatic de novo lipogenesis. J Hepatol. 2015;62:412-420
30. Kim SJ, Ise H, Goto M. et al. Gene delivery system based on highly specific recognition of surface-vimentin with N-acetylglucosamine immobilized polyethylenimine. Biomaterials. 2011;32:3471-3480
31. Zhang D, Guo Z, Zhang P. et al. Simplified quantification method for in vivo SPECT/CT imaging of asialoglycoprotein receptor with (99m)Tc-p(VLA-co-VNI) to assess and stage hepatic fibrosis in mice. Sci Rep. 2016;6:25377
32. Miyahara T, Schrum L, Rippe R. et al. Peroxisome proliferator-activated receptors and hepatic stellate cell activation. J Biol Chem. 2000;275:35715-35722
33. Hutson PR, Crawford ME, Sorkness RL. Liquid chromatographic determination of hydroxyproline in tissue samples. J Chromatogr B. 2003;791:427-430
Author contact
![]() Corresponding author: Xianzhong Zhang, Professor, PhD, School of Public Health, Xiamen University, Xiang'an South Rd., Xiang'an district, Xiamen 361102, China. Phone/Fax: +86(592)2880645; E-mail: zhangxzhedu.cn.
Corresponding author: Xianzhong Zhang, Professor, PhD, School of Public Health, Xiamen University, Xiang'an South Rd., Xiang'an district, Xiamen 361102, China. Phone/Fax: +86(592)2880645; E-mail: zhangxzhedu.cn.