Impact Factor
- Issue 14; 2026
- Issue 13; 2026
- Issue 12; 2026
- Issue 11; 2026
- Issue 10; 2026
- Volume 16; 2026
- Advance Articles
- Past Issues
- Cover Images
- Cover Suggestion
- Index & Coverage
- Special Issues
Introduction
Materials and Methods
Results
Discussion
Abbreviations
Supplementary Material
Acknowledgements
References
International Journal of Biological Sciences
International Journal of Medical Sciences
 Global reach, higher impact

Theranostics 2018; 8(5):1312-1326. doi:10.7150/thno.21745 This issue Cite
Research Paper
Pharmacological Ascorbate Suppresses Growth of Gastric Cancer Cells with GLUT1 Overexpression and Enhances the Efficacy of Oxaliplatin Through Redox Modulation
Yun-Xin Lu1,2,*, Qi-Nian Wu1,2,*, Dong-liang Chen1,2,*, Le-Zong Chen1,2,*, Zi-Xian Wang1,2, Chao Ren1,2, Hai-yu Mo1, Ya Chen1, Hui Sheng1, Ying-Nan Wang1,2, Yun Wang1,2, Jia-Huan Lu1, De-shen Wang1,2, Zhao-lei Zeng1, Feng Wang1,2, Feng-Hua Wang1,2, Yu-Hong Li1,2, Huai-Qiang Ju1 ![]() , Rui-Hua Xu1,2
, Rui-Hua Xu1,2 ![]()
1. Sun Yat-sen University Cancer Center, State Key Laboratory of Oncology in South China, Collaborative Innovation Center for Cancer Medicine, Guangzhou, 510060, China;
2. Department of Medical Oncology, Sun Yat-sen University Cancer Center, Guangzhou, 510060, China;
*These authors contributed equally to this work.
Received 2017-7-3; Accepted 2017-11-16; Published 2018-2-2
Abstract

Rationale: The antitumor activity of high-dose ascorbate has been re-evaluated recently, but the mechanism underlying cell-specific sensitivity to ascorbate has not yet been clarified.
Methods: The effects of high-dose ascorbate on gastric cancer were assessed using cancer cell lines with high and low expression of GLUT1 via flow cytometry and colony formation assays in vitro and patient-derived xenografts in vivo.
Results: In this study, we demonstrated that gastric cancer cells with high GLUT1 expression were more sensitive to ascorbate treatment than cells with low GLUT1 expression. GLUT1 knockdown significantly reversed the therapeutic effects of pharmacological ascorbate, while enforced expression of GLUT1 enhanced the sensitivity to ascorbate treatment. The efficacy of pharmacological ascorbate administration in mice bearing cell line-based and patient-derived xenografts was influenced by GLUT1 protein levels. Mechanistically, ascorbate depleted intracellular glutathione, generated oxidative stress and induced DNA damage. The combination of pharmacological ascorbate with genotoxic agents, including oxaliplatin and irinotecan, synergistically inhibited gastric tumor growth in mouse models.
Conclusions: The current study showed that GLUT1 expression was inversely correlated with sensitivity of gastric cancer cells to pharmacological ascorbate and suggested that GLUT1 expression in gastric cancer may serve as a marker for sensitivity to pharmacological ascorbate.
Keywords: pharmacological ascorbate, gastric cancer, chemotherapy, reactive oxygen species, GLUT1
Introduction
Pharmacological (high-dose) ascorbate has long been recognized as an unorthodox therapeutic alternative in complementary medicine [1]. Cameron and Pauling reported that intravenous ascorbate supplementation (10 g/day) showed promising efficacy among terminal cancer patients[2, 3]. However, previous placebo-controlled clinical trials from the Mayo Clinic found no benefit of oral ascorbate at the same dose in treating advanced cancer[4, 5]. This discrepancy in literatures was associated with the different pharmacokinetics between oral and intravenous ascorbate supplementation [6, 7]. Several basic studies and clinical trials have shown that high-dose ascorbate was effective in several human cancers, including colorectal[8, 9], ovarian[10], pancreatic[11, 12], brain cancer[13] and leukemia[14, 15]. Therefore, the therapeutic potential of high-dose ascorbate in gastric cancer treatment is worth re-evaluating.
As the key determinant of antitumor effects, plasma concentration of ascorbate rarely exceeds 200 μΜ with oral intake[6, 7]. By contrast, ascorbate cytotoxicity requires much higher plasma concentrations, which could be easily established with safety when used intravenously[9, 10, 16]. The ascorbate-dependent decreases in cancer cell viability and tumor growth were attenuated after co-treatment with the antioxidant catalase[12] or N-acetylcysteine (NAC)[9], and this observation was consistent with the induction of reactive oxygen species (ROS)[8, 9, 12, 13]. Recently, Yun et al. reported that colorectal cancer cells harboring KRAS or BRAF mutations showed increased sensitivity to ascorbate treatment, which is associated with ROS accumulation[9]. Co-administration of glutathione, the principal antioxidant that protects cells against ROS, significantly reduced the therapeutic effects of high-dose ascorbate[17]. Interestingly, previous studies have revealed that increased cellular glutathione was associated with oxaliplatin or irinotecan resistance[18]. DNA damage caused by genotoxic agents, including oxaliplatin or irinotecan, leads to elevated ROS levels[19-21].
In this study, we found that GLUT1 expression affects the sensitivity of gastric cancer cells to pharmacological ascorbate. High-dose ascorbate significantly induced ROS elevation via depletion of the antioxidant glutathione and suppressed gastric cancer cells growth in vitro and in vivo. Combinational effects of pharmacological ascorbate with oxaliplatin were observed in the cell line-based and patient-derived xenograft (PDX) models.
Materials and Methods
Human tissue specimens
A cohort of 209 formalin-fixed, paraffin-embedded tissue samples collected from gastric cancer patients who underwent surgery at Sun Yat-sen University Cancer Center (Guangzhou, China) between 2007 and 2009 were retrieved. All patients underwent total or subtotal gastrectomy, and none of the patients received any treatment before surgery and had a histological diagnosis of gastric cancer. All patients were administered fluorouracil-, platinum- or taxol-based adjuvant chemotherapy if necessary. Each patient was followed-up regularly after the operation at three-month intervals. The median follow-up time was 49 months (range: 3 to 102 months). All clinicopathological information including age, gender, tumor size, differentiation status, lymph node invasion, venous invasion, perineural invasion and TNM stage were retrieved from patients' medical records. Fresh gastric cancer tissues and matched adjacent noncancerous tissues were obtained from 50 of the 209 patients and stored in liquid nitrogen until use. Written informed consent was obtained from each patient involved in this study and the study protocol was approved by the ethics committee of Sun Yat-sen University Cancer Center. In our cohort, the paired primary tumor tissues and lymphatic metastases of 126 patients and the paired adjacent non-tumorous tissues, primary tumor tissues and distant metastasis of 38 patients were available.
Cell lines and cell culture
GES1, AGS, SGC7901 (originally purchased from American Type Culture Collection on July 2014) and HGC27, MGC803 (originally purchased from the Institute of Basic Medical Sciences of the Chinese Academy of Medical Sciences on June 2014) were cultured in RPMI-1640 or DMEM medium (Invitrogen, Carlsbad, California, USA) supplemented with 10% fetal bovine serum (HyClone, Logan, Utah, USA) at 37°C with 5% CO2 according to the suppliers' instructions. For ascorbate treatment assays, all cells were prepared in RPMI-1640 medium supplemented with 10% fetal bovine serum. For glucose competition assays, glucose free RPMI-1640 medium and glucose power (Life Technologies, Carlsbad, USA) were used. All cells were authenticated by cell morphology and short tandem repeat DNA fingerprinting with the AmpF/STR Identifier Kit (Applied Biosystems) and tested for mycoplasma and cell vitality before use at the Medicine Lab of the Forensic Medicine Department of Sun Yat-sen University (Guangzhou, China). The last cell characterization with above methods was performed on October 2016. The passage numbers of GES1, AGS, SGC7901, HGC27 and MGC803 were 8, 12, 11, 9 and 11, respectively. All cell lines have not been passaged for more than 6 months in our study after resuscitation.
Reagents and antibodies
Ascorbate was purchased from Sigma Aldrich (Sigma-Aldrich, St. Louis, USA) and freshly prepared in distilled water at 0.5M before use. Dithiothreitol, diethylenetriamine-pentaacetic acid (DTPA) and desferrioxamine (DFO) were purchased from Sigma Aldrich (Sigma-Aldrich, St. Louis, USA). NAC, catalase, oxaliplatin and irinotecan were purchased from Selleck Chemicals (Houston, TX, USA). 2',7'-dichlorofluorescein diacetate (DCF-DA) was purchased from Life Technologies (Invitrogen, Carlsbad, California, USA) and dissolved in dimethyl sulfoxide (Sigma-Aldrich, St. Louis, USA). Antibodies used for immunoblotting include anti-γ-H2AX, anti-β-Actin, anti-cleaved caspase 3 (Cell Signaling Technology, Beverly, MA, USA), anti-GLUT1, Alexa Fluor® 647-conjugated anti-GLUT1, anti-GLUT3, anti-GLUT4, anti-SVCT1, anti-SVCT2, anti-Na+/K+ ATPase, anti-Vinculin and anti-Ki67 (Abcam, Cambridge, Massachusetts, USA).
Cell apoptosis and ROS analysis
Cell apoptosis was detected with an Annexin V/propidium iodide (PI) dual labeling kit (KeyGEN, Nanjing, China) as previously reported[22]. The intracellular ROS level was detected with DCF-DA. Briefly, cells in the exponential phase were seeded in 12 well plates at a density of 200,000 to 300,000 cells per well. After 24h, the medium was removed, and the cells were washed with PBS before treatment with indicated chemicals. To determine the effects of red blood cells (RBCs) on ascorbate-induced apoptosis, RBC were prepared by centrifugation of heparinized human blood at 500g for 30 min. Gastric cancer cells were mixed with red RBC at 25% hematocrit. Cell mixtures were treated with ascorbate for 2h. After 24h, the RBCs were gently washed and cell apoptosis was determined as above. Gastric cancer cells were pretreated with DFO (200μM) and DTPA (1mM) for 3h before addition of ascorbate (4mM), cell apoptosis was evaluated 24h later as described above.
For ascorbate treatment, cells were treated with ascorbate for indicated times (2h or 1h), washed and incubated with ascorbate-free medium for another 22h or 5h for apoptosis or ROS analysis, respectively. After treatment, the cells were incubated with DCF-DA at 37℃ for 30 min. Then the cells were trypsinized and resuspended with PBS, and the data were acquired with a Gallio flow cytometer (Beckman Coulter, California, USA) and analyzed with Flow Jo analytical software. Fluorescence of GLUT1 was detected according to the manufacturer's instructions.
Cell proliferation and colony formation assay
Cell viability was measured with MTS (Qiagen, Hilden, German) according to the manufacturer instructions. The absorbance was measured at a wavelength of 490nm. Ascorbate treatment was conducted according to a previous report[23]. Colony formation assay was carried out as described previously[22]. Briefly, cells were seeded in 6-well-plates at a density of 500 cells per well. After 48h, indicated chemicals were added to the medium. The cells were further cultured for 10-14 days and the colonies were fixed in methanol and stained with 0.2% crystal violet.
Immunoblotting and immunohistochemistry (IHC)
Cells were collected and lysed with radioimmunoprecipitation (RIPA) buffer for protein extraction and separated by SDS-PAGE as previously described[22]. The paraffin-embedded tissue blocks were cut into 4μm slides. A rabbit anti-GLUT1 antibody (ab115730) was used for immunostaining. Briefly, the sections were dewaxed by xylene and ethanol, incubated with 0.3% H2O2 solution for 10 min to block the endogenous peroxidase activity and heated at 95℃ for 10 min in a microwave oven for antigen retrieval. The sections were then incubated with antibodies against GLUT1 (1:500) at 4℃ overnight. The staining was performed using an IHC kit (Dako, Copenhagen, Denmark). In the present study, we assessed and scored both the extent and intensity of GLUT1 immunoreactivity. The extent of immunoreactivity ranged from 0 to 3 based on the percentage of cells that had positive staining in each microscopic field of view (0, <25%; 1, 25-50%; 2, 50-75%; 3, 75-100%), while the intensity scores were as follows: 0, negative staining; 1, weak staining; 2, moderate staining; 3, strong staining. The extent and intensity of membranous GLUT1 scoring were also evaluated. The total scores were obtained by multiplying the scores of extent and intensity.
Measurement of ascorbate and dehydroascorbate (DHA)
Intracellular measurement of ascorbate and DHA was performed by LC/MS according to a previous report[9]. The cells and medium were collected immediately (T0) and 2h (T1) after ascorbate treatment and subjected to ascorbate and DHA measurement. The difference between values at T0 and that at T1 was considered as intracellular ascorbate or DHA level and normalized to that of control cells.
RNA extraction and qPCR analysis
Total RNA was obtained using TRIzol reagent (Life Technologies, Carlsbad, USA) according to the manufacturer's instructions. The mRNA expression level was measured by qPCR analysis as previously described[24]. Specific primers were synthesized by Thermo Fisher Scientific, and the sequences are shown in the Supplementary Table S1.
Stable cell lines construction
The shRNA targeting GLUT1 and lentivirus expressing human cDNA encoding GLUT1 were purchased from GenePharma (Shanghai, China). The indicated cell lines were transfected with lentivirus and selected with puromycin.
GSH, GSH/GSSG and NADP+/NADPH analysis
The intracellular levels of glutathione were measured with a GSH-Glo™ kit (Promega, Madison, WI, USA). Briefly, cells in the exponential phase were seeded in a 96-well plate at a density of 8,000 cells per well. After 24h, the indicated chemicals were added. After treatment, 100μl of 1× GSH-Glo™ Reagent was added to the 96-well plate followed by removal of the medium after treatment. The cells were incubated for 30 min at room temperature with slight shaking. Then, equal volumes of reconstituted luciferin detection reagent were added to each well, and samples were incubated for an additional 15 min at room temperature. Luminescence was detected with a Synergy™ Multi-Mode Microplate Reader. The intracellular levels of oxidized glutathione, total glutathione, NADP+ and NADPH were measured with a GSH/GSSG-Glo™ kit and a NADP/NADPH-Glo™ kit (Promega, Madison, WI, USA) according to the manufacturers' instructions.
Glycolytic activity and ATP level analysis
The cellular glucose uptake and lactate production levels were analyzed with a SBA40C Biosensor (Biology Institute of Shandong Academy of Science, Jinan, China). The cellular ATP levels were measured using a Cell Titer-Glo® Luminescent Cell Viability Assay kit (Promega, Madison, USA) according to the manufacturer's instructions. Briefly, cells grown in the exponential phase were plated in a 96-well black plate with a clear flat bottom (Costar, Corning, New York, USA) and treated with the indicated chemicals. A volume of Cell Titer-Glo® Reagent equal to that of cell culture medium present in each well was added to induce cell lysis. The luminescence was recorded with a Synergy™ Multi-Mode Microplate Reader. Also, caspase activity was measured by Caspase 3/7Glo assays (Promega, Madison, WI, USA) according to the manufacturer's protocol.
Animal study
For evaluation of the antitumor effects of pharmacological ascorbate, female BALB/c nude mice (4-5 weeks old) from the Beijing Vital River Laboratory Animal Technology Co., Ltd (Beijing, China) were used. AGS cells (1×10⁷/mice) were subcutaneously inoculated into the right armpit of the nude mice. When the mean tumor volume was around 100mm3, the mice were randomly assigned into the following different groups: control, PBS; ascorbate, 4g/kg, twice per day; oxaliplatin, 10mg/kg, once per week; irinotecan, 20mg/kg, once per week; combined, oxaliplatin, 10mg/kg, once per week or irinotecan, 20mg/kg, once per week with ascorbate, 4g/kg, twice per day. Tumor volumes was measured every three days using a caliper and was calculated using the formula V=length×width2/2 and mouse weight were recorded twice weekly. After treatment for three weeks, the mice were sacrificed with cervical dislocation and the tumors were dissected out, embedded in paraffin and sectioned. Our animal study was approved by the Institutional Animal Care and Use Committee of Sun Yat-Sen University. Tumor tissues from the BALB/c nude mice were stained with H&E or immunohistochemically with Ki67 and cleaved caspase 3 using previously described protocols[22].
Generation of PDX models
Fresh gastric tumor samples were immediately transferred into the animal center in a sterile tube containing cold culture medium. Each sample was sliced into 3×3×3 mm3 fragments before they were subcutaneously inoculated into both flank of 4-week BALB/c nude mice. Tumor growth was monitored twice weekly and those successfully established PDX were nominated as passage 1 (P1). When the volume reached approximately 300mm3, the mouse was anaesthetized and the tumor was removed, spliced and transplanted subcutaneously into other mice to obtain the next generation (P2, P3). The mice bearing P3 grafts were used to test efficiency of pharmacological ascorbate and oxaliplatin. Written informed consent was obtained from patient providing fresh samples and the study protocol was approved by the ethics committee of Sun Yat-sen University Cancer Center. Our animal study was approved by the Institutional Animal Care and Use Committee of Sun Yat-Sen University.
Statistical analysis
All data are presented as the mean ± S.D. Statistical significance was assessed with Student's paired or unpaired t-tests or chi-square tests as appropriate. The Kaplan-Meier method was used to perform survival analysis, and the log-rank test was used to compare the differences between patient groups. Covariates with a P value less than 0.05 by univariate analysis were subject to multivariate analysis using the Cox proportional hazards model to identify independent prognostic factors for gastric cancer patients. For comparisons among more than two groups, one-way ANOVA and Newman Keul's multiple comparison tests were used with Graph Pad Prism software (San Diego, CA, USA). All differences were considered statistically significant with a value of P<0.05. CalcuSyn Biosoft (Ferguson, MO, USA) was used to calculate the combination index of different drugs.
Results
Ascorbate induces apoptosis and inhibits proliferation of gastric cancer cells
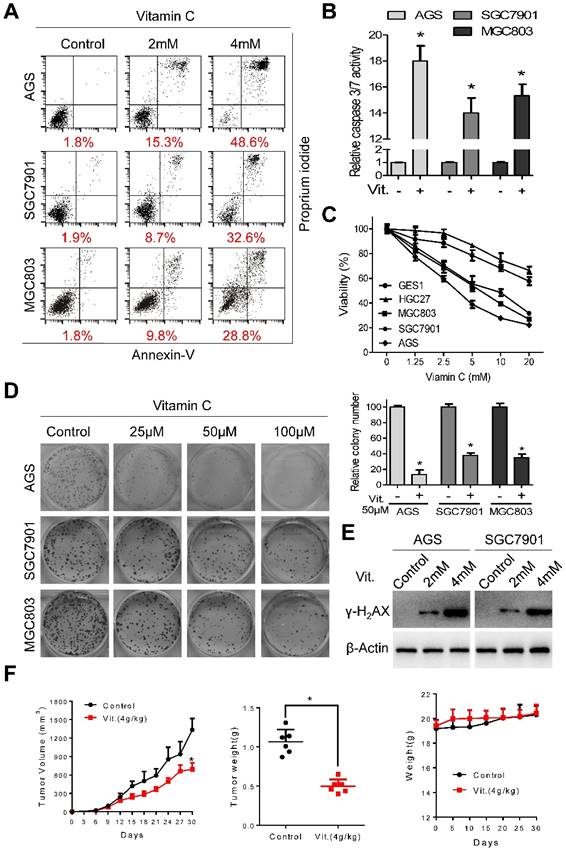
Ascorbate at 2 mM and 4 mM induced significant apoptosis in AGS, SGC7901, and MGC803 cells (Figure 1A). The percentages of apoptotic cells in the AGS, SGC7901, and MGC803 lines were 48.6%, 32.6%, and 28.8%, respectively, after treatment with ascorbate at 4 mM for 2 h (Figure 1A and S1A). The increased apoptotic percentage was accompanied by elevated caspase 3/7 activity (Figure 1B). Ascorbate at a concentration range of 0-20 mM for 2 h significantly reduced the viability of AGS, SGC7901 and MGC803 cells, while the viability of HGC27 and GES1 cells was only marginally reduced (Figure 1C), indicating that the cytotoxic effects of ascorbate were cell-specific. Ascorbate reduced the intracellular ATP levels of AGS, SGC7901 and MGC803 cells (Figure S1B). Moreover, ascorbate at relatively low levels (25 μM, 50 μM, 100 μM) markedly decreased colony formation of AGS, SGC7901, and MGC803 cells in a concentration-dependent manner (Figure 1D). Pharmacological ascorbate was reported to induce DNA damage in cancer cells[8, 25, 26]. Expression of γ-H2AX, a marker of DNA double-strand breaks, was elevated after exposure to ascorbate (Figure 1E and S1C). Furthermore, in the subcutaneous xenograft nude mouse model, ascorbate significantly suppressed growth of tumor xenografts, with the tumor weight of high-dose ascorbate-treated mice significantly less than that of the PBS-treated group (Figure 1F). The mean tumor volume for the PBS-treated mice increased from 23.18±11.39 to 1335±457 mm3, whereas the volume for high-dose ascorbate-treated mice increased from 24.58±10.38 to 671.45±259.85 mm3 (Figure 1F). By contrast, there was no significant body weight loss in the experimental animals (Figure 1F). Immunostaining of Ki67 and cleaved caspase 3 in the tumor sections was also consistent with the in vitro results (Figure S1D).
Ascorbate induces apoptosis and inhibits proliferation of gastric cancer cells. (A) Representative images of cell apoptosis in the indicated cells treated with ascorbate (Vitamin C, 2h) were determined by Annexin V/propidium iodide (PI) assays. (B) Activity of caspase3/7 in the indicated cells treated with ascorbate (4mM) for 2h was measured. (C) The cell viability of the indicated cells incubated with ascorbate (2h) was determined by MTS assays. (D) Images (left panel) and quantification (right upper panel) of the indicated cells treated with ascorbate were analyzed in colony formation assays. (E) Immunoblotting of γ-H2AX in the indicated cells after treatment with ascorbate for 2h. β-Actin was used as a loading control. (F) The volume of the xenografted tumors in the nude mice and the weight of the excised tumors were measured and recorded, and a tumor growth curve was created for each group. Weight of the mice was also recorded. Data in B, C, D and F are presented as mean ±S.D. (n = 4 for B, C, D and n = 6 for F). *P < 0.05 versus control.
Ascorbate induces ROS accumulation and depletes glutathione
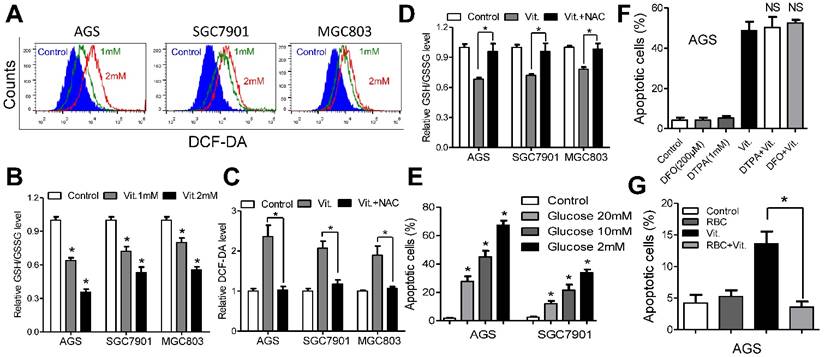
We used the fluorescent probe DCF-DA to monitor intracellular ROS levels in the presence and absence of ascorbate. As shown in Figures 2A and S2A, the ascorbate-treated cells had significantly higher ROS levels than the control cells, and the levels increased in a dose-dependent manner. As glutathione is the major antioxidant for ROS detoxification, we postulated that ascorbate may deplete intracellular glutathione. To test our hypothesis, we used spectrophotometric analysis to evaluate the role of ascorbate in regulating cellular glutathione level. As expected, ascorbate-treated cells (1 mM for 1 h) displayed an approximately 30%-40% reduction in the ratio of reduced to oxidized glutathione (Figure 2B) and NADPH/NADP+ (Figure S2B). However, pretreatment with NAC significantly decreased the ROS and increased the glutathione levels (Figure 2C and 2D). Consistently, NAC or catalase protected cells against apoptosis (Figure S2C) and decreased caspase 3/7 activity (Figure S2D) in AGS and SGC7901 cells. The antitumor effects of ascorbate have been reported to be influenced by glucose concentration[9] or redox-active metals such as iron[13, 16]. The percentage of apoptosis in AGS and SGC7901 cells was inversely correlated with glucose content in the medium (Figure 2E). Conversely, ascorbate induced high levels of apoptosis independent of metal chelators such as DFO or DTPA (Figure 2F and S2E), while coculture with RBCs completely reversed the pro-apoptotic effects of ascorbate in AGS and SGC7901 cells (Figure 2G and S2F).
Ascorbate induces ROS accumulation and depleted intracellular glutathione. (A) Representative histograms of ROS contents in the presence and absence of ascorbate (1mM or 2mM for 1h) in the indicated cells as detected by the fluorescent probe DCF-DA. (B) Intracellular ratio between reduced and oxidized glutathione in the indicated cells treated with ascorbate (1mM or 2mM) for 1h was measured by spectrophotometric analysis. (C) DCF-DA levels in the indicated cells pretreated with or without NAC followed by ascorbate (1mM for 1h) treatment. (D) Reversion of intracellular glutathione following NAC treatment. The indicated cells were treated with 3mM NAC for 2h, followed by ascorbate at 1mM for 1h before they were submitted to spectrophotometric analysis. (E) Apoptosis of the indicated cells treated with ascorbate (4mM, 2h) in medium with different glucose concentrations were determined by flow cytometry. (F) Apoptosis analysis of AGS cells treated with DFO (200μM) and DTPA (1mM) for 3h followed by 2h exposure to ascorbate (4mM) in the continued presence of these chelators. (G) Apoptosis analysis of AGS cells in the presence or absence of red blood cells (RBC) at 25% hematocrit treated with ascorbate at 2mM for 2h. Data in B, C, D, E, F and G are presentedas mean ±S.D. (n = 4). *P < 0.05 versus control; NS, non-significant.
GLUT1 affects sensitivity of gastric cancer to pharmacological ascorbate
Colorectal cancer cells exhibiting elevated glycolytic activity are selectively killed by ascorbate, which is transported to the cytosol by GLUT1[9]. We therefore analyzed the glycolytic activity and GLUT1 expression in a panel of gastric cancer cells and GES1 gastric epithelial cells. The results showed that glucose intake and lactate production in AGS, SGC7901, and MGC803 cells were significantly higher than those in GES1 and HGC27 cells (Figure S3A). Additionally, qPCR analysis demonstrated overexpression of key metabolic enzymes participating in glycolysis, including HK2, Aldolase, PFK1, PKM2 and LDH-A in AGS, SGC7901 and MGC803 gastric cancer cells compared with that in HGC27 and GES1 cells (Figure S3B). Interestingly, the glycolysis-inactive HGC27 cells were resistant to ascorbate treatment (Figure S3C and S3D). Transporters of ascorbate include GLUT1, GLUT3, SVCT1 and SVCT2. We further analyzed the expression of these transporters at both the mRNA and protein levels. Although upregulated expression of SVCT1, SVCT2, GLUT3 and GLUT4 was observed in cancer cells compared with that in GES1 cells (Figure S3E-I), only GLUT1 level in gastric cancer cells (Figure 3A and S3J) correlated with sensitivity to ascorbate.
GLUT1 affects antitumor activity of ascorbate in gastric cancer cells. (A) Immunoblotting of GLUT1 in the indicated cells. β-Actin was used as a loading control. (B) Attenuation of elevated intracellular ROS level induced by ascorbate (2mM, 1h) after GLUT1 knockdown in the indicated cells. (C) Effect of GLUT1 knockdown on sensitivity of the indicated cells to ascorbate detected by colony formation assays. Gastric cancer cells with GLUT1 knockdown or control cells were plated and treated with ascorbate at 50μM. (D) Growth curve of xenografts after ascorbate treatment in AGS cells with GLUT1 knockdown. (E) Intracellular ROS level after ascorbate treatment (2mM, 1h) in HGC27 cells with enforced GLUT1 expression. (F) Growth curve of xenografts after ascorbate treatment in HGC27 cells with enforced GLUT1 expression. (G) Apoptosis analysis of AGS and SGC7901 cells treated with DHA or stabilized ascorbate. (H-J) Mass spectra analysis of intracellular ascorbate or DHA in gastric cancer cells after manipulation of GLUT1 expression. Cells were treated with 4mM vitamin C for 2h before measurement of ascorbate or DHA. Data in B, C, D, E, F, G, H, I and J are presented as mean ±S.D. (n = 3 in B, C, E, G, H, I, J and n=6 in D, F). *P < 0.05 versus control; NS, non-significant.
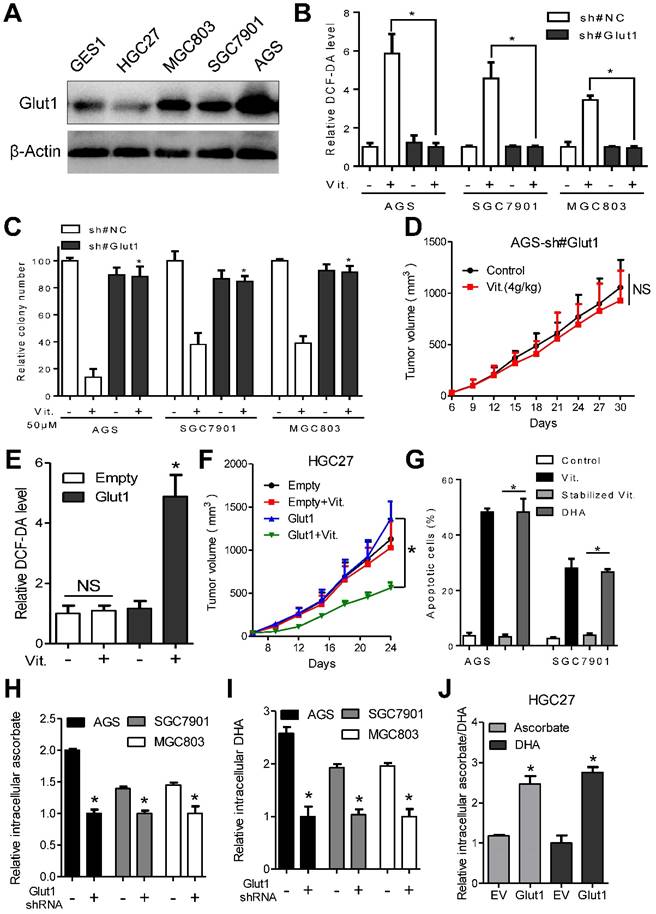
Overexpression of GLUT1 was observed in the ascorbate-sensitive AGS, SGC7901 and MGC803 cells at both the mRNA and protein levels, while the relatively resistant GES1 and HGC27 cells had low GLUT1 expression (Figure 3A and S3J). We further assessed whether the difference in sensitivity to ascorbate is dependent on GLUT1 levels. For this purpose, AGS, SGC7901 and MGC803 cells with high GLUT1 expression were transfected with specific shRNAs before incubation with ascorbate, and GLUT1 was overexpressed in HGC27 cells. Western blot and flow cytometry analysis showed that membranous GLUT1 was depleted in AGS, SGC7901, and MGC803 cells and overexpressed in HGC27 cells after artificial manipulation (Figure S4A and S4B). As shown in Figure 3B and 3C, depletion of GLUT1 in AGS, SGC7901 and MGC803 cells completely reversed the elevated ROS induced by ascorbate and attenuated the anti-proliferative effects of ascorbate. In the subcutaneous nude mouse model, xenografts formed by cells after knockdown of GLUT1 showed decreased sensitivity to pharmacological ascorbate treatment (Figure 3D). Next, we examined the effects of GLUT1 overexpression in HGC27 cells. Enforced GLUT1 expression in HGC27 cells resulted in elevated ROS levels compared with those in control cells after ascorbate treatment (Figure 3E). Ascorbate significantly suppressed colony formation (Figure S4C) and induced DNA damage (Figure S4D) in HGC27 cells with enforced GLUT1 expression but had no effects on control cells. Moreover, a significant inhibitory effect of pharmacological ascorbate on HGC27 tumors stably expressing GLUT1 was observed, whereas the growth of empty vector-expressing HGC27 tumors was slightly decreased (Figure 3F).
GLUT1 only transports DHA into cancer cells[9]. Our data showed that DHA induced significant apoptosis in AGS and SGC7901 cells compared with stabilized ascorbate, whose oxidation was prevented by addition of dithiothreitol (Figure 3G). Moreover, we tested uptake of ascorbate and DHA by gastric cancer cells using mass spectrum analysis. The intracellular ascorbate and DHA levels were decreased in GLUT1 knockdown AGS, SGC7901 and MGC803 cells (Figure 3H and 3I). Enforced GLUT1 expression in HGC27 cells resulted in increased intracellular ascorbate and DHA (Figure 3J). Ascorbate or DHA in the culture medium was inversely correlated with GLUT1 level (Figure S4E and S4F). Together, these results strongly suggest that GLUT1 is the primary means of ascorbate uptake in gastric cancer cells and that GLUT1 expression level affects sensitivity of gastric cancer cells to ascorbate.
GLUT1 is overexpressed in gastric cancer tissues and predicts poor prognosis
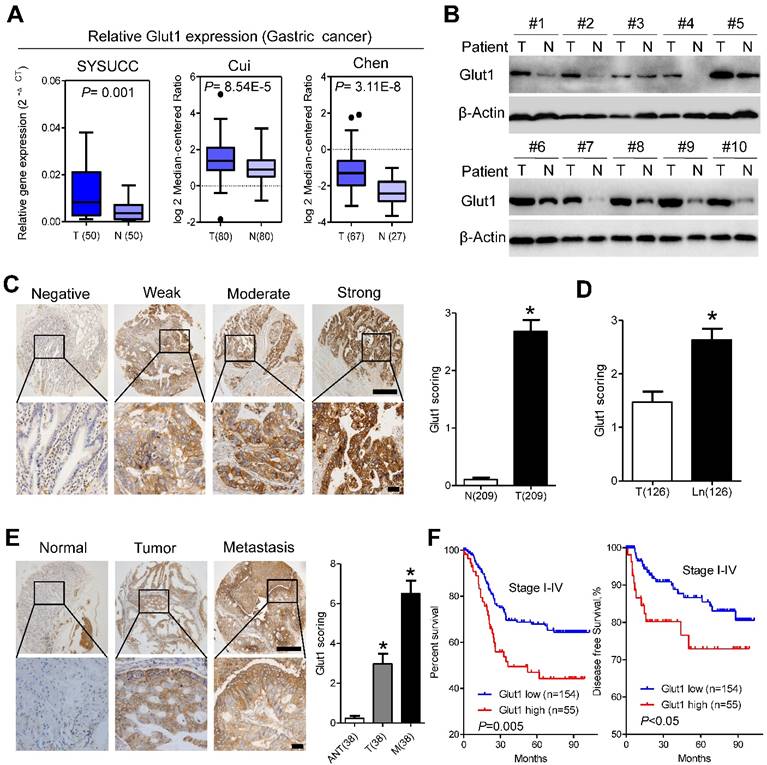
We further analyzed GLUT1 expression in our patient panel. qPCR assays indicated that the mRNA level of Glut1 in cancer tissues was approximately 2.5-fold higher than that in paired normal tissues, which was further validated by public data from the Oncomine database (Figure 4A). Western blot analysis confirmed the increased expression of GLUT1 in gastric cancer tissues compared with that in adjacent normal tissues (Figure 4B). To evaluate the clinicopathological significance of GLUT1 in gastric cancer, we performed IHC analysis of 209 gastric cancer samples. As shown in Figure 4C, GLUT1 was predominantly located in the membrane of tumor cells. Positive staining was observed in 141 of 209 (67.5%) cases. In addition, we observed overexpression of GLUT1 in tumor tissues (Figure 4C and S5A). Expression of GLUT1 was statistically higher in the lymph node metastases than that in the paired primary lesions (Figure 4D and S5A). Progressively increased expression of GLUT1 was observed in paired non-tumor tissues, primary tumors and distant metastasis (Figure 4E). The patients were divided into the GLUT1 low expression group (n=154) and the GLUT1 high expression group (n=55) based on IHC scores. Correlations between GLUT1 expression and clinicopathological characteristics are listed in Supplementary Table S2. High expression of GLUT1 was positively associated with larger tumor size (P=0.007), poor differentiation state (P<0.001), and presence of the perineural invasion (P=0.019). Log-rank tests were performed to assess the prognostic significance of GLUT1 in gastric cancer. Kaplan-Meier survival curves showed that high GLUT1 expression was associated with poor overall survival (P=0.005, Figure 4F, Table S3) and disease-free survival (P<0.05, Figure 4F) of patients in stage I-IV as well as patients in stage I-II (P<0.001, Figure S5B) or III-IV (P=0.023, Figure S5C). Multivariate analysis showed that only TNM stage (P<0.001) and GLUT1 expression (P<0.001) were independent prognostic factors for gastric cancer patients (Table S3). Moreover, increased membranous GLUT1 IHC score correlated with shorter overall and disease-free survival in our patient cohort (Figure S5D and S5E).
GLUT1 is overexpressed in gastric cancer tissues and predicts poor prognosis. (A) GLUT1 mRNA expression levels in gastric cancer tissues compared with paired normal gastric tissues and expression in multiple cancer microarray data sets available from online database (https://www.oncomine.com//). (B) GLUT1 expression in 10 pairs of human gastric cancer tissues (T) and matched adjacent non-tumor tissues (N). (C) Representative staining showing negative, weak, moderate and strong expression of GLUT1 protein in gastric cancer tissues. GLUT1 was located in the cell membrane (left panel). The expression of GLUT1 is significantly different between tumor and normal tissues (right panel). (D) Scoring of GLUT1 in paired tumor tissues and lymph node metastasis. (E) Representative staining (left panel) and scoring (right panel) of GLUT1 in paired adjacent normal tissues, primary tumor tissues and distant metastasis. (F) Kaplan-Meier analysis of overall survival and disease free survival based on GLUT1 expression in all 209 patients. Data in C, D and E are presented as mean ±S.D. Scale bar: 100μm.
Ascorbate increases cellular susceptibility to oxidative stress
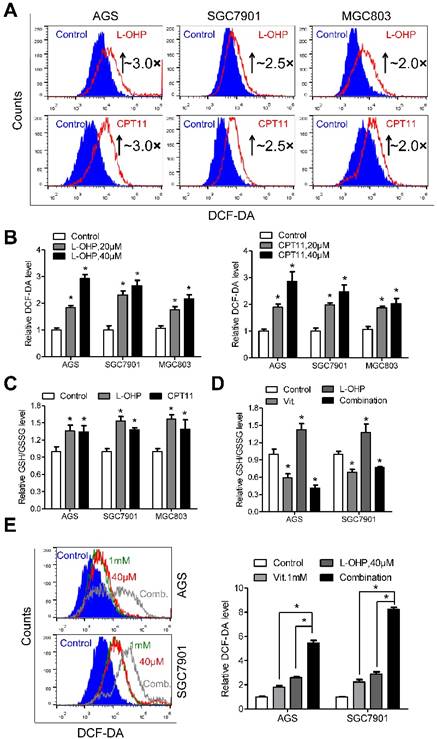
Exposure of gastric cancer cells to oxaliplatin or irinotecan resulted in elevated ROS production (Figure 5A). The fluorescence intensity of DCF-DA was approximately 3.0-, 2.5- and 2.0-fold higher in AGS, SGC7901 and MGC803 cells treated with oxaliplatin or irinotecan at a dose of 40 μM than that in the untreated cells, respectively (Figure 5B). Interestingly, the intracellular ratio of reduced to oxidized glutathione was consistently elevated after oxaliplatin or irinotecan treatment (Figure 5C), and these effects were reversed by co-treatment with ascorbate (Figure 5D and S6A). The combination of oxaliplatin or irinotecan with ascorbate in AGS and SGC7901 cells dramatically increased intracellular ROS levels (Figure 5E and S6B) and induced overexpression of γ-H2AX (Figure S6C and S6D) compared with those of either agent alone.
Depletion of glutathione by ascorbate increases cellular susceptibility to oxidative stress. (A) Representative histograms of ROS contents in the presence and absence of oxaliplatin or irinotecan at 40μM for 6h in the indicated cells as detected by the fluorescent probe DCF-DA. (B) Quantification of DCF-DA fluorescence in the indicated cells. (C) Intracellular ratio between reduced and oxidized glutathione of the indicated cells treated with oxaliplatin or irinotecan for 6h was measured with spectrophotometric analysis. (D) Intracellular glutathione level of the indicated cells treated with oxaliplatin (40μM, 6h), alone or in combination with ascorbate (1mM, 1h) was measured with spectrophotometric analysis. (E) Representative histograms (left panel) and quantification (right panel) of ROS contents after treatment with oxaliplatin (40μM, 6h), alone or in combination with ascorbate (1mM, 1h) in the indicated cells as detected by the fluorescent probe DCF-DA. Data in B, C, D and E are presented as mean ±S.D. (n = 4). *P < 0.05 versus control.
Ascorbate synergizes with oxaliplatin or irinotecan in gastric cancer cells
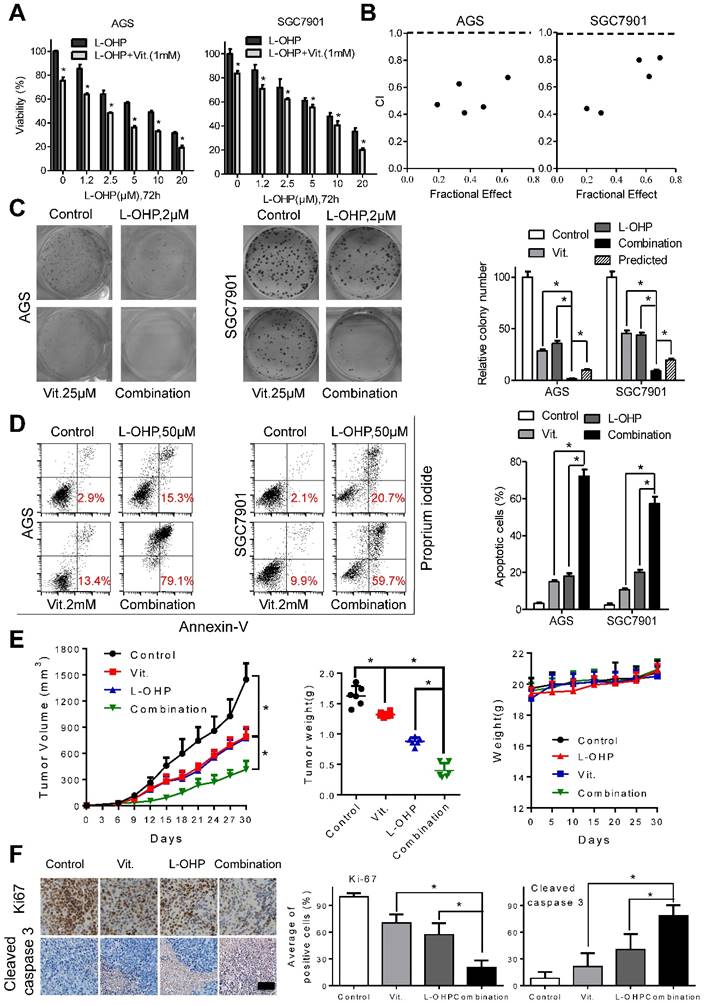
To examine the interactions between ascorbate and chemotherapeutic drugs in gastric cancer cells, we utilized MTS assays and found that the combination of oxaliplatin or irinotecan with ascorbate significantly suppressed cell viability compared with that of oxaliplatin or irinotecan alone in AGS and SGC7901 cells (Figure 6A and S7A). The combination index calculated with CalcuSyn was less than 1, indicating a synergistic effect between oxaliplatin or irinotecan with ascorbate (Figure 6B and S7B). Second, while oxaliplatin or irinotecan at 2 μM or 2.5 μM, respectively, significantly impaired colony formation, addition of ascorbate almost completely abolished the colonies formed by AGS and SGC7901 cells (Figure 6C and S7C). Cell apoptosis in the combination group was significantly increased compared with that induced by either agent alone (Figure 6D and S7D). Tumor growth as well as tumor weight in mice treated with ascorbate plus oxaliplatin or irinotecan was significantly suppressed compared with that of either agent alone (Figure 6E and S7E). In contrast, no weight loss or any other sign of toxicity was observed in any group (Figure 6E and S7E). IHC analysis in the excised tumor sections demonstrated that Ki67-positive cells were significantly decreased, while cleaved caspase 3-positive cells were significantly increased in the combination group compared with that of either agent alone (Figure 6F and S7F). The combination effects of oxaliplatin or irinotecan plus ascorbate were further validated in the MGC803 gastric cancer cell line (Figure S8A and S8B).
Ascorbate synergize with oxaliplatin in gastric cancer cells. (A) Cell viability of AGS and SGC7901 cells treated with oxaliplatin alone or combined with ascorbate (1mM, 2h) at indicated concentrations was detected by MTS. (B) The combination index (CI) of oxaliplatin and ascorbate treatment in AGS and SGC7901 cells was analyzed using a median dose-effect method with CalcuSyn software (Biosoft). CI = 1 indicates an additive effect, CI < 1 indicates a synergistic effect and CI > 1 indicates an antagonist effect. (C) Representative images (left panel) and quantification (right panel) of colony formation assays in AGS and SGC7901 cells treated with oxaliplatin (2.0μM) and ascorbate (25μM). The predicted value was calculated by multiplying the relative colony numbers in the oxaliplatin-treated and ascorbate -treated sample. (D) Representative images (left panel) and quantification (right panel) of Annexin V/PI assays in the indicated cells treated with oxaliplatin (50μM, 24h) and ascorbate (2mM, 2h). (E) The volume of the tumors and the weight of mice were measured and recorded, and a tumor growth curve was created for each group. (F) Paraffin-embedded tumor sections were stained with anti-Ki67 or cleaved caspase 3 antibody (scale bar: 50μm), the proliferation and apoptosis index was quantified. Data in A, C, D, E and F are presented as mean ±S.D. (n = 4 for A, C, D and n=6 for E, F). *P < 0.05 versus corresponding control.
The combination of high-dose ascorbate and oxaliplatin is efficacious in PDX models
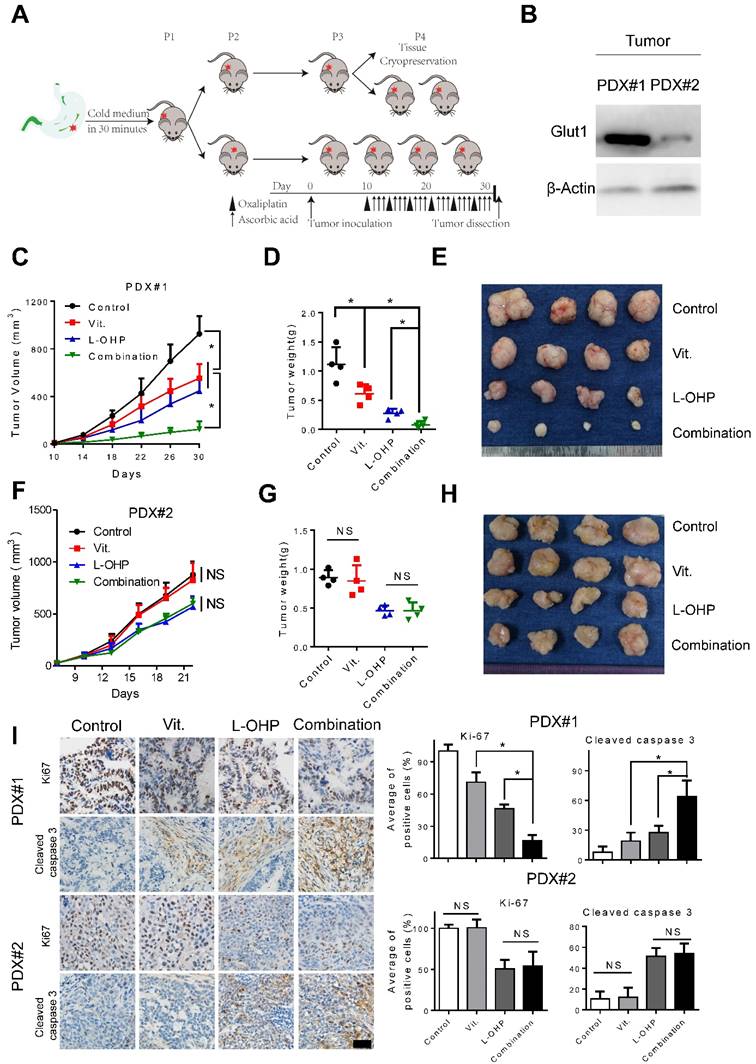
As PDX models have been suggested to faithfully recapitulate human tumor biology and to examine the preclinical drug response[27, 28], we generated PDX models to test the efficiency of pharmacological ascorbate and oxaliplatin (Figure 7A). Overexpression of GLUT1 in the tumor tissues from PDX#1 was observed compared with that from PDX#2 (Figure 7B). We found that high-dose ascorbate or oxaliplatin alone could suppress tumor growth, while the combination of both agents induced more potent antitumor activity as evidenced by the significantly decreased tumor growth and tumor weight in PDX#1 (Figure 7C-E). By contrast, therapeutic and synergistic effects of high-dose ascorbate at the same concentration with oxaliplatin were not observed in PDX#2 (Figure 7F-H). Moreover, IHC analysis of PDX samples from the immune-compromised mice showed substantially reduced expression of Ki67 and increased expression of cleaved caspase 3 in the combination group from PDX#1, while non-significant immunostaining of Ki67 and cleaved caspase 3 in sections from the ascorbate-treated groups and control groups in PDX#2 was observed (Figure 7I), which is consistent with the results from cell line-based xenografts.
Combination of ascorbate and oxaliplatin is efficacious in gastric PDX models. (A) Schematic illustration of PDX model generation and subsequent in vivo analysis. (B) Immunoblotting of GLUT1 in the tumor tissues from two PDX models. β-Actin was used as a loading control. (C, F) The volume of the tumors was monitored and a tumor growth curve was created for each group. (D, G) Weight of dissected tumors was recorded. (E, H) Photographs of dissected tumors in each group. (I) Immuno-staining of Ki67 and cleaved caspase 3 in the paraffin-embedded tumor sections of PDX models were shown and evaluated (scale bar: 50μm). Data in C, D, F, G and I are presented as mean ±S.D. (n = 4). *P < 0.05 versus corresponding control. NS, non-significant.
Discussion
Gastric cancer is the fourth most common cancer worldwide[29, 30] and currently represents the second leading cause of cancer-related death[29]. Chemotherapy is the standard care for advanced gastric cancer patients[31]. However, the efficacy of systemic chemotherapy is still limited[31], and drug resistance is frequently observed in gastric cancer [29, 32]. Therefore, novel therapeutic modalities for patients with advanced gastric cancer and strategies to enhance the sensitivity of gastric cancer to conventional therapeutic drugs are urgently needed.
The antitumor activity of intravenous high-dose ascorbate was first reported in the 1970s[2, 3]. However, these effects failed to be validated with oral supplementation at the same dose[4, 5], which showed a completely different pharmacokinetic profile compared to that of intravenous administeration [6]. Recent basic studies and clinical trials have re-evaluated the therapeutic potential of high-dose ascorbate in several human malignancies[10, 11, 13, 33]. Ascorbate was reported to enhance regeneration of induced pluripotent stem cells and inhibit malignant progression of leukemia via modulation of DNA demethylation dioxygenases[14, 15, 34]. High-dose ascorbate demonstrated selective cytotoxicity to cancer cells and enhanced sensitivity to chemotherapy or radiotherapy[10, 13, 33]. A recent study showed that perturbation of the intracellular labile iron pool rather than GLUT1 expression sensitized lung cancer and glioblastoma cells to pharmacological ascorbate, and these effects were completely abrogated by pretreatment with metal chelators such as DFO or DTPA[13]. However, our data showed that the effects of ascorbate on gastric cancer were not influenced by chelatable metals, which was consistent with results in lymphoma cells[16]. Moreover, RBCs could protect cancer cells, including HCT116, A375, SK-MEL-28 and JLP-119, from ascorbate-induced apoptosis[16, 35]. Our data further suggested that mitigation of ascorbate cytotoxicity to cancer cells by RBCs highlights the importance of G6PD enzyme activity detection before administration of high-dose ascorbate[16, 35].
Epidemiologic studies found that common variants in SVCT1 and SVCT2 may influence plasma ascorbate concentration independent of dietary intake, and polymorphisms in SVCT2 may influence the risk of gastric cancer[36, 37]. However, our data revealed that GLUT1 may determine the cytotoxic effects of ascorbate based on in vitro and in vivo analyses. These results suggest that the means of ascorbate transportation were cell type specific. Moreover, the preferred form of ascorbate differed among cancer cells[9, 38, 39]. GLUT1 and GLUT3 have both been reported to facilitate uptake of ascorbate in the form of DHA[40]. Hong et al. demonstrated that the inhibitory effect of ascorbate on breast cancer cells was dependent on SVCT2 expression level[23]. We therefore detected expression of GLUT1 and GLUT3 as well as SVCT1 and SVCT2 in gastric cancer cells and found that only the expression level of GLUT1 was paradoxically associated with sensitivity of gastric cancer cells to high-dose ascorbate. Further gain- and loss-of-function assays showed the impact of GLUT1 on intracellular ascorbate levels and response of cancer cells to ascorbate treatment. Intraperitoneal injection of high-dose ascorbate (4 g/kg) significantly repressed the growth of tumors formed by cell lines or PDX with GLUT1 overexpression but showed poor therapeutic effects on tumors formed by cell lines or PDX with low GLUT1 expression levels. Our data were consistent with the results from KRAS or BRAF mutant colorectal cancer cells[9]. However, whether other transporters, such as GLUT3, play vital roles in ascorbate uptake of other cancer cells requires further investigation because only four gastric cancer cell lines were used in our study. It should also be noted that the effect of high-dose ascorbate on mouse tumor growth was independent of circulating erythrocytes as they express GLUT4 rather than GLUT1[41].
Cancer cells sensitive to pharmacological ascorbate treatment have elevated intracellular ROS levels[1, 9, 12, 42], and they would be expected to become sensitized to agents that increased oxidative stress, such as genotoxic drugs[11]. We and others have reported that the glutathione level is associated with the cytotoxic activity of oxaliplatin and irinotecan[43-45]. DNA damage has been shown to induce ROS generation through the H2AX/Nox1/Rac1 pathway[21]. Our previous report demonstrated that elevated ROS levels serve as a mechanism underlying intrinsic resistance to gemcitabine, which induces nuclear translocation of Nrf2 and feedback activation of glutathione synthesis [24]. In this study, treatment with the genotoxic agents oxaliplatin or irinotecan resulted in elevated ROS production and synthesis of the antioxidant glutathione. Excessive ROS could exhaust the antioxidant capacity of cells and lead to apoptosis by increasing the redox stress level beyond its threshold[46, 47]. Several assays have demonstrated the synergistic effects of high-dose ascorbate with oxaliplatin or irinotecan in vitro and in vivo.
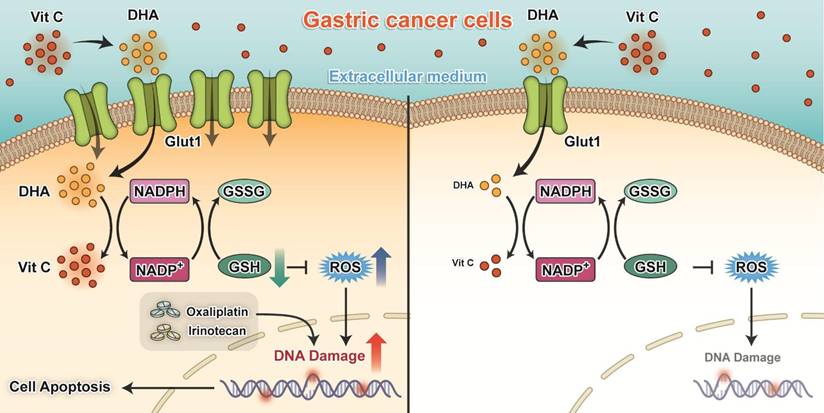
The key findings of our present study are that silencing of GLUT1 expression enhanced the sensitivity of gastric cancer cells to pharmacological ascorbate. High-dose ascorbate significantly induced ROS elevation via depletion of the antioxidant glutathione and suppressed growth of gastric cancer cells in vitro and in vivo (Figure 8). These findings suggest that pharmacological ascorbate, a novel treatment modality that relies on the GLUT1 protein level, may be an attractive adjuvant to standard chemotherapeutic treatment for gastric cancer.
Proposed working model of our study: Ascorbate transported into cytoplasm via GLUT1 disrupts redox homeostasis and enhances sensitivity to chemotherapy in gastric cancer.
Abbreviations
NAC, N-acetylcysteine; ROS, reactive oxygen species; PDX, patient derived xenografts; DCF-DA, 2',7'-dichlorofluorescein diacetate; PI, propidium iodide; GSH, glutathione; DTPA, diethylenetriamine-pentaacetic acid; DFO, desferrioxamine; DHA, dehydroascorbate; RBC, red blood cells; G6PD, glucose-6-phosphate dehydrogenase.
Supplementary Material
Supplementary figures and tables.
Acknowledgements
This research was supported by National High Technology Research and Development Program of China (863 Program), China (No. 2015AA020103); National Natural Science Foundation of China (No.81372570); National Natural Science Foundation of China (No.81572392); Natural Science Foundation of Guangdong Province (No.2014A030312015); Science and Technology Program of Guangzhou (No.15570006, 158100066) and by grants from China Postdoctoral Science Foundation (No.2015M570746).
Competing Interests
The authors have declared that no competing interest exists.
References
1. Davis-Yadley AH, Malafa MP. Vitamins in pancreatic cancer: a review of underlying mechanisms and future applications. Adv Nutr. 2015;6:774-802
2. Cameron E, Pauling L. Supplemental ascorbate in the supportive treatment of cancer: reevaluation of prolongation of survival times in terminal human cancer. Proc Natl Acad Sci U S A. 1978;75:4538-42
3. Cameron E, Pauling L. Supplemental ascorbate in the supportive treatment of cancer: Prolongation of survival times in terminal human cancer. Proc Natl Acad Sci U S A. 1976;73:3685-9
4. Creagan ET, Moertel CG, O'Fallon JR, Schutt AJ, O'Connell MJ, Rubin J. et al. Failure of high-dose vitamin C (ascorbic acid) therapy to benefit patients with advanced cancer. A controlled trial. N Engl J Med. 1979;301:687-90
5. Moertel CG, Fleming TR, Creagan ET, Rubin J, O'Connell MJ, Ames MM. High-dose vitamin C versus placebo in the treatment of patients with advanced cancer who have had no prior chemotherapy. A randomized double-blind comparison. N Engl J Med. 1985;312:137-41
6. Levine M, Conry-Cantilena C, Wang Y, Welch RW, Washko PW, Dhariwal KR. et al. Vitamin C pharmacokinetics in healthy volunteers: evidence for a recommended dietary allowance. Proc Natl Acad Sci U S A. 1996;93:3704-9
7. Padayatty SJ, Sun H, Wang Y, Riordan HD, Hewitt SM, Katz A. et al. Vitamin C pharmacokinetics: implications for oral and intravenous use. Ann Intern Med. 2004;140:533-7
8. Mamede AC, Pires AS, Abrantes AM, Tavares SD, Goncalves AC, Casalta-Lopes JE. et al. Cytotoxicity of ascorbic acid in a human colorectal adenocarcinoma cell line (WiDr): in vitro and in vivo studies. Nutr Cancer. 2012;64:1049-57
9. Yun J, Mullarky E, Lu C, Bosch KN, Kavalier A, Rivera K. et al. Vitamin C selectively kills KRAS and BRAF mutant colorectal cancer cells by targeting GAPDH. Science. 2015;350:1391-6
10. Ma Y, Chapman J, Levine M, Polireddy K, Drisko J, Chen Q. High-dose parenteral ascorbate enhanced chemosensitivity of ovarian cancer and reduced toxicity of chemotherapy. Sci Transl Med. 2014;6:222ra18
11. Du J, Cieslak JA 3rd, Welsh JL, Sibenaller ZA, Allen BG, Wagner BA. et al. Pharmacological Ascorbate Radiosensitizes Pancreatic Cancer. Cancer Res. 2015;75:3314-26
12. Du J, Martin SM, Levine M, Wagner BA, Buettner GR, Wang SH. et al. Mechanisms of ascorbate-induced cytotoxicity in pancreatic cancer. Clin Cancer Res. 2010;16:509-20
13. Schoenfeld JD, Sibenaller ZA, Mapuskar KA, Wagner BA, Cramer-Morales KL, Furqan M. et al. O2- and H2O2-Mediated Disruption of Fe Metabolism Causes the Differential Susceptibility of NSCLC and GBM Cancer Cells to Pharmacological Ascorbate. Cancer Cell. 2017;32:268
14. Agathocleous M, Meacham CE, Burgess RJ, Piskounova E, Zhao Z, Crane GM. et al. Ascorbate regulates haematopoietic stem cell function and leukaemogenesis. Nature. 2017;549:476-81
15. Cimmino L, Dolgalev I, Wang Y, Yoshimi A, Martin GH, Wang J. et al. Restoration of TET2 Function Blocks Aberrant Self-Renewal and Leukemia Progression. Cell. 2017;170:1079-95 e20
16. Chen Q, Espey MG, Krishna MC, Mitchell JB, Corpe CP, Buettner GR. et al. Pharmacologic ascorbic acid concentrations selectively kill cancer cells: action as a pro-drug to deliver hydrogen peroxide to tissues. Proc Natl Acad Sci U S A. 2005;102:13604-9
17. Chen P, Stone J, Sullivan G, Drisko JA, Chen Q. Anti-cancer effect of pharmacologic ascorbate and its interaction with supplementary parenteral glutathione in preclinical cancer models. Free Radic Biol Med. 2011;51:681-7
18. Kelland L. The resurgence of platinum-based cancer chemotherapy. Nat Rev Cancer. 2007;7:573-84
19. Laurent A, Nicco C, Chereau C, Goulvestre C, Alexandre J, Alves A. et al. Controlling tumor growth by modulating endogenous production of reactive oxygen species. Cancer Res. 2005;65:948-56
20. Yoshida A, Takemura H, Inoue H, Miyashita T, Ueda T. Inhibition of glutathione synthesis overcomes Bcl-2-mediated topoisomerase inhibitor resistance and induces nonapoptotic cell death via mitochondrial-independent pathway. Cancer Res. 2006;66:5772-80
21. Kang MA, So EY, Simons AL, Spitz DR, Ouchi T. DNA damage induces reactive oxygen species generation through the H2AX-Nox1/Rac1 pathway. Cell Death Dis. 2012;3:e249
22. Lu YX, Ju HQ, Wang F, Chen LZ, Wu QN, Sheng H. et al. Inhibition of the NF-kappaB pathway by nafamostat mesilate suppresses colorectal cancer growth and metastasis. Cancer Lett. 2016;380:87-97
23. Hong SW, Lee SH, Moon JH, Hwang JJ, Kim DE, Ko E. et al. SVCT-2 in breast cancer acts as an indicator for L-ascorbate treatment. Oncogene. 2013;32:1508-17
24. Ju HQ, Gocho T, Aguilar M, Wu M, Zhuang ZN, Fu J. et al. Mechanisms of Overcoming Intrinsic Resistance to Gemcitabine in Pancreatic Ductal Adenocarcinoma through the Redox Modulation. Mol Cancer Ther. 2015;14:788-98
25. Herst PM, Broadley KW, Harper JL, McConnell MJ. Pharmacological concentrations of ascorbate radiosensitize glioblastoma multiforme primary cells by increasing oxidative DNA damage and inhibiting G2/M arrest. Free Radic Biol Med. 2012;52:1486-93
26. Castro ML, McConnell MJ, Herst PM. Radiosensitisation by pharmacological ascorbate in glioblastoma multiforme cells, human glial cells, and HUVECs depends on their antioxidant and DNA repair capabilities and is not cancer specific. Free Radic Biol Med. 2014;74:200-9
27. Siolas D, Hannon GJ. Patient-derived tumor xenografts: transforming clinical samples into mouse models. Cancer Res. 2013;73:5315-9
28. Hidalgo M, Amant F, Biankin AV, Budinska E, Byrne AT, Caldas C. et al. Patient-derived xenograft models: an emerging platform for translational cancer research. Cancer Discov. 2014;4:998-1013
29. Siegel RL, Miller KD, Jemal A. Cancer statistics, 2015. CA Cancer J Clin. 2015;65:5-29
30. Chen W, Zheng R, Zeng H, Zhang S. The updated incidences and mortalities of major cancers in China, 2011. Chin J Cancer. 2015;34:502-7
31. Fujitani K, Yang HK, Mizusawa J, Kim YW, Terashima M, Han SU. et al. Gastrectomy plus chemotherapy versus chemotherapy alone for advanced gastric cancer with a single non-curable factor (REGATTA): a phase 3, randomised controlled trial. Lancet Oncol. 2016;17:309-18
32. Van Cutsem E, Sagaert X, Topal B, Haustermans K, Prenen H. Gastric cancer. Lancet. 2016;388:2654-64
33. Monti DA, Mitchell E, Bazzan AJ, Littman S, Zabrecky G, Yeo CJ. et al. Phase I evaluation of intravenous ascorbic acid in combination with gemcitabine and erlotinib in patients with metastatic pancreatic cancer. PLoS One. 2012;7:e29794
34. Esteban MA, Wang T, Qin B, Yang J, Qin D, Cai J. et al. Vitamin C enhances the generation of mouse and human induced pluripotent stem cells. Cell Stem Cell. 2010;6:71-9
35. Zhang ZZ, Lee EE, Sudderth J, Yue Y, Zia A, Glass D. et al. Glutathione Depletion, Pentose Phosphate Pathway Activation, and Hemolysis in Erythrocytes Protecting Cancer Cells from Vitamin C-induced Oxidative Stress. J Biol Chem. 2016;291:22861-7
36. Wright ME, Andreotti G, Lissowska J, Yeager M, Zatonski W, Chanock SJ. et al. Genetic variation in sodium-dependent ascorbic acid transporters and risk of gastric cancer in Poland. Eur J Cancer. 2009;45:1824-30
37. Duell EJ, Lujan-Barroso L, Llivina C, Munoz X, Jenab M, Boutron-Ruault MC. et al. Vitamin C transporter gene (SLC23A1 and SLC23A2) polymorphisms, plasma vitamin C levels, and gastric cancer risk in the EPIC cohort. Genes Nutr. 2013;8:549-60
38. Bode AM, Liang HQ, Green EH, Meyer TE, Buckley DJ, Norris A. et al. Ascorbic acid recycling in Nb2 lymphoma cells: implications for tumor progression. Free Radic Biol Med. 1999;26:136-47
39. Park JB, Levine M. Intracellular accumulation of ascorbic acid is inhibited by flavonoids via blocking of dehydroascorbic acid and ascorbic acid uptakes in HL-60, U937 and Jurkat cells. J Nutr. 2000;130:1297-302
40. Rumsey SC, Kwon O, Xu GW, Burant CF, Simpson I, Levine M. Glucose transporter isoforms GLUT1 and GLUT3 transport dehydroascorbic acid. J Biol Chem. 1997;272:18982-9
41. Montel-Hagen A, Kinet S, Manel N, Mongellaz C, Prohaska R, Battini JL. et al. Erythrocyte Glut1 triggers dehydroascorbic acid uptake in mammals unable to synthesize vitamin C. Cell. 2008;132:1039-48
42. Padayatty SJ, Katz A, Wang Y, Eck P, Kwon O, Lee JH. et al. Vitamin C as an antioxidant: evaluation of its role in disease prevention. J Am Coll Nutr. 2003;22:18-35
43. Wu WJ, Zhang Y, Zeng ZL, Li XB, Hu KS, Luo HY. et al. beta-phenylethyl isothiocyanate reverses platinum resistance by a GSH-dependent mechanism in cancer cells with epithelial-mesenchymal transition phenotype. Biochem Pharmacol. 2013;85:486-96
44. Kopetz S, Lesslie DP, Dallas NA, Park SI, Johnson M, Parikh NU. et al. Synergistic activity of the SRC family kinase inhibitor dasatinib and oxaliplatin in colon carcinoma cells is mediated by oxidative stress. Cancer Res. 2009;69:3842-9
45. Carames M, Alonso-Varona A, Garcia-Alonso I, Palomares T. Glutathione modulators reverse the pro-tumour effect of growth factors enhancing WiDr cell response to chemotherapeutic agents. Anticancer Res. 2010;30:1223-31
46. Gorrini C, Harris IS, Mak TW. Modulation of oxidative stress as an anticancer strategy. Nat Rev Drug Discov. 2013;12:931-47
47. Fruehauf JP, Meyskens FL Jr. Reactive oxygen species: a breath of life or death? Clin Cancer Res. 2007;13:789-94
Author contact
![]() Corresponding authors: Rui-Hua Xu, Sun Yat-Sen University, Guangzhou, Guangdong 510060, China. Phone: 86-20-8734-3228; Fax: 86-20-8734-3392; E-mail: xurhorg.cn or Huai-Qiang Ju, Email: juhqorg.cn.
Corresponding authors: Rui-Hua Xu, Sun Yat-Sen University, Guangzhou, Guangdong 510060, China. Phone: 86-20-8734-3228; Fax: 86-20-8734-3392; E-mail: xurhorg.cn or Huai-Qiang Ju, Email: juhqorg.cn.