Impact Factor
- Issue 14; 2026
- Issue 13; 2026
- Issue 12; 2026
- Issue 11; 2026
- Issue 10; 2026
- Volume 16; 2026
- Advance Articles
- Past Issues
- Cover Images
- Cover Suggestion
- Index & Coverage
- Special Issues
Introduction
Materials and Methods
Results and Discussion
Conclusion
Abbreviations
Acknowledgements
Supplementary Material
References
International Journal of Biological Sciences
International Journal of Medical Sciences
 Global reach, higher impact

Theranostics 2018; 8(4):1106-1120. doi:10.7150/thno.19904 This issue Cite
Research Paper
MiR-205-5p and miR-342-3p cooperate in the repression of the E2F1 transcription factor in the context of anticancer chemotherapy resistance
Xin Lai1* ![]() , Shailendra K Gupta2,6*, Ulf Schmitz3,4*, Stephan Marquardt5, Susanne Knoll5, Alf Spitschak5, Olaf Wolkenhauer2,7#
, Shailendra K Gupta2,6*, Ulf Schmitz3,4*, Stephan Marquardt5, Susanne Knoll5, Alf Spitschak5, Olaf Wolkenhauer2,7# ![]() , Brigitte M Pützer5#, Julio Vera1#
, Brigitte M Pützer5#, Julio Vera1# ![]()
1. Laboratory of Systems Tumour Immunology, Department of Dermatology, Friedrich-Alexander-University of Erlangen-Nürnberg (FAU) and Universitätsklinikum Erlangen, Erlangen, Germany;
2. Department of Systems Biology and Bioinformatics, University of Rostock, Rostock, Germany;
3. Gene & Stem Cell Therapy Program, Centenary Institute, University of Sydney, Camperdown, Australia;
4. Sydney Medical School, University of Sydney, Camperdown, Australia;
5. Institute of Experimental Gene Therapy and Cancer Research, Rostock University Medical Centre, Rostock, Germany;
6. CSIR-Indian Institute of Toxicology Research, Lucknow, India;
7. Stellenbosch Institute for Advanced Study (STIAS), Wallenberg Research Centre at Stellenbosch University, Stellenbosch, South Africa.
* Equal first authors
# Equal senior contributors
Received 2017-3-3; Accepted 2017-11-14; Published 2018-1-1
Abstract

High rates of lethal outcome in tumour metastasis are associated with the acquisition of invasiveness and chemoresistance. Several clinical studies indicate that E2F1 overexpression across high-grade tumours culminates in unfavourable prognosis and chemoresistance in patients. Thus, fine-tuning the expression of E2F1 could be a promising approach for treating patients showing chemoresistance.
Methods: We integrated bioinformatics, structural and kinetic modelling, and experiments to study cooperative regulation of E2F1 by microRNA (miRNA) pairs in the context of anticancer chemotherapy resistance.
Results: We showed that an enhanced E2F1 repression efficiency can be achieved in chemoresistant tumour cells through two cooperating miRNAs. Sequence and structural information were used to identify potential miRNA pairs that can form tertiary structures with E2F1 mRNA. We then employed molecular dynamics simulations to show that among the identified triplexes, miR-205-5p and miR-342-3p can form the most stable triplex with E2F1 mRNA. A mathematical model simulating the E2F1 regulation by the cooperative miRNAs predicted enhanced E2F1 repression, a feature that was verified by in vitro experiments. Finally, we integrated this cooperative miRNA regulation into a more comprehensive network to account for E2F1-related chemoresistance in tumour cells. The network model simulations and experimental data indicate the ability of enhanced expression of both miR-205-5p and miR-342-3p to decrease tumour chemoresistance by cooperatively repressing E2F1.
Conclusions: Our results suggest that pairs of cooperating miRNAs could be used as potential RNA therapeutics to reduce E2F1-related chemoresistance.
Keywords: MicroRNA, E2F1, Chemotherapy resistance, Molecular dynamics simulation, Kinetic modelling.
Introduction
Tumour metastasis continues to be the most significant problem in the field of cancer. The increasingly high rates of therapy failure and lethal outcome associated with tumour metastasis rely on the acquisition of invasiveness, early metastatic dissemination of tumour cells from their primary sites and generation of chemoresistance (1, 2). The underlying mechanisms for tumour metastasis and chemoresistance are not fully understood. However, the search for effective counter measures is an active field of research in molecular oncology as there is an urgent need for new forms of therapies or co-adjuvants able to sensitize tumour cells to existing therapies. In this context, therapeutic strategies aiming to modulate miRNA activity have gained popularity and are showing the first signs of success, as miRNAs have been found to be massively involved in the regulation of human cancers (3). These non-coding RNA transcripts can regulate a large number of mRNA targets, which possess imperfectly complementary binding sites in their 3' untranslated regions (UTRs) (4). Therefore, the repressive effect of one miRNA on a single target is often rather mild and off-target effects are hindering effective miRNA replacement therapies (5,6). However, several studies have shown that an effective target regulation can be achieved through concerted miRNA regulation, where the phenomenon of synergistic regulation by a pair of miRNAs can significantly enhance the efficiency of target repression (7-14). We have shown previously that many genes are targets of cooperating miRNA pairs (15). This mechanism facilitates a fine-tuned post-transcriptional gene regulation in a cell-context-dependent manner (8).
In many cancer entities, the transcription factor E2F1, a versatile trans-acting protein involved in many critical cellular processes, has been found to be strongly up-regulated in aggressive tumours and metastases co-occurring with therapy failure and poor patient survival prognosis (16, 17). It has been previously shown that E2F1 can play an important role in the emergence of aggressive tumour cell phenotypes (18-20). More specifically, we have demonstrated that E2F1 induces resistance to single or multiple anti-cancer drugs by targeting ABC transporter family members and Bcl-2 via a network that involves E2F1, p73, the N-terminally truncated p73 isoform DNp73 (also known as inhibitor of p73) and miR-205-5p. This work was motivated by mathematical simulations and was experimentally confirmed. Our results indicate that the interplay between E2F1 and miR-205-5p realized by a negative feedback loop is crucial to induce chemoresistance in tumour cells.
In this article, we integrated bioinformatics, structural and kinetic modelling, and experiments to study the effects of synergistic regulation by miRNA pairs on the expression of E2F1 and possible implications for drug-resistant tumour cells. Our computational predictions suggest that miR-205-5p and miR-342-3p achieve an enhanced repressive effect on E2F1 expression in a cooperative manner. We validated our predictions in H1299 cells, an aggressive human non-small cell lung carcinoma cell line. Then, we integrated miRNA cooperativity into a kinetic model of E2F1-mediated chemoresistance. Model-based simulations and experimental data show that synergistic E2F1 regulation by miR-205-5p and miR-342-3p can abrogate chemoresistance in aggressive tumour cells. Taken together, our results suggest that suppression of E2F1 expression by cooperating miRNA pairs can be used to sensitize tumour cells to chemotherapy.
Materials and Methods
miRNA regulation of E2F1
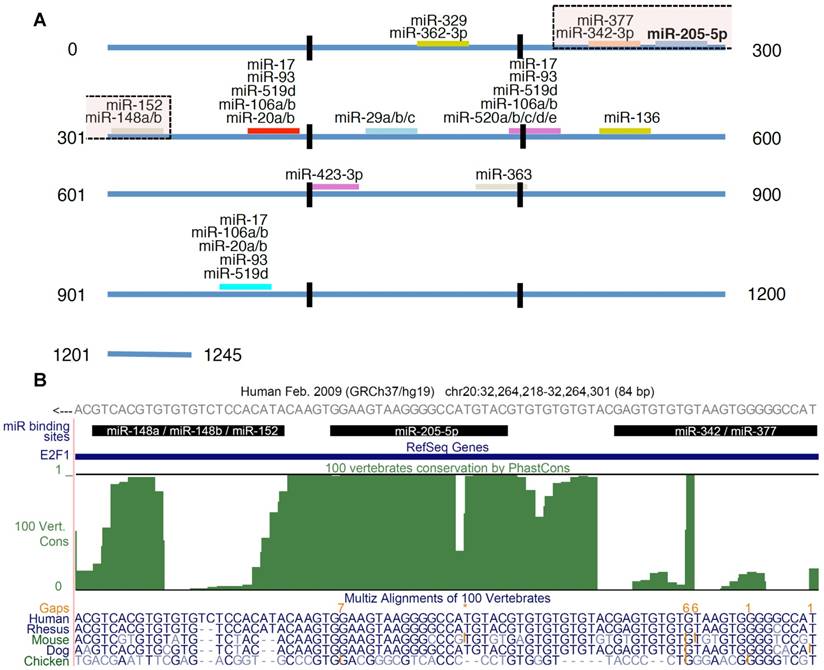
We derived experimentally confirmed miRNA-E2F1 interactions from miRTarBase, a manually curated, literature-based database of validated miRNA-target interactions based on different experimental methods (release 6.0) (21). For our analysis we considered only those interactions that were confirmed by reporter assay experiments. We complemented the set of validated miRNAs regulating E2F1 by predictions from the highly sensitive miRNA-target prediction algorithm miRanda (August 2010 Release; Figure 1) (22). We considered only target sites of conserved miRNAs, with good miRSVR scores (≤ -0.1). The mirSVR score, which is applied in miRanda predictions, is based on a support vector regression classifier that was trained with data from miRNA transfection experiments. Sequence, contextual and structural features of predicted miRNA target sites taken from down-regulated target mRNAs were incorporated into this classification system where scores correlate with the extent of target down-regulation. Information on miRNA families was extracted from the miRBase database (release 21) (23).
E2F1 targeting miRNAs. (A) In total 26 miRNAs were predicted to be post-transcriptional regulators of E2F1 expression. The figure shows the location of the binding sites and highlights putatively cooperating miRNAs (the transparent boxes on top). The transparent box indicates the location of the miRNAs that could putatively cooperate with miR-205-5p in repressing E2F1. (B) Conservation of miRNA binding sites. The green track in this UCSC genome browser snapshot shows the PhastCons score (100 vertebrate conservation track) indicating the evolutionary conservation of miRNA binding sites in the 3' UTR of E2F1. The genomic region shown includes binding sites of miR-205-5p and putatively coopering miRNAs (black bars). A multiple sequence alignment of some related species is shown in the bottom track. The E2F1 gene is locate on the negative strand. While the 3′ UTR sequence in (A) is in 5′ to 3′ orientation, the reading direction in the UCSC genome browser snapshot (B) is opposite to that.
Secondary structures of RNA complexes
Secondary structures of RNA triplexes composed of two putatively cooperating miRNAs and the E2F1 mRNA were predicted using the E2F1 3' UTR sequence extracted from the RefSeq gene track of the UCSC table browser (GRCh37/hg19) (24) and the mature miRNA sequences from the miRBase database (23). Secondary structures were computed using the mfe tool from the NUPACK software package (Table 1) (25). In NUPACK, the full partition function (except for pseudo knots) of RNA complexes is computed in dilute solution. For the visualization of the RNA complexes we used the RNA structure drawing tool VARNA (version 3.9) (26).
miRNA pairs cooperating in the regulation of E2F1.
| miRNA pair | miR-205-5pmiR-342-3p | miR-205-5pmiR-148a-3p | miR-205-5pmiR-377-3p | miR-205-5pmiR-148b-3p | miR-205-5pmiR-152-3p |
|---|---|---|---|---|---|
| Secondary structure | 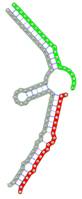 | 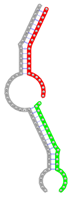 | 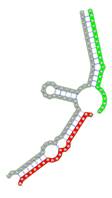 | 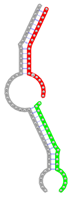 | 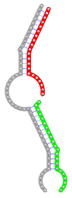 |
| Structure pattern | target self-complementarity | canonical triplex | target self-complementarity | canonical triplex | canonical triplex |
| Seed distance (nt) | 32 | 27 | 33 | 27 | 27 |
| ∆G (kcal/mol) | -50.56 | -45.26 | -44.86 | -44.66 | -42.76 |
| ∆∆G (kcal/mol) | -20.28 | -14.78 | -12.98 | -14.18 | -12.28 |
| Potential energy (kcal/mol) | -8241.33 | -7040.79 | -7623.90 | -6841.37 | -7064.68 |
| Equilibrium concentration (nM) | 99.95 | 94.93 | 47.05 | 88.88 | 64.36 |
The second row shows the local secondary structure for the predicted RNA triplexes (grey: mRNA, green: miR-205-5p, red: other miRNAs). Seed distance: the distance between the seed sites of the miRNAs in the 3' UTR of E2F1. ∆G: the change in Gibbs free energy when the miRNA pairs and the E2F1 mRNA form the triplex (miRNA1/miRNA2/mRNAE2F1). ∆∆G: the free energy gained by triplex formation compared to the duplex (miRNA/mRNAE2F1) showing smaller ∆G. Potential energy: the calculated energy in the 3D structure of the triplexes. Equilibrium concentration: the equilibrium concentrations of RNA triplexes computed by a partition function algorithm (see Materials and Methods).
RNA complex equilibrium concentrations
For the RNA triples involving the E2F1 mRNA and two putatively cooperating miRNAs, we computed the equilibrium concentrations of all monomers and possible complexes formed by these RNA molecules in dilute solution. For this purpose we made use of the tools named as complexes and concentrations, which are also part of the NUPACK package (25). The equilibrium concentrations are based on initial concentrations of 100 nM per RNA species. The equilibrium concentrations were computed by a partition function algorithm as described in (27).
3D structure modelling and molecular dynamics simulations
We first constructed the initial 3D structure of the RNA triplexes (mRNAE2F1/miRNA1/miRNA2) as well as their two intrinsic RNA duplexes (mRNAE2F1/miRNA1 and mRNAE2F1/miRNA2) using RNAComposer web server (28). Then, these complexes were processed as described in our previous publication (15) and further optimized using Smart Minimizer protocol in BIOVIA® Discovery Studio 4.5 (29, 30). Finally, molecular dynamics simulations were carried out using the Standard Dynamics Cascade protocol in BIOVIA® DS 4.5 in four steps: (i) minimization; (ii) heating and cooling; (iii) equilibrium run; and (iv) production run, for all the potential cooperating miRNAs complexed with the 3' UTR of E2F1 (Figure 2). The detailed procedure of the molecular dynamics simulations can be found in Supplementary Material.
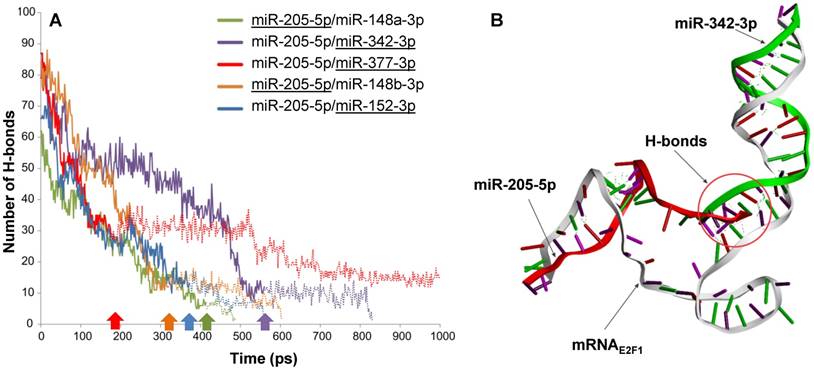
Intermolecular H-bonds between mRNA and miRNAs in RNA triplexes during 1,000 ps MDS run. (A) The solid lines indicate the number of H-bonds when both miRNAs are associated with E2F1 mRNA, while the extended dotted line shows the number of H-bonds between the remaining miRNAs (underlined) and the mRNA. For each triplex, the underlined miRNA first disassociates from the mRNA at the time point indicated by the correspondingly coloured arrow. (B) Interactions between the E2F1 3′ UTR (grey), miR-342-3p (green) and miR-205-5p-5p (red) in a 3D model. The intermolecular H-bonds between the three RNA species are shown as green dotted lines. The simulation also indicates that miR-205-5p and miR-342-3p interact with each other through H-bonds (red circle), which may contribute to the better stability of this triplex over others.
Mathematical modelling
To elaborate on the mechanism by which E2F1 is repressed by cooperative miRNA pairs, we developed a kinetic model of ordinary differential equations. The model accounts for the formation of complexes, including two RNA duplexes and one RNA triplex, by the E2F1 mRNA and the two cooperative miRNAs, and the disassociation of these complexes as a result of reversible binding processes between miRNAs and their target mRNAs. The model parameters were characterized using the RNA complex equilibrium concentration results and the change of Gibbs free energy (∆G) of RNA triplexes that were calculated from their secondary structures. The data-driven model was used to estimate repression efficiency of the cooperative miRNAs on E2F1 (Figure 3). In addition, the model accounting for the cooperative repression of E2F1 by miR-205-5p and miR-342-3p was characterized using the in vitro data, and the simulated E2F1 protein level was compared with the Western blot data showing the repression of E2F1 by individual and cooperative miRNA repression (Figure 4C). The details of model description, model calibration and model simulation can be found in Supplementary Material.
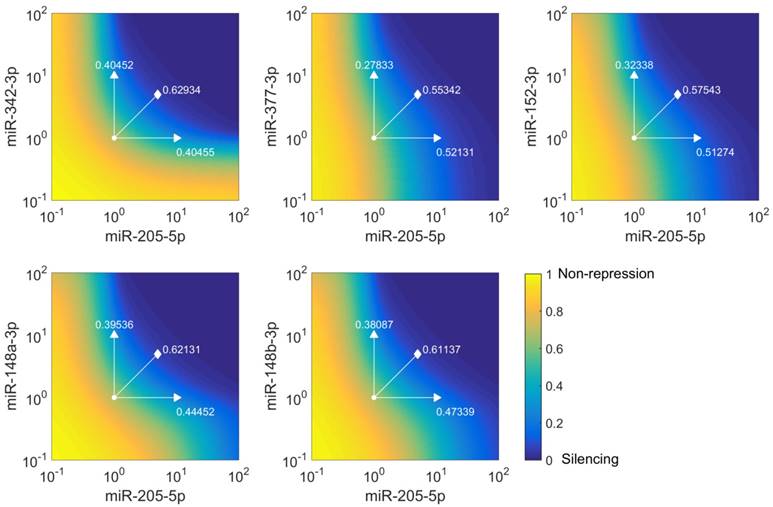
Simulations of E2F1 repression by cooperating miRNA pairs. The plots show the expression levels of E2F1 (0: silencing; 1: non-repression) for different combinations of the miRNA transcriptional activation (denoted by  and
and  in the model). The nominal value of the miRNA transcriptional activation is 1, and values smaller than 1 indicate down-regulation while values greater than 1 represent up-regulation of the miRNA. The four reference points represent normal expression of miRNAs (dot), strong up-regulation of one miRNA (triangles) and moderate up-regulation of both miRNAs (diamond). The numbers denote the gain of E2F1 repression efficiency while increasing miRNA expression levels.
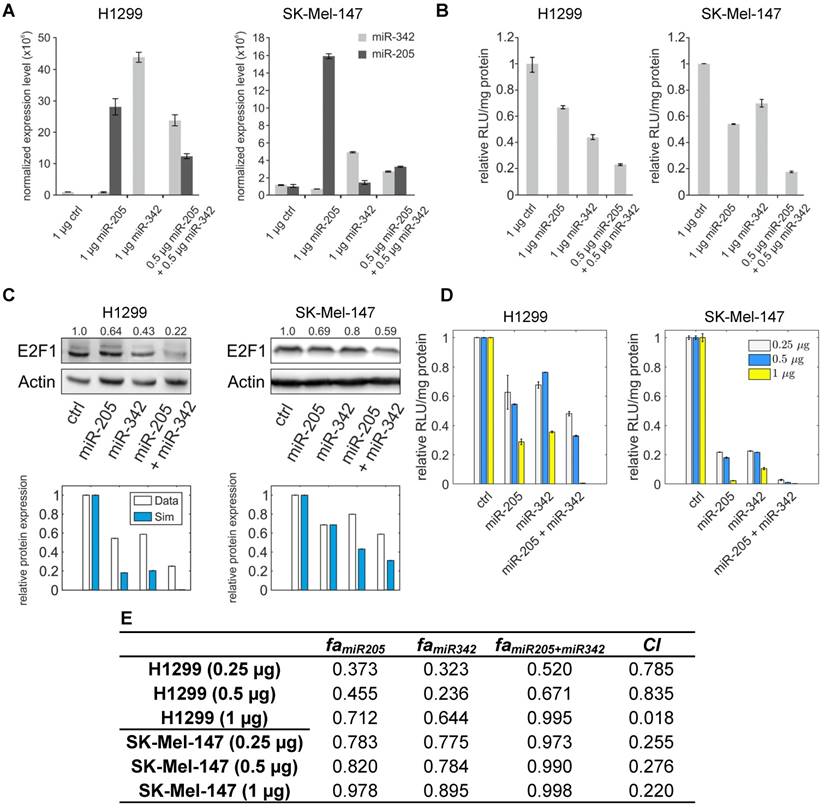
miR-205-5p and miR-342-3p cooperate in the regulation of E2F1. (A) Quantification of miRNA levels after individually or co-transfecting miR-205-5p and miR-342-3p expression plasmids into H1299 and SK-Mel-147 cells. (B) Relative luciferase activity after co-transfection of E2F1-3' UTR (0.5 μg) and miR-205-5p/miR-342-3p plasmids into H1299 and SK-Mel-147 cells. (C) Western blot showing E2F1 protein expression after single or combined miR-205-5p/miR-342-3p overexpression in H1299 and SK-Mel-147 (top). The E2F1 protein levels (data) were quantified and compared with model simulations (model) showing the cooperative E2F1 repression by miR-205-5p and miR-342-3p (bottom). Actin was used as loading control and for normalising the protein expression data. Plasmid concentrations for miRNA expression are indicated in the corresponding figures. The details of the model simulation can be found in Supplementary Material. (D) Multidose combinations of miR-205 and miR-342 for repressing E2F1. Relative luciferase activity was measured after co-transfection of E2F1-3' UTR and miR-205-5p/miR-342-3p plasmids into H1299 and SK-Mel-147 cells. For the individual treatments, 0.25 µg, 0.5 µg, or 1 µg of miR-205 or miR-342 plasmid were transfected into cells, and for the combined treatment, 0.25 µg, 0.5 µg, or 1 µg of both miRNA plasmids were co-transfected. (E) The table shows the calculated fraction affected (fa) by the individual miRNA or combined miRNA treatments and the corresponding combination indexes (CI) of the combined treatments (synergism: CI < 1; antagonism: CI > 1). The estimated parameter values can be found in Table S5. Data shown in the bar plots are mean ± SD (n = 3).
To simulate the effect of miR-205-5p and miR-342-3p on the response of tumour cells to chemoresistance, we integrated the cooperative regulation of E2F1 by the two miRNAs into a published kinetic model (18). The expanded model accounts for the temporal dynamics of a regulatory network, whose activation is triggered after anticancer drug administration and modulates a phenotypic response in a population of tumour cells. The values of original model parameters were taken from the publication and the new ones accounting for the cooperative repression of E2F1 by the two miRNAs were characterized using the experimental data. The model was simulated to show the effects of the cooperative miRNA repression on drug resistance in tumour cells with overexpressed E2F1 (Figure 5). The details of model description, model calibration and model simulation can be found in Supplementary Material. The MATLAB files used for running the simulations can be found at goo.gl/ZdAhdY.
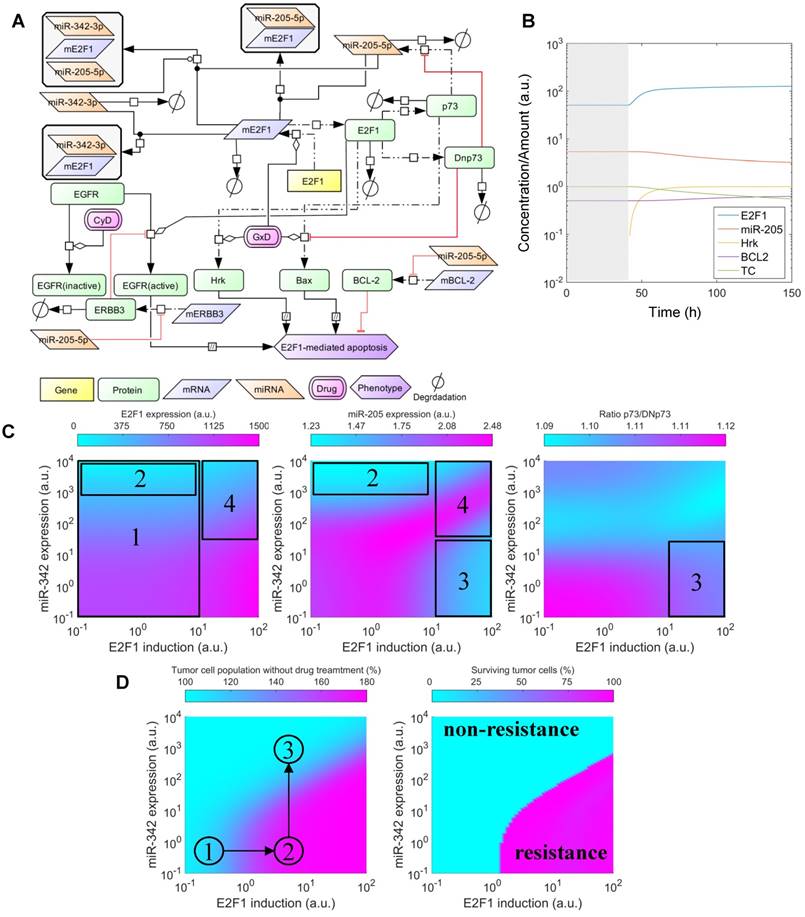
Effects of cooperative E2F1 repression on chemoresistance. (A) Biochemical reaction network underlying the kinetic model of E2F1-mediated drug resistance. (B) Illustration of a typical model simulation, accounting for the temporal dynamics of E2F1 protein, miR-205-5p, Harakiri protein (Hrk), BCL2 protein and the population of tumour cells (TC) before (shaded area) and after drug administration (white area). (C) Model predicted values of E2F1, miR-205-5p and the ratio between p73 and DNp73 for different combinations of E2F1 and miR-342-3p expression levels, whose corresponding variables FSE2F1 and FSmiR342 were iteratively modified in the specified intervals. The highlighted and indexed areas correspond to the description in the main text. (D) Predicted tumour cell population size in non-genotoxic drug stimulation conditions (left) and predicted fraction of surviving tumour cells 48 h after genotoxic drug administration (right). The enclosed numbers indicate the transition of tumour growth rate under different biological conditions.
Cell culture
H1299 (ATCC) and SK-Mel-147 (obtained from M. Soengas, Department of Dermatology, University of Michigan, Comprehensive Cancer Center, AnnArbor, MI) were maintained in Dulbecco's modified Eagle's medium (high glucose, 4.5 g/L) containing 2 mM L-glutamine, 1 mM sodium pyruvate, supplemented with 10% FCS, 0.1 mM non-essential amino acids, 50 U/mL penicillin and 50 μg/mL streptomycin. Cell lines were tested for mycoplasma contamination prior to the experiments according to the manufacturer's instructions (Venor GeM Classic, Minerva Biolabs).
TaqMan®MicroRNA single assays and PCR
In general, large and small RNA were extracted using the NucleoSpin® miRNA kit (MACHEREY‐NAGEL). miRNA expression levels were measured using TaqMan®MicroRNA single assays and the 7900HT Fast Real‐Time PCR System (Applied Biosystems). For expression analysis, the comparative CT method was used with RNU6B as endogenous control (19).
Cloning of expression plasmids, 3′ UTR constructs and luciferase reporter assay
miR-205-5p and miR-342-3p were amplified by PCR using genomic DNA as template and cloned into the pWPXL vector. pEZX-MT01 vector expressing the 3′ UTR of E2F1 was purchased from GeneCopoeia. For luciferase assays, cells were transfected using Turbofect (Thermo Scientific). Luciferase activity was measured 36 h after transfection using the Luciferase Reporter Assay System (Promega) and normalized to total protein concentration in cell extract (19).
Western blotting and immunofluorescence
Protein analysis was performed as described previously (31). Briefly, cell lysis was carried out using RIPA buffer, containing PhosSTOP Phosphatase Inhibitor Cocktail (Roche), and protein concentration was determined by Bradford assay (Bio‐Rad). The same quantity of different protein samples was separated by SDS-PAGE and transferred to nitrocellulose membranes (Amersham Biosciences) (31). Selected proteins were detected by the use of specific antibodies for E2F1 (KH‐95, BD Biosciences), BCL2 (AB1, Merck), Bax (D2E11, Cell Signaling), and actin (Sigma) as well as their corresponding HRP‐conjugated secondary antibodies. ECL Plus Western Blotting Detection Reagents (GE Healthcare) allowed detection of HRP activity with the ChemiDocTMTouch Imaging System (BioRad).
Hoechst staining
For quantification of apoptotic cells after miRNA perturbation and cisplatin treatment, cells were stained with Hoechst 33342 (2 µg/mL) dye. Images were evaluated using the ImageJ software.
Combination index
To determine whether or not the combined miRNA treatment has a synergistic effect on E2F1 repression or can increase chemosensitivity of tumour cells, we performed a quantitative analysis of dose-effect relationships using the method proposed by Chou (32, 33) and computed the combination index (CI) using CompuSyn (www.combosyn.com). The combination index of the combined miRNA treatment is calculated using the equation:
,
where D<miR1, miR2> represent the concentrations of miRNAs used in the experiments,  are the median-effect doses of miRNAs (i.e., the dose of a miRNA leading to a 50% reduction of E2F1 expression), and m<miR1,miR2> are kinetic orders that determine the slope of the median-effect curves. Both
  and m<1, 2> are estimated from the calculated famiR and D used in the experiments. For the E2F1 luciferase assays, the fraction affected (fa) is calculated using the equation famiR = 1 - E2F1miR, where E2F1miR indicates the relative luciferase activity after co-transfection of a E2F1-3′ UTR reporter construct and miRNA plasmids into the tumour cells. For the chemosensitivity experiments, famiR indicates increased apoptosis of tumour cells relative to untreated cells that is divided by the apoptosis rate of cisplatin-treated cells and further normalized to the maximum apoptosis rate among all miRNA treatments.
Results and Discussion
Cooperative E2F1 regulation by miRNA pairs
To overcome E2F1-mediated chemoresistance, we propose to employ a combinatorial treatment using a genotoxic drug and a miRNA adjuvant. The latter is to be realized through replacing miR-205-5p, an E2F1 suppressor undetectable in many aggressive tumours (19), with a cooperating miRNA pair to strengthen E2F1 repression efficiency and thereby reduce side effects caused by non-specific binding and exaggerated miRNA induction (8).
Using the miRanda algorithm for miRNA target prediction, we identified 25 miRNAs, other than miR-205-5p, that are putative regulators of human E2F1 expression (Figure 1A). Each of these miRNAs is predicted to have one or more binding sites in the 3' UTR of E2F1 and six of these interactions have been experimentally validated using reporter assays (21,34). According to Saetrom and colleagues (10) miRNA cooperativity can be observed when the seed binding sites of a pair of miRNAs are 13-35 nt apart. They derived this rule from controlled experiments in Renilla luciferase reporter constructs in which they cloned pairs of let-7 target sites with different seed site distances into the 3' UTR (10). Using this rule and other analytical steps, we previously developed a computational workflow for the prediction of cooperating miRNA pairs (35). The workflow includes, after miRNA target site prediction and seed site distance discrimination, the prediction of the local secondary structure of putative miRNA triplexes composed of two potentially cooperating miRNAs and their mutual target mRNA (here E2F1).
We applied this workflow in order to predict which miRNA pair can most efficiently suppress E2F1 expression. As a result, we identified five miRNAs that putatively cooperate with miR-205-5p in the regulation of E2F1 (Figure 1A). Further analysis revealed that the identified miR-205-5p binding site is very well conserved (Figure 1B), suggesting its functional interaction with E2F1 mRNA that can lead to the repression of E2F1 (19). Interestingly, all the miRNAs associated within these cooperative pairs have separately been characterized as tumour suppressors in previous studies (36-40).
According to our predictions, all five complex structures have a very low Gibbs free energy (ΔG < -42 kcal/mol) with preserved seed binding sites for both miRNAs in the triplex structure (Table 1). This suggests that all triplexes are thermodynamically stable, which is a prerequisite for effective miRNA-target regulation. Muckstein et al. (41) has shown that the efficiency of RNA interference correlates with the binding energies of miRNA target pairs, while other studies suggest that the seed binding is crucial for effective target regulation (42). We used the secondary structures as template for deriving the tertiary structure of the RNA triplexes to further corroborate a stable structure formation between the pairs of miRNAs and E2F1 mRNA (Table 1). The workflow for modelling RNA triplex tertiary structures is described in the Materials and Methods section as well as in (15). Subsequently, we were interested in the likelihood of triplex formation involving the indicated RNA molecules. Based on a partition function, we computed the equilibrium concentrations of monomers (mRNAE2F1, miRNA1 and miRNA2) as well as possible complex species (i) miRNA1/miRNA2; (ii) miRNA1/miRNA1; (iii) miRNA2/miRNA2; (iv) mRNAE2F1/miRNA1; (v) mRNAE2F1/miRNA2; (vi) mRNAE2F1/mRNAE2F1; (vii) mRNAE2F1/miRNA1/miRNA2. The equilibrium concentrations (0-100 nM) of monomers and complex species enabled us to derive association rates for complex formation, which we used for the parameterization of small kinetic models of cooperative E2F1 regulation. RNA triples with a high triplex formation probability, i.e., high triplex equilibrium concentration, are likely to exhibit cooperative miRNA-target regulation (15). Based on the analytical steps performed we concluded that all five possible triplexes can indeed form stable secondary structures with preserved seed binding of the two miRNAs. However, one candidate triplex stands out. The triplex mRNAE2F1/miR-205-5p/miR-342-3p, has the lowest free energy in the predicted secondary structure (∆G = -50.56 kcal/mol). It also has the highest predicted equilibrium concentration (99.95 nM; Table 1) among all E2F1 triplexes.
Molecular dynamics simulations confirm that miR-205-5p, miR-342-3p and E2F1 mRNA form the most stable triplex among the candidates
To substantiate the results from the previous steps we performed molecular dynamics simulations (MDS) for all five possible E2F1-miRNA triplexes identified and analysed their structural and thermodynamic properties. Stability of the RNA complexes was observed based on the intermolecular hydrogen bonds (H-bonds) formed between the 3′ UTR of E2F1 and targeting miRNA pairs during the MDS run (Figure 2A). The number of intermolecular H-bonds between miRNA and mRNA was also previously used to assess the miRNA binding characteristics in a MDS study (43). Our MDS indicate that the mRNAE2F1/miR-205-5p/miR-342-3p triplex was stable for the longest simulation runtime in comparison to the other triplexes (purple solid line in Figure 2A; the purple arrow on the x-axis indicates the time point where miR-205 dissociates from the triplex). We also observed additional intermolecular H-bonds between miR-205-5p and miR-342-3p along with H-bonds with mRNAE2F1, which might be one of the reasons for the better stability of this complex over others (Figure 2B). In particular, both miRNAs were associated to the E2F1 mRNA for ~560 ps, which is ~140 ps longer than the second most stable RNA triplex mRNAE2F1/miR-205/miR-148a (green solid line in Figure 2A). Furthermore, after the disassociation of miR-205-5p from mRNAE2F1/miR-205-5p/miR-342-3p triplex, miRNA-342-3p continued to maintain intermolecular H-bonds with the E2F1 mRNA until 824 ps (indicated by the extended purple dotted line in Figure 2A). The least stable RNA triplex was mRNAE2F1/miR-205/miR-377 (red solid line that was the first one to end at ~180 ps after dissociation of miR-205 from this triplex in Figure 2A); however, the E2F1 mRNA and miR-377 formed the longest lasting duplex (red dotted line in Figure 2A) and maintained intermolecular H-bonds for the entire MDS runtime (1000 ps). We observed that the most stable RNA triplex mRNAE2F1/miR-205-5p/miR-342-3p has the minimum potential energy (-8241.33 kcal/mol; Table 1), which is 617 kcal/mol less than the second most stable RNA triplex, i.e., mRNAE2F1/miR-205-5p/miR-377 (-7623.90 kcal/mol). Taken together, based on the secondary and 3D structure analyses, mRNAE2F1/miR-205-5p/miR-342-3p was found to be the most stable triplex among the five E2F1 RNA triplexes. This result suggests that these two miRNAs could be the most effective pair to induce cooperative E2F1 repression.
Cooperating miRNAs have different repression effects on E2F1
Kinetic modelling is a powerful tool to dissect the role of miRNAs in gene regulator networks and provides quantitative insights into the function of miRNAs in the regulation of gene expression (44, 45). In order to elaborate the effect of cooperative miRNA regulation on E2F1 concentration, we implemented for each of the predicted RNA triplexes a kinetic model describing miRNA-mediated E2F1 regulation (see Materials and Methods). The five parameterized models for all the possible cooperating pairs enabled us to determine which miRNA pair can efficiently regulate its mutual target gene E2F1. We simulated E2F1 repression by cooperating miRNA pairs, modulating miRNA transcriptional activation in a range between 10-1 and 102. The nominal value of miRNA transcriptional activation is 1, and values below 1 indicate a down-regulation of the miRNAs, while values above 1 represent an up-regulation of the miRNAs. Then, we computed the steady states of E2F1 for different combined expression levels of cooperative miRNAs and repression gains for four scenarios: (i) normal expression of both miRNAs, (ii) strong up-regulation of one of the two miRNAs and (iii) moderate up-regulation of both miRNAs in combination (Figure 3). The repression gain represents a measure for the efficiency gained in target repression by either overexpressing a single miRNA or by synergistic miRNA-target regulation. The simulations showed that all five miRNA pairs can regulate E2F1 expression in a synergistic manner and among them miR-205-5p and miR-342-3p have the strongest cooperative effect on E2F1 expression. More specifically, the most efficient target repression is achieved when miR-205-5p and miR-342-3p are simultaneously upregulated (the lines along the diagonal direction in Figure 3). A comparable target repression level can be achieved with one active miRNA only in case of very strong up-regulation (the vertical and horizontal lines in Figure 3). However, high overexpression of a single miRNA is unwanted as our approach aims to avoid off-target effects by applying lower miRNA concentrations. In addition, the model predicted discrepant E2F1 repression efficiencies when the expression of miR-205-5p is upregulated alone and the expression of its cooperating miRNAs is unchanged (the horizontal lines in Figure 3). This suggests that the individual repression efficiency of miR-205-5p on E2F1 may change when it cooperates with different miRNAs having different binding affinities to the mRNA of E2F1.
In vitro experiments verify the synergistic effect on E2F1 repression by miR-205 and miR-342
To verify the computational results that showed the cooperativity of miR-205-5p and miR-342-3p in E2F1 repression, we measured endogenous concentrations of both miRNAs and after overexpression in both cell lines (Figure 4A) and performed luciferase assays and immunoblotting in tumour cells (see Materials and Methods). In luciferase assays we co-transfected H1299 and SK-Mel-147 cells with the 3′ UTR of E2F1 and miR-205-5p/miR-342-3p expression plasmids. We observed a decreased luciferase activity when we co-transfected miR-205 and miR-342 (each 0.5 μg) in comparison to the transfection of either miR-205 or miR-342 (each 1 μg; Figure 4B). The cooperative effect could be observed both on mRNA (Figure S1) and protein (Figure 4C, top panels) levels, showing a strongly reduced E2F1 expression after combined overexpression of miR-205-5p/miR-342-3p in comparison to the overexpression of each miRNA individually. In addition, we showed that both miRNAs are expressed at low levels in various aggressive cancer cells including H1299 and SK-Mel-147 cells (Figure S2). Published high throughput data showed that the other miR-205-cooperating miRNAs (miR-148a/b-3p, miR-377-3p and miR-152-3p) are also expressed at low or negligible levels in H1299 cells (46). This excludes the possibility that E2F1 is regulated by the other miRNAs that are predicted to cooperate with miR-205. These data are also consistent with our model simulations that show the strongest down-regulation of E2F1 protein when both miRNAs are simultaneously upregulated to a medium level (Figure 4C, bottom panels). This demonstrates the ability of the model for making accurate predictions about E2F1 repression by the two miRNAs. We performed additional luciferase assays to determine whether the synergistic effect can be observed for different miRNA concentrations (Figure 4D). The results were used to calculate the combination index (CI) to quantify the synergism of the combined miRNA treatment (see Materials and Methods). The index is recognized as the standard measure of combination effect that indicates a greater (CI < 1) or smaller (CI > 1) effect than the expected additive effect (32, 47). When both miRNAs (each 0.25 μg or 0.5 μg) were co-transfected into H1299 cells, the combined miRNA treatment showed a mild synergistic effect (CI = 0.785 or 0.835) on the repression of E2F1, and with increasing amounts of both miRNAs (e.g. 1 μg each) a very strong synergism was achieved (CI = 0.018; Figure 4E). In SK-Mel-147 cells, combined miRNA transfection showed synergistic effects on E2F1 repression (CI = 0.255, 0.276, or 0.220 for 0.25 µg, 0.5 µg, or 1 µg miRNA, respectively). Taken together, the results indicate that miR-205-5p and miR-342-3p can cooperate to induce synergistic repression of E2F1 in tumour cells, whereas the degree of synergism seems to be cell context dependent.
Tackling chemoresistance through cooperative E2F1 regulation in tumour cells
Our analyses indicate that miR-205-5p and miR-342-3p can cooperatively repress E2F1 expression. Importantly, this is consistent with published experimental data showing that the repression ability of miR-205-5p alone is weak and therefore extreme overexpression of miR-205-5p is required to achieve an effective repression of E2F1 in tumour cells (48). Extreme overexpression of a single miRNA can lead to off-target effects (6).
To investigate whether miRNA cooperativity can help to abrogate chemoresistance in tumour cells we integrated cooperative target regulation into a kinetic model of E2F1-mediated chemoresistance that includes the p73/DNp73 regulatory circuitry previously described in Vera et al. (18). The expanded model includes thirteen ordinary differential equations (see Materials and Methods). A network representation of the model is shown in Figure 5A. Model simulations were used to assess the downstream effect of miR-205-5p and miR-342-3p regulation, individually and in cooperation, on E2F1 expression and drug-induced apoptosis. Furthermore, we investigated the dynamics under growth and chemotherapy conditions of a population of tumour cells (denoted by the model variable TC) whose response to drug treatment is mediated by the described regulatory network. Given that overexpression of E2F1 is associated with chemoresistance in tumour cells (19,49) and that miR-342-3p down-regulation has been associated with the emergence of cancer cell phenotypes resistant to anticancer drugs (50), we simulated the model while iteratively modifying model variables that modulate the expression levels of E2F1 mRNA (FSE2F1) and miR-342-3p (FSmiR342). These variables can be regarded as experimental approaches (e.g., a plasmid or viral vector carrying miRNA mimics or anti-miRNA oligonucleotides) that can change the expression level of a specific gene. Then, the predicted E2F1 protein expression levels, miR-205-5p levels, the ratio between p73 and DNp73, and the size of the tumour cell population were visualized (Figure 5C, D). The detailed description of the model simulations can be found in Supplementary Material.
The simulation results indicate that the combination of the feedback loop structure of the system and the cooperative E2F1 repression by miR-205-5p and miR-342-3p can generate a non-linear regulation landscape for the system (Figure 5C). For low and medium values of the E2F1 synthesis rate, the synergy between miR-205-5p and miR-342-3p succeeds in repressing E2F1 and keeping E2F1 protein expression at low values (area 1 in Figure 5C left). Interestingly, model predictions indicate that high expression of miR-342-3p is sufficient to induce strong E2F1 repression even when the feedback loop structure of the system induces a significant reduction in miR-205-5p expression levels (area 2 in Figure 5C middle). However, in case of high E2F1 mRNA synthesis rates, the balance between p73-induced positive and DNp73-induced negative regulation of miR-205-5p expression is distorted (area 3 in Figure 5C right). Hence, miR-205-5p expression becomes inhibited by high levels of DNp73 while the expression level of miR-342-3p is low (area 3 in Figure 5C middle). With the increased miR-342-3p expression, miR-205-5p expression can recover due to the loss of E2F1 through an effective cooperative repression (area 4 in Figure 5C left and middle).
Furthermore, our simulations predict that tumour cell population growth can be controlled by the effect of miR-205-5p and miR-342-3p cooperativity (Figure 5D left). More specifically, the proliferation of tumour population starts increasing with the up-regulation of the E2F1 expression level and becomes uncontrollable when the E2F1 expression level crosses certain thresholds (①→②). The tumour growth is relieved while increasing the expression level of miR-342-3p that can cooperate with miR-205-5p to suppress E2F1 (②→③). Moreover, under genotoxic drug administration the cooperating miRNAs enhance drug-induced apoptosis of tumour cells even in case of high E2F1 expression levels, resulting in a reduced tumour cell population (Figure 5D right). In particular, the controllable tumour cells (growth rate ≤ 150%) can be eliminated as a result of the cooperative miRNA repression on E2F1 (the cyan area); however, the tumour cells (growth rate > 150%) having extremely high E2F1 levels or short of miR-324-3p for the cooperative repression still show resistance to the drug effect (the pink area). Taken together, these results indicate that the synergistic repression of E2F1 by miR-205-5p and miR-342-3p has the potential to repress the growth of tumour cell populations, but can also sensitize tumour cells to the administration of anticancer drugs. This suggests that therapies combining the administration of genotoxic drugs with miR-342-3p and miR-205-5p may enhance the drug-induced apoptosis of tumour cells with abnormally high expression levels of E2F1.
Experimental validation of increased chemosensitization through E2F1 suppression by cooperating miRNAs
To demonstrate that suppression of E2F1 expression by the cooperating miRNA pair can be used to sensitize tumour cells to chemotherapy, we overexpressed miR-205-5p and miR-342-3p either alone or both together in the absence and presence of different cisplatin concentrations (5 µM - 60 µM) and quantified the amount of apoptotic cells using Hoechst 33342 live-cell staining and fluorescence microscopy. As shown in Figure 6A, individual miRNA transfection (each at 0.5 µg) leads to an almost 5.5-fold increase of apoptotic cells in combination with cisplatin treatment.
The effect of miR-205-5p and miR-342-3p on tumour cell chemosensitization. (A) Cisplatin (cDDP) treatment of chemoresistant H1299 with single miR-205-5p (0.5 µg or 1 µg plasmid), miR-342-3p (0.5 µg or 1 µg plasmid) or combined miRNA (0.25 µg or 0.5 µg each plasmid) overexpression. Twenty-four hours post transfection, cisplatin was added to the cell culture medium at a concentration of 20 µM. For apoptosis detection, live-cell assays were performed using Hoechst 33342 staining. Fluorescent cells were visualized by microscopy and apoptotic cells were counted from seven areas. Chemosensitization is indicated as a relative increase of apoptosis in cisplatin-treated cells compared to untreated cells (set as 1). Data shown in the bar plot are mean ± SD (n = 3). (B) The table shows the calculated fraction affected (fa) by the individual miRNA or combined miRNA treatments and the corresponding combination indexes (CI) of the combined treatments. fa is denoted by the relative increase of apoptotic tumour cells that is normalized to the treatment with cisplatin only (i.e., ctrl in +cDDP) and divided by the maximum increase of apoptosis in all listed treatments (synergism: CI < 1; antagonism: CI > 1). The estimated parameter values can be found in Table S6. (C) Western blot analyses show protein levels of E2F1 as well as BCL2 and Bax as survival and apoptosis markers. Actin was used as loading control and for normalisation to quantify protein bands (top of each immunoblot).
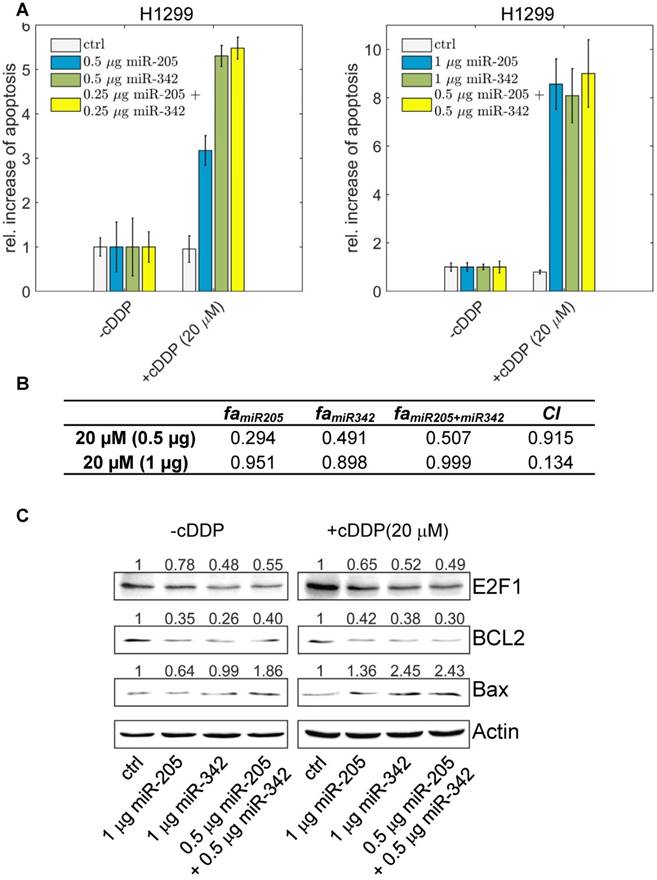
The highest increase in apoptotic cells, however, was achieved when both miR-205-5p and miR-342-3p were co-expressed (each at 0.25 µg) in combination with cisplatin. When we increased the concentration of both miRNAs, the combined miRNA treatment (each at 0.5 µg) resulted in the highest increase of apoptosis compared to the experiments where we transfected miRNAs individually (each at 1 µg). We calculated the combination index and found that the combined treatment shows a synergistic effect (CI = 0.134; Figure 6B). When we increased the cisplatin concentration to 40 µM, the combined miRNA treatment showed a synergistic effect (CI = 0.876) only at a low dose combination (Figure S3). At the protein level, the increased chemosensitivity of tumour cells, mediated by both miRNAs, was accompanied by reduced E2F1 and BCL2 expression and upregulated Bax (Figure 6C). Importantly, as E2F1 is upregulated in response to chemotherapy, the cooperating miR-205-5p and miR-342-3p exhibit the strongest chemosensitizing effect at a lower cisplatin concentration. According to our results, a combined administration of both miRNAs to improve cancer chemotherapy would not only enable but also make dose reduction of concomitant genotoxic drugs necessary.
Conclusion
Several studies have been conducted to explore miRNA-based therapies with the goal to improve outcomes of cancer treatment (51-54). For example, overexpression of miR-34a or knockdown of its direct and functional target CD44 can inhibit prostate cancer regeneration and metastasis (55). The simultaneous supplementation of miR-34 and let-7 in mouse models of non-small cell lung cancer results in a wide repression of key oncogenes and lead to a survival advantage (56). These therapies require a high specificity when targeting miRNAs or technologies to overcome physiological and cellular barriers to deliver miRNAs into targeted cells in case of miRNA replacement therapies. The efficient delivery of anti-miRNA agents using nanoparticle-based delivery vesicles was tested in a mouse model of lymphoma. The system was used to successfully inhibit the miR-155 oncomiR in vivo (57). However, miRNA replacement therapies can be compromised by off-target effects that induce unwanted gene regulation in other endogenous miRNA targets (58). We have shown that miRNA cooperativity reduces the total concentration of therapeutic miRNAs required to achieve a measurable gain of function, and therefore reduces off-target effects.
In this article, we described the implementation of a systems biology approach that combines tools and algorithms from different disciplines to design therapeutic adjuvants for the treatment of chemoresistant tumours. The validity of this approach has been demonstrated using in vitro experiments, which lay the ground for further investigations in vivo. Further simulations and experimental data indicate that the cooperative repression of E2F1 by miR-205-5p and miR-342-3p has the potential to repress the growth of highly aggressive tumour cells overexpressing E2F1, and can also sensitize them to the administration of anticancer drugs. Our study suggests that therapies combining the administration of genotoxic drugs with miR-342-3p and miR-205-5p may enhance drug-induced apoptosis of cancer cells and reduce off-target effects. The proposed therapeutic strategy represents the first example that utilizes the effect of cooperative target regulation by a miRNA pair for anti-cancer purposes.
Abbreviations
microRNA: miRNA; E2F1: E2F transcription factor 1; UTRs: untranslated regions; p73: tumour protein p73; DNp73: N-terminally truncated p73 species; BCL2: B-cell lymphoma 2, apoptosis regulator; Bax: BCL2 associated X; MDS: molecular dynamics simulations; CI: combination index; nt: nucleotide; H-bonds: hydrogen bonds; CD44: CD44 molecule.
Acknowledgements
XL, SKG, US, and JV developed the idea and designed the study. US carried out the prediction and characterization of RNA triplexes. SKG performed the molecular dynamics simulations and analysed the data. XL and JV derived the kinetic model, performed the simulations and analysed the data. XL and US performed the combination index analysis. SM, SK, AS, and BP designed and performed the in vitro experiments. XL, SKG, US, SM, and JV drafted the initial version of the paper. XL, SKG, US, SM, AS, BP, and JV revised the paper and all authors approved its final version. JV, OW, and BP supervised the study and are equal senior contributors.
Funding
This work was supported by the German Federal Ministry of Education and Research (BMBF) as part of eBio:MelEVIR [031L0073A to JV and OW] and eBio:SysMet [0316171 to JV, OW, and BP] and the University of Rostock. XL thanks the ELAN-fund of Universitätsklinikum Erlangen (16-08-16-1-Lai). SKG acknowledges the support from the council of scientific and industrial research network projects GENESIS (BSC0121) and INDEPTH (BSC0111). US holds a fellowship from the Cancer Institute of NSW and is supported by the Sydney Research Excellence Initiative and the Cure the Future Foundation. We acknowledge support by Deutsche Forschungsgemeinschaft and Friedrich-Alexander-Universität Erlangen-Nürnberg (FAU) within the funding programme Open Access Publishing.
Supplementary Material
The supplementary information includes detailed descriptions of molecular dynamics simulations of RNA triplexes, mathematical modelling of E2F1 regulation by miR-205 and miR-342, and the qPCR experiments. It also contains Figures S1-S4 and Table S1-S6.
Competing Interests
The authors have declared that no competing interest exists.
References
1. Abdullah LN, Chow EK-H. Mechanisms of chemoresistance in cancer stem cells. Clin Transl Med. 2013;2:3
2. Chaffer CL, Weinberg R a. A Perspective on Cancer Cell Metastasis. Science. 2011;331:1559-64
3. Farazi TA, Hoell JI, Morozov P, Tuschl T. MicroRNAs in human cancer. Adv Exp Med Biol. 2013;774:1-20
4. John B, Enright AJ, Aravin A, Tuschl T, Sander C, Marks DS. Human MicroRNA targets. PLoS Biol. 2004;2:e363
5. Selbach M, Schwanhäusser B, Thierfelder N, Fang Z, Khanin R, Rajewsky N. Widespread changes in protein synthesis induced by microRNAs. Nature. 2008;455:58-63
6. Chen Y, Gao D-Y, Huang L. In vivo delivery of miRNAs for cancer therapy: challenges and strategies. Adv Drug Deliv Rev. 2015;81:128-41
7. Peter M. Targeting of mRNAs by multiple miRNAs: the next step. Oncogene. 2010;29:2161-4
8. Lai X, Schmitz U, Gupta SK, Bhattacharya A, Kunz M, Wolkenhauer O. et al. Computational analysis of target hub gene repression regulated by multiple and cooperative miRNAs. Nucleic Acids Res. 2012;40:8818-34
9. Koscianska E, Witkos TM, Kozlowska E, Wojciechowska M, Krzyzosiak WJ. Cooperation meets competition in microRNA-mediated DMPK transcript regulation. Nucleic Acids Res. 2015;43:9500-18
10. Sætrom P, Heale BSE, Snøve O, Aagaard L, Alluin J, Rossi JJ. Distance constraints between microRNA target sites dictate efficacy and cooperativity. Nucleic Acids Res. 2007;35:2333-42
11. Rinck A, Preusse M, Laggerbauer B, Lickert H, Engelhardt S, Theis FJ. The human transcriptome is enriched for miRNA-binding sites located in cooperativity-permitting distance. RNA Biol. 2013;10:1125-35
12. Flamand MN, Gan HH, Mayya VK, Gunsalus KC, Duchaine TF. A non-canonical site reveals the cooperative mechanisms of microRNA-mediated silencing. Nucleic Acids Res. 2017;45:7212-25
13. Nieder-Röhrmann A, Dünnes N, Gerresheim GK, Shalamova LA, Herchenröther A, Niepmann M. Cooperative enhancement of translation by two adjacent microRNA-122/Argonaute 2 complexes binding to the 5' untranslated region of hepatitis C virus RNA. J Gen Virol. 2017;98:212-24
14. Hobert O. Gene regulation by transcription factors and microRNAs. Science. 2008;319:1785-6
15. Schmitz U, Lai X, Winter F, Wolkenhauer O, Vera J, Gupta SK. Cooperative gene regulation by microRNA pairs and their identification using a computational workflow. Nucleic Acids Res. 2014;42:7539-52
16. Lee JS, Leem SH, Lee SY, Kim SC, Park ES, Kim SB. et al. Expression signature of E2F1 and its associated genes predict superficial to invasive progression of bladder tumors. J Clin Oncol. 2010;28:2660-7
17. Alla V, Engelmann D, Niemetz A, Pahnke J, Schmidt A, Kunz M. et al. E2F1 in melanoma progression and metastasis. J Natl Cancer Inst. 2010;102:127-33
18. Vera J, Schmitz U, Lai X, Engelmann D, Khan FM, Wolkenhauer O. et al. Kinetic modeling-based detection of genetic signatures that provide chemoresistance via the E2F1-p73/DNp73-miR-205 network. Cancer Res. 2013;73:3511-24
19. Alla V, Kowtharapu BS, Engelmann D, Emmrich S, Schmitz U, Steder M. et al. E2F1 confers anticancer drug resistance by targeting ABC transporter family members and Bcl-2 via the p73/DNp73-miR-205 circuitry. Cell Cycle. 2012;11:3067-78
20. Del Rosario RCH, Damasco JRCG, Aguda BD. MicroRNA inhibition fine-tunes and provides robustness to the restriction point switch of the cell cycle. Sci Rep. 2016;6:32823
21. Chou C-H, Chang N-W, Shrestha S, Hsu S-D, Lin Y-L, Lee W-H. et al. miRTarBase 2016: updates to the experimentally validated miRNA-target interactions database. Nucleic Acids Res. 2016;44:D239-247
22. Betel D, Koppal A, Agius P, Sander C, Leslie C. Comprehensive modeling of microRNA targets predicts functional non-conserved and non-canonical sites. Genome Biol. 2010;11:R90
23. Kozomara A, Griffiths-Jones S. miRBase: annotating high confidence microRNAs using deep sequencing data. Nucleic Acids Res. 2014;42:D68-73
24. Meyer LR, Zweig AS, Hinrichs AS, Karolchik D, Kuhn RM, Wong M. et al. The UCSC Genome Browser database: extensions and updates 2013. Nucleic Acids Res. 2012;41:D64-9
25. Zadeh JN, Steenberg CD, Bois JS, Wolfe BR, Pierce MB, Khan AR. et al. NUPACK: Analysis and design of nucleic acid systems. J Comput Chem. 2011;32:170-3
26. Darty K, Denise A, Ponty Y. VARNA: Interactive drawing and editing of the RNA secondary structure. Bioinformatics. 2009;25:1974-5
27. Dirks RM, Bois JS, Schaeffer JM, Winfree E, Pierce NA. Thermodynamic analysis of interacting nucleic acid strands. SIAM Rev. 2007;49:65-88
28. Popenda M, Szachniuk M, Antczak M, Purzycka KJ, Lukasiak P, Bartol N. et al. Automated 3D structure composition for large RNAs. Nucleic Acids Res. 2012;40:e112-e112
29. Foloppe N, MacKerell ADJ. All-Atom Empirical force field for nucleic acids: I. parameter optimization based on small molecule and condensed phase macromolecular target data. J Comput Chem. 2000;21:86-104
30. MacKerell AD, Banavali NK. All-atom empirical force field for nucleic acids: II. application to molecular dynamics simulations of DNA and RNA in solution. J Comput Chem. 2000;21:105-20
31. Knoll S, Fürst K, Thomas S, Baselga SV, Stoll A, Schaefer S. et al. Dissection of cell context-dependent interactions between HBx and p53 family members in regulation of apoptosis: A role for HBV-induced HCC. Cell Cycle. 2011;10:3554-65
32. Chou T-C. Theoretical basis, experimental design, and computerized simulation of synergism and antagonism in drug combination studies. Pharmacol Rev. 2006;58:621-81
33. Chou TC, Talalay P. Quantitative analysis of dose-effect relationships: the combined effects of multiple drugs or enzyme inhibitors. Adv Enzyme Regul. 1984;22:27-55
34. Tai MC, Kajino T, Nakatochi M, Arima C, Shimada Y, Suzuki M. et al. miR-342-3p regulates MYC transcriptional activity via direct repression of E2F1 in human lung cancer. Carcinogenesis. 2015;36:1464-73
35. Schmitz U, Lai X, Winter F, Wolkenhauer O, Vera J, Gupta SK. Cooperative gene regulation by microRNA pairs and their identification using a computational workflow. Nucleic Acids Res. 2014;42:7539-52
36. Braconi C, Huang N, Patel T. Microrna-dependent regulation of DNA methyltransferase-1 and tumor suppressor gene expression by interleukin-6 in human malignant cholangiocytes. Hepatology. 2010;51:881-90
37. Zhang H, Li Y, Huang Q, Ren X, Hu H, Sheng H. et al. MiR-148a promotes apoptosis by targeting Bcl-2 in colorectal cancer. Cell Death Differ. 2011;18:1702-10
38. Grady WM, Parkin RK, Mitchell PS, Lee JH, Kim YH, Tsuchiya KD. et al. Epigenetic silencing of the intronic microRNA hsa-miR-342 and its host gene EVL in colorectal cancer. Oncogene. 2008;27:3880-8
39. Katoh Y, Katoh M. Hedgehog signaling, epithelial-to-mesenchymal transition and miRNA (review). Int J Mol Med. 2008;22:271-5
40. Zhang L, Volinia S, Bonome T, Calin GA, Greshock J, Yang N. et al. Genomic and epigenetic alterations deregulate microRNA expression in human epithelial ovarian cancer. Proc Natl Acad Sci U S A. 2008;105:7004-9
41. Muckstein U, Tafer H, Hackermuller J, Bernhart SH, Stadler PF, Hofacker IL. Thermodynamics of RNA-RNA binding. Bioinformatics. 2006;22:1177-82
42. Wang Y, Juranek S, Li H, Sheng G, Tuschl T, Patel DJ. Structure of an argonaute silencing complex with a seed-containing guide DNA and target RNA duplex. Nature. 2008;456:921-6
43. Paciello G, Acquaviva A, Ficarra E, Deriu MA, MacIi E. A molecular dynamics study of a miRNA:mRNA interaction. J Mol Model. 2011;17:2895-906
44. Lai X, Wolkenhauer O, Vera J. Understanding microRNA-mediated gene regulatory networks through mathematical modelling. Nucleic Acids Res. 2016;44:6019-35
45. Lai X, Wolkenhauer O, Vera J. Modeling miRNA regulation in cancer signaling systems: miR-34a regulation of the p53/Sirt1 signaling module. Methods Mol Biol. 2012;880:87-108
46. Kolbert CP, Feddersen RM, Rakhshan F, Grill DE, Simon G, Middha S. et al. Multi-platform analysis of microRNA expression measurements in RNA from fresh frozen and FFPE tissues. PloS One. 2013;8:e52517
47. Foucquier J, Guedj M. Analysis of drug combinations: current methodological landscape. Pharmacol Res Perspect. 2015;3:e00149
48. Dar AA, Majid S, De Semir D, Nosrati M, Bezrookove V, Kashani-Sabet M. miRNA-205 suppresses melanoma cell proliferation and induces senescence via regulation of E2F1 protein. J Biol Chem. 2011;286:16606-14
49. Engelmann D, Pützer BM. Translating DNA damage into cancer cell death-A roadmap for E2F1 apoptotic signalling and opportunities for new drug combinations to overcome chemoresistance. Drug Resist Updat. 2010;13:119-31
50. Cittelly DM, Das PM, Spoelstra NS, Edgerton SM, Richer JK, Thor AD. et al. Downregulation of miR-342 is associated with tamoxifen resistant breast tumors. Mol Cancer. 2010;9:317
51. Kasinski AL, Slack FJ. Epigenetics and genetics. MicroRNAs en route to the clinic: progress in validating and targeting microRNAs for cancer therapy. Nat Rev Cancer. 2011;11:849-64
52. Christopher AF, Kaur RP, Kaur G, Kaur A, Gupta V, Bansal P. MicroRNA therapeutics: Discovering novel targets and developing specific therapy. Perspect Clin Res. 2016;7:68-74
53. Bertoli G, Cava C, Castiglioni I. MicroRNAs: New Biomarkers for Diagnosis, Prognosis, Therapy Prediction and Therapeutic Tools for Breast Cancer. Theranostics. 2015;5:1122-43
54. Ni J, Bucci J, Chang L, Malouf D, Graham P, Li Y. Targeting MicroRNAs in Prostate Cancer Radiotherapy. Theranostics. 2017;7:3243-59
55. Liu C, Kelnar K, Liu B, Chen X, Calhoun-Davis T, Li H. et al. The microRNA miR-34a inhibits prostate cancer stem cells and metastasis by directly repressing CD44. Nat Med. 2011;17:211-5
56. Kasinski AL, Kelnar K, Stahlhut C, Orellana E, Zhao J, Shimer E. et al. A combinatorial microRNA therapeutics approach to suppressing non-small cell lung cancer. Oncogene. 2015;34:3547-55
57. Cheng CJ, Bahal R, Babar IA, Pincus Z, Barrera F, Liu C. et al. MicroRNA silencing for cancer therapy targeted to the tumour microenvironment. Nature. 2015;518:107-10
58. van Dongen S, Abreu-Goodger C, Enright AJ. Detecting microRNA binding and siRNA off-target effects from expression data. Nat Methods. 2008;5:1023-5
Author contact
![]() Corresponding authors: Xin Lai, Tel: +49(0)91318545888, Fax: +49(0)91318533874, Email: xin.laide; Julio Vera, Tel: +49(0)91318545888, Fax: +49(0)91318533874, Email: julio.vera-gonzalezde; Olaf Wolkenhauer, Tel: +49(0)3814987570, Fax: +49(0)3814987572, Email: olaf.wolkenhauerde
Corresponding authors: Xin Lai, Tel: +49(0)91318545888, Fax: +49(0)91318533874, Email: xin.laide; Julio Vera, Tel: +49(0)91318545888, Fax: +49(0)91318533874, Email: julio.vera-gonzalezde; Olaf Wolkenhauer, Tel: +49(0)3814987570, Fax: +49(0)3814987572, Email: olaf.wolkenhauerde