Impact Factor
- Issue 13; 2026
- Issue 12; 2026
- Issue 11; 2026
- Issue 10; 2026
- Issue 9; 2026
- Volume 16; 2026
- Advance Articles
- Past Issues
- Cover Images
- Cover Suggestion
- Index & Coverage
- Special Issues
Introduction
Materials and Methods
Results and Discussion
Conclusion
Abbreviations
Supplementary Material
Acknowledgements
References
International Journal of Biological Sciences
International Journal of Medical Sciences
 Global reach, higher impact

Theranostics 2018; 8(4):1075-1083. doi:10.7150/thno.22794 This issue Cite
Research Paper
Nondestructive Analysis of Tumor-Associated Membrane Protein Integrating Imaging and Amplified Detection in situ Based on Dual-Labeled DNAzyme
Xiaoxia Chen1,#, Jing Zhao1,#, Tianshu Chen1, Tao Gao1, Xiaoli Zhu1, ![]() , Genxi Li1,2,
, Genxi Li1,2, ![]()
1. Center for Molecular Recognition and Biosensing, School of Life Sciences, Shanghai University, Shanghai 200444, P. R. China
2. State Key Laboratory of Pharmaceutical Biotechnology and Collaborative Innovation Center of Chemistry for Life Sciences, Department of Biochemistry, Nanjing University, Nanjing 210093, P. R. China
#These authors contribute equally to this work.
Received 2017-9-15; Accepted 2017-11-5; Published 2018-1-1
Abstract

Comprehensive analysis of the expression level and location of tumor-associated membrane proteins (TMPs) is of vital importance for the profiling of tumor cells. Currently, two kinds of independent techniques, i.e. ex situ detection and in situ imaging, are usually required for the quantification and localization of TMPs respectively, resulting in some inevitable problems.
Methods: Herein, based on a well-designed and fluorophore-labeled DNAzyme, we develop an integrated and facile method, in which imaging and quantification of TMPs in situ are achieved simultaneously in a single system. The labeled DNAzyme not only produces localized fluorescence for the visualization of TMPs but also catalyzes the cleavage of a substrate to produce quantitative fluorescent signals that can be collected from solution for the sensitive detection of TMPs.
Results: Results from the DNAzyme-based in situ imaging and quantification of TMPs match well with traditional immunofluorescence and western blotting. In addition to the advantage of two-in-one, the DNAzyme-based method is highly sensitivity, allowing the detection of TMPs in only 100 cells. Moreover, the method is nondestructive. Cells after analysis could retain their physiological activity and could be cultured for other applications.
Conclusion: The integrated system provides solid results for both imaging and quantification of TMPs, making it a competitive method over some traditional techniques for the analysis of TMPs, which offers potential application as a toolbox in the future.
Keywords: tumor-associated membrane proteins, DNAzyme, in situ imaging, quantitative detection, nondestructive analysis
Introduction
Tumor-associated membrane proteins (TMPs) are a kind of protein that expressed on cancer cells aberrantly [1]. They usually serve as hallmarks for identifying the physiological status of a cell at a given time in carcinogenesis and the development of malignant tumors [2]. Profiling the characterization of TMPs is therefore crucial for tumor diagnosis [3], drug targeting transport [4], and cell type classification [5].
Currently, there are two main ways for the profiling of TMPs: ex situ detection and in situ imaging [6-8]. Among the ex situ detection methods, the most widely used method is western blotting. Despite the success in semi-quantitative detection of specific proteins, western blotting still has some disadvantages: low sensitivity, likely occurred unspecific bands, and requirement of sophisticated operation. To mitigate the shortcomings, numerous efforts have thus been devoted for the development of new methods to improve the quantitative performance [9-11]. Nevertheless, as a big inherent limitation of ex situ detection, lack of locational information of TMPs on cells should be resolved using an independent in situ imaging method. Immunofluorescence is one of the most representative and commonly-used imaging method, but is still far from satisfactory at present. Great attentions are being paid on the development of novel high-/super-resolution microscopy and fluorescent molecular probes [8,12-13]. Despite the great progress, the gap of in situ imaging for quantitative analysis should still be filled by ex situ detection. Thus, it becomes indispensable that two sets of independent experiments are required for the profiling of TMPs, making the entire process tedious and unfriendly. More importantly, to complete both the ex situ detection and in situ imaging, a batch of cells are usually divided into two parts. Consequently, it is difficult for a specific cell to be adopted simultaneously for ex situ detection and in situ imaging. It turns out, a serious problem arises: the results acquired for the two aspects are not from the same targeted cells. This problem is vital, especially for those cells with little amount but potentially diversified molecular phenotypes, e.g. circulating tumor cells (CTCs).
To address the aforementioned problem, development of a method that integrates imaging and quantitative analysis into a single system is a possible way. DNA, owing to its programmability and some exciting functions like DNAzyme and aptamer, has become the material of choice for the construction of complex molecular devices for biosensing applications [14-16]. Herein, by adopting a well-designed DNAzyme, we develop an integrated strategy to comprehensively analyze TMPs. In situ imaging and amplified detection of TMPs in a single system is thereby achieved, which is capable of providing both the locational and the quantitative information of TMPs. In comparison with some conventional methods, this DNAzyme-based method has the advantages of two functions in one integrated system (two-in-one), high sensitivity, and non-destructivity. Potential application of this method as a toolbox is also expected in the future. From the aspect of DNAzyme, this work especially the concept of dual-labelling also expands its application, which provides a reference for the research on DNAzyme.
Materials and Methods
The zinc ion-dependent DNAzyme and its substrate were both synthesized by Sangon Biotech Co., Ltd. (Shanghai, China) and purified by high-performance liquid chromatography (HPLC). Their sequences were as following: DNAzyme (Enz) (5'-Biotin-(A)9CATCTCTTCTCCGAGCCGGTCGAAATAGTGAGT-FAM-3'), substrate (Sub) (5'-Cy3-ACTCACTATrAGGAAGAGATG-BHQ2-3') and cleaved substrates (CS1: 5'-Cy3-ACTCACTATrA-3', CS2: 5'-GGAAGAGATG-BHQ2-3'). Biotin labeled MUC1 antibody, biotin labeled EpCAM antibody, HRP labeled EpCAM antibody, the primary antibodies of MUC1, EpCAM and GAPDH, the second antibody goat anti rabbit IgG (HRP) were obtained from Abcam Co., Ltd. (Cambridge, MA, USA). Streptavidin, ZnCl2 and o-phenylenediamine dihydrochloride (OPD) were purchased from Sigma Aldrich (St. Louis, MO, USA). Other chemicals were all of analytical grade and used without further purification. MTT Cell Proliferation and Cytotoxicity Detection Kit, Cell Apoptosis Detection Kit with Annexin V keyfluor647 & PI and cell culture products were purchased from KeyGen Biotech. Co., Ltd. (Nanjing, China). Fetal bovine serum (FBS) was obtained from GIBCO Co., Ltd. (Grand Island, NY, USA). Deionized water was obtained through Milli-Q purification system (Millipore, Milford, MA, USA) to a resistivity of > 18 MΩ•cm.
Cell culture
MCF-7 (human breast cancer cell, MUC1-positive, EpCAM-positive), HeLa (human cervical cancer cell, MUC1-positive, EpCAM-negative), HepG2 (human hepatocellular carcinoma cell, MUC1-negative, EpCAM-positive), and BT474 (human breast cancer cell, MUC1-positive, EpCAM-positive) cell lines were all obtained from the Institute of Biochemistry and Cell Biology, Chinese Academy of Science. These cells were cultured in DMEM (KeyGEN) supplemented with 10% FBS , 100 U/mL penicillin, and 100 g/mL streptomycin, and incubated at 37 °C in a humidified atmosphere of 5% CO2 and 95% air. Those cells at the end of the log phase were selected for the following experiments.
DNAzyme-based in situ catalysis
Cells were seeded in confocal dishes and incubated at 37 °C for 24 h. After removing the medium by washing with phosphate-buffered saline (PBS) for three times, the cells were blocked with 5% bovine serum albumin (BSA) for 30 min, followed by incubating with biotin labeled antibody, streptavidin, and DNAzyme each for 1 h. After removing the unbound DNAzyme, 100 μM Zn2+ and 500 nM substrate were delivered into the dishes and incubated for 1.5 h to launch the DNAzyme-based in situ catalysis. During the whole processes, the cells were washed with PBS for three times before a new reagent was added.
Imaging of TMPs
The supernatant of the products of the DNAzyme-based in situ catalysis was collected for fluorescent quantitation of TMPs, while the cells on the confocal dishes were ready for imaging after being washed with PBS for three times. The cell nucleuses were stained with 4', 6-diamidino-2-phenylindole (DAPI) for 10 min and imaged using a blue filter, while the TMPs were directly stained by the antibody-conjugated and FAM-labelled DNAzyme and imaged using a green filter. Fluorescent images presented are the superimposition of six images that were obtained at different depths along the Z-axis of the cells, using a LSM 710 confocal laser scanning microscope (Zeiss, Germany).
Fluorescent measurements
The cleavage of the substrate during the DNAzyme-based in situ catalysis allowed the recovery of the BHQ2-quenched fluorescence of the fluorophore Cy3 at the terminal of the substrate. The fluorescence spectra of Cy3 were collected between 550 nm and 650 nm using a maximal excitation wavelength of 548 nm. The peak fluorescence at 568 nm was recorded for quantification.
In addition to the fluorescent quantitation of TMPs, dynamic studies of the catalysis were also performed using fluorescent measurements. In detail, a certain concentration of substrate and Zn2+ were added into the DNAzyme solution. After reaction at 37 °C for different times, the changes of the substrate were monitored using the fluorescent signal of Cy3, while the monitoring of the changes of the DNAzyme relied on the fluorophore FAM (maximal excitation wavelength: 496 nm, maximal emission wavelength: 519 nm). All the fluorescent measurements were carried out using an F-7000 Fluorescence Spectrophotometer (Hitachi, Japan).
Gel electrophoresis analysis
Polyacrylamide gel electrophoresis was performed for the characterization of the products of the DNAzyme-based catalysis. 10 μL of the products together with 2 μL 6×loading buffer was loaded onto a 20% non-denaturing polyacrylamide gel. The electrophoresis experiments were carried out in 1×Tris-boric acid-EDTA (TBE) at 120 V for 90 min. Subsequently, the gel was washed with distilled water twice and visualized using silver staining. The imaging of the gel was performed using a Gel Doc XR Imaging System (Bio-Rad, USA).
Western blot analysis
Proteins were extracted from cells with RIPA buffer (KeyGen, China) containing 1% Phenylmethanesulfonyl fluoride (PMSF). 10 μL of the proteins was separated by standard 10% SDS-PAGE gel and electro-transferred onto a polyvinylidene difluoride (PVDF) membrane. Then, the membrane was blocked with 5% (w/v) nonfat dry milk in Tris-buffered saline with tween 20 (TBST) for 2 h at room temperature, and washed with TBST three times per 10 min. The blocked membranes were probed with rabbit monoclonal antibody to MUC1, EpCAM, and GAPDH antibody respectively (working as normalization control) at 4 °C overnight, followed by incubating with anti-rabbit secondary antibody for 2 h at room temperature. Finally, the western blot signals were detected by a ChemiDocTM XRS Plus luminescent image analyzer (Bio-Rad, USA).
Cell-based ELISA
Quantitative detection of EpCAM on MCF-7 and HeLa cell lines was also performed using enzyme-linked immunosorbent assay (ELISA). The processes for cell cultivation and labeling with antibody are the same as hereinbefore by using a HRP-labeled anti-EpCAM antibody instead. Subsequently the cells were incubated with 100 μL of the HRP substrate (0.4 mg/mL OPD, 11.8 mg/mL Na2HPO4•2H2O, 7.3 mg/mL citric acid and 0.015% H2O2) for 15 min at 37 °C in dark. The reaction was stopped with 50 μL of 1 M H2SO4. Absorbance was measured at 450 nm with a SpectraMax M3 Multi-Mode Microplate Reader (Molecular Devices, Sunnyvale, CA, USA).
Cytotoxicity assay
The cell growth curve and cell survival rate were observed by means of MTT assay. In detail, 96-well microtiter plates were used to culture MCF-7 cells (200 μL, 1×10³ cells•well-1) at 37 °C for 24 h to make cells attach. The cells were assembled with DNAzyme as has been mentioned above. After conducting the DNAzyme-based analysis of TMPs in DMEM or HEPES buffer solution with the help of 100 μM Zn2+, the cells were washed with PBS and then recultured in fresh medium. To conduct MTT assay, the cells were allowed to incubate with 50 μL of 1×MTT solution at 37 °C for 4 h to form formazan. Then, 150 μL DMSO was added after removing the MTT solution to dissolve formazan. Finally, absorbance was measured at 550 nm with a microplate reader.
Cell apoptosis
6-well plates were used to culture HeLa cells (1×10⁵ cells•well-1) at 37 °C for 24 h. After analysis, the cells were collected through trypsin digestion, and then stained by Propidium Iodide (PI) and Annexin V conjugated with kFluor 647 for 15 min. The fluorescence intensity of the cells was detected by a MoFlo XDP Flow Cytometer/Sorter (Beckman Coulter, Inc., Brea, USA).
Drug sensitivity assays
Doxorubicin, Gemcitabine and Paclitaxel were purchased commercially and used with concentrations shown in Table S1. Cells (1×10⁴ cells•well-1) were seeded in 96-well plates for 24 h. Each drug with different concentration was added into the well. The range of concentrations tested for each drug is centered around the IC50 derived from large-scale breast cancer cell line screens [17-18]. The cell survival rate was observed by means of MTT assay after treating the cells with drugs for 24 h.
Results and Discussion
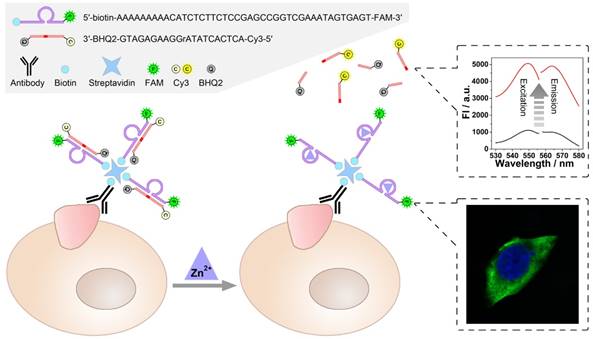
As illustrated in Scheme 1, a zinc ion-dependent DNAzyme is employed. At the 5'-terminal of the DNAzyme, a biotin group is labelled so as to facilitate the linkage with a biotin-labelled antibody through streptavidin-biotin conjugation. As for the 3'- terminal, a fluorophore (FAM) is labelled, which is adopted to image under a fluorescence microscope. Thereby, while being connected with an anti-TMP antibody, the DNAzyme is able to image the TMPs in situ and specifically. Meanwhile, the substrate of the DNAzyme is designed to be a molecular beacon. That is, a fluorophore (Cy3) and a quencher (BHQ2) are labelled at its 5'- and 3'-terminal, respectively. The quenched fluorescence will be recovered after the cleavage of the substrate under the catalysis of the DNAzyme. Thus, the amplified fluorescent signal can be collected using a fluorescence spectrophotometer, and is expected to have positive relationship with the amount of TMPs. In this system, imaging and detection can be conducted simultaneously without interference so as to provide comprehensive information of specific TMPs, including both location and quantification.
Scheme of the DNAzyme based nondestructive analysis of tumor-associated membrane protein integrating imaging and amplified detection.
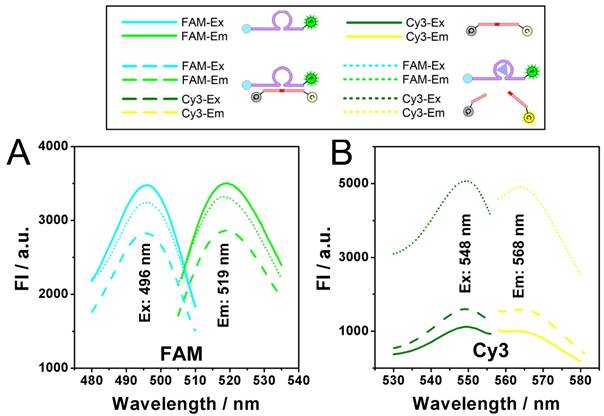
Catalysis of the zinc ion-dependent DNAzyme is first studied, which can be monitored using fluorescent signals. Fig. 1 shows the fluorescence spectra of the FAM-labeled DNAzyme and the Cy3-labeled substrate. As shown, FAM-labeled DNAzyme emits at 519 nm under an excitation of 496 nm (Fig. 1A, solid lines). The DNAzyme presents a slightly suppressed fluorescence (dash lines) when binding to its substrate, which should be ascribed to the partial FRET between the adjacent FAM and Cy3. However, in the presence of Zn2+, the DNAzyme cleaves and thus releases the substrate, resulting in the recovery of the fluorescent signals (dot lines). In the meantime, expected fluorescent signals of the substrate can be also observed. In the case of the substrate alone or binding with the DNAzyme, the fluorescent signals of Cy3 are greatly quenched by the quencher BHQ2. While the Zn2+-dependent catalysis is launched, a remarkable fluorescent signal from the cleaved unquenched Cy3-labeled DNA segment emerges with an excitation of 548 nm and an emission of 568 nm.
A) Excitation and Emission spectra of FAM (Solid lines), FAM after hybridizing with substrate (Dash lines), FAM after DNAzyme catalysis (Dot lines). B) Excitation and Emission spectra of Cy3 (Solid lines), Cy3 after hybridizing with DNAzyme (Dash lines), Cy3 after DNAzyme catalysis (Dot lines).
Dynamic catalysis of the DNAzyme is further studied. Both electrophoretic and fluorescence spectrometric results show that the substrate is cleaved in the presence of the DNAzyme and Zn2+ (Fig. 2A and 2B). For the electrophoretic results (Fig. 2A), in the case of "E+S+Zn2+", the enzymatic activity of the DNAzyme ("E") is activated so that the substrate ("S") is cleaved to "CS", resulting the missing of the intact "E+S" band. It should be noted here that while the reaction time is 0 minutes, the reaction solution of "E+S+Zn2+" is added into the well of the electrophoresis immediately after they are mixed. But actually, at the beginning of the electrophoresis, there are still a few minutes that allow the catalysis to be launched in the well. So, the band of "CS" can still be observed, whereas the band of "E+S" is not so obvious. For fluorescent measurements, a standard curve is first obtained in Fig. S1, showing a fine linear relationship between the fluorescence intensity of Cy3 and the concentration of the cleaved substrate (CS here is synthesized directly from commercial approach instead of the catalysis of the DNAzyme), which would provide a reference for the theoretical 0% and 100% cleavage during the catalysis. While the upper and lower limits are defined, it can be found from the catalytic kinetic curve in Fig. 2B that the catalyzing efficiency of the DNAzyme reaches 92%, a value close to 100%.
Dynamic catalysis of the DNAzyme. A) Gel electrophoretic analysis of DNAzyme catalysis products at different reaction time (0, 0.5, 1.0, 1.5, 2.0, 3.0, 4.0 h). B) Fluorescence intensity of Cy3 obtained from substrate (black), substrate hybridizing with DNAzyme (red), and substrate after DNAzyme catalysis with Zn2+ (blue). Theoretical signal intensities for 0% and 100% cleavage (green curves) are obtained from Fig. S1. C) Fluorescence intensity of Cy3 with various concentrations of DNAzyme and Zn2+.
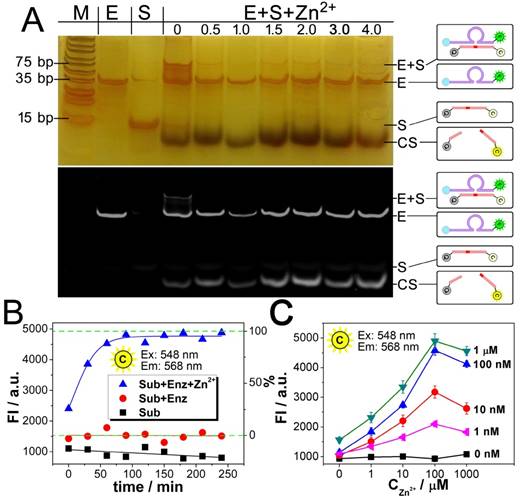
The results from Fig. 2A and 2B also confirm each other that the catalysis reaches a plateau after a reaction time of 90 min, which is adopted as an optimized reaction time in the following experiments. Fig. 2C presents the relationship between the catalysis and the quantity of Zn2+. As shown, in all the cases of the DNAzyme ranging from 1 nM to 1 μM, the catalysis is enhanced with the concentration of Zn2+. But a slight decrease is also observed, if the concentration of Zn2+ is much higher than 100 μM. As a result, the optimized concentration of Zn2+ is set as 100 μM. As for the catalytic efficiency, a positive correlation is observed between the signal and the concentration of the DNAzyme from 0 nM to 1 μM in the presence of 500 nM substrate, suggesting a good catalytic efficiency.
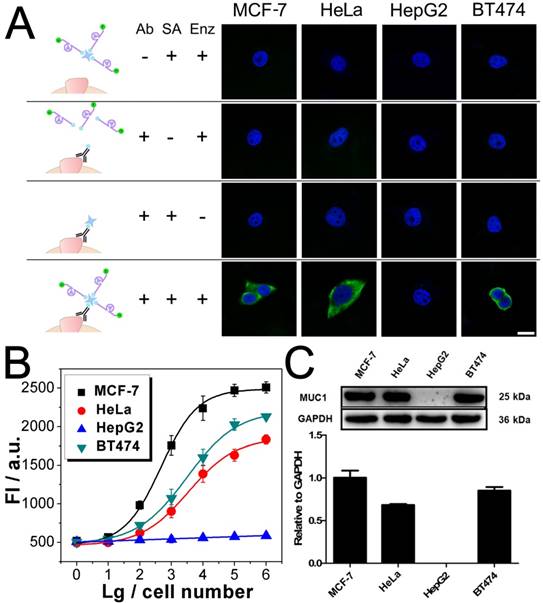
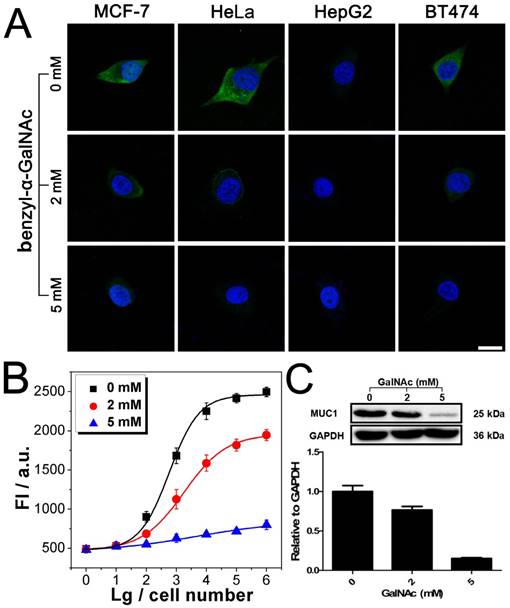
After being conjugated with antibody, the fluorophore- labeled DNAzyme can be adopted for the imaging of TMPs in situ. Here, two kinds of TMPs, i.e. mucin 1 (MUC1) and epithelial cell adhesion molecule (EpCAM), are selected as two model targets. Confocal microscopy imaging of these two kinds of TMPs was carried out on a serious of cancer cell lines, on which the expression of MUC1 and EpCAM differs a lot: MCF-7 (MUC1: +, EpCAM: +), HeLa (+, -), HepG2 (-, +), and BT474 (+, +). As shown in Fig. 3A, only in the presence of all the components of the probe, including the anti-MUC1 antibody, the DNAzyme and the linker streptavidin, apparent green fluorescence from the fluorophore FAM representing the distribution of MUC1 on cells could be observed. The only exception is the HepG2, which is the only MUC1-negtive cell of these four cell lines. In all the other cases that one of the components is missing, only blue fluorescence from the nucleus-targeted fluorophore DAPI can be observed. While anti-EpCAM antibody is adopted to image EpCAM in situ, similar results are also obtained (Fig. S2A), in which all the EpCAM-positive cells (MCF-7, HepG2, and BT474) can be imaged well. Furthermore, to study the changes of the expression of TMPs, benzyl-α-GalNAc, a specific inhibitor of MUC1, is adopted. As expected, it is found that after being treated with benzyl-α-GalNAc and subsequently imaged using the anti-MUC1 antibody-conjugated DNAzyme, those MUC1-positive cells (MCF-7, HeLa, and BT474) display decreased and even disappeared green fluorescence (Fig. 4A). In conclusion, the above results suggest that the DNAzyme-based immunofluorescence is qualified for the imaging of TMPs in situ with considerable universality and sensitivity.
Imaging and quantitative detection of MUC1 in MCF-7, HeLa, HepG2, and BT474 cells. A) Confocal microscopy images of MUC1 based on FAM labled DNAzyme. B) Quantitative detection of MUC1 upon the DNAzyme catalysis of substrate. C) Western blot results of MUC1 expression. Scale bar: 20 μm.
Imaging and quantitative detection of MUC1 in MCF-7 after treatment with benzyl-α-GalNAc. A). Confocal microscopy images of MUC1 after treatment with benzyl-α-GalNAc. B) Quantitative detection of MUC1 upon the DNAzyme catalysis of substrate after treatment with benzyl-α-GalNAc. C) Western blot results of MUC1 expression after treatment with benzyl-α-GalNAc. Scale bar: 20 μm.
As depicted in Scheme 1, the fluorescent signals of the cleaved substrate can be collected from the supernatant for the quantification of TMPs. To realize the simultaneous imaging and quantification of TMPs in a single system, the substrate should be guaranteed to not interfere with the imaging. This issue is addressed by successfully imaging in the presence of different amount of substrate (Fig. S3). On this basis, the concentration of the substrate used for the TMPs quantification is optimized. As shown in Fig. S4, in the absence of the DNAzyme, the intact substrate shows an increased fluorescent signal with its concentration (red curve), which should be ascribed to the incompletely quenched fluorescence of Cy3. And, this fluorescent signal can be recognized as a background signal. While in the presence of TMPs-associated DNAzyme, the fluorescent signal is observed to be greatly enhanced owing to the detachment of the quencher and the fluorophore under the catalysis of the DNAzyme (black curve). The enhancement also depends on cell numbers, because more cells could recruit more DNAzyme, and thus provide higher catalytic efficiency. While 100 000 cells are adopted, a linear regressive curve without any plateau is observed in a substrate concentration ranging from 0 to 1 μM, suggesting the TMPs-associated DNAzyme is excess and all the substrate has been cleaved. But if 1 000 cells are adopted, a plateau after 500 nM can be observed, suggesting a ceiling of the catalysis. To confirm that it is the DNAzyme but not the nucleases inside the cells who results in the cleavage of the substrate and thereafter the increasing of the fluorescent signals, a comparison of the fluorescent signals of Cy3-labeled substrate in the absence and presence of cells is conducted. As shown in Fig. S4, the two couples of curves almost overlap (blue curves and red curves), suggesting the nucleases inside the cells do little effect to the fluorescent signals. Since that quantification of little amount of TMPs is urgently required, 500 nM instead of a higher concentration of the substrate is adopted to avoid excessive background signal.
Quantification of TMPs on different cells is then conducted using the fluorescent signal of the substrate. Detection of MUC1 is shown in Fig. 3B, from which some important conclusions can be drawn: 1) Results show that only HepG2 cell line is MUC1 negative. The results coincide well with both the DNAzyme-based immunofluorescence (Fig. 3A) and the western blotting (Fig. 3C). 2) The expression of MUC1 on those MUC1 positive cell lines differs with a gradient of MCF-7 > BT474 > HeLa, which cannot be discriminated from the immunofluorescence but coincides with the western blotting results. 3) The traditional western blotting, though provides quantitative results, needs sophisticated operation and a large number of cells (1×10⁵ cells at least). On the contrary, as for our DNAzyme-based detection method, the process is easy and in situ; cells less than 100 are enough to provide quantitative information. Similar conclusion can be also drawn from similar results if the inhibitor of MUC1 is introduced (Fig. 4) or if EpCAM is detected by using anti-EpCAM antibody instead (Fig. S2). Comparison of our method with the conventional ELISA is also conducted. Anti-EpCAM antibody conjugated with horseradish peroxidase (HRP) is adopted to catalyze the oxidation of OPD, so as to give a colorimetric signal for the detection of EpCAM. Results show that the ELISA is also available for the detection of TMPs. But the performance is not good, exhibiting a large background signal of the TMP-negative cells (Fig. S5).
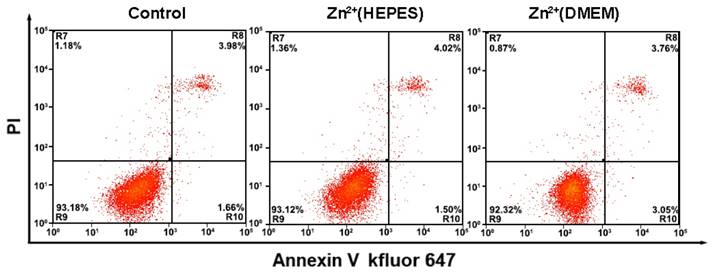
During the analysis of the TMPs, the biological reagents as well as the gentle treatments are expected to impact little on the physiological activity of the cells. Thus, the cells could be adopted for further applications, e.g. culture and testing of drug susceptibility. In our experiments, growth curves of the cells after analysis were first obtained using a MTT assay. Results show that the whole analytical processes either in HEPES buffer solution or DMEM culture medium do little effect to the growth of the cells (Fig. S6 and S7). Monitoring of the cell status using flow cytometry with an Annexin V kFluoR647/PI apoptosis detection kit was also conducted. Over 90% cell viability is observed in both cases of cells before and after analysis (including imaging and quantitative detection) (Fig. 5). There is no significant distinction of the cell viability between these two cases. The results further confirm that our method does not affect cell viability or induce apoptosis. Finally, the cells after analysis were adopted for the testing of drug susceptibility. As shown in Table S1 and Fig. S8, MCF-7 cells are highly sensitive to Dox and PTX but not sensitive to GEM. The results agree well with previous reports [19]. No significant difference of cell sensitivity to drugs is observed between cells with and without analysis. Ex vivo culture and testing of drug susceptibility of cancer cells obtained from patients are critical for individualized treatment. The above results suggest that our methodology is nondestructive and may provide a strategy to integrate our TMPs analysis further with the testing of drug susceptibility or other applications for theranostic purposes.
Flow cytometry analysis of MCF-7 cells apoptosis with a combination of Annexin V-kevfluor647 and PI with and without analysis. Non-apoptotic cells (Annexin V-/PI-), early apoptotic cells (AnnexinV-/PI+), late apoptotic cells (Annexin V+/PI+) and necrotic cells (Annexin V+/PI-)
Conclusion
In summary, we have developed a novel strategy for the comprehensive analysis of TMPs by integrating imaging and quantitation into a single system. Fluorophore-labeled DNAzyme and substrate couple is elaborately designed, in which the DNAzyme is involved for imaging while the substrate is adopted for amplified quantitation. Results show that like the conventional immunofluorescence technique the DNAzyme-based immunofluorescence is able to roughly show the expression level of TMPs in situ as well as their locational information. More importantly, in the meantime, the cleavage of the substrate under the catalysis of the DNAzyme provides fluorescent signals for the quantitative analysis of the TMPs. Benefited from the highly efficient catalysis, a favorable sensitivity that enables the detection of TMPs on only 100 cells in situ is obtained. The accuracy has also been confirmed by western blotting. Capable of providing solid results for both imaging and quantification of TMPs, the integrated system is easily achieved through a two-step assembly and a catalytic reaction. Moreover, it has also been proven that the integrated system is nondestructive, making it a competitive method over some traditional techniques for the analysis of TMPs.
Abbreviations
TMPs: tumor-associated membrane proteins; MUC1: mucin 1; EpCAM: epithelial cell adhesion molecule; Enz: DNAzyme; Sub: substrate; CS: cleaved substrate; Dox: doxorubicin; GEM: gemcitabine; PTX: paclitaxel; ELISA: enzyme-linked immunosorbent assay; HRP: horseradish peroxidase; OPD: o-phenylenediamine dihydrochloride; MTT: 3-(4,5-dimethylthiazol-2-yl)-2,5-diphenyl tetrazolium bromide; PI: propidium iodide; FBS: fetal bovine serum; BSA: bovine serum albumin; PBS: phosphate-buffered saline; DMEM: dulbecco's modified eagle medium.
Supplementary Material
Supplementary figures for standard linear calibration curve of CS; imaging and quantitative detection of EpCAM; confocal images of MUC1 with various concentrations of substrate; effects of different concentrations of substrate on TMPs quantification; detection of EpCAM by cell-based ELISA; investigation of the effects of Zn2+ on the physiological activity of the cells; light microscopic imaging with and without analysis; drug sensitivity after treatment with anticancer drugs (Fig.S1-S8); Table S1: cell viability values after treatment with anticancer drugs.
Acknowledgements
This work was supported by the National Natural Science Foundation of China (Grant Nos. 21575088, 81671781, 21235003), the Natural Science Foundation of Shanghai (14ZR1416500), and the National Postdoctoral Program for Innovative Talents (Grant No. BX201600098).
Competing Interests
The authors have declared that no competing interest exists.
References
1. Boonstra MC, de Geus SW, Prevoo HA, Hawinkels LJ, van de Velde CJ, Kuppen PJ. et al. Selecting targets for tumor imaging. an overview of cancer-associated membrane proteins. Biomark Cancer. 2016;8:119-33
2. Wulfkuhle JD, Liotta LA, Petricoin EF. Proteomic applications for the early detection of cancer. Nat Rev Cancer. 2003;3:267-75
3. Kovjazin R, Horn G, Smorodinsky NI, Shapira MY, Carmon L. Cell surface-associated anti-MUC1-derived signal peptide antibodies: implications for cancer diagnostics and therapy. PLoS One. 2014;9:e85400
4. van Bracht E, Stolle S, Hafmans TG, Boerman OC, Oosterwijk E, van Kuppevelt TH. et al. Specific targeting of tumor cells by lyophilisomes functionalized with antibodies. Eur J Pharm Biopharm. 2014;87:80-9
5. Leroy X, Zini L, Leteurtre E, Zerimech F, Porchet N, Aubert JP. et al. Morphologic subtyping of papillary renal cell carcinoma. correlation with prognosis and differential expression of MUC1 between the two subtypes. Mod Pathol. 2002;15:1126-30
6. Ford SA, Russell PJ, Jelbart M, Raghavan D. Detection of tumor-associated membrane proteins in prostate and bladder carcinomas by means of protein blotting. Urol Res. 1989;17:305-10
7. Yang Y, Toy W, Choong LY, Hou P, Ashktorab H, Smoot DT. et al. Discovery of SLC3A2 cell membrane protein as a potential gastric cancer biomarker: implications in molecular imaging. J Proteome Res. 2012;11:5736-47
8. Chen C, Hua Y, Hu Y, Fang Y, Ji S, Yang Z. et al. Far-red/near-infrared fluorescence light-up probes for specific in vitro and in vivo imaging of a tumour-related protein. Sci Rep. 2016;6:23190
9. He J, Schepmoes AA, Shi T, Wu C, Fillmore TL, Gao Y. et al. Analytical platform evaluation for quantification of ERG in prostate cancer using protein and mRNA detection methods. J Transl Med. 2015;13:54
10. Lund R, Leth-Larsen R, Jensen ON, Ditzel HJ. Efficient isolation and quantitative proteomic analysis of cancer cell plasma membrane proteins for identification of metastasis-associated cell surface markers. J Proteome Res. 2009;8:3078-90
11. Shi Y, Xiang R, Horvath C, Wilkins JA. Quantitative analysis of membrane proteins from breast cancer cell lines BT474 and MCF7 using multistep solid phase mass tagging and 2D LC/MS. J Proteome Res. 2005;4:1427-33
12. Wang S, Li W, Yuan D, Song J, Fang J. Quantitative detection of the tumor-associated antigen large external antigen in colorectal cancer tissues and cells using quantum dot probe. Int J Nanomedicine. 2016;11:235-47
13. Stangl S, Varga J, Freysoldt B, Trajkovic-Arsic M, Siveke JT, Greten FR. et al. Selective in vivo imaging of syngeneic, spontaneous, and xenograft tumors using a novel tumor cell-specific hsp70 peptide-based probe. Cancer Res. 2014;74:6903-12
14. Yang Y, Huang J, Yang X, Quan K, Wang H, Ying L. et al. Aptazyme-gold nanoparticle sensor for amplified molecular probing in living cells. Anal Chem. 2016;88:5981-7
15. Chen X, Wang Y, Zhang Y, Chen Z, Liu Y, Li Z. et al. Sensitive electrochemical aptamer biosensor for dynamic cell surface N-glycan evaluation featuring multivalent recognition and signal amplification on a dendrimer-graphene electrode interface. Anal Chem. 2014;86:4278-86
16. Li L, Feng J, Fan Y, Tang B. Simultaneous imaging of Zn(2+) and Cu(2+) in living cells based on DNAzyme modified gold nanoparticle. Anal Chem. 2015;87:4829-35
17. Garnett MJ, Edelman EJ, Heidorn SJ, Greenman CD, Dastur A, Lau KW. et al. Systematic identification of genomic markers of drug sensitivity in cancer cells. Nature. 2012;483:570-5
18. Li Y, Tian H, Chen G, Cao D, Liu Y, Li M. et al. Study of chemosensitivity for human breast cancer cells cultivated in primary generation in vitro. Chin Clin Oncol. 2006;11:768-71
19. Patriarca C, Macchi RM, Marschner AK, Mellstedt H. Epithelial cell adhesion molecule expression (CD326) in cancer: a short review. Cancer Treat Rev. 2012;38:68-75
Author contact
![]() Corresponding authors: xiaolizhuedu.cn (X. Zhu), genxiliedu.cn (G. Li). Fax: +86 21 66137541 (X. Zhu), +86 25 83592510 (G. Li).
Corresponding authors: xiaolizhuedu.cn (X. Zhu), genxiliedu.cn (G. Li). Fax: +86 21 66137541 (X. Zhu), +86 25 83592510 (G. Li).