Impact Factor
- Issue 14; 2026
- Issue 13; 2026
- Issue 12; 2026
- Issue 11; 2026
- Issue 10; 2026
- Volume 16; 2026
- Advance Articles
- Past Issues
- Cover Images
- Cover Suggestion
- Index & Coverage
- Special Issues
Introduction
Experimental section
Results and Discussion
Conclusion
Abbreviations
Acknowledgements
Supplementary Material
References
International Journal of Biological Sciences
International Journal of Medical Sciences
 Global reach, higher impact

Theranostics 2018; 8(3):800-811. doi:10.7150/thno.21577 This issue Cite
Research Paper
Dual turn-on fluorescence signal-based controlled release system for real-time monitoring of drug release dynamics in living cells and tumor tissues
Xiuqi Kong*, Baoli Dong*, Xuezhen Song, Chao Wang, Nan Zhang, Weiying Lin ![]()
Institute of Fluorescent Probes for Biological Imaging, School of Chemistry and Chemical Engineering, School of Materials Science and Engineering, University of Jinan, Jinan, Shandong 250022, P. R. China.
* These authors contributed equally to this work.
Received 2017-6-22; Accepted 2017-11-18; Published 2018-1-1
Abstract

Controlled release systems with capabilities for direct and real-time monitoring of the release and dynamics of drugs in living systems are of great value for cancer chemotherapy. Herein, we describe a novel dual turn-on fluorescence signal-based controlled release system (CDox), in which the chemotherapy drug doxorubicin (Dox) and the fluorescent dye (CH) are conjugated by a hydrazone moiety, a pH-responsive cleavable linker. CDox itself shows nearly no fluorescence as the fluorescence of CH and Dox is essentially quenched by the C=N isomerization and N-N free rotation. However, when activated under acidic conditions, CDox could be hydrolyzed to afford Dox and CH, resulting in dual turn-on signals with emission peaks at 595 nm and 488 nm, respectively. Notably, CDox exhibits a desirable controlled release feature as the hydrolysis rate is limited by the steric hindrance effect from both the Dox and CH moieties. Cytotoxicity assays indicate that CDox shows much lower cytotoxicity relative to Dox, and displays higher cell inhibition rate to cancer than normal cells. With the aid of the dual turn-on fluorescence at different wavelengths, the drug release dynamics of CDox in living HepG2 and 4T-1 cells was monitored in double channels in a real-time fashion. Importantly, two-photon fluorescence imaging of CDox in living tumor tissues was also successfully performed by high-definition 3D imaging. We expect that the unique controlled release system illustrated herein could provide a powerful means to investigate modes of action of drugs, which is critical for development of much more robust and effective chemotherapy drugs.
Keywords: Controlled drug release, Dual turn-on fluorescence, Two-photon, Drug release dynamics, High-definition 3D tissue imaging.
Introduction
Chemotherapy is a significant cancer treatment strategy that utilizes one or more anti-cancer drugs to prevent cancer cells from multiplying [1, 2]. However, because of high cytotoxicity and non-specificity to tumors, many chemotherapy drugs bring severe side effects, which exert pronounced suffering to patients and make them unfit for long-term therapy [3-5]. Currently, among the various approaches to improve the effectiveness of chemotherapy drugs, controlled drug delivery systems that can convey chemotherapeutic drugs safely and efficaciously have attracted great attention [6-12]. A desirable controlled release system should: 1) be easy to prepare with high purity; 2) accumulate more in cancer than normal cells; 3) exhibit minimal cytotoxicity to normal cells; 4) have favorable controlled release to prolong the acting time and avoid multiple dosing; 5) enable direct and real-time monitoring of the drug release dynamics with high accuracy in a noninvasive manner [13-15].
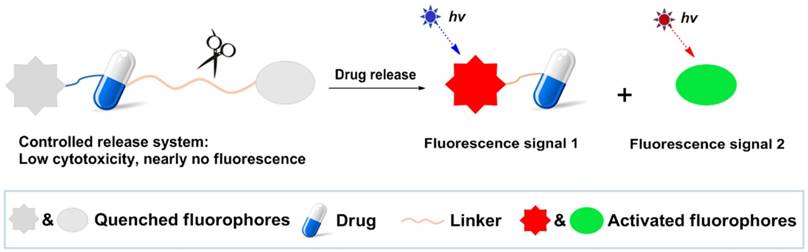
Fluorescence imaging offers numerous advantages including high sensitivity, superior spatiotemporal resolution, nondestructive assessment, convenient operation, and real-time detection [16-20]. To date, fluorescence imaging has been employed to get insights into either organism-drug interactions or pharmacological mechanisms by fluorescent labeling of biomolecules or drugs [21-23]. Meanwhile, fluorescence imaging also has been widely applied to sensitively detect ions, biomolecules, and enzymes in living systems utilizing fluorescent probes [24-25]. In light of the prominent merits of fluorescence imaging, controlled release drug systems labeled by fluorescent dyes could provide a striking way to directly and in real-time monitor drug release dynamics in a noninvasive manner in living cells. A general design strategy for controlled drug release systems based on dual turn-on fluorescence signals is depicted in Scheme 1. The system is non-fluorescent, as it contains two quenched dyes. However, when the cleavage process is activated by cellular components or a micro-environment that closely relates to tumors, the drug is released along with two fluorophores to provide dual turn-on fluorescence readouts. This highly desirable feature of dual turn-on fluorescence may be beneficial for monitoring drug release in real-time and provide better understanding of pharmacological mechanisms, which could lead to more effective design strategies for improving the therapeutic index of these chemotherapy drugs and significantly enhance our ability to treat cancers.
General design strategy of the controlled drug release system based on dual turn-on fluorescence signals.
Herein, we present a unique case of dual turn-on signal-based controlled release systems, in which the drug itself is fluorescent, thus, the system only needs one fluorescent dye. We demonstrate the utility of the novel system in living cell and tumor tissue imaging, highlighting the critical value of the new dual turn-on signal-based controlled release system design approach.
Experimental section
Materials
Unless otherwise stated, all reagents were purchased from commercial suppliers and used without further purification. ddH2O was used in all experiments. Dox.HCl were purchased from Melone Pharmaceutical Co., Ltd. Cell Counting Kit-8 was obtained from Sigma-Aldrich. NMR data were performed on a Bruker AV-400/500 spectrometer, using TMS as an internal standard; absorption spectra were obtained on a SHIMADZU UV-2700 spectrometer; HPLC chromatograms were acquired with HPLC (LC-20AT, Shimadzu, Kyoto, Japan); fluorescence spectra were obtained by a HITACHI F4600 fluorescence spectrophotometer; cell imaging was performed with a Nikon A1 MP microscope.
Synthesis of CDox
The compound CH was synthesized following the previous report [26]. CH (137.5 mg, 0.5 mmol), Dox (289.5 mg, 0.5 mmol) and Et3N (505 mg, 5 mmol) were dissolved in 5 mL DMSO, then the solution was stirred at 50°C under dark condition for 72 h. The reaction mixture was purified by preparative high performance liquid chromatography (pre-HPLC) to afford pure CDox (16 mg). LC-MS analysis method for purity: mobile phases, water (0.01% TFA) and acetonitrile (0.01% TFA); gradient, 5% acetonitrile increase to 95% acetonitrile within 9 min, 95% acetonitrile for 6 min and back to 5% acetonitrile within 0.01 min; flow rate, 1.0 mL/min. 1H NMR (DMSO-d6, 400 MHz): δ 12.5 (s, 1 H), 8.7 (s, 1 H), 7.85 (m, 2 H), 7.57 (m, 2 H), 6.78 (d, J = 2.4 Hz, 1 H), 6.57 (s, 1 H), 5.12 (m, 2 H), 4.41 (m, 2 H), 4.11 (s, 1 H), 3.87 (m, 3 H), 3.41(m, 7 H), 3.14 (m, 2 H), 2.98 (m, 2 H), 2.24(m, 1 H), 1.97(m, 1 H), 1.68(m, 1 H), 1.45(m, 1 H), 0.85 (m, 16 H). 13C NMR (DMSO-d6, 100 MHz): δ 186.13, 174.26, 160.96, 160.65, 158.90, 157.35, 152.60, 148.58, 136.06, 136.00, 131.72, 129.61, 119.92, 118.88, 110.36, 108.67, 107.75, 100.28, 95.77, 72.14, 71.30, 71.27, 66.83, 56.49, 56.12, 46.50, 44.34, 35.08, 33.17, 31.25, 29.04, 28.84, 28.80, 28.71, 28.54, 26.51, 25.08, 22.06, 17.03, 13.92, 12.29. ESI-MS: m/z calculated for C41H44N4O13 801.3 [M+H]+, found: 801.5.
Temperature optimization assay for CDox release
The temperature optimization experiments for drug release were performed with 2 μM CDox, which was dissolved in 4 mL of two different B-R buffers (pH 4.5 and pH 7.4, 10% DMSO). The mixtures were incubated at 25°C, 37°C and 42°C under moderate stirring. CH was determined using a fluorescence spectrophotometer with an emission wavelength of 488 nm and excitation wavelength of 420 nm at different time points. Dox was determined using a fluorescence spectrophotometer with an emission wavelength of 595 nm and excitation wavelength of 500 nm at different time points. The fluorescence intensities of free 2 μM CH and Dox acted as the complete release control. The results were expressed as the percentage of CH and Dox release versus time.
Controlled release assay of CDox in B-R buffer using fluorescence method and HPLC method
For the fluorescence method: CDox was dissolved in 4 mL of different B-R buffers (pH 4.5, pH 5.5, pH 6.5 and pH 7.4, 10% DMSO) at a concentration of 2 μM at 37°C under moderate stirring. CH was determined using a fluorescence spectrophotometer with an emission wavelength of 488 nm and excitation wavelength of 420 nm at different time points. Dox was determined using a fluorescence spectrophotometer with an emission wavelength of 595 nm and excitation wavelength of 500 nm at different time points. The fluorescence intensities of free 2 μM CH and Dox acted as the complete release control. The results were expressed as the percentage of CH and Dox release versus time.
For the HPLC method: CDox was dissolved in 5 mL of two different B-R buffers (pH 4.5 and pH 7.4, 10% DMSO) at a concentration of 0.5 mg/mL. They were incubated at 37°C under moderate stirring. At different time points, 5 μL solution was injected into an HPLC to analyze the CH and Dox concentrations using UV detection at 420 nm and 480 nm. The mobile phases of HPLC were acetonitrile/water at a flow rate of 1.0 mL/min. Elution program: gradient from 5% to 95% of acetonitrile in 15 min, maintaining to 5 min and decreasing from 95% to 5% of acetonitrile in 5 min. The absorption intensities of free CH and Dox (at a concentration of 0.5 mg/mL) acted as the complete release control. The results were expressed as the percentage of CH and Dox release versus time.
Measurements of two-photon cross section
The two-photon cross section was determined according to the previously reported method [27]. Compound CH (1.0 μM) was dissolved in B-R buffers (10% DMSO) at pH 4.5, 5.5 and 7.4, and then the two-photon fluorescence intensities were measured at 700-900 nm using rhodamine 6G as the reference [28]. The two-photon absorption cross section (δ) was calculated by the equation: δs = δr (SsΦrϕrcr) / (SrΦsϕscs), where the subscripts s and r stand for the sample and reference molecule, which herein is rhodamine 6G. S is the intensity of the signal collected using a CCD detector. Φ is the fluorescence quantum yield, and ϕ is the overall fluorescence collection efficiency of the experimental apparatus. c is the concentration. δr is the two-photon absorption cross section of rhodamine 6G.
Cell culture and cytotoxicity studies of CDox
HepG2, HeLa, 4T-1 and NIH 3T3 cells were cultured in Dulbecco's Modified Eagle's Medium (DMEM) supplemented with 10% fetal bovine serum (FBS) in an atmosphere of 5% CO2 at 37°C. HepG2, HeLa, 4T-1 and NIH 3T3 cells were seeded into 96-well plates at a density of 1000 cells/well. The next day, various prepared CDox, CH, or Dox (0 - 100 μM) were added into the wells, which were further cultured for 98 h. Next, 100 μL of fresh media containing 10 μL of CCK-8 solution (v/v = 9/1) was mixed with the cells, which were incubated for another 4 h. Lastly, the OD490 were read by Thermo Scientific Microplate Reader.
Cell imaging and colocalization study
HepG2 and 4T-1 cells were both cultured in Dulbecco's Modified Eagle's Medium (DMEM) supplemented with 10% fetal bovine serum (FBS) in an atmosphere of 5% CO2 at 37°C. The human normal liver cell line HL-7702 cells were cultured in Roswell Park Memorial Institute-1640 (RPMI-1640) supplemented with 10% fetal bovine serum (FBS) in an atmosphere of 5% CO2 at 37°C. For imaging of cells with one-photon and two-photon imaging, the cells were seeded into 12-well plates pre-seeded with Ф13 mm glass, then incubated with 5 μM of CDox, CH or Dox. One-photon and two-photon fluorescence images were collected using a Nikon A1R MP Fluorescence Microscope equipped with a femtosecond laser at different time points. For colocalization experiments, lysosome-specific fluorescent probe (Lysotracker® Deep Red) at a concentration of 50 nM was added to the cells at the different times for 5 min, and then the cells were washed with PBS twice. One-photon mode: CH channel: λex = 405 nm, λem = 425-475 nm; Dox channel: λex = 488 nm, λem = 570-620 nm. Two-photon mode: CH channel: λex = 800 nm, λem = 425-475 nm. Lysotracker® Deep Red channel: λex = 640 nm, λem = 663-738 nm. The statistical analyses were performed on three separate biological replicates. A region of interest (ROI) was created around each image and the mean fluorescence intensity of each sample was measured (via the “Measure” function) with Image J software (fluorescence intensity of cells at 6 h was set to 1) and averaged across the three fields imaged.
Animal tumor models and tissue slice treatment
Balb/c female mice (4-weeks-old) were purchased from Shandong University Laboratory Animal Centre (Shandong, China). All procedures for this study were approved by the Animal Ethical Experimentation Committee of Shandong University according to the requirements of the National Act on the use of experimental animals (China). For construction of tumor models, 2×10⁶ of 4T-1 cells were injected subcutaneously into the right flank of the mice. After about two weeks, the tumor volumes reached ~50 mm3, and mice were anesthetized for tumor removal. Tumors were cut into 400 μm thick slices with a vibrating-blade microtome, and then the slices were incubated with 10 μM of CDox in pH 6.5 media for 0.5 h and 2 h at 37°C. Before imaging, tissues treated with CDox were washed with PBS three times.
Two-photon and one-photon imaging for dual turn-on imaging in tumor tissues
Two-photon and one-photon imaging of CDox, CH and Dox in tissues were obtained with Nikon confocal and multiphoton microscopes (Nikon A1 MP) with 20 × objective. For two-photon imaging, the excitation wavelength was 800 nm and collected wavelengths were 425-475 nm. For one-photon imaging, the excitation wavelength was 488 nm and collected wavelengths were 570-620 nm.
Results and Discussion
Design and Synthesis of CDox
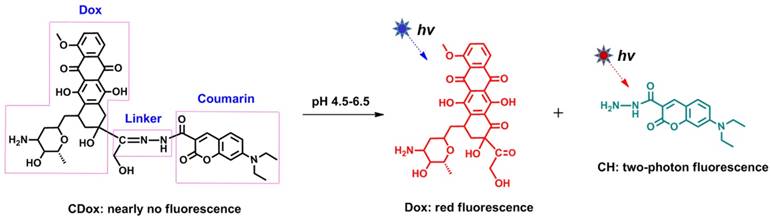
To demonstrate the above-mentioned design strategy depicted in Scheme 1, we engineered a doxorubicin (Dox)-coumarin (CH)-based controlled drug release system (CDox, Scheme 2) based on the following considerations: 1) Selection of Dox as the representative drug. Dox is a well-known cytostatic agent and widely used as an anti-cancer drug. Furthermore, Dox itself emits red fluorescence (λem = 595 nm). Thus, Dox may serve as both a drug and intrinsic fluorophore. 2) Choice of CH as the illustrative fluorescent dye. Coumarin is a blue fluorescent dye with emission at 488 nm, which has nearly no overlap with that of Dox. In other words, the emission wavelengths of Dox and CH are essentially resolved. This could ensure the dual turn-on fluorescence signal feature of the system. Additionally, coumarin dyes generally have favorable two-photon emission properties, which may open up opportunities for two-photon imaging applications of this system in living systems. 3) Selection of C=N-N as the multi-functional linker. C=N isomerization [29, 30] and N-N free rotation [31, 32] are the two commonly used mechanisms for quenching fluorescence. Thus, we envisioned that the CDox system should show essentially no fluorescence as the fluorescence of CH and Dox is quenched by these two quenching mechanisms. However, as a pH-responsive group, the C=N moiety in CDox can be hydrolyzed under acidic conditions to afford Dox and CH, which may switch on fluorescence in two channels. Thus, this dual turn-on character can satisfy the need for the design of a controlled drug release system in which the release of the drug can be monitored in real-time by dual turn-on fluorescence signals. Importantly, the distance between Dox and CH is calculated to be 1.06 nm using a Guassian 09 software, suggesting that these two units are in close proximity (Figure S1). Thus, the hydrolysis rate of C=N may be limited by the steric hindrance effect from these two moieties, which could render the controlled release of the drug from the system. Taken together, the CDox system designed herein, could potentially act as a dual turn-on fluorescence-based controlled drug release system involving two-photon emission.
Illustration of the Dox-coumarin-based controlled drug release system (CDox).
Optical Properties of CDox
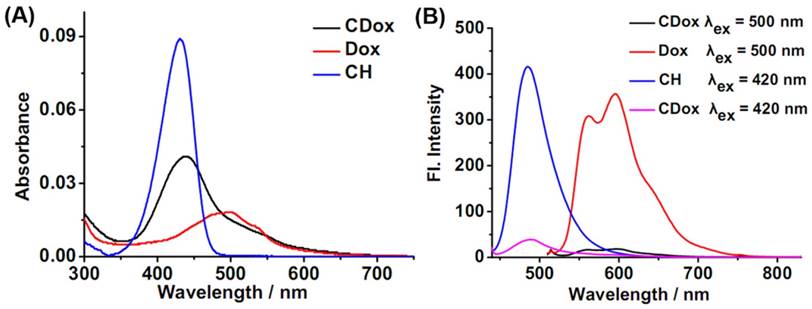
UV-Vis absorption and fluorescence spectroscopies were employed to investigate the optical properties of CDox in Britton-Robinson (B-R) buffer (10% DMSO). As shown in Figure 1A, CDox showed a broad absorption band at 400-600 nm, with molar extinction coefficients (ε) of 1.67×10⁴ M-1cm-1 and 0.98×10⁴ M-1cm-1 at 430 nm and 500 nm, respectively. Considering the observation that CH exhibited strong absorption at 430 nm and Dox displayed a broad absorption at 400-575 nm, the absorption spectrum of CDox is essentially the superposition of the absorption spectra of the CH and Dox units. Notably, the absorbance of the Dox unit in CDox is nearly identical with that of the equimolar Dox, while the absorbance of the CH unit in CDox is significantly lower than that of the equimolar CH. This indicates that the C=N-N linker has no interaction with the π-system of Dox, while the linker may conjugate with the CH unit in CDox to disturb its absorption. CDox exhibited two very faint fluorescence bands at 488 nm and 595 nm under excitation at 420 nm, and displayed very dim fluorescence at 595 nm under excitation at 500 nm (Figure 1B). However, the equimolar CH showed strong fluorescence at 488 nm (λex = 420 nm), and equimolar Dox also exhibited intense fluorescence at 595 nm (λex = 500 nm). That is, the fluorescence of the CH and Dox could be quenched efficiently when these two fluorophores were directly connected via the C=N-N linker. The quenching efficiencies of the C=N-N to the CH and Dox moieties were calculated to be 90% and 87%, respectively, suggesting that, as designed, the linker can serve as an outstanding fluorescence quencher for these two units in CDox.
Absorption (A) and fluorescence (B) spectra of 2 μM CH, 2 μM Dox, and 2 μΜ CDox in B-R buffer (pH = 7.4, 10% DMSO).
Controlled release properties of CDox in B-R buffer
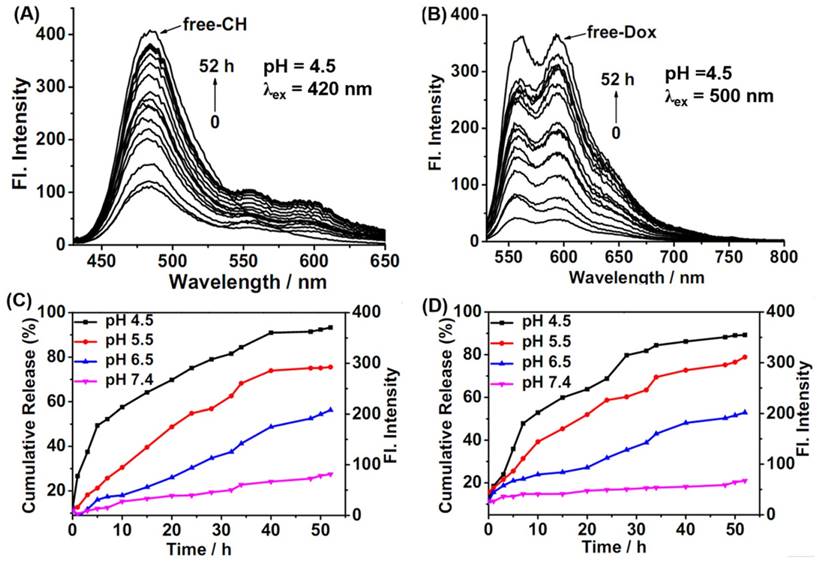
To explore the drug release behaviors of CDox, a temperature optimization study was firstly completed. As shown in Figure S2, 42°C was the optimal temperature for CDox release. However, cumulative curve data at 37°C was nearly the same as data at 42°C. Considering the temperature of biological bodies is 37°C, we chose 37°C to perform all the release experiments. Thus, the time-dependent fluorescence spectra of CDox in B-R buffer (10 % DMSO) at pH 4.5-7.4 were collected at 37°C. At pH 4.5, a gradually increased fluorescence band at 488 nm (λex = 420 nm) originating from the CH fluorophore was markedly observed, and the fluorescence intensity reached the approximate maximum after 40 h (Figure 2A, C). Meanwhile, the slightly enhanced fluorescence band at 595 nm arising from the Dox unit also emerged because of the relative weak absorption of Dox at 420 nm. With excitation at 500 nm, the maximal absorption wavelength of Dox, the fluorescence at 595 nm increased drastically, and reached the maximum after about 40 h (Figure 2B, D). Namely, the drug release behaviors of CDox at pH 4.5 can be simultaneously monitored by the dual turn-on fluorescence signals at 488 nm and 595 nm, respectively. According to the previous reports on the drug release performance of Dox and the above-mentioned spectral change of CDox at pH 4.5, it can be concluded that CDox was hydrolyzed to provide compound CH and the drug Dox in acidic conditions [33, 34]. At pH 5.5 and 6.5, the fluorescence bands at 488 nm and 595 nm both increased over time as well (Figure 2C, D and Figure S3). As shown in Figure 2C, D, it can be confirmed that the drug release rate of CDox is significantly higher at pH 4.5 than at pH 5.5, 6.5 and 7.4. Furthermore, the release results detected by the HPLC method (Figure S4) were nearly consistent with the above-mentioned release data detected by the fluorescence method. The drug release rate of CDox is apparently slower than the previously developed Dox-based systems probably due to steric effects from the CH and CDox [33]. This could be beneficial for reducing the frequency of dosing and enhancing the effective utilization of medicine. Therefore, CDox can be activated in the weak acidic environment, and the drug release process can be potentially monitored by the dual turn-on fluorescence signals from the embedded Dox and CH fluorophores.
(A, B) Time-dependent fluorescence spectra of 2 μM CDox in B-R buffer (pH 4.5, 10% DMSO) under excitation at 420 nm and 500 nm, respectively. Time-dependent cumulative release curves of CH (C) and Dox (D) at 37°C from 2 μM CDox in different pH conditions in B-R buffer.
Cytotoxicity study of CDox in vitro
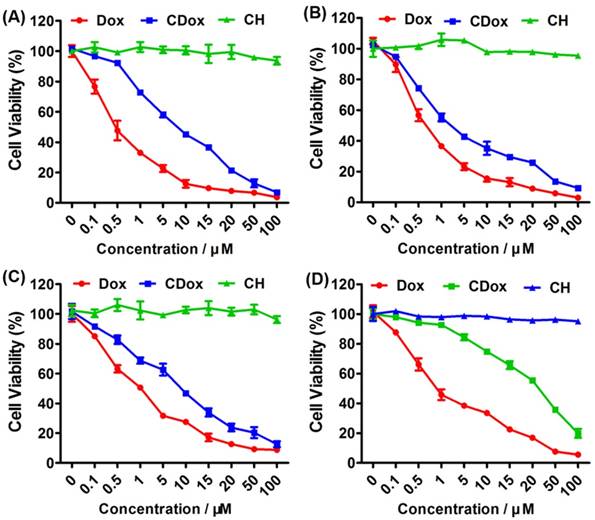
Time-dependent and dose-dependent cytotoxicity assays were then performed to investigate the activity of CDox toward cancer cells (HeLa, HepG2, and 4T-1 cells) and normal cells (NIH 3T3 cells). These cells were incubated with various concentrations (0-100 μM) of CH, Dox, and CDox for 98 h. The cytotoxicity results are shown in Figure 3. CH, one of the hydrolysis products of CDox, had no marked cytotoxicity toward the cancer and normal cells, suggesting that CH possesses excellent biocompatibility and can serve as a desirable fluorescence reporter for constructing controlled drug release systems. As shown in Figure 3, CDox showed time- and dose-dependent cytotoxicity towards cells. The half maximal inhibitory concentrations (IC50) of CDox were determined to be 4.3, 2.34 and 4.51 μM for HeLa, HepG2, and 4T-1 cells after 98 h incubation, respectively, suggesting that CDox can be hydrolyzed to release CH and Dox in these cells. Compared with the IC50 values of free Dox (1.11, 0.84 and 1.28 μM, respectively), CDox showed lower cytotoxicity towards the cells. Generally, many structure-modified drugs exhibit less cytotoxicity than their parent drug [35, 36]. Additionally, the accumulation difference caused by the different solubilities of Dox and CDox possibly lead to the cytotoxicity difference between CDox and Dox. Notably, the IC50 of CDox was >15 μM for NIH 3T3 cells in 98 h, while the IC50 of Dox was 1.74 μM for NIH 3T3 cells, suggesting that CDox could reduce the side effects of Dox in normal cells. Taken together, CDox could potentially operate as a favorable prodrug to control drug release.
Cytotoxicity assays of CH, CDox and Dox toward HeLa (A), HepG2 (B), 4T-1 (C), and NIH 3T3 cells (D) for 98 h. Error bars represent standard deviation (±S.D.), n = 5.
Time-dependent dual turn-on fluorescence evaluation of CDox in vitro
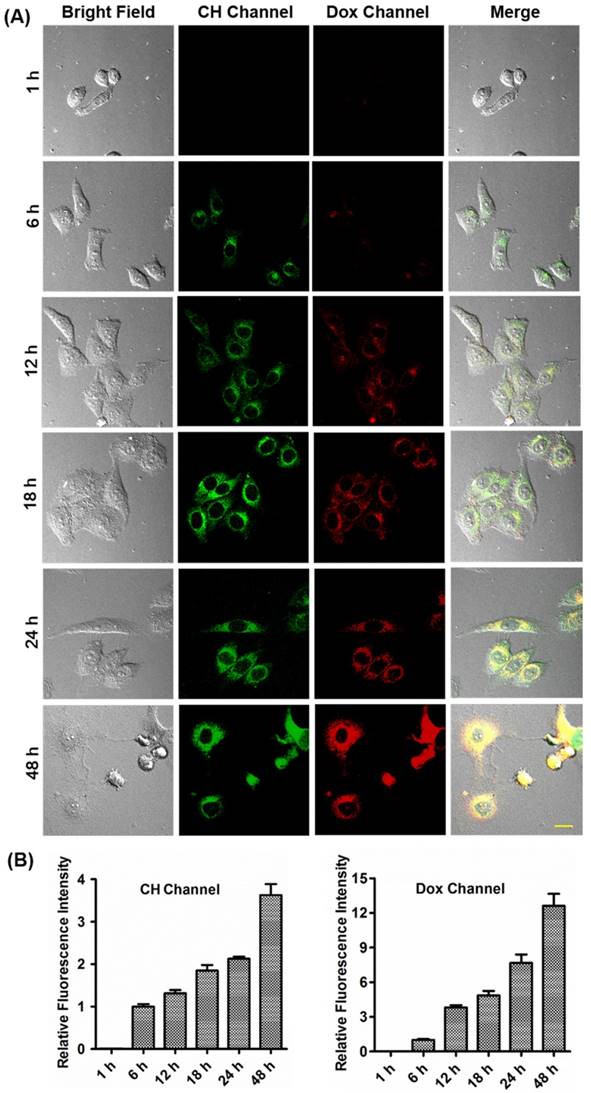
Fluorescence imaging of HepG2, 4T-1 and HL-7702 cells incubated with 5 μM CDox was performed to investigate the release dynamics. The time-dependent dual turn-on fluorescence readouts are shown in Figure 4, Figure S5 and Figure S6. After incubation for 1 h, nearly no fluorescence was observed in both the CH and Dox channels in HepG2 and 4T-1 cells. However, the marked dual fluorescence signals emerged after 6 h in HepG2 and 4T-1 cells, suggesting that CDox starts to be hydrolyzed to afford CH and Dox simultaneously. As the incubation time increased, the dual-fluorescence images became brighter, and reached maximum values at 48 h and 80 h in HepG2 and 4T-1 cells, respectively (Figure 4A and Figure S5A). However, the time-dependent fluorescence in HL-7702 cells was much weaker than that of HepG2 cells with the same treatment (Figure S6). Quantified relative fluorescence intensities in the CH and Dox channels also intuitively confirmed these two turn-on fluorescence signals (Figure 4B, Figure S5B and Figure S6B). These studies indicate that CDox could readily undergo hydrolysis to release CH and Dox. Notably, the morphological changes of the HepG2 and 4T-1 cells were observed after the treatment of Dox or CDox. When treated with Dox, the HepG2 and 4T-1 cells experienced apoptosis in 6 h and 12 h, respectively (Figure S7).
(A) Fluorescence images of HepG2 cells treated with 5 μM CDox for different times. CH channel: λex = 405 nm, λem = 425-475 nm. Dox channel: λex = 488 nm, λem = 570-620 nm, scale bar: 20 µm. (B) Quantified relative fluorescence intensities in the CH and Dox channels for different incubation times. Error bars represent standard deviation (±S.D.), n = 3.
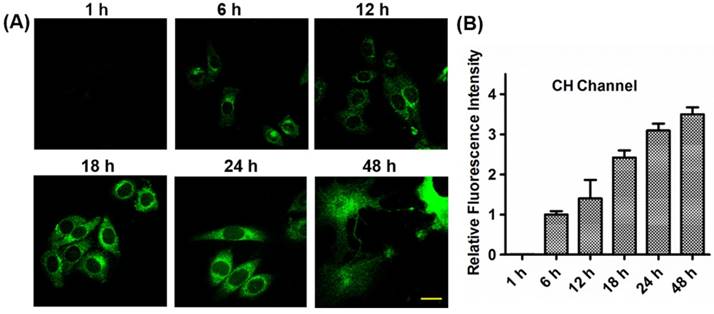
Before the treatment with CDox, the HepG2 cells kept intact morphologies. However, when treated with CDox for 48 h, the HepG2 cells exhibited shrinkage, suggesting that Dox may induce apoptosis (Figure S8A). Likewise, the 4T-1 cells displayed similar shrinkage after the treatment with CDox for 80 h (Figure S8B). Significantly, taking advantage of the two-photon properties of CH (Figures S9), the drug release process was also monitored by two-photon fluorescence imaging, which utilizes near-infrared light as the excitation source and thus has low damage to living cells. The two-photon fluorescence images in the HepG2 cells (Figure 5) and 4T-1 cells (Figure S5) became brighter with increasing incubation time, in good agreement with the results in the CH channel under one-photon excitation depicted in Figure 4. Thus, the drug release process in the living cells also can be monitored by two-photon imaging. To our best knowledge, the controlled release system based on dual turn-on fluorescence signals and two-photon emission constructed herein was described for the first time.
(A) Two-photon fluorescence images of HepG2 cells treated with 5 μM CDox for different times. λex = 800 nm, λem = 425-475 nm, scale bar: 20 µm. (B) Quantified relative fluorescence intensities of CH in the two-photon channel for different incubation times. Error bars represent standard deviation (±S.D.), n = 3.
Furthermore, the fluorescence spectra of CH, Dox, and CDox in HepG2 cells were collected to confirm the drug release of CDox (Figure S10). In the cells, CH exhibited a main emission peak at ~460 nm upon two-photon excitation (Figure S10A), which is slightly shorter than the emission peak of CH (λem = 488 nm) in B-R buffer (10% DMSO), probably because of the different polarities between the intercellular environment and B-R buffer. After 48 h incubation in the cells, CDox also displayed a main emission at ~460 nm, indicating that CDox could release CH in the cells. As shown in Figure S10B, Dox showed nearly the same fluorescence spectrum in B-R buffer (10% DMSO) and in the cells. When incubated in the HepG2 cells for 48 h, CDox also exhibited an emission peak at ~600 nm, which matches that of Dox in the cells. This suggests that Dox was released from CDox in both the cells. Therefore, these results further confirm that CDox could release CH and Dox simultaneously in living cells.
Drug release dynamics of CDox
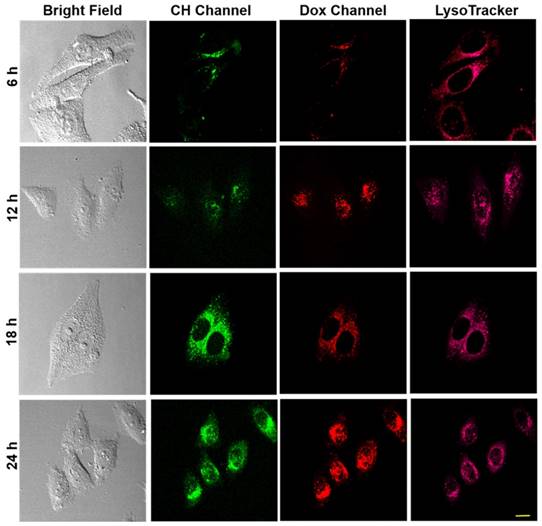
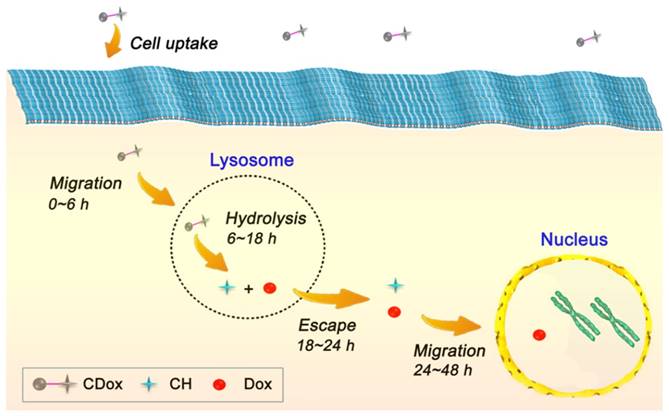
On the basis of the above-mentioned fluorescence imaging studies and the colocalization experiments, the drug release dynamics of CDox and temporal distribution of Dox in living cells was further explored. As the hydrazone moiety is acid-responsive, the hydrolysis of CDox probably occurred in lysosomes (pH 4.5~6.5). To corroborate this belief, the colocalization experiments were performed using CDox and a known lysosome-specific fluorescent probe (Lysotracker® Deep Red) at different incubation times. As shown in Figure 6, the dual turn-on fluorescence behavior observed is in good agreement with that in Figure 4. The Pearson's coefficients between CH and Lysotracker were 0.48, 0.63, 0.87, and 0.57 at 6, 12, 18, and 24 h, respectively, while those of Dox and lysotracker were 0.38, 0.57, 0.72 and 0.50, respectively. Accordingly, the drug release dynamics of CDox is hypothesized and illustrated in Figure 7. At 0~6 h, only a small amount of CDox was hydrolyzed in the lysosomes to release Dox and CH, thus, the Pearson's coefficient is low. After a longer incubation time, bright dual turn-on fluorescence was observed at 6~8 h and the Pearson's coefficients increased. This indicates that more CDox has been hydrolyzed in the lysosomes. At 18~24 h, the Pearson's coefficients decreased, while the fluorescence of CH and Dox channels continued to increase, suggesting that CH and Dox generated from the hydrolysis of CDox possibly both escape from the lysosomes. However, during this period, these cells still kept intact morphologies and probably did not undergo apoptosis. At 48 h, these cells showed shrinkage and the cell nuclei condensed, implying that Dox escaped from the lysosomes and likely migrated into the nucleus to interact with DNA to induce cell apoptosis at 24~48 h [37-39]. Taken together, the drug release process of CDox and temporal distribution of Dox were visually monitored by dual turn-on fluorescence signals, and this may facilitate further design of chemotherapeutic agents with more potent anti-cancer activity.
Colocalization experiments of HepG2 treated with 5 μM CDox and Lysotracker® Deep Red for different incubation times. CH channel: λex = 405 nm, λem = 425-475 nm. Dox channel: λex = 488 nm, λem = 570-620 nm. Lysotracker® Deep Red channel: λex = 640 nm, λem = 663-738 nm, scale bar: 20 µm.
Schematic illustration of the hypothesized drug release dynamics of CDox.
Drug release studies of CDox in tumor tissues assisted by high-definition 3D imaging
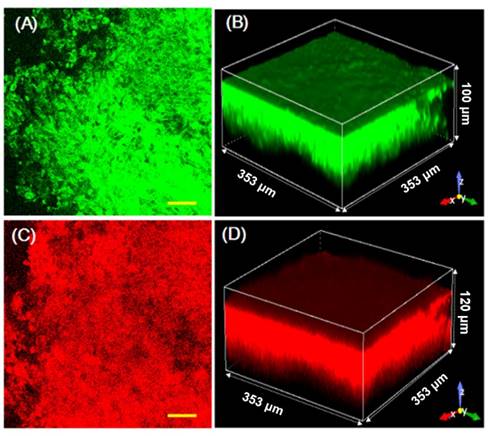
The drug release behaviors of CDox in living tumor tissues were further investigated, assisted by high-definition 3D imaging. Living tumor models were constructed by subcutaneous injection of the 4T-1 cells into the right flank of Balb/c mice. As shown in Figure S11A, B, when treated with 10 μM CH and upon two-photon excitation, the tumor tissues showed strong fluorescence with a penetration depth of ~120 μm. Likewise, the tumor tissues treated with 10 μM Dox displayed intense red fluorescence with a penetration depth of ~130 μm (Figure S11C, D). These control studies indicate that CH or Dox can penetrate into the living tumor tissues for biological imaging. After incubation with 10 μM CDox for 0.5 h, the tumor tissues exhibited strong fluorescence with a penetration depth of ~70 μm for both the CH and Dox channels (Figure S12). After incubation for 2 h, the tumor tissues showed fluorescence with a penetration depth of ~90 μm in the CH channel and ~110 μm in the Dox channel (Figure 8). The quantified fluorescence intensities of CDox, CH, and Dox at various penetration depths and different incubation times intuitively demonstrate that the penetration depth of the fluorescence in both the CH and Dox channels increased over time (Figure S13). These data suggest that CDox undergoes hydrolysis to afford CH and Dox simultaneously in the living tumor tissues, and the release process can be visually monitored by the two turn-on fluorescence signals. Importantly, high-definition 3D images of the living tumor tissues were obtained, which could intuitively provide the spatial and temporal distribution information of CDox in the tumor tissues.
Images of living tumor tissue stained with 10 μM CDox for 2 h. (A) Representative two-photon images at a depth of 40 μm; λex = 800 nm, λem = 425-475 nm, scale bar: 50 μm. (B) 3D imaging in two-photon mode. (C) Representative one-photon images at a depth of 40 μm; λex = 488 nm, λem = 570-620 nm, scale bar: 50 μm. (D) 3D imaging in one-photon mode.
Conclusion
In conclusion, we have developed a novel dual turn-on fluorescence signal-based controlled release system (CDox), in which the Dox and CH were connected by a pH-sensitive hydrazone group. The new CDox itself showed nearly no fluorescence; however, when activated under acidic conditions, it can be hydrolyzed to provide Dox and CH with two distinct turn-on emission bands at 595 nm and 488 nm, respectively. Because the steric hindrance effect from the Dox and CH moieties limited the hydrolysis rate, the new CDox system exhibited desirable controlled release feature. With the aid of the dual turn-on fluorescence at different wavelengths, the dynamics of CDox in living cells was monitored in real-time in the two channels simultaneously. Significantly, the spatial and temporal distributions of CDox in living tumor tissues were obtained by high-definition 3D fluorescence imaging. We believe that the unique controlled release system described herein may open an avenue for studies of dynamics of chemotherapy drugs, which is of great value for the design of chemotherapeutic agents with improved properties.
Abbreviations
ddH2O: double distilled H2O; Dox.HCl: doxorubicin hydrochloride; NMR: nuclear magnetic resonance; TMS: tetramethylsilane; HPLC: high performance liquid chromatography; Et3N: trimethylamine; DMSO: dimethyl sulfoxide; pre-HPLC: preparative high performance liquid chromatography; LC-MS: liquid chromatograph-mass spectrometer; TFA: trifluoroacetic acid; ESI-MS: electrospray ionization mass spectrometry; B-R buffers: Britton-Robinson buffer; DMEM: Dulbecco's Modified Eagle's Medium; FBS: fetal bovine serum; CCK-8: cell counting kit-8; RPMI-1640: Roswell Park Memorial Institute-1640.
Acknowledgements
This work was financially supported by NSFC (21472067, 21672083, 51602127), Taishan Scholar Foundation (TS 201511041), NSF of Shandong Province (ZR2017PH051), the startup fund of the University of Jinan (309-10004), the Doctoral Fund of University of Jinan (160100135), and Science and Technology Program of University of Jinan (140200125).
Supplementary Material
Supplementary figures and tables.
Competing Interests
The authors have declared that no competing interest exists.
References
1. Mann J. Natural products in cancer chemotherapy: past, present and future. Nat Rev Cancer. 2002;2:143-8
2. Shabat D, Lode HN, Pertl U, Reisfeld RA, Rader C, Lerner RA, Barbas CF. In vivo activity in a catalytic antibody-prodrug system: Antibody catalyzed etoposide prodrug activation for selective chemotherapy. P Natl Acad Sci U S A. 2001;98:7528-33
3. Rooseboom M, Commandeur JN, Vermeulen NP. Enzyme-catalyzed activation of anticancer prodrugs. Pharmacol Rev. 2004;56:53-102
4. Mahato R, Tai W, Cheng K. Prodrugs for improving tumor targetability and efficiency. Adv Drug Deliver Rev. 2011;63:659-70
5. Svenson S. Theranostics: are we there yet? Mol Pharm. 2013;10:848-56
6. Hacene YC, Singh A, Van den Mooter G. Drug loaded and ethylcellulose coated mesoporous silica for controlled drug release prepared using a pilot scale fluid bed system. Int J Pharm. 2016;506:138-47
7. Vo AQ, Feng X, Morott JT, Pimparade MB, Tiwari RV, Zhang F, Repka MA. A novel floating controlled release drug delivery system prepared by hot-melt extrusion. Eur J Pharm Biopharm. 2016;98:108-21
8. Wong PT, Choi SK. Mechanisms of drug release in nanotherapeutic delivery systems. Chem Rev. 2015;115:3388-432
9. Rambhia KJ, Ma PX. Controlled drug release for tissue engineering. J Control Release. 2015;219:119-28
10. Giri S, Trewyn BG, Stellmaker MP, Lin VS. Stimuli-responsive controlled-release delivery system based on mesoporous silica nanorods capped with magnetic nanoparticles. Angew Chem Int Ed Engl. 2005;44:5038-44
11. Santini JT Jr, Cima MJ, Langer R. A controlled-release microchip. Nature. 1999;397:335-8
12. Luo Y, Huang L, Yang Y, Zhuang X, Hu S, Ju H, Yu BY, Tian J. A programmed nanoparticle with self-adapting for accurate cancer cell eradication and therapeutic self-reporting. Theranostics. 2017;7:1245-56
13. Uhrich KE, Cannizzaro SM, Langer RS, Shakesheff KM. Polymeric systems for controlled drug release. Chem Rev. 1999;99:3181-98
14. Rautio J, Kumpulainen H, Heimbach T, Oliyai R, Oh D, Järvinen T, Savolainen J. Prodrugs: design and clinical applications. Nat Rev Drug Discov. 2008;7:255-70
15. Delplace V, Couvreur P, Nicolas J. Recent trends in the design of anticancer polymer prodrug nanocarriers. Polym Chem. 2014;5:1529-44
16. Ueno T, Nagano T. Fluorescent probes for sensing and imaging. Nat Methods. 2011;8:642-5
17. Li X, Gao X, Shi W, Ma H. Design strategies for water-soluble small molecular chromogenic and fluorogenic probes. Chem Rev. 2014;114:590-659
18. van Dam GM, Themelis G, Crane LM, Harlaar NJ, Pleijhuis RG, Kelder W, Sarantopoulos A, de Jong JS, Arts HJ, van der Zee AG, Bart J, Low PS, Ntziachristos V. Intraoperative tumor-specific fluorescence imaging in ovarian cancer by folate receptor-[alpha] targeting: first in-human results. Nat Med. 2011;17:1315-9
19. Chen H, Dong B, Tang Y, Lin W. A unique "integration" strategy for the rational design of optically tunable near-infrared fluorophores. Acc Chem Res. 2017;50:1410-22
20. Carter KP, Young AM, Palmer AE. Fluorescent sensors for measuring metal ions in living systems. Chem Rev. 2014;114:4564-601
21. Gonçalves MS. Fluorescent labeling of biomolecules with organic probes. Chem Rev. 2009;109:190-212
22. Achilefu S, Bloch S, Markiewicz MA, Zhong T, Ye Y, Dorshow RB, Chance B, Liang K. Synergistic effects of light-emitting probes and peptides for targeting and monitoring integrin expression. Proc Natl Acad Sci U S A. 2005;102:7976-81
23. Alonso D, Vázquez-Villa H, Gamo AM, Martínez-Esperón MF, Tortosa M, Viso A, Fernández de la Pradilla R, Junquera E, Aicart E, Martín-Fontecha M, Benhamú B, López-Rodríguez ML, Ortega-Gutiérrez S. Development of fluorescent ligands for the human 5-HT1A receptor. ACS Med Chem Lett. 2010;1:249-53
24. Ye Y, Chen X. Integrin targeting for tumor optical imaging. Theranostics. 2011;1:102-26
25. Chan J, Dodani SC, Chang CJ. Reaction-based small-molecule fluorescent probes for chemoselective bioimaging. Nat Chem. 2012;4:973-84
26. Long L, Wu Y, Wang L, Gong A, Hu F, Zhang C. A fluorescent probe for hypochlorite based on the modulation of the unique rotation of the N-N single bond in acetohydrazide. Chem Commun (Camb). 2015;51:10435-8
27. Kim HJ, Heo CH, Kim HM. Benzimidazolebased ratiometric two-photon fluorescent probes for acidic pH in live cells and tissues. J Am Chem Soc. 2013;135:17969-77
28. Makarov NS, Drobizhev M, Rebane A. Two-photon absorption standards in the 550-1600 nm excitation wavelength range. Opt Express. 2008;6:4029-47
29. Gaenko AV, Devarajan A, Gagliardi L, Lindh R, Orlandi G. Ab initio DFT study of Z-E isomerization pathways of N-benzylideneaniline. Theor Chem Acc. 2007;118:271-9
30. Wu JS, Liu WM, Zhuang XQ, Wang F, Wang PF, Tao SL, Zhang XH, Wu SK, Lee ST. Fluorescence turn on of coumarin derivatives by metal cations: a new signaling mechanism based on C=N isomerization. Org Lett. 2007;9:33-6
31. Prins LJ, Reinhoudt DN, Timmerman P. Noncovalent synthesis using hydrogen bonding. Angew Chem Int Ed Engl. 2001;40:2382-426
32. Schmuck C, Wienand W. Self-complementary quadruple hydrogen-bonding motifs as a functional principle: from dimeric supramolecules to supramolecular polymers. Angew Chem Int Ed Engl. 2001;40:4363-9
33. Chen X, Parelkar SS, Henchey E, Schneider S, Emrick T. PolyMPC-Doxorubicin prodrugs. Bioconjug Chem. 2012;23:1753-63
34. Krüger HR, Schütz I, Justies A, Licha K, Welker P, Haucke V, Calderón M. Imaging of doxorubicin release from theranostic macromolecular prodrugs via fluorescence resonance energy transfer. J Control Release. 2014;194:189-96
35. Hsu BB, Park MH, Hagerman SR. et al. Multimonth controlled small molecule release from biodegradable thin films. Proc Natl Acad Sci U S A. 2014;111:12175-80
36. Dashnyam K, Jin GZ, Kim JH, Perez R, Jang JH, Kim HW. Promoting angiogenesis with mesoporous microcarriers through a synergistic action of delivered silicon ion and VEGF. Biomaterials. 2017;116:145-57
37. Wei T, Chen C, Liu J, Liu C, Posocco P, Liu X, Cheng Q, Huo S, Liang Z, Fermeglia M, Pricl S, Liang XJ, Rocchi P, Peng L. Anticancer drug nanomicelles formed by self-assembling amphiphilic dendrimer to combat cancer drug resistance. Proc Natl Acad Sci U S A. 2015;112:2978-83
38. Mackay JA, Chen M, McDaniel JR, Liu W, Simnick AJ, Chilkoti A. Self-assembling chimeric polypeptide-doxorubicin conjugate nanoparticles that abolish tumours after a single injection. Nat Mater. 2009;8:993-9
39. Lee CC, Gillies ER, Fox ME, Guillaudeu SJ, Fréchet JM, Dy EE, Szoka FC. A single dose of doxorubicin-functionalized bow-tie dendrimer cures mice bearing C-26 colon carcinomas. Proc Natl Acad Sci U S A. 2006;103:16649-54
Author contact
![]() Corresponding author: Prof W. Lin, University of Jinan, Jinan, Shandong 250022, P. R. China. E-mail: weiyinglin2013com, Tel.: +86 531 82769108; fax: +86 531 82769108.
Corresponding author: Prof W. Lin, University of Jinan, Jinan, Shandong 250022, P. R. China. E-mail: weiyinglin2013com, Tel.: +86 531 82769108; fax: +86 531 82769108.