Impact Factor
- Issue 14; 2026
- Issue 13; 2026
- Issue 12; 2026
- Issue 11; 2026
- Issue 10; 2026
- Volume 16; 2026
- Advance Articles
- Past Issues
- Cover Images
- Cover Suggestion
- Index & Coverage
- Special Issues
Introduction
Results
Discussion
Materials and Methods
Abbreviations
Supplementary Material
Acknowledgements
References
International Journal of Biological Sciences
International Journal of Medical Sciences
 Global reach, higher impact

Theranostics 2018; 8(1):256-276. doi:10.7150/thno.22764 This issue Cite
Research Paper
Multimodal Theranostic Nanoformulations Permit Magnetic Resonance Bioimaging of Antiretroviral Drug Particle Tissue-Cell Biodistribution
Bhavesh D. Kevadiya1*, Christopher Woldstad2*, Brendan M. Ottemann1, Prasanta Dash1, Balasrinivasa R. Sajja2, Benjamin Lamberty1, Brenda Morsey1, Ted Kocher1, Rinku Dutta1, Aditya N. Bade1, Yutong Liu2, Shannon E. Callen1, Howard S. Fox1, Siddappa N. Byrareddy1, JoEllyn M. McMillan1, Tatiana K. Bronich3, Benson J. Edagwa1, Michael D. Boska2, Howard E. Gendelman1,3 ![]()
1. Department of Pharmacology and Experimental Neuroscience, University of Nebraska Medical Center, Omaha, NE, USA;
2. Department of Radiology, University of Nebraska Medical Center, Omaha, NE, USA;
3. Department of Pharmaceutical Sciences, University of Nebraska Medical Center, Omaha, NE, USA.
* The first two authors contributed equally
Received 2017-9-9; Accepted 2017-10-6; Published 2018-1-1
Abstract

RATIONALE: Long-acting slow effective release antiretroviral therapy (LASER ART) was developed to improve patient regimen adherence, prevent new infections, and facilitate drug delivery to human immunodeficiency virus cell and tissue reservoirs. In an effort to facilitate LASER ART development, “multimodal imaging theranostic nanoprobes” were created. These allow combined bioimaging, drug pharmacokinetics and tissue biodistribution tests in animal models.
METHODS: Europium (Eu3+)- doped cobalt ferrite (CF) dolutegravir (DTG)- loaded (EuCF-DTG) nanoparticles were synthesized then fully characterized based on their size, shape and stability. These were then used as platforms for nanoformulated drug biodistribution.
RESULTS: Folic acid (FA) decoration of EuCF-DTG (FA-EuCF-DTG) nanoparticles facilitated macrophage targeting and sped drug entry across cell barriers. Macrophage uptake was higher for FA-EuCF-DTG than EuCF-DTG nanoparticles with relaxivities of r2 = 546 mM-1s-1 and r2 = 564 mM-1s-1 in saline, and r2 = 850 mM-1s-1 and r2 = 876 mM-1s-1 in cells, respectively. The values were ten or more times higher than what was observed for ultrasmall superparamagnetic iron oxide particles (r2 = 31.15 mM-1s-1 in saline) using identical iron concentrations. Drug particles were detected in macrophage Rab compartments by dual fluorescence labeling. Replicate particles elicited sustained antiretroviral responses. After parenteral injection of FA-EuCF-DTG and EuCF-DTG into rats and rhesus macaques, drug, iron and cobalt levels, measured by LC-MS/MS, magnetic resonance imaging, and ICP-MS were coordinate.
CONCLUSION: We posit that these theranostic nanoprobes can assess LASER ART drug delivery and be used as part of a precision nanomedicine therapeutic strategy.
Keywords: Antiretroviral drugs, dolutegravir, monocyte-derived macrophages, multimodal imaging, magnetic resonance imaging, confocal microscopy, rhesus macaques, rats and nanomedicines.
Introduction
A major unmet need in the treatment of human immunodeficiency virus type one (HIV-1) infection rests in long-term adherence to antiretroviral therapy (ART). If brought into clinical practice, long-acting ART regimens would substantively improve drug adherence, reduce secondary toxicities and prevent new infections. These could ultimately facilitate the realization of an AIDS-free world [1-8]. In efforts to complete this task, we improved the hydrophobicity of existing antiretroviral drugs (ARVs), leading to the formation of cell- and tissue-penetrant nanocrystals protected inside biodegradable polymers. These were made to establish drug depots within monocyte-macrophages [9-14]. A critical component for formulation development rests, in measure, on nanoparticle decoration with macrophage-targeting moieties in order to best facilitate drug reservoir targeting. Such advances, if realized, will speed the development of eradication measures or, at the least, make therapeutics more accessible to larger patient populations. However, a significant obstacle remains in the ability to rapidly screen drug formulation tissue biodistribution and pharmacokinetics (PKs) in order to realize substantive pharmacodynamic (PD) improvements. This is of particular importance as, while the half-lives of each of the few existing long-acting drugs measure in weeks or even months, drug tissue distribution is limited [8, 15-19]. To overcome these technical and biologic challenges, multimodal decorated nanoparticles were produced where hydrophobic ARVs and bioimaging agents were encased in a single nanoformulation. All were placed into one “multimodal imaging theranostic nanoparticle” using core-shell construction methods [20]. This allowed real-time assessment of ARV biodistribution and activity [21]. The surface of the particle was coated with lipids decorated with targeting moieties, while the drug and image contrast agents were incorporated into a polymeric core. The formed particles were rapidly taken up by macrophages. Tissue distribution was within the reticuloendothelial system, reflecting the target tissues of HIV-1. Specifically, europium (Eu3+)- doped cobalt ferrite (CF, EuCF) crystals and hydrophobic drug dolutegravir (DTG) were packaged in a polycaprolactone (PCL) core. A lipid layer coated the particle's “shell”. L-α-phosphatidylcholine (PC), 1,2-distearoyl-phosphatidylethanolamine-methyl-polyethyleneglycol conjugate-2000 (DSPE-PEG2000) and 1,2-dioleoyl-sn-glycero-3-phosphoethanolamine (DOPE) lipids enhanced particle biocompatibility and lipophilicity, facilitating macrophage targeting [22]. The fabrication of theranostic ARV nanoparticles allowed real-time tracking of both drug biodistribution and PKs [21].
Several unique chemical and biological features of the particles are worthy of mention. First, macrophage receptors sped entry of the ligand-coated drug particles. The folic acid (FA) receptor on macrophages enhanced particle cell entry [23-29]. Second, nanoparticles were produced with consistent size and stability, reflected in long-acting slow effective drug release (LASER) ART profiles [12, 13]. This enabled depot formation for viral reservoir targeting [13]. Third, synthesized nanoparticles were deployed for sensitive MRI tests. Such testing facilitated PK analyses and monitoring of drug-loaded nanoparticle distribution into tissue reservoirs of viral infection. Fourth, the core-shell structure was engineered to carry ARVs that include DTG (EuCF-DTG), while demonstrating excellent relaxivity profiles of r2 = 564 mM-1s-1 and r2 = 546 mM-1s-1 (targeted nanoparticles) in saline and r2 = 876 mM-1s-1 and r2 = 850 mM-1s-1 (targeted nanoparticles) in cells. Fifth, the Eu3+ component enabled fluorescence imaging for histological validation of cell localizations of drug-loaded nanoparticles [21]. Sixth, DTG release from EuCF-DTG nanoparticles provided real-time validation of drug biodistribution, as EuCF-DTG nanoparticles are rapidly endocytosed and retain potent antiretroviral activity. Seventh, confocal microscopy with Eu3+ fluorescence showed nanoparticles in cytoplasmic Rab compartments that affect vesicle trafficking and ARV depot formation [4, 12, 30, 31]. Eighth, following synthesis and particle characterization, bioimaging tests reflected drug biodistribution after parenteral injection in rats and rhesus macaques. No secondary metabolic or histopathological alterations were observed. Overall, the newly generated theranostic nanoparticles provided a platform for effective nanoformulated ARV development.
Results
Structural and physicochemical nanomaterial characterization
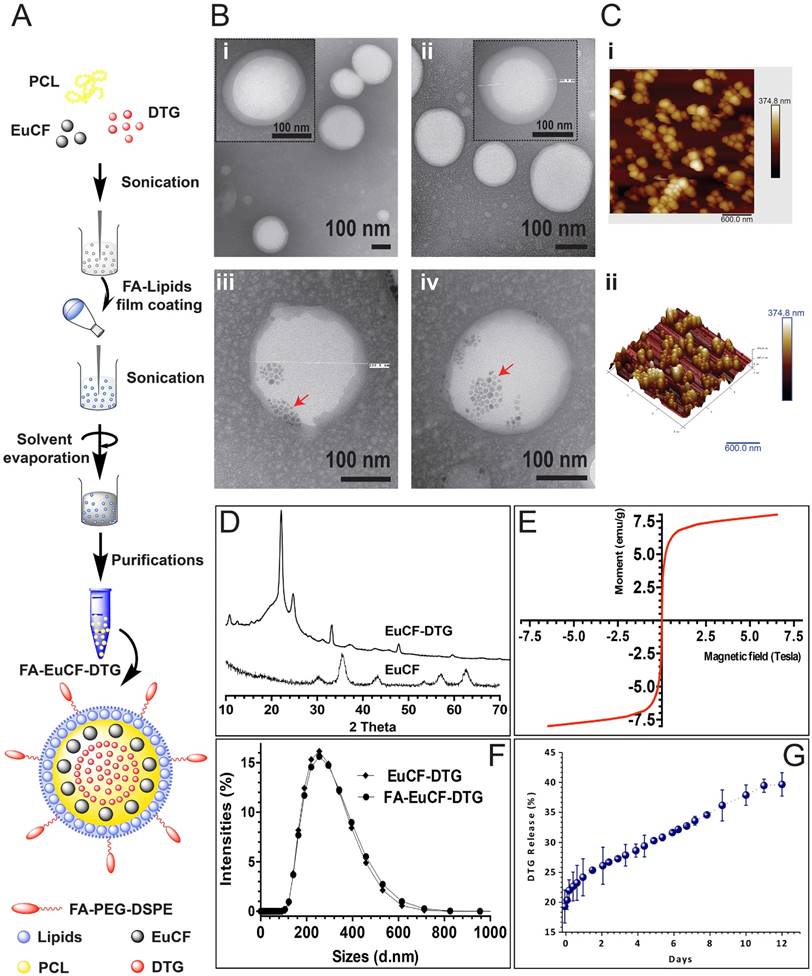
We synthesized multimodal EuCF-DTG lipid-PCL “core-shell” nanoparticles for multimodal fluorescence, MRI and ARV therapy. Lipid-PCL “core-shell” nano-constructs are effective theranostic vehicles [32-36]. The characterization of FA-decorated EuCF-DTG (FA-EuCF-DTG) nanoparticles is outlined in Figure 1A. The synthesized nanoparticles were composed of PCL:DTG:EuCF (1:0.075:0.05 w/w/w) cores surrounded by a lipid shell of PC:DSPE-PEG:DOPE (1:0.5:0.5 w/w/w). For FA-EuCF-DTG nanoparticles, a lipid ratio of PC:DSPE-PEG2000-FA:DOPE (1:0.5:0.5 w/w/w) was used. The EuCF-DTG nanoparticles exhibited fluorescence and emission wavelengths at 410 nm and 660 nm, respectively. Nanoparticle internal morphology was determined by transmission electron microscopy (TEM). TEM images (Figure 1B) show that the nanoparticles possess a spherical shape with a “core-shell” structure composed of PCL cores surrounded by multiple surface lipid layers. TEM images of the nanoparticles without EuCF are shown in Figure 1B (i-ii). Nanoparticles with EuCF embedded completely in the PCL core matrix are illustrated in Figure 1B (iii-iv) (low-power images can be seen in Figure S3). Atomic force microscopy (AFM) was used to characterize the surface topography of EuCF-DTG nanoparticles and suggested that the lipid layers covered the spherical nanoparticles with smooth and uniform surfaces, as illustrated by the topographic image shown in Figure 1C. Figure 1D shows the X-ray diffraction (XRD) patterns of EuCF and EuCF-DTG nanoparticles. Comparison of X-ray diffractograms of EuCF-DTG nanoparticles to those of native EuCF confirmed the polycrystalline nature of the synthesized particles. XRD patterns of EuCF-DTG nanoparticles showed peaks that correspond to organic (PCL and DTG data not shown here) and inorganic EuCF phases, demonstrating incorporation of all relevant components into the final nanoparticle. The observed decrement in the EuCF intensity of some diffraction peaks was due to the masking effect of PCL and lipids [37]. Broad diffraction peaks present in the X-ray diffractogram of EuCF-DTG nanoparticles were attributed to the presence of nanosized EuCF crystals [37]. EuCF diffraction peaks corresponded to spinel ferrite structures matching (JCPDS) those previously reported by other studies [21] (Figure 1D). The superconducting quantum interference device (SQUID) analysis in Figure 1E shows a saturation magnetization value of 7.5 emu/g and sigmoid curve for the EuCF-PCL nanoparticles, an indication that the nanoparticles were superparamagnetic at 300 K[21]. Figure 1F shows the hydrodynamic size of monodispersed nanoparticles as determined by dynamic light scattering (Figure S1). The average nanoparticle size was 253 nm in diameter with a polydispersity index (PDI) of 0.14 and ~6.2% w/w DTG drug loading. Evaluation of DTG release from EuCF-DTG nanoparticles was found to be cumulative with ~30% of drug released in 5 days and 36% at day 10 (Figure 1G). When the cumulative percentages of DTG release from experimental formulations were plotted versus time, it was found that ~40% DTG was released in 12 days from EuCF-DTG. Thus, drug release from EuCF-DTG nanoparticles parallels the slow release pattern of “LASER ART” nanocrystals. To better understand the mechanism of DTG release from EuCF-DTG nanoparticles, the experimental in vitro release data set (initial 6 days) was fitted by the Higuchi, Korsmeyer-Peppas, parabolic diffusion, Elovich equation, Bhaskar-Equation, and Modified-Freundlich kinetic models [38, 39]. Out of the six kinetic models, parabolic diffusion and Bhaskar equations exhibited a theoretical DTG release pattern that was very close to the experimental profile (r2 = 0.98918 and 0.98842; Figure S5 and Table S1). Therefore, the kinetics of DTG release are governed by diffusion-controlled release phenomena. FA receptor-targeted nanoparticles were prepared by incorporating FA-PEG-DSPE onto the surface of EuCF-DTG nanoparticles. Successful synthesis and chemical structure of FA-PEG-DSPE were confirmed by 1H-NMR (Figure S2A). Functionalization of the lipids was further confirmed by FTIR (Figure S2B). Specifically, chemical shifts at 3.3-3.6 ppm in the 1H-NMR spectrum correspond to repeating ethylene oxide (CH2CH2O) hydrogens of the PEG component of the lipid, while the aromatic protons from FA are at 7.7 and 8.3 ppm. Chemical shifts corresponding to DSPE are seen at 0.9 ppm (-CH3), 1.1 ppm (-CH2) and 2.1 ppm (-CH2CO) [40] (Figure S2A). The EuCF nanoparticles contain characteristic absorption bands of octahedral metal-oxygen (M-O) bonds of the ferrite lattice [21] (Figure S2B). DTG showed characteristic absorption bands at 1272 (-C-N), 1588 and 1650 (-C=O), 2983 (-C-H) and 3082 cm-1 (-C-H aromatic rings). The IR spectrum of PC demonstrates a characteristic C=O stretching band at 1740 cm-1 and PO-2 asymmetric double bond stretching bands at 1250 cm-1. The spectra of both PEG-DSPE and PC demonstrate a carbonyl ketone band at 1740 cm-1 and a CH alkyl-stretching band at 2891 cm-1. EuCF-DTG nanoparticles showed characteristic absorption bands belonging to EuCF, DTG, PCL and lipids, along with bands at 2951 cm-1 (asymmetric), 2873 cm-1 (symmetric) due to (-CH2), and 1725 cm-1 for the carbonyl (-C=O) stretching of PCL [20]. The FTIR results indicate that DTG and EuCF interact strongly with PCL and lipids.
Synthesis and characterization of lipid-coated core-shell nanoparticles. (A) A schematic illustration of the design of multimodal FA-EuCF-DTG core-shell nanoparticles is presented. (B) TEM images of nanoparticles, (Bi) PCL-DTG (without EuCF) nanoparticles, (Bii) FA-functionalized PCL-DTG (without EuCF) nanoparticles, (Biii) EuCF-DTG nanoparticles, and (Biv) FA-EuCF-DTG nanoparticles. The lipid layers (average thickness of ~15 nm) appeared as a solid corona around the “hard” PCL matrix. EuCF nanocrystals (red arrows) appear as crystalline hexagonal-shaped monodispersed structures in the PCL matrix. (C) Characterization of the size distribution of EuCF-DTG nanoparticles by AFM. (Ci) AFM topographic distribution of EuCF-DTG nanoparticles and, (Cii) a corresponding 3D view. (D) X-ray powder diffraction (XRD) patterns of EuCF and EuCF-DTG nanoparticles. (E) Evaluation of the magnetic properties of the nanoparticles by magnetic-hysteresis (M-H) curves measurements using SQUID. Data are recorded at 300 K. (F) Hydrodynamic size distribution of nanoparticles determined by dynamic light scattering (average nanoparticle size of ~253 nm) and (G) in vitro release profiles of DTG in PBS (pH 7.3) at 37±0.5 °C (stability test in Figure S1 and 1H-NMR and FTIR available in Figure S2).
Macrophage uptake and subcellular nanoparticle distribution
To determine cell uptake of the nanoparticles, human monocyte-derived macrophages (MDM) were treated with FA-EuCF-DTG nanoparticles (based on 5 μg/mL iron) for up to 12 h. Cells were then washed with phosphate-buffered saline (PBS) and collected into nitric acid (69.0%) at 2, 4, 8 and 12 h. Cobalt and DTG concentrations were determined by ICP-MS and UPLC-MS/MS, respectively. Uptake of FA-EuCF-DTG nanoparticles was significantly greater than EuCF-DTG nanoparticles at both 8 h and 12 h, as determined by iron content (Figure 2A). At 12 h, the cell iron concentration was ~1.1 μg/106 cells for FA-EuCF-DTG, which was 4.5-fold greater than that of EuCF-DTG (~0.25 μg/106 cells; TEM and backscattered electron study of nanoparticles is shown in Figure S4). Corresponding cell DTG levels are shown in Figure 2B, with FA-EuCF-DTG nanoparticles providing higher levels of DTG compared to EuCF-DTG. Cell nanoparticle uptake and subcellular localization were visualized by confocal microscopy using the inherent fluorescence properties of Eu3+ (Figure 2C). Subcellular distribution of EuCF-DTG nanoparticles was determined at 8 h by immunostaining with Rab7 (late endosomal sorting), Rab11, Rab14 (recycling endosomal compartments), and LAMP-1 (lysosomal-associated membrane protein-1) antibodies. Primary antibodies were detected using a red Alexa Fluor 594 secondary antibody. Co-localization of nanoparticles (green) and endolysosomal proteins (red) is illustrated by a yellow color [41] (Figure 2D). The images show that EuCF-DTG nanoparticles were distributed mainly in recycling endosomal compartments throughout the cytoplasm (Rab11) and in the perinuclear region (Rab14). Nanoparticle distribution in lysosomes (LAMP-1) and early endosomal compartments (Rab7) was less than that seen in recycling endosomes. These results clearly demonstrate that EuCF-DTG nanoparticles are taken into macrophages through endolysosomal pathways and held within recycling endosomal compartments [41-43].
Macrophage nanoparticle uptake and subcellular distribution. Uptake and subcellular distribution of nanoparticles was determined in human MDM (monocyte-derived macrophage). EuCF-DTG and FA-EuCF-DTG nanoparticles were detected in cells at 2 h. EuCF-DTG and FA-EuCF-DTG nanoparticles were added to MDM culture at a concentration of 5 μg/mL iron (cytotoxicity tests available in Figure S6). (A) Iron concentrations in MDM following nanoparticle uptake over 12 h and (B) corresponding DTG levels; data represent mean ± SEM (n = 3). Statistical differences were determined using one-way ANOVA among groups followed by Student's t-test for differences between groups at each time-point, ****p < 0.0001. (C) Intracellular nanoparticles were detected by confocal microscopy at an excitation wavelength of 488 nm and emission wavelength of 510/520 nm (see Figure S7 for time-dependent uptake of nanoparticles). (D) For subcellular distribution analysis, MDM were treated with EuCF-DTG nanoparticles (5 μg/mL based on iron; green) for 8 h and then immunostained with Rab7, Rab11, Rab14 and LAMP-1 antibodies and Alexa Fluor 594-labeled secondary antibody (red) to visualize nanoparticle and organelle co-registration. The yellow (merged) shows overlap of nanoparticles and Rab compartments. DAPI (blue) stain indicates cell nuclei. Images were captured with 63X objective on a Zeiss LSM 710 confocal microscope. Scale bars = 20 µm (low-power images are available in Figure S8). (E-H) TEM ultrastructural evaluation of macrophage nanoparticle uptake and subcellular distribution. Nanoparticles were added to MDM cultures for 8 h. Cells were fixed and processed for TEM. (E) Typical internal morphology of control macrophages is shown. Detailed evaluation of membrane-bound intracellular structures at areas of interest is presented in magnified panel ii and iii. (F-H) Intracellular uptake of (F) PCL-DTG (without EuCF), (G) EuCF-DTG and (H) FA-EuCF-DTG nanoparticles. Areas of interest bordered with dotted red lines are presented in corresponding high-resolution images (ii-iii) and illustrate nanoparticles within membrane-bound intracellular structures. All nanoparticle types were internalized and entrapped in endosomal vesicles in the macrophages. Images of macrophages treated with FA-functionalized nanoparticles reveal a higher number of nanoparticles internalized in vesicles compared to non-decorated particles. EuCF-DTG and FA-EuCF-DTG nanoparticles are seen as black punctate structures encapsulated in white polymeric nanoparticles within membrane-bound endosomes (Figure 2G-H and Figure S4 show surface morphology by SEM of cells after nanoparticle treatment).
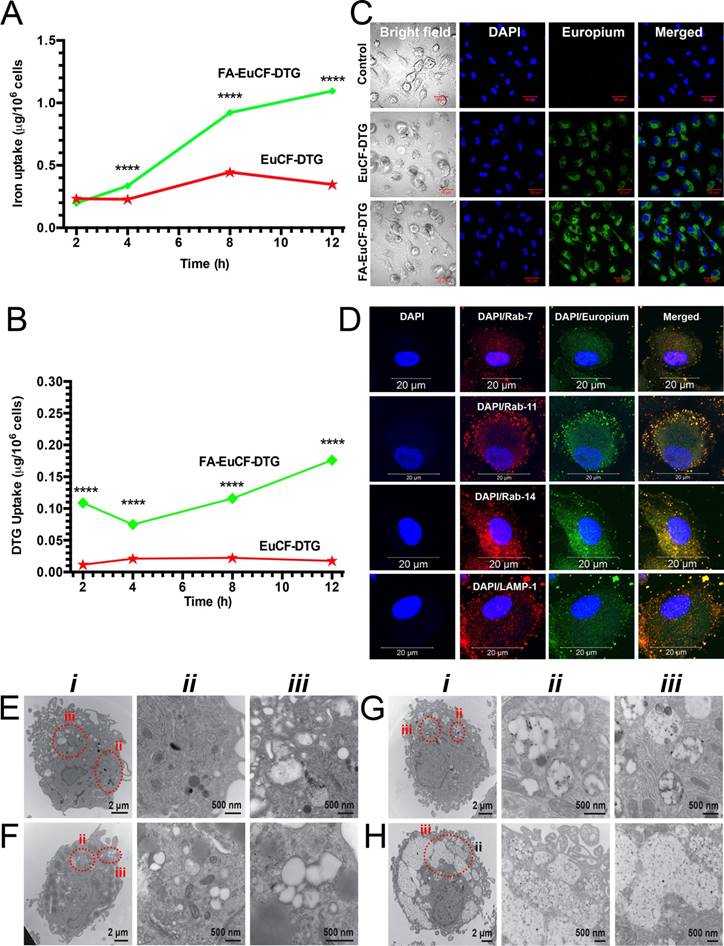
Subcellular distribution of nanoparticles in MDM was also investigated by TEM (Figure 2F-H). TEM of a control cell is shown in Figure 2E and illustrates typical macrophage morphology. A greater number of FA-EuCF-DTG nanoparticles (Figure 2H) were internalized compared to EuCF-DTG nanoparticles (Figure 2G). The presence of the nanoparticles did not alter macrophage morphology (see Figure S6, for cytotoxicity assays, Figure S7 for time-dependent uptake of nanoparticles and Figure S8 for subcellular nanoparticle distributions).
Antiretroviral activities of EuCF-DTG and FA-EuCF-DTG nanoparticles
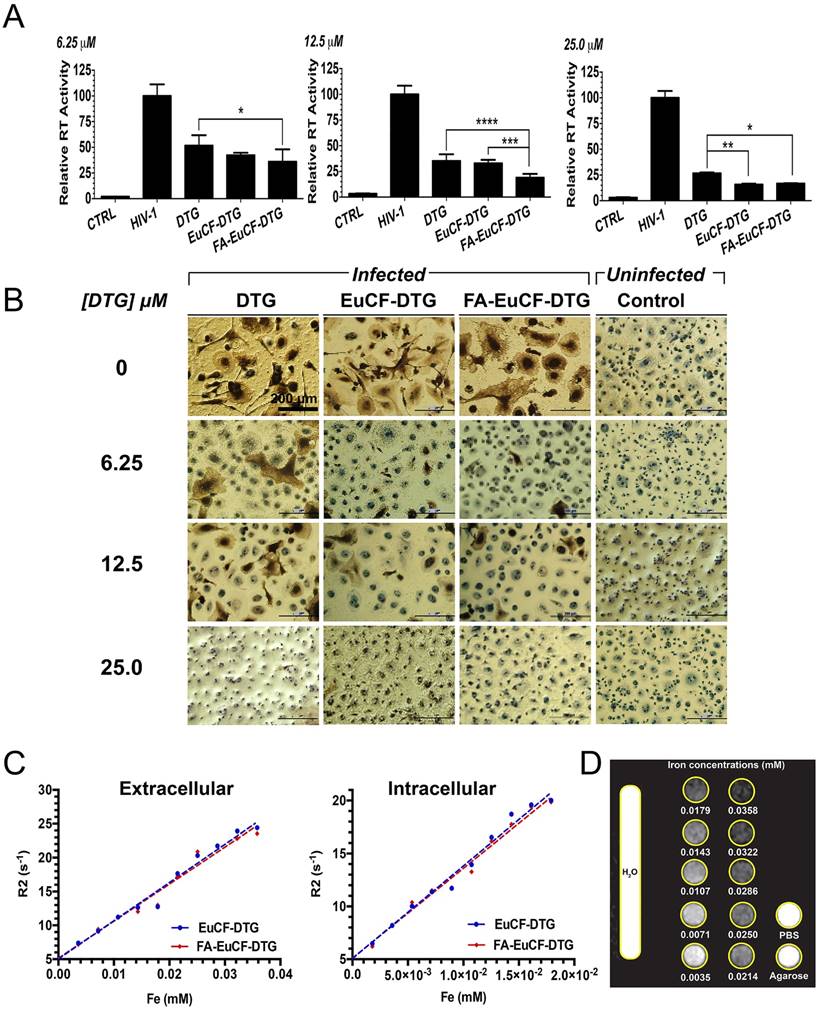
The antiretroviral activities of EuCF-DTG and FA-EuCF-DTG nanoparticles were assessed in MDM infected with HIV-1ADA, a prototype macrophage-tropic strain [44]. MDM were treated with nanoparticles at various DTG concentrations, while native drug served as a control. At 1 day after treatment, MDM were infected at a multiplicity of infection (MOI) of 0.1 infectious viral particles per cell. At 10 days after infection, progeny HIV virion production was determined by reverse transcriptase (RT) activity in the cell culture fluids. Intracellular HIV-1 p24 antigen expression was also measured in the cells. As illustrated in Figure 3A, RT activity was suppressed by 6.25, 12.5 and 25 µM DTG (native and nanoparticles). These results were paralleled with HIV-1 p24 staining (Figure 3B). In cells infected at day 1 after treatment, fewer HIV-1 p24 positive cells were detected with EuCF-DTG and FA-EuCF-DTG nanoparticles than in cells treated with native DTG. However, we noted EuCF-DTG and FA-EuCF-DTG responses were similar at day 5 (data not shown).
Antiretroviral and MRI relaxivity measurements. Antiretroviral activity was determined in MDM treated for 8 h with free DTG, EuCF-PCL, EuCF-DTG or FA-EuCF-DTG nanoparticles (6.25, 12.5 and 25 µM DTG) and then infected with HIV-1ADA at a multiplicity of infection (MOI) of 0.1 at day 1 after drug loading. At 10 days after infection, progeny HIV virion production was determined by RT activity in the cell culture fluids. (A) HIV replication was determined 10 days after infection by HIV RT activity of day 1. Statistical differences were determined using one-way ANOVA among groups; we used Tukey's test to correct for multiple comparisons. *p < 0.05; **p < 0.01; ***p < 0.001. (B) HIV p24 staining (scale bar = 200 μm). (c-d) MRI signal enhancement effects of EuCF-DTG and FA-EuCF-DTG nanoparticles were determined by calculating nanoparticle relaxivity r2 (mM-1s-1) in both PBS (extracellular) and MDM (intracellular) using a 7T MRI scanner. (C) Nanoparticle relaxation rates (R2) in both PBS and MDM increased linearly with increasing iron concentrations. (D) T2-weighted images of EuCF-DTG nanoparticles in PBS demonstrate signal reduction with increasing concentrations of iron.
MRI assessment of EuCF-DTG and FA-EuCF-DTG nanoparticles biodistribution
The relaxivities (r2) of EuCF-DTG and FA-EuCF-DTG nanoparticles were first measured. Nanoparticle relaxation rates (R2) in both PBS and MDM increased linearly with increasing iron concentrations (Figure 3C). The linear regression coefficients of determination (r2) for relaxation rate (R2) vs. iron content for EuCF-DTG and FA-EuCF-DTG nanoparticles were 0.979 and 0.973 in PBS, respectively (Figure 3C left), and 0.985 for both EuCF-DTG and FA-EuCF-DTG nanoparticles in cells (Figure 3C right). The relaxivities of the EuCF-DTG and FA-EuCF-DTG nanoparticles were r2 = 564 mM-1s-1 and r2 = 546 mM-1s-1 in PBS, and r2 = 876 mM-1s-1 and r2 = 850 mM-1s-1 in cells, respectively. FA-EuCF-DTG nanoparticles showed a log order-of-magnitude increase in both sensitivity and specificity compared to superparamagnetic iron oxide nanoparticles at replicate iron concentrations [21]. Signal intensities of T2*-weighted images of FA-EuCF-DTG nanoparticles in PBS phantoms substantially decreased with increasing iron concentrations (Figure 3D). These data confirmed the magnetic sensitivity of the nanoparticles.
Biodistribution of EuCF-DTG and FA-EuCF-DTG nanoparticles in Sprague Dawley rats was determined following intravenous (IV) or intramuscular (IM) injection (Figure 4, S9, S10). The experimental time-line for EuCF-DTG nanoparticle injection and MRI scanning is shown in Figure 4A. Representative MR images from pre-injection and days 2, 5, and 10 post-injection are shown in Figure 4B (biodistribution of FA-EuCF-DTG nanoparticles in rats are shown in Figure S9 and Figure S10). The images show a decrease in T2*-weighted signal intensity within liver (red highlight) and spleen (green highlight) at all post-injection time-points. These data reflect the presence of iron in these tissues. TEM images of FA-EuCF-DTG nanoparticles in reticuloendothelial tissues after IV injection in rats (Figure S11) and of EuCF-DTG nanoparticles after 10 days showed nanoparticle deposition in the muscle tissue after IM injection (Figure S12). Histopathology showed no significant changes in hepatic, renal, and pancreatic functions in the observed animals (Figure S13).
Nanoparticle biodistribution tests. (A) Time line of the experimental procedure in the rats is shown (NP: nanoparticles). (B) Representative T2 maps of rats at 2, 5 and 10 days after IV or IM administration of 2 mg iron/kg as EuCF-DTG nanoparticles (yellow: lung; red: liver; green: spleen). (C) Schematic diagram of macrophage-based biodistribution of EuCF-DTG nanoparticles in the reticuloendothelial system of rhesus macaques (IM: intramuscular). (D) Representative T2-weighted images of a macaque at 5 days after IM administration of 2 mg iron/kg as EuCF-DTG nanoparticles (yellow: lung; red: liver; green: spleen). (FA-EuCF-DTG nanoparticle biodistribution in rats by MRI test is shown in Figure S9-10).
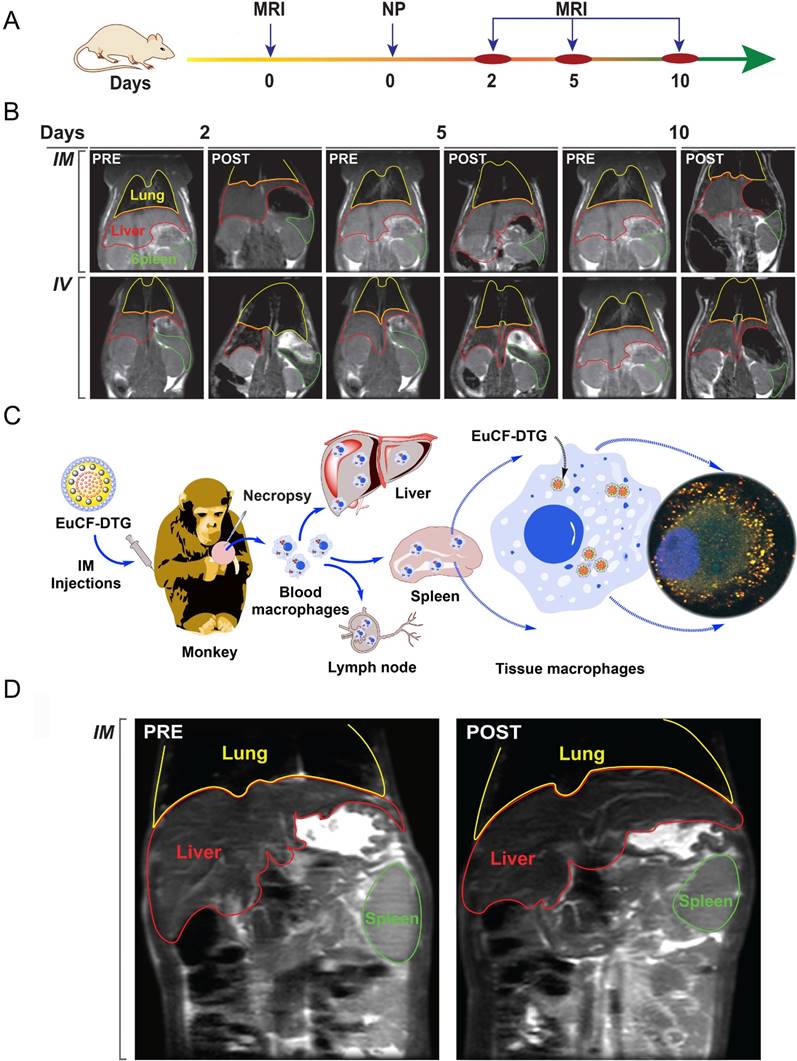
EuCF-DTG nanoparticles were administered to rhesus macaques infected with simian immunodeficiency virus (SIV) as a proof-of-concept to determine nanoparticle biodistribution in a large animal during viral infection. Tested animals showed plasma viral RNA loads ranging from 106-107 copies/mL (Figure S14A-C). Figure 4C shows a schematic of the uptake of EuCF-DTG nanoparticles by macrophages and the establishment of a reticuloendothelial system drug depot. Comparison of macaque MR images before injection and 5 days post-injection with EuCF-DTG nanoparticles revealed 1) a significant decrease in T2-weighted signal intensity within the liver and spleen (Figure 4D) and 2) signal image intensity decreased by ~20% following injection (Figure S14D). The change in T2 signal intensity was higher in liver than in spleen, indicative of an increased amount of uptake of the EuCF-DTG nanoparticles in hepatic tissue. Shortening of T2 seen in macaque MR images are comparable to that which was seen in EuCF-DTG-treated rats (Figure S14D), suggesting that biodistribution of EuCF-DTG is similar in the two species.
DTG, iron and cobalt validation tests in rats and rhesus macaque
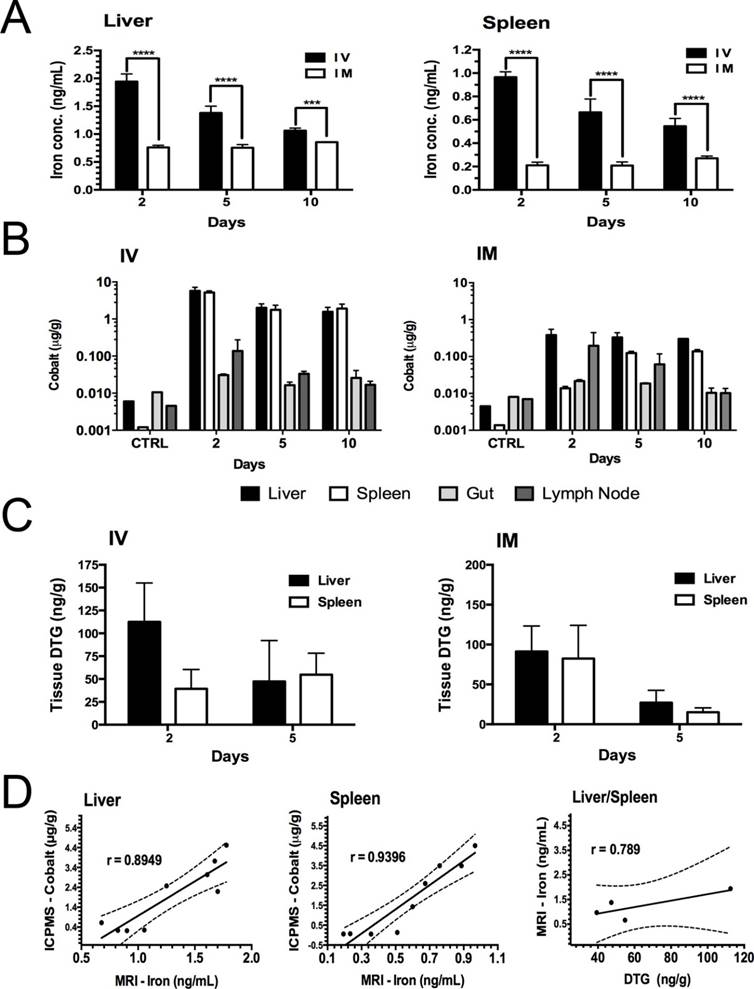
Rat tissue concentrations of iron (estimated by MRI), DTG (by ultraperformance liquid chromatography tandem mass spectrometry (UPLC-MS/MS)) and cobalt (by inductively coupled plasma mass spectrometry (ICP-MS)) are illustrated in Figure 5A-C and Figure S10A-C. Iron concentrations in the liver and spleen were quantified by MRI T2 mapping and compared with respect to time and route of administration (Figure 5A). Iron concentrations were two-fold higher in animals given IV injections compared to animals given IM injections (Figure 5A). Iron levels in liver and spleen in IV-injected animals decreased over time, while corresponding levels in IM-injected animals were lower but sustained over the 10-day experimental time course. Tissue iron and cobalt levels showed a similar trend to drug levels (Figure 5A-B). Liver and spleen DTG concentrations at days 2 and 5 are shown in Figure 5C. Cobalt and DTG plasma concentrations are illustrated in Figures S10D-E. Drug levels in liver and spleen were approximately 2-fold higher at day 2 post-treatment compared to day 5 post-treatment. The DTG levels in liver at day 2 and day 5 were 112±42 ng/g (IV) and 91.2±32 (IM) ng/g versus 47.3±44 ng/g (IV) and 27.12±15 ng/g (IM), respectively; whereas, DTG levels in the spleen at day 2 and day 5 were 39.3±21 ng/g (IV) and 82.4±41 ng/g (IM) versus 54.8±23.3 ng/g (IV) and 15.12±5.4 ng/g (IM), respectively. Overall, DTG and cobalt levels following either IV or IM injection of nanoparticles showed coordinate tissue and plasma drug and cobalt levels. However, nanoparticle uptake by liver macrophages was 2.5-fold higher than by splenic macrophages (Figure 5A-C). To validate the use of MRI to track drug-loaded nanoparticles, the correlation of iron levels obtained by MRI, cobalt levels by ICP-MS and drug levels by UPLC-MS/MS was determined in liver and spleen in animals given nanoparticles by IV or IM injection. Pearson correlation plots between in vivo MRI iron levels and both tissue DTG and cobalt concentrations are shown in Figure 5D. In Figure 5D, day 5 iron levels (by MRI) are plotted versus cobalt levels for individual animals given IV or IM injections. Averaged data sets of day 5 iron levels were plotted against DTG levels. These data show a strong correlation between iron, cobalt and DTG concentrations within liver and spleen, with Pearson's correlation coefficients of r = 0.8949 (liver), 0.9396 (spleen) and 0.6505 (combined liver and spleen; Figure S10F) for iron versus cobalt and 0.789 for iron versus drug (combined liver and spleen). Of importance, the iron and DTG levels in the liver and spleen were directly related to cobalt concentrations measured by ICP-MS (Figure 5D). This suggests that the amount of drug that accumulates in reticuloendothelial tissues can be estimated by MRI using the known in vivo MRI signal-to-drug ratio for the EuCF-DTG nanoparticles (Figure 6). Such methods will allow personal drug dosage to be determined in individuals for future treatments.
Drug and cobalt concentrations after parenteral EuCF-DTG administration. Sprague Dawley rats were administered EuCF-DTG nanoparticles (2 mg/kg iron content) by IM or IV injection on day 0 and sacrificed on days 2, 5 or 10. Plasma was collected for drug analysis on days 1, 2, 5, and 10 after treatment. DTG and cobalt levels were determined by UPLC-MS/MS and ICP-MS, respectively, at days 2, 5 and 10 (details in Figure S10A-C). (A) Quantitation of iron in liver and spleen by MRI tests. (B) Cobalt concentrations. (C) Tissue DTG concentrations. (D) Pearson's correlation of iron (determined MRI), cobalt (determined ICP-MS) and DTG (determined UPLC-MS/MS) concentrations in liver and spleen tissues five days after IV/IM administration of nanoparticles (details in Figure S10). Statistical differences were determined using two-way ANOVA among groups; ***p < 0.001; ****p < 0.0001. Comparative analysis of FA-EuCF-DTG nanoparticle biodistribution in rats is shown in Figure S9-S10.
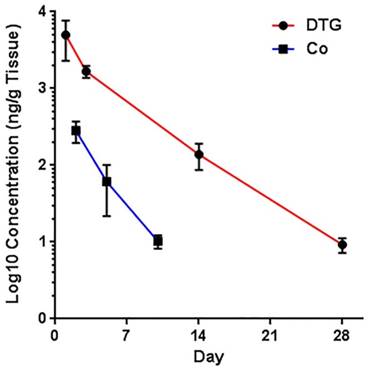
Prediction correlations of cobalt and DTG levels in tissues (DTG data sets were obtained from an independent publication [12]). Cobalt and DTG levels in the tissues were analyzed by ICP-MS and UPLC-MS/MS. No significant differences in deviation from linearity for either function (p = 0.6667 and p = 1.0000) were observed. In addition, no significant differences were observed in the rate of change, by slope measures, in either DTG or cobalt concentrations (p = 0.476). Noted differences in line elevation (p = 0.0011) were linked to the relative concentrations of each component (cobalt and DTG) administered.
To determine whether these observations in rats would be translatable to species more closely related to humans, we determined biodistribution of EuCF-DTG nanoparticles by MRI in rhesus macaques. DTG and cobalt concentrations in plasma and tissues were also determined. The highest concentrations of DTG and cobalt were observed in the liver and kidneys with detectable levels observed in the spleen and lymph nodes (Figure S14E-H). Little drug or cobalt was detected in lungs. These results suggest that EuCF-DTG nanoparticles are taken up by macrophages in reticuloendothelial tissues in rhesus macaques.
Intracellular macrophage nanoparticle trafficking in rat tissues
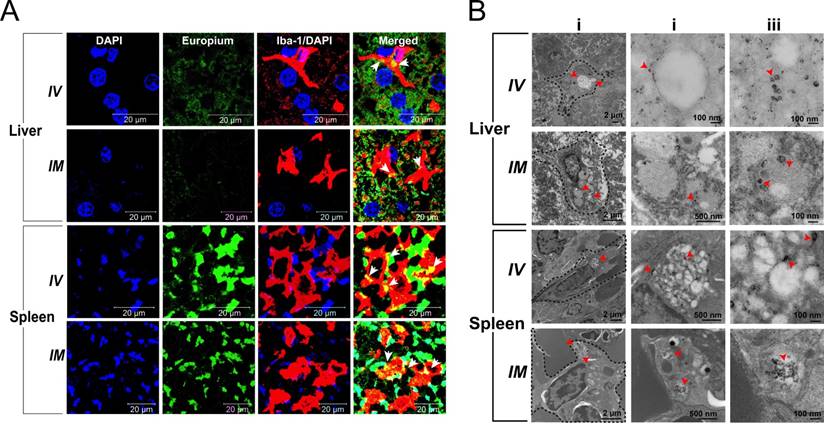
To confirm that the nanoparticles were localized within liver and splenic macrophages of rats, we examined these tissues using immunohistology and TEM. Representative tissue sections of liver and spleen from animals sacrificed 5 days post-EuCF-DTG injection (IM and IV) are shown in Figure 7A. Tissues were probed with Iba-1 antibody to identify activated macrophages. Arrows within the merged images highlight the yellow/orange color indicative of co-localization of EuCF-DTG nanoparticles (green) within the activated macrophages (red). Corresponding TEM images of 5-day post-injection liver and spleen are shown in Figure 7B. Cellular localization of nanoparticles within macrophages and immune cells in the liver and spleen can be clearly seen as black dots in the TEM images in both IV- and IM-injected animals. These results are in agreement with the in vitro results, suggesting that macrophages within the liver and spleen took up the nanoparticles and retained them for at least 5 days after nanoparticle administration. Immunohistochemistry results in rhesus macaque tissues following EuCF-DTG administration paralleled what was seen in rat tissues (Figure S15). Histological evaluation of rhesus macaque tissues 5 days after IM injection of EuCF-DTG was conducted in accordance with the guidelines of the Society of Toxicologic Pathology; and no anomalies were found other than those typical of chronic SIV infection (Figure S16). There were no biochemical or hematological effects of the EuCF-DTG nanoparticles in rhesus macaques (Table S2).
Immunohistochemical and morphological localization of EuCF-DTG nanoparticles. (A) Representative tissue sections of liver and spleen of rats administered EuCF-DTG nanoparticles (green) were stained for Iba-1 (red) on activated macrophages. Nanoparticles were detected in macrophages in both liver and spleen. Arrows in the merged figures indicate co-localization of nanoparticles in macrophages. Images were captured with 63X objective on a Zeiss LSM 710 confocal microscope. (B) TEM of liver and spleen 5 days after IV or IM injection of EuCF-DTG nanoparticles (2 mg iron/kg). Panels ii and iii are higher-powered images from regions indicated by red arrowheads in panel i. Presence of nanoparticles (black dots) is seen in macrophages in both liver and spleen (panel ii and iii, Figure S11. FA-EuCF-DTG nanoparticles were seen localization in reticuloendothelial tissues by TEM tests.
Discussion
A paradigm shift in the treatment of HIV/AIDS has emerged in the past half-decade through the realization that LASER ART is a viable alternative to conventional ARV therapy [3, 4, 12, 45, 46]. LASER ART can affect regimen changes, improve patient ARV adherence, reduce systemic toxicities, ease pill burdens and limit new viral infections [2, 46-48]. Nonetheless, hurdles remain in the conversion from commonly used pills into long-acting drug formulations. Our laboratories have taken a singular approach in converting hydrophilic or partially hydrophobic drugs into lipophilic prodrugs and in using decorated polymers to target reservoirs of viral infection. This strategy seeks to optimize drug delivery, biodistribution and PK profiling [3, 4, 6, 41, 43]. However, the best strategy to screen newly synthesized and decorated nanoparticles remains unrealized. As therapeutic success of formulations is linked to nanoparticle size, shape, decoration, encapsulation and drug half-life, screening is cumbersome. Moreover, how best to assess drug penetrance into “putative” viral reservoirs remains a major obstacle in translational research efforts. We now posit that one means to assess the therapeutic potential of LASER ART is through theranostic probes [21]. Thus, stable ultra-sensitive EuCF nanoparticles encapsulating ARV and surrounded by lipids [20] were made. This “multi-modal nanoprobe platform” proved successful for MRI tests of ARV biodistribution. Such theranostic screens used to assess cell-based drug delivery holds potential for approaches to develop eradication strategies to cure HIV/AIDS.
EuCF-DTG nanoparticles were prepared via an emulsification solvent evaporation method using dichloromethane (DCM) as the organic phase. The mechanism of formation of multicomponent nanosystems is described as a combination of inorganic nanoparticles (EuCF) and organic, hydrophobic, biodegradable PCL forming the core of the particles with amphipathic lipids (DOPE, mPEG2000-DSPE and PC) constituting the shell of the multicomponent nanosystems. Importantly, PCL has a good solubility in DCM, which by diffusing towards the oil phases enhances the hydrophobic drug (DTG) retention in the core of EuCF-PCL, significantly improving encapsulation efficiency. Additionally, when the EuCF-PCL and drug solution (in DCM) is dispersed into the aqueous polyvinyl alcohol (PVA) surfactant, the agitation of the interface spontaneously produces a bigger interfacial area, which leads to nano-sized quasi-emulsion droplets of EuCF and DTG encapsulated in PCL. Simultaneously, combinations of amphipathic lipids serve as secondary surfactants on the surface of nanoparticles. Meanwhile, methanol specially diffuses from droplets due to its lower affinity for EuCF, DTG and PCL, and higher affinity for PVA. Continuous diffusion of methanol out of the droplets and the coacervation of PVA led to formation of nanoparticles with the lipids mixture acting as secondary surfactants. Conclusively, the evaporation of residual solvent and subsequent solidification of EuCF-DTG core-shell nanoparticles, together with stirring in PVA solution, caused greater reduction in surface tension, leading to formation of the resultant particles in the nanometer range and with spherical morphologies.
DTG was released slowly over a time period of 12 days. The prolonged release profile could be attributed to physicochemical properties of the EuCF-DTG core-shell. Drug release occurred by diffusion through the lipid barriers followed by erosion of the core polymer by hydrolytic degradation. These hypotheses were cross validated by kinetic parabolic diffusion and Bhaskara equation models indicative of the low permeability of water in the particle's interior PCL core-shell. Due to the hydrophobic nature of DTG, it is probable that the drug was incorporated at the core of the particles during the solvent evaporation process. It is expected that nanoparticles prepared by solvent evaporation slowly release the drug due to the hydrophobic nature of the core materials.
The nanoparticles contain individual functional components that improve their diagnostic and therapeutic potential. First, the CF component enhances MRI signal sensitivity and specificity measures [21]. The images show excellent T2 relaxivity. As such, they can be readily used for ARV biodistribution studies. High relaxivity results in enhanced sensitivity for ferrite quantification. Second, the nanoparticle's unique spinel structure permits the incorporation, in a formed lattice, of rare earth elements. This includes, but is not limited to, neodymium, Eu3+ and gadolinium [21, 49]. Third, Eu3+ provides magnetic and fluorescence capabilities. Fourth, the translational potential is realized through the nanoparticle's biocompatibility [21]. This is facilitated through the outer “soft” lipid layer of the EuCF-DTG nanoparticles [22, 50]. Fifth, Eu3+ doped CF can be surface-modified by FA for functionalization [21]. Sixth, the formed FA-EuCF-DTG nanoparticles are highly stable and as such can be made for systemic use. Seventh, the FA-EuCF-DTG nanoparticles are hydrophilic with a narrow size distribution. Each contains a “hard” inner matrix of an organic-inorganic hybrid of EuCF and PCL, which enables the nanoparticles to be loaded with hydrophobic ARVs and have limited to no toxicities [22]. Eighth, the nanoparticles unique physicochemical properties facilitate entry into cells. Indeed, the core is made up of EuCF, PCL and DTG, while the outer lipid layers are formed with PC, DSPE-PEG2000 and DOPE. The lipid surrounding the EuCF-DTG core serves to facilitate rapid uptake by macrophages and as such effectively distribute drug into tissue viral reservoirs. Ninth, the lipid layer shell over the nanoparticle's core provides inherent stability and appropriately sized nanoparticles can be readily made in order to optimize cell and tissue delivery. Indeed, the EuCF-DTG and FA-EuCF-DTG nanoparticles are homogeneous with relatively narrow nanoparticle size distribution and retention of drug loading capacities and antiretroviral activity. Tenth, the nanoparticle's size and shape are comparable to that of LASER ART being developed for clinical use [12, 43]. The nanoparticles are remarkably consistent in morphology. Electron microscopic images indicate that all synthesized nanoparticles display lipid layers outside the EuCF-DTG or FA-EuCF-DTG core matrix. The latter appears smooth with uniform topography that is particularly important in reducing systemic adverse events. Eleventh, the uptake of nanoparticles by macrophages is optimized, as endocytosis is facilitated by spherical or semi-rod-shaped nanoparticles [13, 51-53].
Macrophage uptake and subcellular nanoparticle distribution enables drug delivery to HIV infection sites [54-56]. Uptake of the lipid nanoparticles is greater than that of silica platforms [21]. The fluorescence modality of the EuCF-DTG and FA-EuCF-DTG nanoparticles proved useful in identifying nanoparticle subcellular distribution. We assayed macrophage nanoparticle uptake by measurements of both iron and DTG. We then examined nanoparticle subcellular localization using antibodies specific to subcellular compartment proteins and showed that the nanoparticles were distributed preferentially within recycling endosomes. Previously, we and others have demonstrated preferential localization of nanoformulated rod-shaped nanoparticles containing ARV drugs in similar compartments [41, 57]. HIV persists in recycling endosomes [12, 41, 57] supporting the importance of subcellular ART depots.
Prior reports demonstrated that the FA receptor beta (FR-β), highly expressed on macrophages, could facilitate nanoparticle cell entry [26-29]. We have previously demonstrated significantly higher macrophage uptake of FA-decorated nanoformulations compared to replicate nanoformulations without decoration [13, 58]. In particular, ARV nanoparticles that were decorated with FA showed higher atazanavir levels in lymphoid organs such as the spleen and lymph nodes compared to non-decorated particles. Notably, drug levels paralleled FR-β staining in both macrophage-rich parafollicular areas of spleen and lymph nodes. FA targeting of abacavir nanoparticles improved drug and pharmacokinetics and antiretroviral activity [41]. Moreover, demonstration of human serum albumin nanocapsules that were surface modified with FA led to macrophage internalization [25]. Formulation uptake was three-fold higher in FR-β-positive macrophages than in macrophages not expressing FR-β. Similarly, FR-β-specific targeting of methotrexate nanoparticles suppressed inflammation associated with type II collagen-induced arthritis models [24]. Furthermore, macrophage targeting of FA-conjugated iron oxide nanoparticles were described [23] and reflect our own results. In the current report, we showed higher uptake of FA-EuCF-DTG nanoparticles in reticuloendothelial tissues (Figure S9-10). Moreover, we confirmed that FA-decorated nanoparticles showed higher macrophage uptake (Figure S11) [13, 58, 59]. Therefore, the macrophage-targeting strategy presented in our study for FA-mediated uptake of nanoparticles will enable targeting of nanoformulated drug particles.
Nanoparticle migratory behavior was investigated in rodents and non-human primates. MR images showed decreased signal intensity within the liver and spleen. Corresponding MRI T2 values revealed that iron levels matched the drug PK and biodistribution profiles. Validations were made by analysis of cobalt and drug content. No significant differences in deviation from linearity for either drug or cobalt levels were found over time. Co-localization of nanoparticles within macrophages was seen using confocal and electron microscopy in both cell culture and histopathological tissue analyses, highlighting the importance of Eu3+ as a fluorescent tag. Assay of cobalt and iron along with drug content provided MRI confirmation results. Our finding of preferential macrophage uptake of nanoparticles paralleled the observed PK and biodistribution results [53, 60-62]. With the successful development of the multi-modal nanoprobes in rhesus macaques, we posit that macrophage-targeted theranostics can be useful as a testing platform to assess drug biodistribution in humans. Macrophages loaded with theranostic nanoparticles can move throughout the body and target tissue sites of residual latent virus [10, 63, 64]. Notably, the nanoparticles maintain their integrity and ARV efficacy. Most importantly, nanoparticle distribution can be monitored and tracked in real-time [10, 21]. Overall, our newly-developed platform provides a means to accurately and effectively optimize the delivery of antiretroviral drug-loaded nanoparticles into macrophages.
In conclusion, EuCF-DTG “multimodal imaging theranostic nanoprobes” were made to facilitate the development of targeted LASER ART. The lipid-encapsulated EuCF nanoparticles can fulfill this role by providing a flexible platform for the design of diagnostic and therapeutic applications. The efficacy and structural integrity of the nanoprobe platform was confirmed in rats and SIV-infected rhesus macaques by MRI. FA-functionalized EuCF-DTG nanoparticles showed enhanced nanoparticle uptake and antiretroviral activity. EuCF-DTG was localized to recycling macrophage endosomal compartments without evidence for cytotoxicity.
Materials and Methods
Reagents
Iron(III) acetylacetonate (Fe(acac)3), cobalt(II) acetylacetonate (Co(acac)2), europium(III) nitrate hydrate (Eu(NO3)3·5H2O), folic acid (FA), oleic acid, oleylamine, lipopolysaccharide (LPS), poly(vinyl alcohol) (MW 30,000-70,000, 87-90% hydrolyzed), L-α-phosphatidylcholine (PC) (from egg yolk), 3-(4,5-dimethylthiazol-2-yl)-2,5-diphenyltetrazolium bromide (MTT), dicyclohexyl-carbodiimide, N-hydroxysuccinimide, low gelling temperature agarose, coumarin-6, iron and cobalt standards for ICP-MS (TraceCERT®) and nitric acid (TraceSELECT®) were obtained from Sigma-Aldrich, St. Louis, MO, USA. Polycaprolactone (PCL) (MW 43,000-50,000) was obtained from Polysciences, Inc. Warrington, PA, USA. 1,2-Distearoyl-phosphatidylethanolamine-methyl-polyethyleneglycol conjugate-2000 (DSPE-PEG2000) and 1,2-dioleoyl-sn-glycero-3-phosphoethanolamine (DOPE) were obtained from Corden Pharma International, Plankstadt, Germany. DTG was obtained from BOC Sciences, Shirley, NY, USA. 1,2-Distearoyl-sn-glycero-3-phosphoethanolamine-N-[amino(polyethyleneglycol)-2000] (DSPE-PEG2000-NH2) was obtained from Laysan Bio Inc. Arab, AL, USA.
Synthesis of DSPE-PEG2000-FA Conjugates
FA-modified DSPE-PEG2000 was synthesized by a multi-step process. FA was activated by conversion to a N-hydroxysuccinimide ester (NHS-FA) [65]. FA (237 mg; 0.536 mmol, 1 equiv.) was dissolved in 10 mL of anhydrous dimethyl sulfoxide (DMSO, 10 mL) and triethylamine (80 µL, 0.569 mmol, 1.1 equiv.) and allowed to stir at room temperature for 18 h under argon and protection from light [40]. Dicyclohexylcarbodiimide (111 mg; 0.533 mmol, 1 equiv.) and N-hydroxysuccinimide (123 mg; 1.0 mmol, 2 equiv.) were added to the FA solution then stirred for an additional 16 h. The resulting NHS-FA solution was separated from insoluble dicylohexylurea by filtration then reacted with DSPE-PEG2000-NH2 (500 mg; 0.179 mmol, 0.3 equiv.). The mixture was stirred for 3 days at room temperature under argon and light protection. The DSPE-PEG2000-FA conjugate was precipitated from ether (~150 mL) and collected by centrifugation at 215 × g for 15 min. The pellet was dried under vacuum, dissolved in methanol (~25 mL) and purified on a sephadex LH-20 column using a coumarin-6 dye as an indicator. The purified product (~200 mL volume) was precipitated from ether and collected by centrifugation at 1950 × g for 10 min. The resulting pellet was lyophilized (Labconco Freezone 2.5, Kansas City, MO, USA) for two days and yielded a light yellow powder. Covalent linkage of FA to DSPE-PEG2000-NH2 was confirmed by 1H-NMR (Bruker Avance III HD, 500 MHz in deuterated DMSO). The final DSPE-PEG2000-FA conjugate was stored at 4 °C.
Production of EuCF-DTG “core-shell” nanoparticles
EuCF nanoparticles of 7.2 nm size were fabricated using solvothermal techniques [21] and characterized for hydrodynamic size, size distribution, shape, structural configurations, morphology, chemical composition and superparamagnetic properties. EuCF-DTG “core-shell” nanoparticles were synthesized using a modified solvent evaporation process [20, 66]. Specifically, PCL (400 mg), DTG (30 mg) and EuCF (20 mg) were dissolved in DCM, methanol and chloroform (oil phase), respectively. Fresh lipid mixtures were prepared by dissolution of PC (50 mg), mPEG2000-DSPE (25 mg) and DOPE (25 mg) in 5 mL of chloroform by bath sonication. A EuCF-DTG primary emulsion was prepared by mixing EuCF, PCL and DTG solutions with stirring for 6-8 h at 140 × g at room temperature. The secondary emulsion and shell layers for core nanoparticles were prepared by making a thin film of lipids (PC, PEG2000-DSPE and DOPE) in a round bottom flask through rotary evaporation (Büchi Rotavapor R-II, New Castle, DE, USA) of chloroform followed by overnight vacuum-drying. The primary emulsion of EuCF-DTG was then transferred into 30 mL of freshly prepared 1% (w/v) PVA and mixed by probe sonication (Cole-Parmer, Vernon Hills, IL, USA) at 20% amplitude for 10 min in an ice bath. The PVA served as a surfactant in this emulsification step. The core nanoparticles were then transferred into the flask containing the lipid film. The flask was steadily rotated with the core nanoparticles in a bath sonicator followed by probe sonication at 20% amplitude for 10 min in an ice bath. Evaporation of DCM was carried out under pressure at 35°C followed by overnight stirring. The nanoparticles were purified by centrifugation of the suspension at 55 × g for 10 min, followed by centrifugation of the supernatant at 35,1315 × g for 30 min at 10°C (Sorvall, Lynx-4000 super speed centrifuge, Thermo Fisher Scientific, Waltham, MA, USA). The pellet was washed twice with PBS, resuspended in PBS and stored at 4°C. For preparation of FA-EuCF-DTG nanoparticles, 25 mg of DSPE-PEG2000-FA was used and the remainder of the synthesis followed the preparation of the EuCF-DTG nanoparticles. For drug quantification from nanoparticles, ~30 mg of lyophilized nanoparticles was dissolved in 10 mL of DCM: methanol (1:1 v/v) mixture. The mixture was then bath sonicated for 30 min followed by centrifugation at 35,1315× g for 30 min. The supernatant was collected and DCM was evaporated at room temperature. The drug in methanol was quantified by HPLC.
In vitro drug release study
In vitro release study of DTG was performed using a USP dissolution testing system (Sotax-AT7smart USP, SOTAX Corp. Westborough, MA, USA) with dialysis bag technique[39] (Dialysis bag, MWCO 25 kD, Spectrum Laboratories, Inc., CA,USA). The DTG release experiments were carried out in Dulbecco's phosphate-buffered saline (DPBS; Thermo Fisher Scientific, Waltham, MA, USA) with 2% (v/v) Tween-80. Five mg of DTG in EuCF nanoparticles were placed in dialysis bags containing 3 mL of the release medium. The bags were placed in stainless steel baskets and immersed in a container containing 1000 mL of release medium at a temperature of 37±0.5 °C. One mL of each sample was withdrawn at regular time intervals and the same volume was replaced with fresh release medium. Samples were further diluted and analyzed for DTG content by HPLC. These studies were performed in triplicate for each sample, and the average values were used in the data analyses. Furthermore, the release profiles of DTG from nanoparticles were each fitted with Higuchi, Korsmeyer-Peppas, Elovich equation, parabolic diffusion, Bhaskar-equation, and Modified-Freundlich mathematical models [38].
Nanoparticle characterization
Powder X-ray diffraction (XRD) analysis was carried out in the 2θ range of 2-70° using a PANalytical Empyrean diffractometer (PANalytical, Inc., Westborough, MA, USA) with Cu-Kα radiation (1.5418 Å) at 40 kV and 45 mA. A mask of 20 mm and divergence slit of 1/32° were used on the incident beam path. A thin layer of the powdered nanoparticle was placed on a zero-background silicon plate and continuously spun at a rate of 22.5°/s. The solid state PIXcel3D detector (PANalytical, Inc.) was scanned at a rate of 0.053°/s. The PIXcel3D was equipped with a beam monochromator to improve the signal-to-noise ratio. Magnetic characterization was performed using a superconducting quantum interference device (SQUID) magnetometer (Quantum Design, MPMS-XL, Quantum Design International (QDI), San Diego, CA, USA) at 300 K. Stability of the EuCF-DTG nanoparticle suspension was assessed over three weeks by measuring hydrodynamic diameter and nanoparticle size distribution in saline on a Malvern Zetasizer Nano-Series instrument (Malvern Instruments Ltd., Malvern, UK) at 4 °C. FTIR were recorded on a Perkin-Elmer-spectrum attenuated total reflectance (ATR)-FTIR equipped with a UATR-accessary (Perkin-Elmer, Inc., Waltham, MA, USA). Atomic-force microscopy (AFM) was conducted using a Bruker Dimension Icon® Atomic Force Microscope (Bruker, Billerica, MA, USA) equipped with peak-force tapping and scan-assist with Al reflection coating (spring constant is 0.4 N/m and tip radius is ~2 nm, width 25 μm, thickness 0.65 μm, and length 115 μm). Multilayers of nanoparticles were prepared by drop-casting diluted aliquots of aqueous nanosuspensions on clean glass slides followed by slow evaporation of the solvent at room temperature. The images were flattened using Nano-Scope Analysis software (Bruker, Billerica, MA, USA). Nanoparticle morphology and structure were analyzed by transmission electron microscopy (TEM). Nanoparticle suspensions were dried on a copper grid at room temperature and bright field images were taken with exposure times of 2 s using the Tecnai G2 Spirit TWIN electron microscope (FEI, Houston, TX, USA) operating at 80 kV. Images were acquired with an AMT digital imaging system. Fluorescence spectroscopy was performed by SpectraMax® M3 Multi-Mode Microplate Reader (Molecular Devices, LLC, Sunnyvale, CA, USA).
Isolation and culture of monocyte-derived macrophages (MDM)
Human peripheral blood monocytes were obtained by leukapheresis from hepatitis B and HIV-1/2 seronegative donors, and were purified by counter-current centrifugal elutriation [21]. Cells were cultured in Dulbecco's modified Eagle's medium (DMEM; Invitrogen, Grand Island, NY, USA) with 10% heat-inactivated pooled human serum (Innovative Biologics, Herndon, MA, USA), 1000 U/mL macrophage colony stimulating factor, 1% glutamine, 50 μg/mL gentamicin, and 10 μg/mL ciprofloxacin for 7 days to promote monocyte-macrophage differentiation [44]. Cellular uptake of the EuCF-DTG and FA-EuCF-DTG nanoparticles was determined in MDM cultured in 12-well plates at a density of 1.5 × 10⁶ cells/well. Cells were treated with nanoparticles in medium at a concentration of 5 μg iron/mL for 12 h. Nanoparticle uptake was assessed by measurement of cell drug and iron concentrations without medium changes. Adherent MDM were scraped into PBS at 2, 4, 8 and 12 h post treatment. Cells were pelleted by centrifugation at 1950 × g for 10 min at 4 °C and briefly sonicated in 100 μL of a mixture of methanol:acetonitrile (1:1 v/v) then centrifuged again at 10,844 × g for 10 min at 4 °C. Supernatant was used for DTG quantification by reversed phase HPLC. Parallel sets of cells were collected into nitric acid (69%) for ICP-MS analysis of iron and cobalt content.
Immunocytochemistry and transmission electron microscopy (TEM)
Macrophage nanoparticle uptake and subcellular distribution were studied by confocal microscopy and TEM [10, 21, 61]. To determine subcellular localization of EuCF-DTG nanoparticles, MDM were treated with nanoparticles at a concentration of 5 μg iron/mL for 8 h. For immunofluorescence staining, cells were washed three times with 1 mL of PBS (10 min each step) and fixed with ice cold 4% paraformaldehyde (PFA) at room temperature for 30 min. The cells were then washed with PBS (1 mL, 3X) for 10 min at each step and treated with a permeabilizing reagent (0.5% v/v Triton-X-100) for 15 min at room temperature. Cells were again washed with PBS (1 mL, 3X) for 10 min at each step. Cells were treated with a blocking solution (5% w/v BSA in PBS and 0.1% v/v Triton-X-100) for 1 h at room temperature and quenched with 50 mM NH4Cl for 15 min. The cells were washed once with 0.1% Triton-X-100 in PBS and incubated with primary antibody (Rab7 (SC-10767) for late endosomes, Rab11 (SC-6565) and Rab14 (SC-98610; Santa Cruz Biotechnology, Dallas, TX, USA) for recycling endosomes and LAMP-1 (NB120-19294; Novus Biologicals, Littleton, CO, USA) for lysosomes) diluted in blocking solution (5% BSA and 0.1% Triton-X in PBS; antibody: blocking solution 1:25) overnight with shaking at 4 °C. Cells were then incubated with secondary antibody (AlexaFluor-594; Thermo-Fischer Scientific, Waltham, MA, USA) and diluted in blocking solution (1:50) for 2 h at room temperature. Slides were covered with ProLong Gold AntiFade reagent with DAPI (4′,6-diamidino-2-phenylindole; Thermo-Fischer Scientific, Waltham, MA, USA) and imaged using a 63X oil objective on an LSM 710 confocal microscope (Carl Zeiss Microimaging, Inc., Dublin, CA, USA). Zeiss LSM 710 Image browser AIM software version 4.2 was used to determine the number of pixels and the mean intensity of each channel. For TEM analysis, MDM (1.5 × 10⁶ cells/mL) were incubated in 12-well plates for 8 h with nanoparticles (5 μg/mL of iron concentration). After treatment, cells were centrifuged at 1950 × g for 10 min at 4 °C. Cell pellets were suspended in a solution of 2% glutaraldehyde and 2% PFA in 0.1 M Sorenson's phosphate buffer (pH 6.2) for a minimum of 24 h at 4 °C. The cell fixation and block preparation methods are available in the Supplementary Material. MDM internal morphology was analyzed by cutting thin sections of control and nanoparticle-loaded MDM using a Leica UC6 ultramicrotome (Leica Microsystems, Inc., Buffalo Grove, IL, USA) then placed on 200 mesh copper grids. MDM and nanoparticle samples were examined using the Tecnai G2 Spirit TWIN electron microscope (FEI, Houston, TX, USA) operating at 80 kV. Images were acquired with an AMT digital imaging system.
Antiretroviral activity
Antiretroviral efficacies of the EuCF-DTG and FA-EuCF-DTG nanoparticles in HIV-1 infected MDM were evaluated as described [41, 43]. In brief, MDM were treated with 6.25 µM, 12.5 µM, or 25 µM (DTG content) of native DTG, EuCF-DTG or FA-EuCF-DTG nanoparticles for 8 h. Cells were then cultured in fresh medium without nanoparticles. At days 1 and 5 post-treatment, MDM were then treated with HIV-1ADA for 16 h at a multiplicity of infection (MOI) of 0.1 infectious virions per cell. Cells were maintained for 10 days post infection with a full media exchange occurring 2 days prior to analysis. The culture supernatants were assessed for progeny virion formation by measuring reverse transcriptase (RT) activity [67]. At this time, cells were washed with PBS and fixed in 4% PFA for 15 min. Fixed cells were blocked using 10% BSA containing 1% Triton-X 100 in PBS for 30 min at room temperature. Following blocking, cells were incubated with monoclonal mouse anti-HIV p24 antibody (1:50; Dako, Carpinteria, CA, USA) overnight at 4 °C, followed by a 1 h incubation at room temperature. Horseradish peroxidase (HRP)-labeled polymer anti-mouse secondary antibody (Dako EnVision® System; Dako) was added (one drop per well), and cells were counterstained with hematoxylin (500 μL/well). Images were captured using a Nikon TE300 microscope with a 20X magnification objective.
MRI relaxometry measurements
EuCF-DTG and FA-EuCF-DTG nanoparticle suspensions with an iron concentration ranging from 0.2 to 2 μg/mL were prepared in DPBS. A 1.5% w/v agar gel was prepared by adding 150 mg of low melting agar in 10 mL of PBS at 70°C for 30 min. Phantom gels containing nanoparticles were prepared by mixing 100 μL of a 1.5% (w/v) agar solution that was preheated to 60°C to prevent gelation with 100 μL of the nanoparticle suspension. Experiments were performed in triplicate at each concentration. In order to make sure that no air bubbles were present, the nanoparticle suspensions and agar gels were vortexed thoroughly while warm in 250 μL eppendorf tubes and then rapidly cooled in an ice bath. MRI tests were performed using eppendorf tubes containing the fixed nanoparticles in agar gels. MRI data were acquired on a 7T/16 cm Bruker PharmaScan MRI system (Bruker; Ettlingen, Germany). T2-relaxtion maps were generated using a CPMG (Carr Purcell Meiboom Gill sequence) phase-cycled multi-echo sequence. Single slice (0.5 mm slice thickness) data were acquired with 3000 ms repetition time, 50 echoes (echo times TEn = n x 10 ms; n = 1), 256 x 128 acquisition matrix, 50 x 50 mm field of view (FOV), 2 averages, for a total scan time of 13 min. For T2 relaxation time measurements in MDM, as described in our previous study [21], monocytes were seeded onto 100 mm culture plates at a concentration of 106 cells/mL and differentiated into macrophages in the presence of MCSF for seven days. Following this, MDM were treated with nanoparticles (5 µg iron/mL) for 8 h and then the treatment medium was removed and cells washed three times with DPBS. Cells were scraped into DPBS, collected by centrifugation (1950 × g for 10 min at 4 °C) and suspended at various cell concentrations containing 1.5% w/v agar in 250 μL eppendorf tubes. For T2 map measurements, CPMG phase-cycled 3-dimensional multi-echo sequence data was acquired with 250 ms repetition time, 48 echoes (echo times TEn = n X 2.618; n = 1,…,48), 128 × 128 × 64 acquisition matrix, 70 × 64.76 × 42.38 mm FOV, one average, for a total scan time of 34 min.
EuCF-DTG and FA-EuCF-DTG nanoparticle biodistribution in rats
In vivo biodistribution of nanoparticles was determined in male Sprague Dawley rats (160-170 g) obtained from Charles River Laboratories (Wilmington, MA, USA). Animals were housed in the University of Nebraska Medical Center (UNMC) laboratory animal facility according to Association for Assessment and Accreditation of Laboratory Animal Care guidance. All protocols related to animal experiments were approved by the UNMC Institutional Animal Care and Use Committee, and met the requirements of the UNMC ethical guidelines set forth by the National Institutes of Health. Rats were divided into multiple groups dependent on their route of injection and planned sacrifice time point of 2, 5, or 10 days post-injection. Twenty-four hours prior to nanoparticle treatment, rats were given 5 mg/kg lipopolysaccharide (LPS) by intraperitoneal injection to engage the innate immune system and affect macrophage activation in analogous manners as would be seen following HIV-1 infection. Rats were MRI scanned prior to injection of the EuCF-DTG nanoparticles (2 mg iron/kg iron content) and at 2, 5 and 10 days post-injection to determine nanoparticle biodistribution and integrity. Assessment of the effects of FA targeting was performed by administration of FA-EuCF-DTG nanoparticles in rats by either IM or IV injection. MRI scanning was performed pre-injection and 5 days after injection for comparison tests of EuCF-DTG administered animals.
MRI was performed using the same 7T/16 cm Bruker PharmaScan that was used for phantom data acquisition. Both T2∗-weighted high-resolution imaging and T2 mapping were used to determine the biodistribution of EuCF-DTG nanoparticles. T2∗-weighted MRI was performed using a 3D spoiled gradient recalled echo sequence with 10 ms repetition time, 2.7 ms echo time, 15° pulse angle, 256 × 196 × 128 acquisition matrix, 75 × 57.5 × 37.5 mm FOV, six averages, for a total scan time of 25 min. For T2 mapping, CPMG phase-cycled 3-dimensional multi-echo sequence data was acquired with 24 echoes (echo times TEn = n × 2.718 ms; n = 1, 2, …,24), 400 ms repetition time, 128 × 128 × 64 acquisition matrix, 70 × 64.76 × 42.38 mm FOV, one average, for a total acquisition time of 34 min. T2 relaxation times were computed at each pixel and generated maps using custom computer programs written in Interactive Data Language (IDL; Exelis Visual Information Solutions; McLean, VA, USA). These maps were constructed at pre-injection and 24 h post-injection of nanoparticles using the even-echo images from the CPMG phase cycled imaging data. Estimation of T2 relaxation times from even echoes only minimizes the measurement errors due to the imperfection of high-power pulses [68]. The region of interest (ROI) analysis was performed using Image-J software (http://imagej.nih.gov/lj). The concentrations of nanoparticles were determined from the change in relaxivity rate (ΔR2 = 1/T2postinjection - 1/T2preinjection) and the nanoparticle relaxivity (r2) per mmol was determined as the slope of iron concentration versus R2 measured ex vivo.
SIV-infected rhesus macaques
Three female rhesus monkeys were obtained from the Yerkes National Primate Research Center. The monkeys were infected with SIVmav239 by an intravenous injection route 350 days prior to drug administration. The monkeys had also been infected with Zika virus subcutaneously 175 days prior to this study. All animals had cleared Zika virus but were productively chronically infected with SIV. EuCF-DTG nanoparticles were prepared under GLP conditions as above and given to animals by intramuscular injection at a dose of 2 mg/kg based on iron on day 0. Animal health was monitored daily and injection sites were examined closely under anesthesia on days 3 and 7; no reaction was noted. Blood was collected in K-EDTA tubes and plasma prepared on day -5, day 0, day 3 and day 7; CSF was collected without additives in tubes on day 0 and day 7. On day -2 pre- and day 5 post- EuCF-DTG nanoparticle administration, MRI was performed on the three animals.
MRI tests for EuCF-DTG nanoparticle biodistribution in rhesus macaques
Biodistribution of EuCF-DTG nanoparticles in rhesus macaques was determined using a Philips Achieva (Briarcliff Manor, NY, USA) 3.0T MRI scanner. T2-weighted high-resolution imaging and T2 mappings were obtained. High resolution T2-weighted images were acquired using a turbo spin echo (TSE) sequence with 1428.6 ms repetition time, 90 ms echo time, 90° flip angle, 116 echo train length, 22 slices (3.5 mm slice thickness; 4.5 mm spacing between slices), 360 × 360 acquisition matrix, 360 × 360 mm FOV, 6 averages, for a total scan time of 31.42 min. A multi-echo TSE sequence was used for T2 relaxation time mapping. Images were acquired with 2000 ms repetition time, 16 echoes (echo times TEn = n x 6 ms; n = 1, …,16), 288 x 288 acquisition matrix, 360 × 360 mm FOV. This sequence was repeated to cover multiple coronal slices (12 slices for pre-injection and 16 slices for post-injection, 3.5 mm slice thickness, 4.5 mm spacing between slices). T2 relaxation time maps were created using custom-developed computer programs using IDL programming language. ROI analysis was performed using ImageJ software.
Tissue analyses from treated rhesus macaques
After imaging on day 5, bone marrow and lymph node biopsies were performed on two of the animals. The third animal was sacrificed on day 7, and fluids and tissues were collected for study. At necropsy, splenomegaly and lymphadenopathy were present (consistent with chronic SIV infection), and EuCF-DTG nanoparticles were present in the gall bladder, confirmed by ICP-MS (cobalt = 0.476±0.037 μg/g). Complete blood counts and metabolic panels were performed by the UNMC Department of Pathology and Microbiology / Nebraska Medicine Clinical Laboratory Services. All animal experimentation was performed under approval by the UNMC IACUC in AAALAC-certified facilities following NIH guidelines.
Immunohistochemistry
To determine cellular distribution of EuCF-DTG nanoparticles in tissues, following the MRI scan (five days after administration of EuCF-DTG nanoparticles) animals were euthanized for collection of tissues. Tissues were fixed in 4% PFA overnight and embedded in paraffin. Tissue sections (5 µm) were cut and mounted on glass slides. For rats, tissues sections were probed with rabbit anti-rat polyclonal antibody to ionized calcium binding adaptor molecule-1 (Iba-1) (1:500; Wako Chemicals, Richmond, VA, USA) to detect macrophages. Primary antibody was detected with anti-rabbit secondary antibody conjugated to Alexa Fluor 594 (Thermo-Fischer Scientific, Waltham, MA, USA). Immunohistochemical tests performed on rhesus macaque tissues are available in Supplementary Materials.
Toxicological assessments
In vivo toxicity of the EuCF-DTG nanoparticles was determined by serum chemistry and histological examination. For histological examination, 5 μm sections of paraffin-embedded tissues were affixed to glass slides and stained with hematoxylin and eosin. Images were captured with a 20X objective using a Nuance EX multispectral imaging system affixed to a Nikon Eclipse E800 microscope (Nikon Instruments, Melville, NY, USA). Histopathological assessment was conducted in accordance with the guidelines of the Society of Toxicologic Pathology. For serum chemistry analysis, rat blood samples were collected before and five days after EuCF-DTG nanoparticles administration. Albumin (ALB), alanine aminotransferase (ALT), total bilirubin (TBIL), phosphate (PHOS), total protein (TP) and amylase (AMY) were quantitated using a VetScan comprehensive diagnostic profile disc and a VetScan VS-2 instrument (Abaxis Veterinary Diagnostics, Union City, CA, USA).
Abbreviations
AFM: atomic force microscopy; ALB: Albumin; ALT: alanine aminotransferase; AMY: amylase; ART: antiretroviral therapy; ARV: antiretroviral drug; ATR: attenuated total reflectance; CF: Cobalt Ferrite; CPMG: Carr Purcell Meiboom Gill; DCM: dicholoromethane; DMSO: dimethyl sulfoxide; DSPE-PEG2000: 1,2-distearoyl-phosphatidylethanlamine-methyl-polyethyleneglycol conjugate-2000; DOPE: 1,2-dioleoyl-sn-glycero-3-phosphoethanolamine; DTG: dolutegravir; Eu3+: europium; EuCF-DTG: europium doped cobalt ferrite dolutegravir loaded nanoparticles; EuCF: europium doped cobalt ferrite; FA-EuCF-DTG: Folic acid decorated europium doped cobalt ferrite dolutegravir loaded nanoparticles; FA: folic acid; FOV: field of view; FR-β: folic acid receptor beta; FTIR: Fourier transformed infrared spectra; HIV-1: human immunodeficiency virus type 1; ICP-MS: Inductively coupled plasma mass spectrometry; IDL: Interactive Data Language; IM: Intramuscular; IV: Intravenous; LASER ART: long acting slow effective release antiretroviral therapy; LPS: lipopolysaccharide; MDM: monocyte-derived macrophages; MOI: multiplicity of infection; MRI: magnetic resonance imaging; NHS: N-hydroxysuccinimide ester; NP: nanoparticles; PBS: phosphate-buffered saline; PC: phosphatidylcholine; PCL: polycaprolactone; PD: pharmacodynamics; PDI: polydispersity index; PFA: paraformaldehyde; PHOS: phosphate; PK: pharmacokinetics; QDI: Quantum Design International; ROI: region of interest; HPLC: high performance liquid chromatography; RT: reverse transcriptase; SIV: simian immunodeficiency virus; SQUID: superconducting quantum interference device; TBIL: total bilirubin; TEM: transmission electron microscopy; TP: total protein; TSE: turbo spin echo; UPLC-MS/MS: ultraperformance liquid chromatography tandem mass spectrometry; ICP-MS: inductively coupled plasma mass spectrometry; XRD: X-ray diffraction.
Supplementary Material
Supplemental figures S1-S16 and Tables S1-S2.
Acknowledgements
The authors would like to thank Tom Bargar and Nicholas Conoan of the Electron Microscopy Core Facility at the UNMC for technical assistance. The EMCF is supported by state funds from the Nebraska Research Initiative and the University of Nebraska Foundation, and institutionally by the Office of the Vice Chancellor for Research. We thank Janice A. Taylor and James R. Talaska of the Advanced Microscopy Core Facility at the University of Nebraska Medical Center for providing assistance with (confocal or super resolution) microscopy. Support given to the UNMC Advanced Microscopy Core Facility was provided through the Nebraska Research Initiative, the Fred and Pamela Buffett Cancer Center Support Grant (P30CA036727), and an Institutional Development Award from NIGMS (P30GM106397). The LSM710 Zeiss Confocal Microscope used in this research was supported by the NIH grant S10RR027301. The authors thank the Nebraska Center for Materials and Nanoscience and Redox Biology at the University of Nebraska-Lincoln for ICP-MS, XRD, SQUID and AFM analyses. The authors appreciate the excellent technical assistance made by Melissa Mellon, Lirong Xu, and Celina M. Prince in support of the MRI tests. This work was supported, in part, by NIH Grants AG043540, DA028555, NS036126, NS034239, MH064570, NS043985, MH062261, AG043540, AI113883 and DOD Grant 421-20-09A, the Carol Swarts Emerging Neuroscience Fund and the Nebraska Research Initiative.
This publication is dedicated to the life and legacy of Professor Michael D. Boska who was killed before his time in a plane crash and during the manuscript preparation. His friendship, intellect and scientific vision are very much part of these text pages and he is missed beyond simple words.
Author contributions
BDK, MDB and HEG conceived the project. BDK, BMO, TK, RD synthesized and characterized the nanoformulations and performed the laboratory and rodent experiments. YL, CW and BRS performed the magnetic resonance imaging tests and analyzed and interpreted the bioimaging results. PD, HSF, SNB, SEC and BM performed and analyzed experiments and interpreted data obtained from the rhesus macaque experiments. BDK and HEG wrote the manuscript and interpreted the data. BDK designed and fabricated the nanoformulations. JMM and BE assisted in the data interpretation, provided experimental oversight and edited the manuscript.
Competing Interests
The authors have declared that no competing interest exists.
References
1. Talal J, Abutbul-Ionita I, Schlachet I, Danino D, Sosnik A. Amphiphilic Nanoparticle-in-Nanoparticle Drug Delivery Systems Exhibiting Cross-Linked Inorganic Rate-Controlling Domains. Chemistry of Materials. 2017;29:873-85
2. Spreen WR, Margolis DA, Pottage JC. Long-acting injectable antiretrovirals for HIV treatment and prevention. Curr Opin HIV AIDS. 2013:8
3. Landovitz RJ, Kofron R, McCauley M. The promise and pitfalls of long-acting injectable agents for HIV prevention. Curr Opin HIV AIDS. 2016;11:122-8
4. Edagwa B, McMillan J, Sillman B, Gendelman HE. Long-acting slow effective release antiretroviral therapy. Expert Opinion on Drug Delivery. 2017:1-11
5. Araínga M, Edagwa B, Mosley RL, Poluektova LY, Gorantla S, Gendelman HE. A mature macrophage is a principal HIV-1 cellular reservoir in humanized mice after treatment with long acting antiretroviral therapy. Retrovirology. 2017;14:17
6. Andrews CD, Heneine W. Cabotegravir long-acting for HIV-1 prevention. Curr Opin HIV AIDS. 2015;10:258-63
7. Zhang L, Herrera C, Coburn J, Olejniczak N, Ziprin P, Kaplan DL. et al. Stabilization and Sustained Release of HIV Inhibitors by Encapsulation in Silk Fibroin Disks. ACS Biomater Sci Eng. 2017;3:1654-1665
8. Margolis DA, Brinson CC, Smith GHR, de Vente J, Hagins DP, Eron JJ. et al. Cabotegravir plus rilpivirine, once a day, after induction with cabotegravir plus nucleoside reverse transcriptase inhibitors in antiretroviral-naive adults with HIV-1 infection (LATTE): a randomised, phase 2b, dose-ranging trial. The Lancet Infectious Diseases. 2015;15:1145-55
9. Martin P, Giardiello M, McDonald TO, Smith D, Siccardi M, Rannard SP. et al. Augmented Inhibition of CYP3A4 in Human Primary Hepatocytes by Ritonavir Solid Drug Nanoparticles. Molecular Pharmaceutics. 2015;12:3556-68
10. Weissleder R, Nahrendorf M, Pittet MJ. Imaging macrophages with nanoparticles. Nat Mater. 2014;13:125-38
11. Miller MA, Chandra R, Cuccarese MF, Pfirschke C, Engblom C, Stapleton S. et al. Radiation therapy primes tumors for nanotherapeutic delivery via macrophage-mediated vascular bursts. Science Translational Medicine. 2017;9:225
12. Gnanadhas DP, Dash PK, Sillman B, Bade AN, Lin Z, Palandri DL. et al. Autophagy facilitates macrophage depots of sustained-release nanoformulated antiretroviral drugs. J Clin Invest. 2017;127:857-73
13. Puligujja P, Balkundi SS, Kendrick LM, Baldridge HM, Hilaire JR, Bade AN. et al. Pharmacodynamics of long-acting folic acid-receptor targeted ritonavir-boosted atazanavir nanoformulations. Biomaterials. 2015;41:141-50
14. Ma L, Liu T-W, Wallig MA, Dobrucki IT, Dobrucki LW, Nelson ER. et al. Efficient Targeting of Adipose Tissue Macrophages in Obesity with Polysaccharide Nanocarriers. ACS Nano. 2016;10:6952-62
15. Radzio J, Spreen W, Yueh YL, Mitchell J, Jenkins L, García-Lerma JG. et al. The long-acting integrase inhibitor GSK744 protects macaques from repeated intravaginal SHIV challenge. Science Translational Medicine. 2015;7:270ra5
16. Schneider EL, Henise J, Reid R, Ashley GW, Santi DV. Subcutaneously Administered Self-Cleaving Hydrogel-Octreotide Conjugates Provide Very Long-Acting Octreotide. Bioconjugate Chemistry. 2016;27:1638-44
17. Tibbitt MW, Dahlman JE, Langer R. Emerging Frontiers in Drug Delivery. Journal of the American Chemical Society. 2016;138:704-17
18. Chou S-F, Carson D, Woodrow KA. Current strategies for sustaining drug release from electrospun nanofibers. Journal of Controlled Release. 2015:220 Part B: 584-91
19. Chen W, Wang G, Yung BC, Liu G, Qian Z, Chen X. Long-Acting Release Formulation of Exendin-4 Based on Biomimetic Mineralization for Type 2 Diabetes Therapy. ACS Nano. 2017;11:5062-9
20. Mandal B, Mittal NK, Balabathula P, Thoma LA, Wood GC. Development and in vitro evaluation of core-shell type lipid-polymer hybrid nanoparticles for the delivery of erlotinib in non-small cell lung cancer. European Journal of Pharmaceutical Sciences. 2016;81:162-71
21. Kevadiya BD, Bade AN, Woldstad C, Edagwa BJ, McMillan JM, Sajja BR. et al. Development of europium doped core-shell silica cobalt ferrite functionalized nanoparticles for magnetic resonance imaging. Acta Biomaterialia. 2017;49:507-20
22. Krishnamurthy S, Vaiyapuri R, Zhang L, Chan JM. Lipid-coated polymeric nanoparticles for cancer drug delivery. Biomaterials Science. 2015;3:923-36
23. Krais A, Wortmann L, Hermanns L, Feliu N, Vahter M, Stucky S. et al. Targeted uptake of folic acid-functionalized iron oxide nanoparticles by ovarian cancer cells in the presence but not in the absence of serum. Nanomedicine: Nanotechnology, Biology and Medicine. 2014;10:1421-31
24. Thomas TP, Goonewardena SN, Majoros I, Kotlyar A, Cao Z, Leroueil PR. et al. Folate-targeted nanoparticles show efficacy in the treatment of inflammatory arthritis. Arthritis and rheumatism. 2011;63:2671-80
25. Rollett A, Reiter T, Nogueira P, Cardinale M, Loureiro A, Gomes A. et al. Folic acid-functionalized human serum albumin nanocapsules for targeted drug delivery to chronically activated macrophages. International Journal of Pharmaceutics. 2012;427:460-6
26. Low PS, Henne WA, Doorneweerd DD. Discovery and Development of Folic-Acid-Based Receptor Targeting for Imaging and Therapy of Cancer and Inflammatory Diseases. Accounts of Chemical Research. 2008;41:120-9
27. Han W, Zaynagetdinov R, Yull FE, Polosukhin VV, Gleaves LA, Tanjore H. et al. Molecular Imaging of Folate Receptor β-Positive Macrophages during Acute Lung Inflammation. American Journal of Respiratory Cell and Molecular Biology. 2015;53:50-9
28. Paulos CM, Turk MJ, Breur GJ, Low PS. Folate receptor-mediated targeting of therapeutic and imaging agents to activated macrophages in rheumatoid arthritis. Advanced Drug Delivery Reviews. 2004;56:1205-17
29. Zhao X, Li H, Lee RJ. Targeted drug delivery via folate receptors. Expert Opinion on Drug Delivery. 2008;5:309-19
30. Bastin G, Heximer SP. Rab family proteins regulate the endosomal trafficking and function of RGS4. J Biol Chem. 2013:288
31. Caillet M, Janvier K, Pelchen-Matthews A, Delcroix-Genete D, Camus G, Marsh M. Rab7A is required for efficient production of infectious HIV-1. PLoS Pathog. 2011:7
32. Park YI, Kim HM, Kim JH, Moon KC, Yoo B, Lee KT. et al. Theranostic Probe Based on Lanthanide-Doped Nanoparticles for Simultaneous In Vivo Dual-Modal Imaging and Photodynamic Therapy. Advanced Materials. 2012;24:5755-61
33. Smith BR, Gambhir SS. Nanomaterials for In Vivo Imaging. Chemical Reviews. 2017;117:901-86
34. Kaittanis C, Shaffer TM, Bolaender A, Appelbaum Z, Appelbaum J, Chiosis G. et al. Multifunctional MRI/PET Nanobeacons Derived from the in Situ Self-Assembly of Translational Polymers and Clinical Cargo through Coalescent Intermolecular Forces. Nano Letters. 2015;15:8032-43
35. Hernández-Gil J, Cobaleda-Siles M, Zabaleta A, Salassa L, Calvo J, Mareque-Rivas JC. An Iron Oxide Nanocarrier Loaded with a Pt(IV) Prodrug and Immunostimulatory dsRNA for Combining Complementary Cancer Killing Effects. Advanced Healthcare Materials. 2015;4:1034-42
36. Qiao H, Cui Z, Yang S, Ji D, Wang Y, Yang Y. et al. Targeting Osteocytes to Attenuate Early Breast Cancer Bone Metastasis by Theranostic Upconversion Nanoparticles with Responsive Plumbagin Release. ACS Nano. 2017
37. Nadeem M, Ahmad M, Akhtar MS, Shaari A, Riaz S, Naseem S. et al. Magnetic Properties of Polyvinyl Alcohol and Doxorubicine Loaded Iron Oxide Nanoparticles for Anticancer Drug Delivery Applications. PLOS ONE. 2016;11:e0158084
38. Kevadiya BD, Chettiar SS, Rajkumar S, Bajaj HC, Brahmbhatt H, Chaudhari JC. et al. Evaluation of Montmorillonite/Poly (L-Lactide) microcomposite spheres as ambidextrous reservoirs for controlled release of Capecitabine (Xeloda) and assessment of cell cytotoxic and oxidative stress markers. Composites Science and Technology. 2014;90:193-201
39. Kevadiya BD, Joshi GV, Bajaj HC. Layered bionanocomposites as carrier for procainamide. International Journal of Pharmaceutics. 2010;388:280-6
40. Zhang Z, Yao J. Preparation of Irinotecan-Loaded Folate-Targeted Liposome for Tumor Targeting Delivery and Its Antitumor Activity. AAPS PharmSciTech. 2012;13:802-10
41. Singh D, McMillan J, Hilaire J, Gautam N, Palandri D, Alnouti Y. et al. Development and characterization of a long-acting nanoformulated abacavir prodrug. Nanomedicine (Lond). 2016;11:1913-27
42. Guo D, Zhang G, Wysocki TA, Wysocki BJ, Gelbard HA, Liu X-M. et al. Endosomal Trafficking of Nanoformulated Antiretroviral Therapy Facilitates Drug Particle Carriage and HIV Clearance. Journal of Virology. 2014;88:9504-13
43. Guo D, Zhou T, Araínga M, Palandri D, Gautam N, Bronich T. et al. Creation of a Long-Acting Nanoformulated 2′,3′-Dideoxy-3′-Thiacytidine. Journal of Acquired Immune Deficiency Syndromes (1999). 2017;74:e75-e83
44. Gendelman HE, Orenstein JM, Martin MA, Ferrua C, Mitra R, Phipps T. et al. Efficient isolation and propagation of human immunodeficiency virus on recombinant colony-stimulating factor 1-treated monocytes. J Exp Med. 1988;167:1428-41
45. Nyaku AN, Kelly SG, Taiwo BO. Long-Acting Antiretrovirals: Where Are We now? Curr HIV/AIDS Rep. 2017;14:63-71
46. Rusconi S, Marcotullio S, Cingolani A. Long-acting agents for HIV infection: biological aspects, role in treatment and prevention, and patient's perspective. New Microbiol. 2017:40
47. Kirtane AR, Langer R, Traverso G. Past, Present, and Future Drug Delivery Systems for Antiretrovirals. J Pharm Sci. 2016;105:3471-82
48. Ma A, Chen DM, Chau FM, Saberi P. Improving adherence and clinical outcomes through an HIV pharmacist's interventions. AIDS Care. 2010;22:1189-94
49. Amiri S, Shokrollahi H. Magnetic and structural properties of RE doped Co-ferrite (REåNd, Eu, and Gd) nano-particles synthesized by co-precipitation. Journal of Magnetism and Magnetic Materials. 2013;345:18-23
50. Huang H-C, Chang P-Y, Chang K, Chen C-Y, Lin C-W, Chen J-H. et al. Formulation of novel lipid-coated magnetic nanoparticles as the probe for in vivo imaging. Journal of Biomedical Science. 2009;16:86
51. Paul D, Achouri S, Yoon Y-Z, Herre J, Bryant Clare E, Cicuta P. Phagocytosis Dynamics Depends on Target Shape. Biophysical Journal. 2013;105:1143-50
52. Toy R, Peiris PM, Ghaghada KB, Karathanasis E. Shaping cancer nanomedicine: The effect of particle shape on the in vivo journey of nanoparticles. Nanomedicine (London, England). 2014;9:121-34
53. Garapaty A, Champion JA. Tunable particles alter macrophage uptake based on combinatorial effects of physical properties. Bioengineering & Translational Medicine. 2017;2:92-101
54. Williams DW, Veenstra M, Gaskill PJ, Morgello S, Calderon TM, Berman JW. Monocytes mediate HIV neuropathogenesis: mechanisms that contribute to HIV associated neurocognitive disorders. Curr HIV Res. 2014;12:85-96
55. Porcheray F, Samah B, Leone C, Dereuddre-Bosquet N, Gras G. Macrophage activation and human immunodeficiency virus infection: HIV replication directs macrophages towards a pro-inflammatory phenotype while previous activation modulates macrophage susceptibility to infection and viral production. Virology. 2006;349:112-20
56. Koppensteiner H, Brack-Werner R, Schindler M. Macrophages and their relevance in Human Immunodeficiency Virus Type I infection. Retrovirology. 2012;9:82
57. Guo D, Zhou T, Arainga M, Palandri D, Gautam N, Bronich T. Creation of a long-acting nanoformulated 2′,3′-dideoxy-3′-thiacytidine. J Acquir Immune Defic Syndr. 2017:74
58. Puligujja P, McMillan J, Kendrick L, Li T, Balkundi S, Smith N. Macrophage folate receptor-targeted antiretroviral therapy facilitates drug entry, retention, antiretroviral activities and biodistribution for reduction of human immunodeficiency virus infections. Nanomedicine. 2013:9
59. Puligujja P, McMillan J, Kendrick L, Li T, Balkundi S, Smith N. et al. Macrophage folate receptor-targeted antiretroviral therapy facilitates drug entry, retention, antiretroviral activities and biodistribution for reduction of human immunodeficiency virus infections. Nanomedicine. 2013;9:1263-73
60. Graziano F, Vicenzi E, Poli G. Immuno-pharmacological targeting of virus-containing compartments in HIV-1-infected macrophages. Trends Microbiol. 2016:24
61. MacParland SA, Tsoi KM, Ouyang B, Ma XZ, Manuel J, Fawaz A. et al. Phenotype Determines Nanoparticle Uptake by Human Macrophages from Liver and Blood. ACS Nano. 2017;11:2428-43
62. Walkey CD, Olsen JB, Guo H, Emili A, Chan WC. Nanoparticle size and surface chemistry determine serum protein adsorption and macrophage uptake. J Am Chem Soc. 2012;134:2139-47
63. Lameijer MA, Tang J, Nahrendorf M, Beelen RHJ, Mulder WJM. Monocytes and macrophages as nanomedicinal targets for improved diagnosis and treatment of disease. Expert review of molecular diagnostics. 2013;13:567-80
64. Zanganeh S, Hutter G, Spitler R, Lenkov O, Mahmoudi M, Shaw A. et al. Iron oxide nanoparticles inhibit tumour growth by inducing pro-inflammatory macrophage polarization in tumour tissues. Nat Nano. 2016;11:986-94
65. Patel NR, Piroyan A, Nack AH, Galati CA, McHugh M, Orosz S. et al. Design, Synthesis, and Characterization of Folate-Targeted Platinum-Loaded Theranostic Nanoemulsions for Therapy and Imaging of Ovarian Cancer. Molecular Pharmaceutics. 2016;13:1996-2009
66. Sengupta S, Eavarone D, Capila I, Zhao G, Watson N, Kiziltepe T. et al. Temporal targeting of tumour cells and neovasculature with a nanoscale delivery system. Nature. 2005;436:568-72
67. Kalter DC, Gendelman HE, Meltzer MS. Inhibition of human immunodeficiency virus infection in monocytes by monoclonal antibodies against leukocyte adhesion molecules. Immunol Lett. 1991;30:219-27
68. Bain AD, Kumar Anand C, Nie Z. Exact solution of the CPMG pulse sequence with phase variation down the echo train: Application to R2 measurements. Journal of Magnetic Resonance. 2011;209:183-94
Author contact
![]() Corresponding author: Howard E. Gendelman, M.D., Department of Pharmacology and Experimental Neuroscience, University of Nebraska Medical Center, Omaha, NE 68198; phone 402 559 8920; FAX: 402 559 3744; Email: hegendeledu
Corresponding author: Howard E. Gendelman, M.D., Department of Pharmacology and Experimental Neuroscience, University of Nebraska Medical Center, Omaha, NE 68198; phone 402 559 8920; FAX: 402 559 3744; Email: hegendeledu