Impact Factor
- Issue 14; 2026
- Issue 13; 2026
- Issue 12; 2026
- Issue 11; 2026
- Issue 10; 2026
- Volume 16; 2026
- Advance Articles
- Past Issues
- Cover Images
- Cover Suggestion
- Index & Coverage
- Special Issues
Introduction and Background
Methods
Results
Discussion
Conclusions
Abbreviations
Acknowledgements
References
International Journal of Biological Sciences
International Journal of Medical Sciences
 Global reach, higher impact

Theranostics 2018; 8(1):141-155. doi:10.7150/thno.19658 This issue Cite
Research Paper
Ultrasound Molecular Imaging of VEGFR-2 in Clear-Cell Renal Cell Carcinoma Tracks Disease Response to Antiangiogenic and Notch-Inhibition Therapy
Juan D. Rojas1, Fanglue Lin1, Yun-Chen Chiang2, Anna Chytil3, Diana C. Chong4, Victoria L. Bautch2,4,5, W. Kimryn Rathmell3, Paul A. Dayton1,2 ![]()
1. Joint Department of Biomedical Engineering, The University of North Carolina and North Carolina State University, Chapel Hill, North Carolina;
2. Lineberger Comprehensive Cancer Center, The University of North Carolina, Chapel Hill, North Carolina;
3. Department of Medicine, Division of Hematology and Oncology, Vanderbilt University Medical Center, Nashville, Tennessee;
4. Curriculum in Genetics and Molecular Biology, The University of North Carolina, Chapel Hill, North Carolina;
5. Department of Biology, The University of North Carolina, Chapel Hill, North Carolina.
Received 2017-2-14; Accepted 2017-9-14; Published 2018-1-1
Abstract

Metastatic clear-cell renal cell carcinoma (ccRCC) affects thousands of patients worldwide each year. Antiangiogenic therapy has been shown to have beneficial effects initially, but resistance is eventually developed. Therefore, it is important to accurately track the response of cancer to different therapeutics in order to appropriately adjust the therapy to maximize efficacy. Change in tumor volume is the current gold standard for determining efficacy of treatment. However, functional variations can occur much earlier than measurable volume changes. Contrast-enhanced ultrasound (CEUS) is an important tool for assessing tumor progression and response to therapy, since it can monitor functional changes in the physiology. In this study, we demonstrate how ultrasound molecular imaging (USMI) can accurately track the evolution of the disease and molecular response to treatment.
Methods A cohort of NSG (NOD/scid/gamma) mice was injected with ccRCC cells and treated with either the VEGF inhibitor SU (Sunitinib malate, Selleckchem, TX, USA) or the Notch pathway inhibitor GSI (Gamma secretase inhibitor, PF-03084014, Pfizer, New York, NY, USA), or started on SU and later switched to GSI (Switch group). The therapies used in the study focus on disrupting angiogenesis and proper vessel development. SU inhibits signaling of vascular endothelial growth factor (VEGF), which is responsible for the sprouting of new vasculature, and GSI inhibits the Notch pathway, which is a key factor in the correct maturation of newly formed vasculature. Microbubble contrast agents targeted to VEGFR-2 (VEGF Receptor) were delivered as a bolus, and the bound agents were imaged in 3D after the free-flowing contrast was cleared from the body. Additionally, the tumors were harvested at the end of the study and stained for CD31.
Results The results show that MI can detect changes in VEGFR-2 expression in the group treated with SU within a week of the start of treatment, while differences in volume only become apparent after the mice have been treated for three weeks. Furthermore, USMI can detect response to therapy in 92% of cases after 1 week of treatment, while the detection rate is only 40% for volume measurements. The amount of targeting for the GSI and Control groups was high throughout the duration of the study, while that of the SU and Switch groups remained low. However, the amount of targeting in the Switch group increased to levels similar to those of the Control group after the treatment was switched to GSI. CD31 staining indicates significantly lower levels of patent vasculature for the SU group compared to the Control and GSI groups. Therefore, the results parallel the expected physiological changes in the tumor, since GSI promotes angiogenesis through the VEGF pathway, while SU inhibits it.
Conclusion This study demonstrates that MI can track disease progression and assess functional changes in tumors before changes in volume are apparent, and thus, CEUS can be a valuable tool for assessing response to therapy in disease. Future work is required to determine whether levels of VEGFR-2 targeting correlate with eventual survival outcomes.
Keywords: Contrast-Enhanced Ultrasound, Ultrasound Molecular Imaging, Response to Therapy, Notch Inhibition, Antiangiogenic Therapy.
Introduction and Background
Metastatic clear-cell renal cell carcinoma (ccRCC) results in over 14,000 deaths annually in the US, and over 60,000 new cases are expected to be diagnosed this year [1]. This type of cancer is characterized by increased angiogenesis due to gene mutations in the von Hippel-Lindau gene (VHL), which upregulates various pro-angiogenic factors [2,3]. The most common type of treatment involves anti-angiogenic therapeutics such as Sunitinib, a small molecule multi-kinase inhibitor that reduces signaling of different pathways, such as the vascular endothelial growth factor (VEGF) and its receptor (VEGFR-2) by down-regulating VEGFR-2 [4-8]. However, resistance to anti-angiogenic therapy develops almost universally after several months of treatment [9-11].
Response to therapy is typically evaluated using tumor size measurements and the response evaluation criteria in solid tumors (RECIST) [12]. However, functional and molecular changes can occur before significant change in tumor size. Therefore, it is important to accurately track the state of the disease and treatment response to better diagnose recurrence and tailor therapy. Studies have been conducted using dynamic contrast-enhanced imaging and molecular imaging (MI) with MRI, PET, and CT, and the results indicate that imaging can more accurately track disease response to therapy than RECIST [13-16]. However, due to the high cost and long imaging period of MRI and the radiation dose of PET and CT, these modalities are used sparingly and are not ideal for serial disease and therapy monitoring. Furthermore, lack of portability provides an additional challenge, while ultrasound can be used with bedside support. To limit exposure and to optimally capture the response to treatment, imaging is usually limited to once every several weeks or months [17]. However, more frequent monitoring is desirable for precise tracking of disease state and response to therapy.
In comparison, contrast-enhanced ultrasound (CEUS) imaging is an inexpensive and widely available technique, which uses contrast agents that are safe for patients and have been used for molecular and perfusion imaging of disease [18-21]. Therefore, CEUS has the potential to be a powerful tool for serial monitoring of disease and assessment of early response to therapy. Conventional microbubble contrast agents are typically composed of a perfluorocarbon core and a lipid shell and are able to freely traverse the vasculature due to their small size (1-5 µm), with clearance by the liver and lungs in a matter of minutes. The gas core is compressible and provides excellent ultrasound contrast as a result of the density mismatch from the surrounding blood and tissue. Microbubbles that are interrogated with ultrasound emit acoustic signals that can be separated from those of normal tissue due to nonlinear bubble behavior, and used to produce high-contrast images of vasculature [22-24]. CEUS can measure tissue characteristics such as blood perfusion [25-27] for cardiology [28,29], evaluation and treatment of ischemic stroke [30-32], and cancer assessment and management [33,34] in animal models of disease. Furthermore, by adding targeting ligands such as antibodies or peptides, to the shell, ultrasound molecular imaging (USMI) can be performed [35]. This approach has been evaluated to assess expression of different molecular biomarkers associated with cardiovascular disease [36-38], inflammatory disorders [39,40], and angiogenesis [41-43]. Typically, biomarkers expressed on the vascular endothelium such as αvβ3 integrin and VEGFR-2 are targeted [41,44-47] because available markers are partially limited by the confinement of the microbubbles to the microvasculature due to their size. In recent years, several studies have demonstrated the ability of USMI to monitor disease response to anti-angiogenic therapy [48-53]. Furthermore, a few studies have demonstrated that USMI can predict response to therapy in different tumor models; Streeter et al. found that USMI is capable of differentiating between patient-derived xenografts that respond to aurora-A kinase inhibition and non-responders earlier than tumor volume as an indicator [54], and Sirsi et al. and Wang et al. demonstrated that USMI targeting VEGFR-2 can predict tumor response to anti-angiogenic therapy before there are measurable changes in tumor volume [55,56]. However, to our knowledge, all previous work has used group statistics to show the effectiveness of USMI to track disease progression, and while measuring differences in response to therapy between populations can provide valuable information for the overall treatment of disease, tracking and predicting response in individuals is more relevant for clinical translation. Here, we demonstrate that USMI can detect response to different therapies before tumor volume between different treatment groups, as well as for individual responses.
An alternative to anti-VEGF therapy which targets VEGF receptors for the treatment of ccRCC is the inhibition of the Notch signaling pathway, which plays a key role in the proper development of new vasculature. Notch signaling promotes vessel growth while suppressing excessive sprouting by down-regulating VEGF receptor on the endothelial cells of the growing stalk [57-59]. Endothelial tip cells induce adjacent stalk cells to pattern new vessels [58-60]. Binding between Notch ligands such as Dll4 (Delta-like ligand 4) on tip cells and Notch receptors on stalk cells regulates the specialization of endothelial cells and limits sprout numbers [58,59]. This signaling pathway can be inhibited using gamma secretase inhibitors, which inhibit the activation of Notch via cleavage induced by ligand binding. Therefore, inhibiting Notch signaling yields a disproportionate number of tip cells, resulting in excessive sprouting and immature vasculature, which has been shown to inhibit tumor growth, likely due to inefficient perfusion [58,61-64]. Furthermore, the increased availability of VEGF receptors might cause ccRCC undergoing Notch inhibition to re-sensitize to the effects of VEGF receptor targeting. This proposed interaction has the potential to be a mechanism for overcoming resistance to conventional antiangiogenic therapy in ways that may be challenging to monitor with conventional imaging.
In this work, the theranostic ability of ultrasound molecular imaging (USMI) to track the response of subcutaneous ccRCC tumors to two kinds of therapy is explored. Mice were treated with an anti-angiogenic VEGF receptor targeting and an inhibitor of Notch pathway activation. The results demonstrate that USMI can detect differences in treatment response to the different modes of vascular inhibition after one week of treatment, while tumor size of the treated mice does not become significant from that of the controls until 3 three weeks after the start of treatment. This result implies that USMI can be used to detect response to therapy earlier than tumor volume measurements alone, providing a low-cost bedside tool for routine treatment efficacy assessment and personalized medicine.
Methods
Microbubble Contrast Agents
The contrast agents used for the study were VEGFR-2 targeted perfluorocarbon microbubbles (Visistar VEFGR2, Targeson, San Diego, CA, USA) with a mean diameter of 2.23±0.02 μm. Competitive binding experiments show that Targeson VEGFR-2 bubbles produce significantly higher retention in tumors than similar control bubbles bearing isotype-matched antibodies [41], inactivated antibodies [65], or naked microbubbles without targeting antibodies [66].
Xenograft and Treatment Protocol
NSG (NOD/scid/gamma) female mice (Mus musculus) were injected subcutaneously in the flank with 8x10⁹ 786-O human renal cell adenocarcinoma cells, which were obtained from Dr. William Kim at the University of North Carolina [67]. A total of 32 mice were placed into 4 treatment groups: Notch pathway inhibitor GSI (Gamma secretase inhibitor, PF-03084014, Pfizer, New York, NY, USA), VEGF inhibitor SU (Sunitinib malate, Selleckchem, TX, USA), a Switch group (SU to GSI), and Control (100 µL of saline). The mice were administered a daily dose of SU (50 mg/kg) or GSI (90 mg/kg) by oral gavage. Treatment started when the tumors reached 200 mm3 (caliper measurement) and continued for 5 weeks. In the case of the Switch group, the mice were treated with SU for 3 weeks before switching to GSI.
Animal Protocol and Contrast Administration
All imaging was performed using methods approved by the UNC Institutional Animal Care and Use Committee. An initial pre-treatment scan was acquired when the tumors reached 150 mm3, and the mice were imaged once per week until the end of treatment or until the tumor exceeded 2 cm (long axis), at which time they were euthanized in accordance with guidelines of the UNC Institutional Animal Care and Use Committee requirement. During each imaging session, the mice were anesthetized with 1.5% isoflurane and body temperature (37˚C) was maintained using a heated imaging platform. The area of imaging was cleared of fur using an electric razor and further depilated using a chemical hair remover, and the tissue was coupled to the imaging transducer using water-based ultrasound gel. A 27G catheter was inserted into the tail-vein for the introduction of the Targeson bubbles. A bolus of 2x10⁶ microbubbles diluted in 100 µL of sterile saline was injected, followed by a 100 µL saline flush to clear the catheter and ensure the entire dose was delivered. An Accusizer 780 A (Particle Sizing Systems, Santa Barbara, CA, USA) was used to size the bubbles before every imaging session to ensure a precise dose was injected for all experiments.
Imaging Protocol
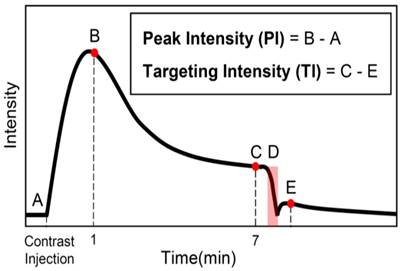
All imaging was performed using an Acuson Sequoia 512 (Mountain View, CA, USA) driving a 15L8 linear array transducer. The imaging protocol utilized was a standard protocol for ultrasound molecular imaging, as previously described [41], and is summarized in Figure 1. A b-mode scan (14 MHz, 0.63 Mechanical Index) was obtained before the introduction of contrast agents for anatomical reference using the system's compounding mode. Next, a contrast baseline scan was acquired using cadence pulse sequencing (CPS), the imaging system's contrast-specific imaging mode. Contrast imaging parameters were: 7 MHz, -7 dB gain, and a Mechanical Index of 0.18, and were found to be non-destructive in preliminary work. A scan to capture the peak contrast enhancement was obtained 1 min after injection, and the bubbles were allowed to circulate for 7 min in order to allow for most of the freely-flowing contrast to be cleared from circulation. Preliminary studies showed that most of the free-flowing contrast was cleared from circulation by 7 min. Next, a second contrast imaging scan was captured, followed by a destructive b-mode scan (14 MHz, 1.9 Mechanical Index) in which the transducer was quickly swept over the tumor volume to remove bound bubbles. Lastly, the level of freely-circulating contrast was measured with a final contrast imaging scan 1 min after the destructive scan. All the imaging scans were captured in 3D by sweeping the transducer in the elevational direction over the tissue, as previously reported [27,68], using a step-size of 400 μm, and capturing a single contrast frame at each step.
Summary of imaging protocol. A baseline contrast scan was captured prior to the microbubble injection (A). A scan to capture the maximum peak intensity was taken 1 min after the introduction of contrast (B). The bubbles were allowed to circulate and bind for 7 min, at which time a contrast scan was taken (C). Destructive pulses clear the tumor of both bound and freely-flowing bubbles (D), and the level of freely-flowing contrast was obtained 1 min after destruction to allow bubbles to reperfuse the tissue (E). Note: data was only collected at B, C, and E and the solid black line is only an estimate of the intensity over time.
Data Analysis
The scans were saved as JPEG-compressed DICOM files and were taken from the scanner for analysis. All analysis was performed using custom Matlab scripts (The MathWorks, Inc., Natick, MA, USA). The volumetric b-mode scan was used to define a 3D region of interest (ROI) encompassing the entire tumor volume, and the mean intensity was calculated for each of the 3 CPS scans by averaging the intensity value of all the pixels inside the ROI. Furthermore, the number of pixels inside the ROI was used, in addition to the step size, to calculate the volume of the tumors. The targeting intensity (TI), a quantitative measure of the level of biomarker expression as indicated by the retention of targeted contrast in the sample volume, was calculated by subtracting the mean intensity of the post-destruction CPS scan (Figure 1E) from the contrast scan that was taken 7 min after injection (Figure 1C). Peak intensity (PI) was calculated by subtracting the intensity of the contrast baseline scan from that of the 1 min scan. This time point was chosen based on preliminary results, which show that microbubbles have perfused the entire tissue after 1 min, and the intensity in this scan is close to the maximum enhancement for the tumor model being used in this study and treated with the same therapies. Aside from finding the peak intensity, the PI scan was also used to find regions that did not become perfused within 1 min after injection. Based on the blood volume, cardiac output, and cardiac frequency in mice, microbubbles spread throughout the body and circulate the vasculature several times in one minute and therefore, anechoic regions that have not been perfused by that time do not have patent vasculature and should be excluded from analysis. Since our intent is to compare biomarker presence within the vasculature, inclusion of regions without perfusion would bias this result.
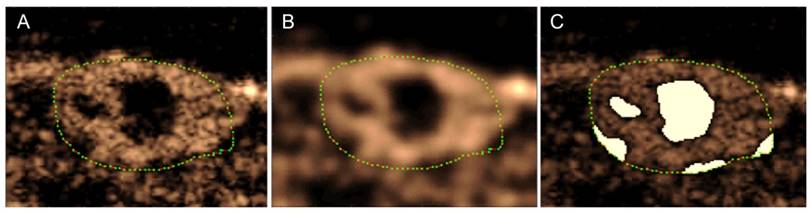
Anechoic regions appear dark in the contrast images, but due to the nature of speckle, an area that is completely perfused will also contain small dark regions. Eliminating pixels that have intensities lower than a certain threshold would thus eliminate regions that are perfused in addition to regions that are anechoic. Therefore, the images were blurred using a Gaussian filter in order to eliminate small dark regions in areas that are full of contrast, in essence eliminating the speckle (Figure 2). Next, the regions of the image that were inside the analysis ROI and had an intensity lower than a predefined threshold were removed from the analysis region for the calculation of all metrics. The threshold was defined using preliminary data, and the same value was used for all animals at every time point. Furthermore, the different treatments affect functional characteristics of the tumor, such as perfusion, so the volume of the anechoic areas was used to calculate a “Percent Anechoic” (PA) metric to assess the response of the disease to the treatment over time. This metric is related to the amount of patent vasculature in the tumor volume, or lack thereof, due to necrosis or other factors.
Method for obtaining anechoic regions in a peak intensity image (A). The green dots outline the tumor. The image is blurred using a Gaussian filter to eliminate dark areas in speckle (B). The regions below a predetermined intensity threshold are selected as anechoic (C). Note: these are single frames in a 3D volume, so the process will be performed for each slice in the volume.
CD31 Immunohistochemistry
CD31 immunohistochemistry was performed to serve as a gold standard for comparison against imaging results. Tumors were harvested after the last imaging time point or earlier if the size limit was exceeded, or due to poor health. Immunohistochemistry was performed on paraffin-embedded tumor sections on a Leica Bond Max autostainer using anti-CD31 from Novocastra (cat # NCL-CD31-1A10). Following heat-induced epitope retrieval in EDTA for 20 min, the antibody was incubated on the tissue for 1 h at a dilution of 1:100 then visualized with diaminobenzidine (DAB). Thirty stained sections from each treatment group were captured by an Olympus DP 72 or an Infinity2 camera at 200x, and the percentage of positively stained area (SA) was determined using NIH ImageJ. A separate cohort of animals was treated with SU and their tumors were harvested after 3 weeks of treatment to obtain a pre-switch measurement of patent vasculature.
Statistical Analysis
Kruskal-Wallis analysis was performed for each time point and metric (TI, PI, PA, volume) in order to determine if there was a significant difference between any of the groups, and a Tukey range test was used to find significance between each of the groups. Statistical analysis was performed on all mice available at each time point, regardless of whether the animal survived through the end of the study. ANOVA analysis was used to find any significance between the groups for histology instead of the Kruskal-Wallis method.
Individual Responses
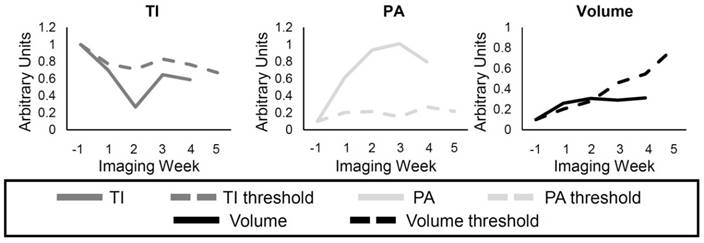
The response of individual mice to the treatments was compared to the group TI, PA, and volume of the Control mice (Figure 3). A threshold was found for each of the metrics so that any values above (or below) the threshold for individual mice at the different time points represented response to the treatment. For example, the individual volume (solid black line) in Figure 3 becomes smaller than the volume threshold (dashed black line) 3 weeks after the start of treatment, so it can be said that response was detected in the tumor volume at this time. The threshold value at each time point was calculated as the first quadrant of the grouped Control data at each time point for the TI and volume and the third quadrant for the PA. Finally, the percentage of mice in the SU and Switch groups that showed response to the therapy using each metric was calculated for the first 3 weeks of treatment.
Example of individual response to the treatment. The solid lines represent either the TI (dark gray), PA (light gray), and the volume (black) for a single animal, while the dashed lines represent the threshold for each metric calculated using the Control group data. Each metric was determined to show resistance if the individual value (solid) was lower, for the TI and Volume, or higher, for the PA, than its threshold (dashed). The data for each metric were normalized to the pretreatment value, and by an additional factor in order to display the curves in the same scale.
Results
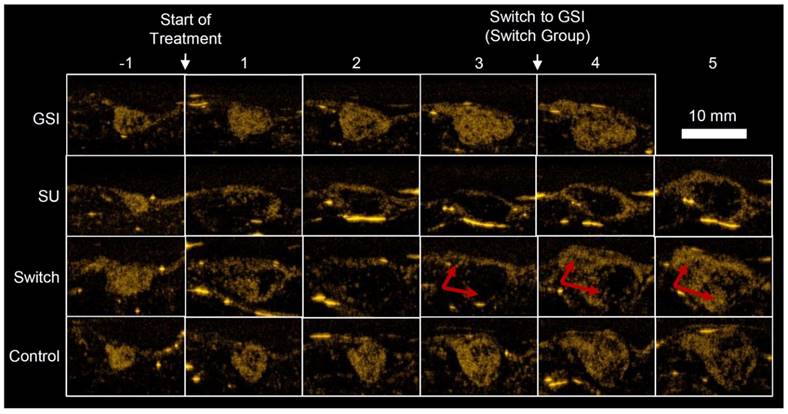
Example US images, taken 7 min after injection (Figure 1C), of a single mouse for each group are shown in Figure 4. The Control and GSI mice looked very similar throughout the study, but the effect of SU was apparent; for both the SU and Switch mice, the ultrasound intensity decreased after treatment, and the tumors became increasingly anechoic, suggesting necrosis. However, the size of the anechoic region decreased and the intensity increased immediately after the switch to GSI for the Switch group. Many mice in the GSI and Switch groups were euthanized before the fifth imaging session after treatment due to tumor size, and some of the SU-treated mice were euthanized prior to the end of the experiment due to morbidity. This left 1, 5, 3, and 5 mice in the GSI, SU, Switch, and Control groups, respectively, for the final time point. The data for the remaining mouse in the GSI group is not shown. The same mice were imaged for the duration of the study, and each group contained at least 6 mice at each time point. Results were not obtained for all the mice at each of the time points due to a technical problem saving the data on the Sequoia or due to lack of patent tail vein access on some animals late in the study. A detailed account of the results, statistical analysis, and the number of mice in each group and each time point can be found in Tables 1, 2, and 3.
Example US images of different treatment groups taken 7 min after injection (Figure. 1C). GSI and Control groups remained similar throughout the study. TI for the SU and Switch groups decreased after the start of treatment, and the tumors became more anechoic. PA and TI increased for the Switch group after the treatment was changed to GSI, indicated by the red arrows. The strong reflections in the images are artifacts and were excluded from the analysis.
Medians and Interquartile Ranges (IQR) for Targeting Intensity (TI), Peak Intensity (PI), Percent Anechoic (PA), and volume for each imaging week.
| Imaging Week | |||||||||||||
|---|---|---|---|---|---|---|---|---|---|---|---|---|---|
| -1 | 1 | 2 | 3 | 4 | 5 | ||||||||
| Med | IQR | Med | IQR | Med | IQR | Med | IQR | Med | IQR | Med | IQR | ||
| TI | GSI | 19.9 | 5.0 | 20.6 | 2.8 | 19.2 | 3.0 | 18.6 | 8.7 | 17.2 | 3.1 | 17.5 | 0.0 |
| SU | 18.0 | 1.9 | 11.2 | 3.5 | 5.2 | 3.7 | 6.1 | 1.7 | 9.9 | 1.9 | 12.4 | 1.8 | |
| Switch | 18.2 | 4.2 | 10.0 | 3.3 | 8.4 | 3.1 | 7.0 | 2.7 | 17.5 | 1.6 | 19.2 | 0.1 | |
| Control | 22.7 | 5.3 | 17.2 | 2.0 | 17.8 | 5.6 | 19.9 | 3.3 | 18.0 | 2.4 | 15.1 | 1.9 | |
| PI | GSI | 29.5 | 7.3 | 31.5 | 6.5 | 28.3 | 2.9 | 30.4 | 7.0 | 27.6 | 3.9 | 27.2 | 0.0 |
| SU | 28.2 | 2.4 | 27.1 | 2.9 | 24.3 | 2.1 | 24.0 | 1.8 | 26.1 | 1.3 | 26.6 | 0.3 | |
| Switch | 31.8 | 4.9 | 25.6 | 2.8 | 24.4 | 2.5 | 24.2 | 2.8 | 27.6 | 2.7 | 30.1 | 1.4 | |
| Control | 32.9 | 4.7 | 26.2 | 6.0 | 28.4 | 5.3 | 30.4 | 3.3 | 28.3 | 6.0 | 27.2 | 1.2 | |
| PA | GSI | 8.3 | 6.4 | 8.9 | 9.3 | 13.0 | 9.0 | 14.6 | 19.3 | 27.8 | 21.5 | 26.6 | 0.0 |
| SU | 7.9 | 4.1 | 32.7 | 12.8 | 59.9 | 12.0 | 66.9 | 4.2 | 57.2 | 6.4 | 49.7 | 3.5 | |
| Switch | 5.3 | 5.6 | 32.5 | 20.3 | 60.3 | 18.8 | 66.0 | 18.8 | 37.2 | 6.3 | 31.2 | 8.2 | |
| Control | 6.9 | 8.8 | 13.5 | 15.3 | 21.6 | 11.6 | 17.2 | 6.0 | 24.7 | 17.4 | 23.7 | 2.9 | |
| Vol. (mm3) | GSI | 241.9 | 94.5 | 483.4 | 133.6 | 719.8 | 283.0 | 951.1 | 249.3 | 1166.2 | 275.7 | 1391.6 | 0.0 |
| SU | 191.1 | 76.8 | 446.8 | 170.6 | 421.4 | 175.1 | 416.9 | 238.4 | 490.8 | 160.9 | 562.6 | 82.2 | |
| Switch | 221.0 | 69.3 | 361.5 | 155.2 | 495.1 | 109.6 | 543.9 | 216.0 | 966.5 | 164.9 | 1040.8 | 218.8 | |
| Control | 167.5 | 52.1 | 381.6 | 107.1 | 589.1 | 240.6 | 720.9 | 137.9 | 861.9 | 228.6 | 1248.5 | 320.2 | |
Targeting Intensity
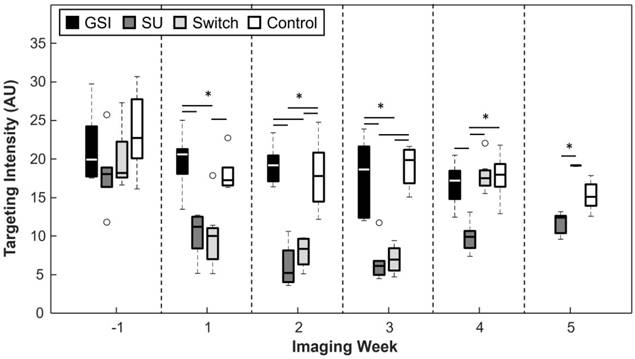
A significant difference in targeting intensity (TI), a measure of VEGFR-2 expression, can be seen 2 weeks following the start of treatment (Figure 5). TI for SU became, and remained, significantly lower than that of the Control group after the first week (p < 0.05 for all time points after the first week of treatment), while the TI of the GSI group remained non-significant from the Control group for the duration of the experiment. TI for the Switch group mimicked that of the SU group for the first 3 weeks after the start of treatment, but it increased after the switch to GSI and became non-significant from the GSI and Control groups 1 week after the switch. It is important to note that when the SU and Switch groups are combined, the TI was significant (p < 0.05) from that of the Control group 1 week after the start of treatment. Additionally, a subset of the SU and Switch groups was imaged 2 days after the start of treatment and there was a significant difference (p < 0.05) in the TI between this early time point and the baseline scan. USMI was able to closely track changes of VEGFR-2 expression as the result of the two types of therapy.
TI for the GSI and Control groups remained high throughout the study, while it remained low for the SU and Switch groups. However, TI increased in the Switch group after the change to GSI. Asterisks represent significance (p < 0.05), and the x axis represents the imaging week, where imaging week '-1' is the week before the start of the treatment.
P-values between all treatment groups. Targeting Intensity (TI), Peak Intensity (PI), Percent Anechoic (PA), volume.
| Imaging Week | |||||||
|---|---|---|---|---|---|---|---|
| -1 | 1 | 2 | 3 | 4 | 5 | ||
| TI | GSI-Control | 0.935 | 0.887 | 0.993 | 0.804 | 0.915 | |
| SU-Control | 0.333 | 0.079 | 0.002 | < 0.001 | 0.006 | 0.148 | |
| Switch-Control | 0.721 | 0.041 | 0.031 | 0.004 | 1.000 | 0.302 | |
| SU-GSI | 0.663 | 0.005 | < 0.001 | 0.015 | 0.050 | ||
| Switch-GSI | 0.968 | 0.002 | 0.013 | 0.048 | 0.933 | ||
| Switch-SU | 0.887 | 0.997 | 0.829 | 0.961 | 0.007 | 0.006 | |
| PI | GSI-Control | 0.998 | 0.136 | 1.000 | 0.999 | 0.997 | |
| SU-Control | 0.603 | 0.988 | 0.093 | 0.032 | 0.719 | 0.542 | |
| Switch-Control | 0.960 | 0.986 | 0.200 | 0.055 | 0.995 | 0.280 | |
| SU-GSI | 0.632 | 0.226 | 0.093 | 0.017 | 0.843 | ||
| Switch-GSI | 0.984 | 0.035 | 0.200 | 0.030 | 1.000 | ||
| Switch-SU | 0.817 | 0.895 | 0.983 | 0.992 | 0.838 | 0.039 | |
| PA | GSI-Control | 0.997 | 0.542 | 0.979 | 1.000 | 1.000 | |
| SU-Control | 0.984 | 0.424 | 0.022 | 0.008 | 0.002 | 0.177 | |
| Switch-Control | 0.988 | 0.215 | 0.008 | 0.007 | 0.338 | 0.978 | |
| SU-GSI | 0.920 | 0.013 | 0.006 | 0.004 | 0.003 | ||
| Switch-GSI | 0.999 | 0.002 | 0.002 | 0.004 | 0.362 | ||
| Switch-SU | 0.860 | 0.982 | 0.986 | 1.000 | 0.171 | 0.185 | |
| Volume | GSI-Control | 0.188 | 0.031 | 0.340 | 0.309 | 0.107 | |
| SU-Control | 0.951 | 0.694 | 0.535 | 0.066 | 0.069 | 0.008 | |
| Switch-Control | 0.307 | 0.800 | 0.939 | 0.399 | 0.963 | 0.676 | |
| SU-GSI | 0.458 | 0.368 | 0.012 | < 0.001 | < 0.001 | ||
| Switch-GSI | 99.338 | 0.227 | 0.098 | 0.004 | 0.276 | ||
| Switch-SU | 0.627 | 0.996 | 0.857 | 0.763 | 0.019 | 0.184 | |
Peak Intensity
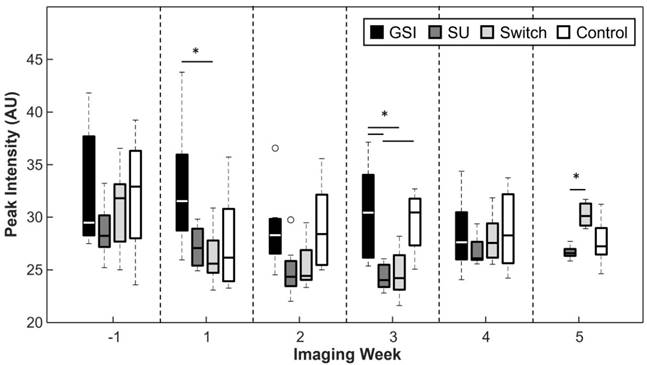
The peak intensity signal (PI), captured 1 min after the injection of contrast, was reduced for the SU and Switch groups in comparison to the Control and GSI groups, but the results were only statistically significant (p < 0.05) 3 weeks after the start of treatment (Figure 6). The Switch group PI became significant from that of the SU group 5 weeks after the start of treatment. The PI did not provide any significant trends or differences between groups that indicate the ability to track response to therapy.
Peak intensity was typically lower for the groups treated with SU but this relationship was only significant 3 weeks after the start of treatment. PI increased for the Switch group once the mice were treated with GSI and became significant from SU 2 weeks after the switch.
Percent Anechoic
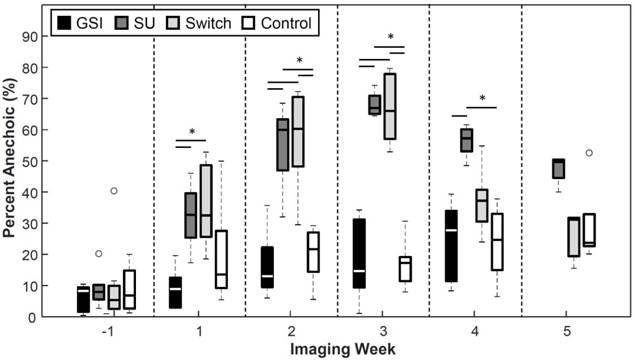
The groups that were treated with SU showed increased percentages of anechoic regions (PA) as the treatment progressed (Figure 7). The SU and Switch group became significantly higher (p < 0.05) than the Control 2 weeks after the start of treatment and 1 week after the start of treatment compared to the GSI group. The SU group remained significantly higher than the Control and GSI groups for the remainder of the study, except on the last time point, while the Switch group decreased after the switch to GSI and became non-significant from the Control and GSI groups and significant from the SU group (p < 0.05) the week following the switch. The PA for the GSI and Control groups steadily rose throughout the study but remained smaller and non-significant from the SU group. PA provided a useful measure of how the therapy was affecting the amount of patent microvasculature in the tumor throughout the treatment, and the results agreed with the reported effect of the drugs.
Percent Anechoic metric. Groups treated with SU displayed increased percentages of anechoic regions. The Switch group returned to levels similar to those of the Control group after the switch to GSI. The size of anechoic regions remained low for the GSI and Control groups.
Number of animals in each treatment group at each time point.
| Imaging Week | ||||||
|---|---|---|---|---|---|---|
| -1 | 1 | 2 | 3 | 4 | 5 | |
| GSI | 6 | 8 | 7 | 8 | 7 | 1 |
| SU | 6 | 7 | 8 | 7 | 6 | 5 |
| Switch | 7 | 8 | 8 | 8 | 8 | 3 |
| Control | 6 | 6 | 7 | 7 | 8 | 5 |
Tumor Volume
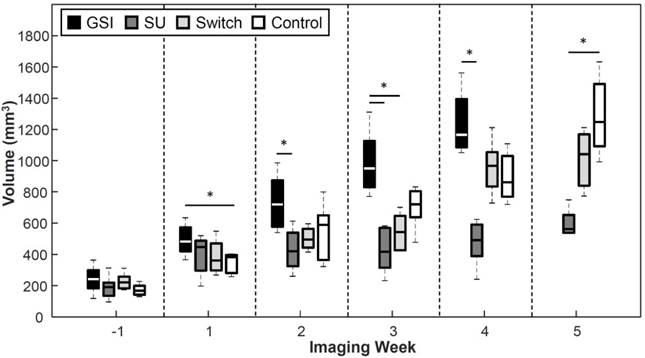
GSI enhanced tumor growth (p < 0.05) 1 week after the start of treatment and was significantly higher than the Control throughout the study except 2 weeks after the start of treatment (Figure 8). The groups treated with SU displayed reduced tumor growth throughout the study. The SU group became statistically lower (p < 0.05) than the GSI and Control groups 2 and 5 weeks after the start of treatment, respectively. The volume for the Switch group was similar to that of SU initally, but the change to GSI produced an enhancement in the tumor growth, as was the case with the GSI group, so that the tumor volume grew to be significant from the SU group (p < 0.05) one week after the switch. The change in volume eventually demonstrated a response to SU, but it was much later than USMI results.
A reduction in tumor growth was displayed by the groups treated with SU, while an enhancement in tumor growth was observed for the GSI treatment group but was only significant at the 1-week point. The volume for the SU group became significant from GSI 2 weeks after the start of treatment, and after 5 weeks from the controls. The p-value between the SU and Control groups on week 4 was 0.069.
CD31 Immunohistochemistry
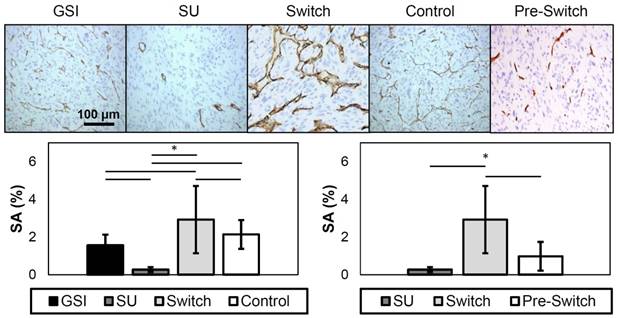
Immunohistochemistry was performed to examine the amount of patent vasculature, and, consequently, the amount of vasculature expressing VEGFR-2 in the tissues of treated xenograft tumors collected at the end of the study. Representative images of the different groups are shown in Figure 9. The stained area (SA) was calculated, and the results show that the SU group had a value that is significantly lower, while the Switch group was significantly higher, from all other groups. The GSI and Control groups were not significantly different in this model. Furthermore, the Pre-Switch group was significant from the Switch group. Overall, these findings corresponded closely with the in vivo assessments using ultrasound imaging.
Representative images of CD31 immunohistochemistry (top). The dark brown stains represent expression of CD31 in endothelial cells. SA results from CD31 staining (bottom). The plot on the left displays the SA of the different treatment groups, while the plot on the right only shows the SU, Switch, and the Pre-Switch cohorts. The SU group has significantly lower values from the other groups, while the Switch group showed significantly higher levels of patent vasculature. The Pre-Switch cohort is significant from the Switch group.
Individual Responses
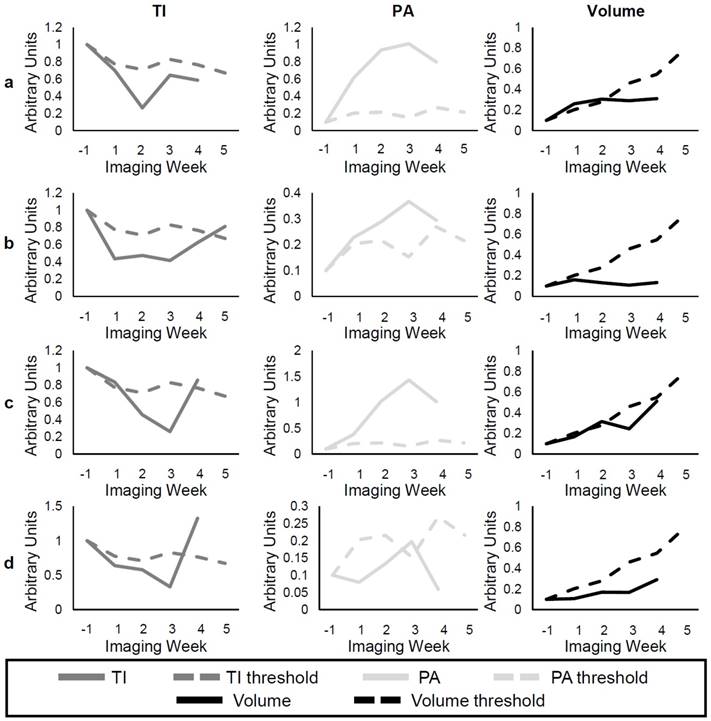
Figure 10a-b shows examples of individual responses in the SU group for the TI, PA, and volume metrics, and Figure 10c-d gives examples of the Switch group. Analysis of individual responses shows that there were cases in both the SU and Switch groups in which the tumor volume showed response to the treatment at the same time as the other metrics. In both b and d, the individual volume value is smaller than the volume threshold 1 week after the start of treatment. However, the percentage of mice that showed response for each of the metrics over the first 3 weeks of treatment was calculated (Table 4), and the TI, PA, and volume detected response in 92.3%, 76.9%, and 40.0%, respectively, of the mice after the first week of treatment. These percentages increased to 100%, 92.3%, and 56.25% for the second week and to 100%, 100%, and 93% for the third week. Interestingly, volume was very sensitive to the change of treatment in the Switch group, and all tumors grew at a faster rate than that of the SU group after week 3 (Figure 10c-d). However, the change in TI and PA after the switch was much more abrupt, especially for TI, where 85% of individual values became larger than the threshold after the switch. The results demonstrate TI and PA were able to detect response to therapy earlier than tumor volume in individual cases.
Examples of individual responses of SU (rows a and b) and Switch (rows c and d). The solid lines represent the individual values of TI (dark gray), PA (light gray), and volume (black) at each time point, while the dashed lines represent the group threshold for each metric, which was obtained from the Control data.
Percentage of cases where response to therapy was detected using Targeting Intensity (TI), Percent Anechoic (PA), and tumor volume over the first 3 weeks of treatment.
| Imaging Week | |||
|---|---|---|---|
| 1 | 2 | 3 | |
| TI | 92.3 | 100 | 100 |
| PA | 76.9 | 92.3 | 100 |
| Volume | 40 | 62.5 | 100 |
Discussion
Resistance to therapy is the major limitation of disease control in most cancer types. Thus, it is important to track disease response to adjust treatment for enhanced efficacy. CEUS is an attractive tool for this purpose because it is inexpensive, safe, and widely available. Attaching targeting ligands to microbubbles allows for molecular imaging of biomarkers expressed in different diseases. Here, it is shown that the response of ccRCC tumors to VEGFR-2 antiangiogenic and Notch inhibition therapeutics in mice can be accurately tracked throughout the course of therapy using USMI of VEGFR-2, and the imaging results agree with histological data. Furthermore, we show that USMI can detect statistically significant molecular and functional changes weeks before measureable differences in tumor volume between the treatment groups and the Control group, which indicates that USMI can be a powerful theranostic tool. This is consistent with findings from previous work [48-53], but we have also shown here that USMI can detect response to therapy in individual cases before changes are detectable in tumor volume.
Antiangiogenic drugs, such as SU, enzymatically inhibit and down-regulate VEGFR-2 to inhibit angiogenesis [7,8]. We were able to observe changes in TI corresponding to changes in expression of VEGFR-2. The results show that the anti-VEGF therapy was effective at arresting development of new vasculature, which may have led to anechoic areas, and more importantly, that CEUS can track the tumor response to the treatment more accurately than volume measurements. Additionally, the results showed that a significant difference in TI can be found only 2 days after the start of treatment. This is consistent with recent findings indicating that a change in VEGFR-2 expression 24 h after treatment can be detected with USMI using microbubbles targeted to VEGRF-2 before there are detectable changes in tumor growth [48]. Furthermore, the effect of SU can easily be seen in the tumors as an increase in anechoic areas and quantified in the PA metric, which provides another example of the ability of CEUS to detect tumor response to treatment faster and more accurately than tumor growth (Figure 8). Moreover, PA calculations can be accomplished with non-targeted contrast, which could facilitate translation into the clinic since non-targeted contrast agents, such as Definity (Lantheus Medical Imaging, N. Billerica, MA, USA), are already FDA approved for certain applications.
TI and PA results showed that CEUS can detect response of populations to therapy, which can be important for designing new treatment regimens for combating cancer. However, detecting response in individuals is more significant for clinical translation since physicians use individual patient information to tailor the treatment. Here, we show that CEUS was able to detect the individual response to therapy of most of the mice in the SU and Switch groups by the second week of treatment, while the chance of detecting response with the tumor volume by that time was slightly higher than a coin toss. Therefore, CEUS has great potential as a personalized theranostic tool.
Taken together, these results demonstrate that CEUS has the potential to be a valuable clinical tool for assessing response to treatment without having to biopsy the tissue or wait for delayed changes in tumor size and may allow doctors to tailor treatment to individuals for better efficacy. Furthermore, early identification of ineffective treatments may reduce side effects.
The PI did not significantly vary between treatment groups, which is surprising given that the GSI and Control groups seemed to have better perfusion and smaller anechoic areas (Figure 7). A possible explanation of why PI remained similar among the groups is that there is significant bubble binding by 1 min and therefore, the intensity might be a result of the perfusion of the tissue in addition to VEGFR-2 expression. Thus, PI might not be suitable for the assessment of disease progression. A better technique might be to track the intensity for the first few minutes after injection in order to find the true peak intensity, as is done by Wang et al. [48], which showed that peak intensity can measure changes in response to therapy.
The results of the staining demonstrate that USMI of VEGFR-2 demonstrates real physiological characteristics of disease. As expected, levels of patent vasculature in the SU group were the lowest among all of the groups, while those of GSI and Control were about the same (Figure 9). Furthermore, the Switch group had significantly higher SA than all other groups, most likely caused by the switch to GSI. Additionally, the Pre-Switch SA was significantly lower than the Switch group, confirming that the increase in patent vasculature in the Switch group was caused by the change in treatment. Staining for VEGFR-2 was also performed, but the results showed expression in regions where patent vasculature was not present. Most likely, this is a result of extravascular VEGFR-2 expression or endothelial receptors of non-patent vessels. Since the contrast agents used in this study can only bind to intravascular VEGFR-2 receptors, VEGFR-2 staining results were not included. Nevertheless, we believe that USMI can be a valuable tool for disease monitoring, since it provides information about molecular biomarkers of disease that can be used to closely track disease state and response to therapy without the need for multiple biopsies or exposure to ionizing radiation.
The Notch signaling pathway regulates proper development of new vasculature, and it has been reported that inhibition leads to excessive sprouting, immature vessels, and a reduction in tumor growth [61-63]. Notch inhibition promotes expression of VEGFR-2, so it is not surprising that the TI of the GSI group remained high throughout the experiment (Figure 5). Moreover, it is not surprising that the Control and GSI groups had similar levels of TI, since ccRCC is characterized by increased levels of angiogenesis and upregulation of angiogenic growth factors. Previous work suggests that the excessive sprouting resulting from Notch inhibition leads to inefficient perfusion and a reduction in tumor growth [61-64]; however, the results of treatment with this drug as a single agent in a ccRCC xenograft model demonstrate efficient vasculature in the GSI group with PA and PI values similar to the controls and an enhancement in tumor growth. This somewhat surprising result, however, must be considered in context. In the study reporting on GSI Compound X causing regression in a renal cancer model, Kalen et al. [69] were utilizing the mouse RENCA model. This model system differs from ours in important ways. First, while this is a spontaneously arising kidney tumor from a Balb/C mouse, it lacks the common feature of human renal cell carcinoma, which is inactivation of the von Hippel-Lindau (VHL) gene. VHL loss causes a high level of tumor microvascularity and upregulation of glycolysis, driving a unique dependency on oxygen and nutrient delivery. It is this dependency that renders VHL mutant renal cell carcinoma sensitive to the wide variety of anti-VEGF pathway agents currently in clinical use. However, this dependency may make the extra sprouting produced in response to GSI treatment an advantage to the specific physiology of this tumor type. Our model has a well-characterized VHL mutation and is known to demonstrate customary features of human clear cell renal cell carcinoma. The interaction between VEGF pathway targeted therapy and the vascular effects of GSI, however, highlights an intriguing alternate set of targeting strategies to alter vascular properties in tumors, the combination of which may be effective in renal cell carcinoma and potentially in a wider array of cancer settings. As discussed above, finding the PI may not be the best technique for approximating perfusion measurements, so further work is required to assess changes in perfusion efficiency as a result of Notch inhibition.
When the tumors in the Switch group were treated with GSI, the treatment appeared to normalize features of the vasculature, promoting angiogenesis so that the PA was reduced to levels similar to those of the controls. Higher TI suggests greater expression of VEGFR-2 (Figure 5). This reversal in the state of the vasculature is only detectable by using CEUS, since the tumor volume of the Switch group remains non-significant from the Control group. However, the volume of the Switch group did become significant from that of the SU group 1 week after the change in treatment to GSI.
Normalization of tumor vasculature has been shown to enhance therapeutic effect in different types of cancer [70-72]. Tumor vasculature is leaky, which produces increased interstitial pressure, and in turn inhibits delivery of therapy into the tissue [73, 74]. By normalizing the vasculature and making it less permeable, the interstitial pressure can be reduced, allowing for drugs to extravasate in larger concentrations for better efficacy [73-75]. We have shown that GSI produced normalization in the vasculature in ccRCC tumors that were first treated with SU. Additionally, it is possible that by renormalizing the vasculature of tumors that stop responding to antiangiogenic therapy, resistance can be overcome. Moreover, we show here that ultrasound can be used to track the progression of the disease and even though we did not conclusively detect the emergence of resistance to SU in the time frame of the study, CEUS can be used to monitor the disease and make the switch to GSI when the tumors start showing signs of resistance.
The mice were imaged on set days of the week, when the tumor reached 200 mm3 (caliper measurement). Since not all of the tumors reached the size threshold at the same time, some mice were treated for different durations before their first imaging session after the start of treatment. Therefore, the effect measured by the different metrics on week 1 (the week after the start of treatment) might have been reduced and may be more drastic than the data show. Furthermore, the small number of mice in each group may have affected at which time point response was detected with the different metrics. For example, the volume of the SU and Control groups does not become significant until 5 weeks after treatment, but the p-values for week 3 and 4 are 0.066 and 0.069, respectively. Larger sample sizes would be required to validate this effect. An additional limitation of the study was that all analysis was performed on log compressed data, and while data compression did not allow calculation of absolute differences in intensity between the different treatment groups for PI and TI, relative differences are still valid, so the overall trends and results hold.
Since statistical analysis was performed on all mice at each time point, even if they did not survive the entire study, the results might be biased and indicate a better treatment efficacy for the SU group; presumably, if the health of the mouse was poor, the tumor could progress more aggressively than in a healthy mouse. However, most of the morbidity was due to tumor size limitations, so we do not expect that the overall results of the study would be significantly changed if statistical analysis were only performed on the animals that survived the entire study.
While the different treatments slowed the tumor growth, no regression or stagnation was observed in this study. In the case of SU, the dose was chosen based on previous work [64, 65], and absence of regression is likely due to the early emergence of resistance. The chosen dose of GSI, 90 mg/kg, was shown to be effective against a breast cancer model [66], but it was not optimized for this work, so it is possible that the mice were under-dosed. However, we observed vascular effects that were histologically consistent with the enhanced sprouting expected with Notch inhibition. In addition, mice suffered from weight loss in pilot studies where a dose of 150 mg/kg was used.
Since most of the mice were sacrificed because their tumors grew beyond the size limit, it is difficult to evaluate survival outcome. Therefore, even though USMI can be used to track disease progression, more work is required to assess the ability of this technique to predict eventual survival outcomes.
Conclusions
In this study, mice bearing ccRCC tumors were treated with VEGFR-2 antiangiogenic and Notch inhibition therapy. It was observed that USMI can be used to monitor the disease progression and its response to the different therapies more accurately than using the conventional methods of tracking tumor volume. Furthermore, we explored the effects of Notch inhibition as an alternate strategy of vascular disruption and showed that this type of treatment maintained or enhanced tumor growth in the context of this xenograft model by decreasing anechoic areas and promoting angiogenesis. Other work in recent years has shown that USMI can track response to antiangiogenic therapy [48-53] and predict whether tumors will respond to different treatments [54-56]; however, this is the first study to show that USMI can differentiate and track response to alternate strategies of vascularity-altering therapies and detect the tissue response of individual animals using USMI earlier than tracking changes in tumor volume. Ultrasound is an inexpensive, safe, and widely available technology that when used in conjunction with microbubble contrast agents, can be a valuable theranostic tool because it has the capability to assess response to therapy in cancer and monitor disease progression which might allow doctors to modify patient treatment for enhanced therapeutic effect.
Abbreviations
ccRCC: clear cell renal cell carcinoma; CEUS: contrast enhanced ultrasound; MI: molecular imaging; USMI: ultrasound molecular imaging; VEGF: vascular endothelial growth factor; VEGFR2: vascular endothelial growth factor receptor 2; TI: targeting intensity; PI: peak intensity; PA: percent anechoic; SA: stained area.
Acknowledgements
We would like to thank the Animal Studies Core at the University of North Carolina for their assistance with cell injections and tail vein catheters. This work was supported by the National Institutes of Health R21CA184387 to W. K. Rathmell and collaborators, and 1F31CA196216 to J.D. Rojas. We acknowledge the Translational Pathology Shared Resource supported by NCI/NIH Cancer Center Support Grant 5P30 CA68485-19, Pfizer for supplying compound, and the Vanderbilt Mouse Metabolic Phenotyping Center Grant 2 U24 DK059637-16.
Competing Interests
The authors have declared that no competing interest exists.
References
1. American Cancer Society. Cancer Facts and Figures 2017. Am Cancer Soc. 2017
2. Kim WY, Kaelin WG. Molecular Pathways in Renal Cell Carcinoma-Rationale for Targeted Treatment. Semin Oncol. 2006;33(5):588-95
3. Creighton Morgan, Gunaratne et al. Comprehensive molecular characterization of clear cell renal cell carcinoma. Nature. 2013;499(7456):43-9
4. Rini BI, Flaherty K. Clinical effect and future considerations for molecularly-targeted therapy in renal cell carcinoma. Urol Oncol. 2008;26(5):543-9
5. Escudier B, Eisen T, Stadler WM. et al. Sorafenib in Advanced Clear-Cell Renal-Cell Carcinoma. N Engl J Med. 2007;356(2):125-34
6. Motzer RJ, Michaelson MD, Redman BG. et al. Activity of SU11248, a multitargeted inhibitor of vascular endothelial growth factor receptor and platelet-derived growth factor receptor, in patients with metastatic renal cell carcinoma. J Clin Oncol. 2006;24(1):16-24
7. Cook KM, Figg WD. Angiogenesis inhibitors: current strategies and future prospects. CA Cancer J Clin. 2010;60(4):222-243
8. Gan HK, Seruga B, Knox JJ. Sunitinib in solid tumors. Expert Opin Investig Drugs. 2009;18(6):821-34
9. Bergers G, Hanahan D. Modes of resistance to anti-angiogenic therapy. Nat Rev Cancer. 2008;8(8):592-603
10. Rini BI, Atkins MB. Resistance to targeted therapy in renal-cell carcinoma. Lancet Oncol. 2009;10(10):992-1000
11. Motzer RJ, Hutson TE, Tomczak P. et al. Overall survival and updated results for sunitinib compared with interferon alfa in patients with metastatic renal cell carcinoma. J Clin Oncol. 2009;27(22):3584-90
12. Therasse P, Arbuck S, Eisenhauer E. et al. New guidelines to evaluate the response to treatment in solid tumors. J Natl Canccer Inst. 2000;87(12):881-6
13. Morgan B. Dynamic Contrast-Enhanced Magnetic Resonance Imaging As a Biomarker for the Pharmacological Response of PTK787/ZK 222584, an Inhibitor of the Vascular Endothelial Growth Factor Receptor Tyrosine Kinases, in Patients With Advanced Colorectal Cancer and Liv. J Clin Oncol. 2003;21(21):3955-64
14. Wieder HA. Time course of tumor metabolic activity during chemoradiotherapy of esophageal squamous cell carcinoma and response of treatment. J Clin Oncol. 2004;22(5):900-8
15. Nathan PD, Vinayan A, Stott D, Juttla J, Goh V. CT response assessment combining reduction in both size and arterial phase density correlates with time to progression in metastatic renal cancer patients treated with targeted therapies. Cancer Biol Ther. 2010;9(1):14-9
16. Benjamin RS, Choi H, Macapinlac HA. et al. We should desist using RECIST, at least in GIST. J Clin Oncol. 2007;25(13):1760-4
17. Husband JE, Schwartz LH, Spencer J. et al. Evaluation of the response to treatment of solid tumours - a consensus statement of the International Cancer Imaging Society. Br J Cancer. 2004;90(12):2256-60
18. Cox K, Weeks J, Mills P. et al. Contrast-Enhanced Ultrasound Biopsy of Sentinel Lymph Nodes in Patients with Breast Cancer: Implications for Axillary Metastases and Conservation. Ann Surg Oncol. 2016;23(1):58-64
19. Kasoji SK, Chang EH, Mullin LB, Chong WK, Rathmell WK, Dayton PA. A Pilot Clinical Study in Characterization of Malignant Renal Cell Carcinoma Subtype with Contrast-Enhanced Ultrasound. Ultrason Imaging. 2016;39(2):126-36
20. Willmann JK, Bonomo L, Carla Testa A. et al. Ultrasound Molecular Imaging With BR55 in Patients With Breast and Ovarian Lesions: First-in-Human Results. J Clin Oncol. 2017;35(19):2133-40
21. Smeenge M, Tranquart F, Mannaerts CK. et al. First-in-Human Ultrasound Molecular Imaging With a VEGFR2-Specific Ultrasound Molecular Contrast Agent (BR55) in Prostate Cancer. Invest Radiol. 2017;52(7):419-27
22. Klibanov AL, Rasche PT, Hughes MS. et al. Detection of individual microbubbles of ultrasound contrast agents: imaging of free-floating and targeted bubbles. Invest Radiol. 2004;39(3):187-95
23. Bouakaz a, Frigstad S, Ten Cate FJ, de Jong N. Super harmonic imaging: A new imaging technique for improved contrast detection. Ultrasound Med Biol. 2002;28(1):59-68
24. Whittingham TA. Contrast-Specific Imaging Techniques: Technical Perspective. Contrast Media Ultrason. 2005:43-70
25. Kogan P, Johnson K a, Feingold S. et al. Validation of dynamic contrast-enhanced ultrasound in rodent kidneys as an absolute quantitative method for measuring blood perfusion. Ultrasound Med Biol. 2011;37(6):900-8
26. Roberts VHJ, Lo JO, Salati JA. et al. Quantitative assessment of placental perfusion by contrast-enhanced ultrasound in macaques and human subjects. Am J Obstet Gynecol. 2016;214(3):214-369
27. Feingold S, Gessner R, Guracar IM, Dayton PA. Quantitative Volumetric Perfusion Mapping of The Microvasculature Using Contrast Ultrasound. Invest Radiol. 2010;45(10):669-674
28. Senior R, Monaghan M, Main ML. et al. Detection of coronary artery disease with perfusion stress echocardiography using a novel ultrasound imaging agent: Two Phase 3 international trials in comparison with radionuclide perfusion imaging. Eur J Echocardiogr. 2009;10(1):26-35
29. Porter TR, Xie F. Myocardial Perfusion Imaging With Contrast Ultrasound. JACC Cardiovasc Imaging. 2010;3(2):176-87
30. Martina AD. Ultrasound Contrast Agents for Brain Perfusion Imaging and Ischemic Stroke Therapy. J Neuroimaging. 2005;15(3):217-32
31. Meyer-Wiethe K, Cangür H, Schindler A, Koch C, Seidel G. Ultrasound Perfusion Imaging: Determination of Thresholds for the Identification of Critically Disturbed Perfusion in Acute Ischemic Stroke-A Pilot Study. Ultrasound Med Biol. 2007;33(6):851-6
32. Wiesmann M, Meyer K, Albers T, Seidel G. Parametric Perfusion Imaging with Contrast-Enhanced Ultrasound in Acute Ischemic Stroke. Stroke. 2004;35(2):508-13
33. Chang EH, Chong WK, Kasoji SK, Dayton PA, Rathmell WK. Management of Indeterminate Cystic Kidney Lesions: Review of Contrast-enhanced Ultrasound as a Diagnostic Tool. Urology. 2016;87:1-10
34. Smeenge M, Mischi M, Laguna Pes MP, de la Rosette JJMCH, Wijkstra H. Novel contrast-enhanced ultrasound imaging in prostate cancer. World J Urol. 2011;29(5):581-7
35. Dayton PA, Rychak J. Molecular Ultrasound Imaging Using Microbubble Contrast Agents. Front Biosicence. 2007;12:5124-42
36. Christiansen JP, Leong-Poi H, Klibanov AL, Kaul S, Lindner JR. Noninvasive imaging of myocardial reperfusion injury using leukocyte-targeted contrast echocardiography. Circulation. 2002;105(15):1764-7
37. Lindner JR. Molecular imaging of cardiovascular disease with contrast-enhanced ultrasonography. Nat Rev Cardiol. 2009;6(7):475-81
38. Kaufmann BA, Sanders JM, Davis C. et al. Molecular imaging of inflammation in atherosclerosis with targeted ultrasound detection of vascular cell adhesion molecule-1. Circulation. 2007;116(3):276-84
39. Bachmann C, Klibanov AL, Olson TS. et al. Targeting mucosal addressin cellular adhesion molecule (MAdCAM)-1 to noninvasively image experimental Crohn's disease. Gastroenterology. 2006;130(1):8-16
40. Tlaxca JL, Rychak JJ, Ernst PB. et al. Ultrasound-based molecular imaging and specific gene delivery to mesenteric vasculature by endothelial adhesion molecule targeted microbubbles in a mouse model of Crohn's disease. J Control Release. 2013;165(3):216-25
41. Rychak JJ, Graba J, Cheung AMY. et al. Microultrasound molecular imaging of vascular endothelial growth factor receptor 2 in a mouse model of tumor angiogenesis. Mol Imaging. 2007;6(5):289-96
42. Bzyl J, Lederle W, Rix A. et al. Molecular and functional ultrasound imaging in differently aggressive breast cancer xenografts using two novel ultrasound contrast agents (BR55 and BR38). Eur Radiol. 2011;21(9):1988-95
43. Leguerney I, Scoazec J-Y, Gadot N. et al. Molecular ultrasound imaging using contrast agents targeting endoglin, vascular endothelial growth factor receptor 2 and integrin. Ultrasound Med Biol. 2015;41(1):197-207
44. Stieger SM, Dayton PA, Borden MA. et al. Imaging of angiogenesis using Cadence contrast pulse sequencing and targeted contrast agents. Contrast Media Mol Imaging. 2008;3(1):9-18
45. Beer AJ, Schwaiger M. Imaging of integrin αVβ3 expression. Cancer Metastasis Rev. 2008;27(4):631-44
46. Anderson CR, Hu X, Tlaxca J. et al. Ultrasound Molecular Imaging of Tumor Angiogenesis with an Integrin Targeted Microbubble Contrast Agent. Invest Radiol. 2011;46(4):215-24
47. Anderson CR, Rychak J, Backer M, Backer J, Ley K, Klibanov A. scVEGF Microbubble Ultrasound Contrast Agents: A Novel Probe for Ultrasound Molecular Imaging of Tumor Angiogenesis. Invest Radial. 2010;45(10):579-85
48. Wang H, Lutz AM, Hristov D, Tian L, Willmann JK. Intra-animal Comparison between Three-dimensional Molecularly Targeted US and Three-dimensional Dynamic Contrast-enahnced US for Early Antiangiogenic Treatment Assessment in Colon Cancer. Radiology. 2017(2):443-52
49. Baron Toaldo M, Salvatore V, Marinelli S. et al. Use of VEGFR-2 targeted ultrasound contrast agent for the early evaluation of response to sorafenib in a mouse model of hepatocellular carcinoma. Mol Imaging Biol. 2015;17(1):29-37
50. Eschbach RS, Clevert D-A, Hirner-Eppeneder H. et al. Contrast-Enhanced Ultrasound with VEGFR2-Targeted Microbubbles for Monitoring Regorafenib Therapy Effects in Experimental Colorectal Adenocarcinomas in Rats with DCE-MRI and Immunohistochemical Validation. PLoS One. 2017;12(1):1-22
51. Baetke SC, Rix A, Tranquart F. et al. Squamous Cell Carcinoma Xenografts: Use of VEGFR2-targeted Microbubbles for Combined Functional and Molecular US to Monitor Antiangiogenic Therapy Effects. Radiology. 2016;278(2):430-40
52. Wang H, Kaneko OF, Tian L, Hristov D, Willmann JK. Three-dimensional Ultrasound Molecular Imaging of Angiogenesis in Colon Cancer using a Clinical Matrix Array Ultrasound Transducer. Invest Radiol. 2015;50(5):322-9
53. Pysz MA, Machtaler SB, Seeley ES. et al. Vascular endothelial growth factor receptor type 2-targeted contrast-enhanced US of pancreatic cancer neovasculature in a genetically engineered mouse model: potential for earlier detection. Radiology. 2015;274(3):790-9
54. Streeter JE. A Comparative Evaluation of Ultrasound Molecular Imaging, Perfusion Imaging, and Volume Measurements in Evaluating Response to Therapy in Patient-Derived Xenografts. Technol Cancer Res Treat. 2013;12(4):311-321
55. Sirsi SR, Flexman ML, Vlachos F. et al. Contrast Ultrasound Imaging for Identification of Early Responder Tumor Models to Anti-Angiogenic Therapy. Ultrasound Med Biol. 2012;38(6):1019-29
56. Zhou J, Wang H, Zhang H. et al. VEGFR2-targeted three-dimensional ultrasound imaging can predict responses to antiangiogenic therapy in preclinical models of colon cancer. Cancer Res. 2016;76(14):4081-9
57. Chappell JC, Mouillesseaux KP, Bautch VL. Flt-1 (vascular endothelial growth factor receptor-1) is essential for the vascular endothelial growth factor-notch feedback loop during angiogenesis. Arterioscler Thromb Vasc Biol. 2013;33(8):1952-9
58. Hellström M, Phng L-K, Hofmann JJ. et al. Dll4 signalling through Notch1 regulates formation of tip cells during angiogenesis. Nature. 2007;445(7129):776-80
59. Chappell JC, Wiley DM, Bautch VL. Regulation of blood vessel sprouting. Semin Cell Dev Biol. 2011;22(9):1005-11
60. Kushner EJ, Bautch VL. Building blood vessels in development and disease. Curr Opin Hematol. 2013;20(3):231-6
61. Kuhnert F, Kirshner JR, Thurston G. Dll4-Notch signaling as a therapeutic target in tumor angiogenesis. Vasc Cell. 2011;3(1):20
62. Ridgway J, Zhang G, Wu Y. et al. Inhibition of Dll4 signalling inhibits tumour growth by deregulating angiogenesis. Nature. 2006;444(7122):1083-7
63. Noguera-Troise I, Daly C, Papadopoulos NJ. et al. Blockade of Dll4 inhibits tumour growth by promoting non-productive angiogenesis. Nature. 2006;444(7122):1032-7
64. Miles KM, Seshadri M, Ciamporcero E. et al. Dll4 Blockade Potentiates the Anti-Tumor Effects of VEGF Inhibition in Renal Cell Carcinoma Patient-Derived Xenografts. PLoS One. 2014;9(11):e112371
65. Yuan B, Rychak J. Tumor functional and molecular imaging utilizing ultrasound and ultrasound-mediated optical techniques. Am J Pathol. 2013;182(2):305-311
66. Wei S, Fu N, Sun Y. et al. Targeted contrast-enhanced ultrasound imaging of angiogenesis in an orthotopic mouse tumor model of renal carcinoma. Ultrasound Med Biol. 2014;40(6):1250-1259
67. Safran M, Kim WY, O'Connell F. et al. Mouse model for noninvasive imaging of HIF prolyl hydroxylase activity: assessment of an oral agent that stimulates erythropoietin production. Proc Natl Acad Sci U S A. 2006;103(1):105-110
68. Streeter JE, Gessner RC, Tsuruta J, Feingold S, Dayton PA. Assessment of Molecular Imaging of Angiogenesis with Three-Dimensional Ultrasonography. Mol Imaging. 2013;10(6):460-468
69. Kalén M, Heikura T, Karvinen H. et al. Gamma-secretase inhibitor treatment promotes VEGF-A-driven blood vessel growth and vascular leakage but disrupts neovascular perfusion. PLoS One. 2011:6 (4)
70. Chauhan VP, Stylianopoulos T, Martin JD. et al. Normalization of tumour blood vessels improves the delivery of nanomedicines in a size-dependent manner. Nat Nanotechnol. 2012;7(6):383-388
71. Jain RK. Normalizing tumor microenvironment to treat cancer: bench to bedside to biomarkers. J Clin Oncol. 2013;31(17):2205-2218
72. Jain BRK. Taming Vessels to Treat Cancer. Sci Am. 2008;18:64-71
73. Batchelor TT, Gerstner ER, Emblem KE. et al. Improved tumor oxygenation and survival in glioblastoma patients who show increased blood perfusion after cediranib and chemoradiation. Proc Natl Acad Sci U S A. 2013;110(47):19059-19064
74. Sorensen AG, Emblem KE, Polaskova P. et al. Increased survival of glioblastoma patients who respond to antiangiogenic therapy with elevated blood perfusion. Cancer Res. 2012;72(2):402-407
75. Tong RT, Boucher Y, Kozin S V, Winkler F, Hicklin DJ, Jain RK. Vascular normalization by vascular endothelial growth factor receptor 2 blockade induces a pressure gradient across the vasculature and improves drug penetration in tumors. Cancer Res. 2004;64(11):3731-3736
Author contact
![]() Corresponding author:
Corresponding author: