Impact Factor
- Issue 14; 2026
- Issue 13; 2026
- Issue 12; 2026
- Issue 11; 2026
- Issue 10; 2026
- Volume 16; 2026
- Advance Articles
- Past Issues
- Cover Images
- Cover Suggestion
- Index & Coverage
- Special Issues
Introduction
Results
Discussion
Materials and Methods
Abbreviations
Supplementary Material
Acknowledgements
References
International Journal of Biological Sciences
International Journal of Medical Sciences
 Global reach, higher impact

Theranostics 2018; 8(1):61-77. doi:10.7150/thno.20893 This issue Cite
Research Paper
Epigenomic characterization of a p53-regulated 3p22.2 tumor suppressor that inhibits STAT3 phosphorylation via protein docking and is frequently methylated in esophageal and other carcinomas
Lili Li1,*, Juan Xu1,2*, Guohua Qiu3, Jianming Ying1,4, Zhenfang Du1, Tingxiu Xiang5, Kai Yau Wong6, Gopesh Srivastava6, Xiao-Feng Zhu7, Tony S Mok1, Anthony TC Chan1, Francis KL Chan8, Richard F Ambinder3,9, Qian Tao1,3,9 ![]()
1. Cancer Epigenetics Laboratory, Department of Clinical Oncology, State Key Laboratory of Oncology in South China, Sir YK Pao Center for Cancer and Li Ka Shing Institute of Health Sciences, The Chinese University of Hong Kong, Hong Kong;
2. Shenzhen Second People's Hospital, the First Affiliated Hospital of Shenzhen University, Shenzhen, China;
3. Johns Hopkins Singapore, Singapore;
4. Department of Pathology, National Cancer Center/Cancer Hospital, Chinese Academy of Medical Sciences & Peking Union Medical College, Beijing, China;
5. Chongqing Key Laboratory of Molecular Oncology and Epigenetics, The First Affiliated Hospital of Chongqing Medical University, Chongqing, China;
6. Department of Pathology, Queen Mary Hospital, The University of Hong Kong;
7. State Key Laboratory of Oncology in South China, Sun Yat-sen University Cancer Center, Guangzhou, China;
8. Institute of Digestive Disease and State Key Laboratory of Digestive Diseases, Department of Medicine and Therapeutics, The Chinese University of Hong Kong;
9. Sidney Kimmel Comprehensive Cancer Center, Johns Hopkins School of Medicine, Baltimore
*Equal Contribution
Received 2017-5-6; Accepted 2017-9-15; Published 2018-1-1
Abstract

Rationale: Oncogenic STAT3 signaling activation and 3p22-21.3 locus alteration are common in multiple tumors, especially carcinomas of the nasopharynx, esophagus and lung. Whether these two events are linked remains unclear. Our CpG methylome analysis identified a 3p22.2 gene, DLEC1, as a methylated target in esophageal squamous cell (ESCC), nasopharyngeal (NPC) and lung carcinomas. Thus, we further characterized its epigenetic abnormalities and functions.
Methods: CpG methylomes were established by methylated DNA immunoprecipitation. Promoter methylation was analyzed by methylation-specific PCR and bisulfite genomic sequencing. DLEC1 expression and clinical significance were analyzed using TCGA database. DLEC1 functions were analyzed by transfections followed by various cell biology assays. Protein-protein interaction was assessed by docking, Western blot and immunoprecipitation analyses.
Results: We defined the DLEC1 promoter within a CpG island and p53-regulated. DLEC1 was frequently downregulated in ESCC, lung and NPC cell lines and primary tumors, but was readily expressed in normal tissues and immortalized normal epithelial cells, with mutations rarely detected. DLEC1 methylation was frequently detected in ESCC tumors and correlated with lymph node metastasis, tumor recurrence and progression, with DLEC1 as the most frequently methylated among the established 3p22.2 tumor suppressors (RASSF1A, PLCD1 and ZMYND10/BLU). DLEC1 inhibits carcinoma cell growth through inducing cell cycle arrest and apoptosis, and also suppresses cell metastasis by reversing epithelial-mesenchymal transition (EMT) and cell stemness. Moreover, DLEC1 represses oncogenic signaling including JAK/STAT3, MAPK/ERK, Wnt/β-catenin and AKT pathways in multiple carcinoma types. Particularly, DLEC1 inhibits IL-6-induced STAT3 phosphorylation in a dose-dependent manner. DLEC1 contains three YXXQ motifs and forms a protein complex with STAT3 via protein docking, which blocks STAT3-JAK2 interaction and STAT3 phosphorylation. IL-6 stimulation enhances the binding of DLEC1 with STAT3, which diminishes their interaction with JAK2 and further leads to decreased STAT3 phosphorylation. The YXXQ motifs of DLEC1 are crucial for its inhibition of STAT3 phosphorylation, and disruption of these motifs restores STAT3 phosphorylation through abolishing DLEC1 binding to STAT3.
Conclusions: Our study demonstrates, for the first time, predominant epigenetic silencing of DLEC1 in ESCC, and a novel mechanistic link of epigenetic DLEC1 disruption with oncogenic STAT3 signaling in multiple carcinomas.
Keywords: DLEC1, 3p22, STAT3, methylation, carcinoma
Introduction
Chromosomal locus 3p22-21.3 frequently has abnormalities like loss of heterozygosity (LOH) in multiple cancers [1-6], including esophageal squamous cell (ESCC), lung and nasopharyngeal (NPC) carcinomas. Thus, as a typical tumor suppressor gene (TSG) locus, allele loss at 3p21.3 has been shown to be the early premalignant change detected in lung and breast cancers [1, 4]. Multiple genetic and epigenetic studies have been performed to determine the related TSGs at this locus, such as RASSF1A [7], ZMYND10 [8-10] and PLCD1 [11]. Another candidate 3p22 TSG, deleted in lung and esophageal cancer 1 (DLEC1), was firstly identified in esophageal and lung cancers through sequencing 3p21.3 genomic DNA cosmid clones and expression analysis [12]. However, although DLEC1 downregulation and rare mutations were initially detected in some carcinoma cell lines and primary tissues, its promoter methylation was not detected in any ESCC or lung cancer cell lines or tumor samples [12], raising questions about its role as a bona fide 3p22-21.3 TSG. After its first identification, DLEC1 promoter methylation and downregulation have been reported in multiple cancers by our and other groups [13-22], but still not in ESCC yet. DLEC1 methylation/downregulation has been shown to be significantly related to disease progression and poor prognosis of some cancers including lung, ovarian and breast [18-21]; thus, it is a potential biomarker for tumor diagnosis.
The DLEC1 protein contains 5,268 nucleotides and 1,755 amino acids, with no homology to any known proteins or domains reported so far. Previous studies showed that DLEC1 is a growth suppressor with anti-tumorigenic abilities in vivo [17]. However, the molecular mechanism underlying its tumor suppression still remains unknown.
STAT3 is commonly activated in human malignancies as an oncogenic signaling hallmark, involved in the regulation of cell proliferation, apoptosis, cancer stemness and immune checkpoint [23, 24]. Persistent STAT3 activation is associated with tumor progression of ESCC, NPC and lung cancers [25-27]; thus it is a feasible therapeutic target. STAT3 activation is stimulated by cytokines and growth factors (e.g., IL-6, IFNs, EGF), featured by tyrosine phosphorylation at residue Y705 together with Ser727 phosphorylation, and further functions as a transcription factor to activate target gene transcription [28]. The YXXQ motif is well known as a consensus motif for STAT3 recruitment, which acts as a docking site selectively binding STATs [29]. In addition, STAT3 could also be inactivated by negative regulators, including suppressors of cytokine signaling (SOCS), protein tyrosine phosphatases (PTPs) and protein inhibitors. Although the critical role of oncogenic STAT3 activation in tumorigenesis has been well defined, the mechanisms regulating STAT3 activation are diverse and worthy of further exploration.
We conducted an integrative epigenomic and genomic study of ESCC through genome-wide CpG methylation (methylome) and high-resolution array comparative genomic hybridization (aCGH) analyses, and identified DLEC1 as a methylated target in ESCC, as well as lung cancer and NPC. We further examined its expression and methylation in cell lines and primary tumors of ESCC, lung cancer and NPC, and systematically assessed its tumor suppressive functions in carcinoma cells. We also investigated the underlying mechanism of JAK/STAT3 signaling regulation by DLEC1 in carcinoma cells.
Results
Epigenomic identification of DLEC1 as a methylated target for esophageal and other carcinomas
CpG methylome analysis of ESCC cell lines and immortalized esophageal epithelial cells was performed by methylated DNA immunoprecipitation (MeDIP) (Li et al., in preparation). Enriched methylated signal in the DLEC1 promoter was detected in ESCC, but not in immortalized esophageal epithelial cells (Fig. 1A), indicating that DLEC1 is a methylated target for ESCC. Similar positive signal peaks at the DLEC1 promoter were detected in our previous NPC methylome data (Fig. 1A). Moreover, we identified DLEC1 as a methylated target in our previous lung cancer methylome study (5/6 paired carcinomas) [30].
CpG methylome study identified DLEC1 as a methylated target downregulated in multiple carcinomas. (A) Methylome analysis showed signal enrichment in the DLEC1 promoter CGI in ESCC, NPC and lung cancer by MeDIP and Illumina 27k methylation array (bottom panels). Positive MeDIP signal peaks (blue) are marked. (B) Broad expression of DLEC1 in human normal adult tissues by semi-quantitative RT-PCR, with GAPDH as a control. (C) Reduction and silencing of DLEC1 in ESCC and lung carcinoma cell lines. M: methylated; U: unmethylated. (D) Pharmacological demethylation with 5-Aza and TSA restored DLEC1 expression in methylated and silenced carcinoma cell lines. (E) Representative BGS results of carcinoma cell lines. Each single allele of the DLEC1 CGI is shown as an individual row, with filled circle representing methylated while open circles representing unmethylated CpG sites. ESCC: esophageal squamous carcinoma; NPC: nasopharyngeal carcinoma; Ca: carcinoma.
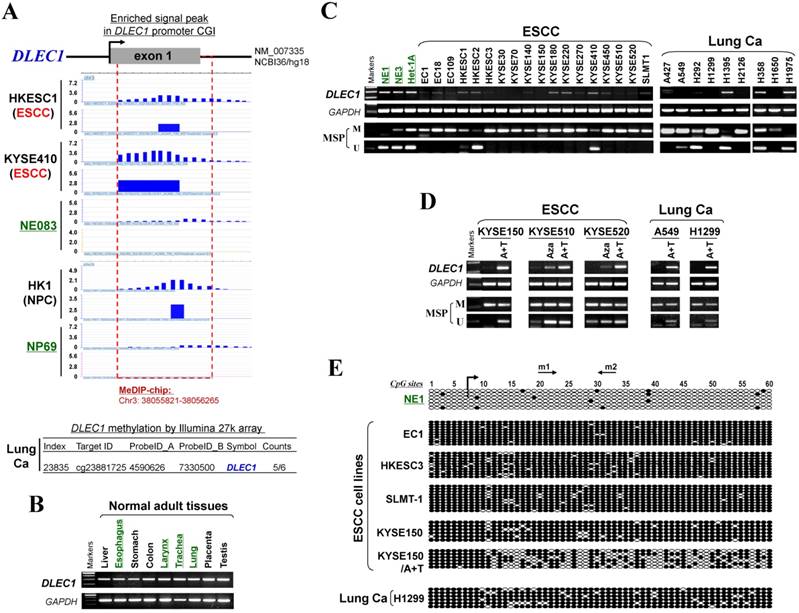
Meanwhile, our array CGH study of ESCC [31] also detected hemizygous 3p22 deletion in 5/10 cell lines where DLEC1 is located (Fig. S1A), with homozygous deletion of DLEC1 in one cell line (EC1) (Fig. S1B). Further analysis of TCGA and Oncomine databases revealed DNA copy number loss of DLEC1 in ESCC, lung and NPC primary tumors (Fig. S2), However, no mutation of DLEC1 was found in the ESCC and NPC cohorts, while mutations were only detected in <5% esophageal adenocarcinomas and some lung cancer cohorts (Fig. S3). These results suggest that DLEC1 is disrupted through both epigenetic and, less frequently, genetic (LOH/deletion) mechanisms in ESCC and other carcinomas.
The DLEC1 promoter is a CpG island and p53-regulated
As promoter CpG methylation directly mediates transcription repression, the DLEC1 promoter was further analyzed. A 756 bp region spanning its promoter and exon 1 as a typical CpG island (CGI) was found (Fig. S4A). Potential binding sites for multiple transcription factors, including p53, c-Myb, heat-shock factor (HSF), STATs, E2F and Sp1, were predicted using TFSEARCH (www.cbrc.jp/research/db/TFSEARCH) and MotifSearch (motif.genome.jp) (Fig. S4A), indicating that this promoter is subject to the regulation of these transcription factors. Thus, several segments covering this region were cloned and tested for promoter reporter activities. Results showed that the shortest construct (+18 to -295), located within the CGI, had the maximal luciferase activity (Fig. S4B), indicating that it could act as a functional promoter driving DLEC1.
As five putative p53-binding sites were found in DLEC1 promoter (+18 to -1021) (http://tfbind.hgc.jp/), we then examined the effect of p53 on DLEC1 promoter activity. Results showed that p53 upregulated DLEC1 promoter activity, and the region (+18 to -295) might be the core p53 regulatory region (Fig. S4C), indicating that DLEC1 is indeed a p53-regulated gene. We further analyzed the relationship between p53 status and DLEC1 methylation or expression using TCGA database cohorts, and found that wild-type p53 is significantly correlated with DLEC1 high expression/low methylation, supporting our findings of p53 regulation of DLEC1 promoter (Fig. S4D, E).
DLEC1 is downregulated by methylation in esophageal and other carcinoma cell lines
DLEC1 expression and methylation were further examined in a panel of ESCC and other carcinoma cell lines. DLEC1 was readily detected in normal esophageal, respiratory and digestive tissues including esophagus, larynx, trachea, lung, stomach and colon (Fig. 1B), as well as normal immortalized esophageal and nasopharyngeal cell lines (NE1, NE3, Het-1A and NP69) (Fig. 1C; Fig S5A). In contrast, DLEC1 was silenced or significantly downregulated in 17/18 ESCC, 6/9 lung and 5/5 NPC cell lines (Fig. 1C, Fig. S5A). Methylation-specific PCR (MSP) showed that the DLEC1 promoter was methylated in virtually all the downregulated cell lines, but hemi-methylated in two immortalized normal epithelial cell lines (Het-1A, NP69). Further detailed bisulfite genomic sequencing (BGS) methylation analysis of individual CpG sites on the DLEC1 promoter showed heavily methylated alleles in silenced cell lines, a few methylated alleles in hemi-methylated NP69 cells, but only few scattered methylated CpG site in NE1 cells, confirming the MSP data (Fig. 1E, Fig. S5C). Thus, DLEC1 expression is well correlated with its methylation status in esophageal and other carcinoma cells.
To determine whether an epigenetic mechanism directly mediates DLEC1 silencing, DNA methyltransferase inhibitor 5-aza-2'-deoxycytidine (Aza) and histone deacetylase inhibitor Trichostatin A (TSA) were used. After the treatment, DLEC1 expression was increased in cell lines of ESCC, lung and NPC with silenced DLEC1, and even more dramatically increased with Aza+TSA treatment, accompanied by increased unmethylated alleles and decreased methylated alleles as detected by both MSP and BGS (Fig. 1D, E, Fig. S5B, C). Moreover, ChIP assay showed increased binding of acetylated histone 4 to the DLEC1 CGI, following TSA treatment in carcinoma cells (Fig. S6). These results suggest that both CpG methylation and histone deacetylation contribute to DLEC1 silencing in carcinoma cells.
Frequent DLEC1 methylation in primary carcinomas with clinical correlation
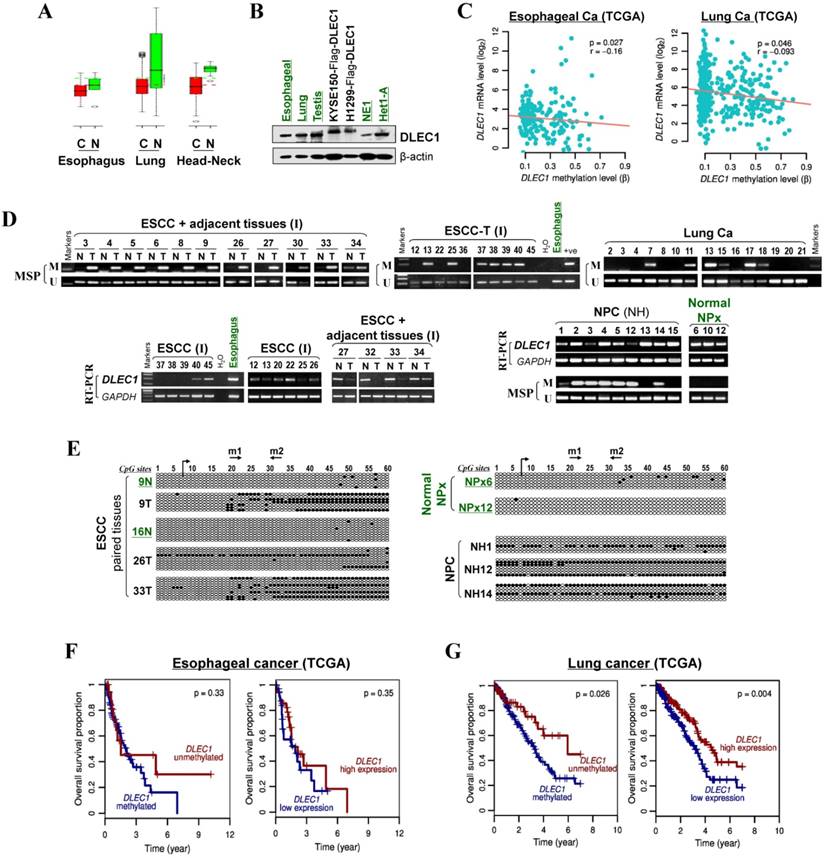
We then analyzed DLEC1 expression and methylation in primary ESCC and other carcinomas. First, online GENT database analysis showed significant reduction of DLEC1 RNA in esophageal, lung, and head and neck cancer tissues compared with corresponding normal tissues (Fig. 2A). Moreover, DLEC1 protein was abundantly expressed in normal tissues including esophageal, lung and testis (Fig. 2B). Further semi-quantitative RT-PCR analysis detected DLEC1 downregulation/silencing in primary ESCC tissues, but medium/high expression in normal esophageal, nasopharyngeal (NPx) and paired tumor adjacent normal tissues (Fig. 2D). Furthermore, DLEC1 promoter methylation was detected in 66% (27/41) of ESCC tumors but rarely in tumor adjacent normal and normal esophageal tissues. In another cohort, DLEC1 methylation was detected in 48% (40/83) of ESCC primary tissues (Fig. 2D, Table 1). Overall, DLEC1 is methylated in 54% (67/124) of primary ESCC tumors, which correlates with its downregulation. An inverse correlation between DLEC1 mRNA expression and promoter methylation was observed in esophageal and lung cancer patients from TCGA datasets (Fig. 2C).
DLEC1 downregulation and methylation in esophageal and other carcinomas. (A) DLEC1 expression levels in esophageal, lung and head/neck tissues through GENT online analysis (upper panel). C: cancer; N: normal. (B) DLEC1 protein expression was detected by Western blot in human normal tissues of esophageal, lung and testis, immortalized esophageal epithelial cell lines and ectopically expressed tumor cell lines. (C) Analyses of TCGA datasets revealed an inverse correlation between DLEC1 mRNA expression and promoter methylation in esophageal and lung cancers. (D) Promoter methylation and expression of DLEC1 were detected in esophageal, nasopharyngeal and lung primary carcinomas, but rarely in matched adjacent esophageal and nasopharynx tissues. DLEC1 expression in representative primary ESCC, NPC tumors samples and normal tissues, as measured by semi-quantitative RT-PCR. (E) Detailed BGS analysis of representative tumor samples. (F) Association of DLEC1 methylation and expression with overall survival was analyzed in ESCC and lung cancer samples from TCGA datasets. ESCC: esophageal squamous carcinoma; NPC: nasopharyngeal carcinoma; Ca: carcinoma.
Summary of DLEC1 methylation status in multiple carcinomas
| Samples | Promoter methylation (%) |
|---|---|
| Carcinoma cell lines | |
| Esophageal | 17/18 |
| Nasopharyngeal | 5/5 |
| Lung | 6/9 |
| Primary carcinomas | |
| ESCC (cohort I, paired tumor, Chinese) ESCC (cohort II, Chinese) | 27/41 (66%) 40/83 (48%) |
| NPC (endemic, Chinese) | 37/50 (74%) |
| Lung Ca | 35/61 (57%) |
| Normal epithelial cell lines (immortalized) | |
| Esophageal (Het-1A, NE1, NE3) | 2/3 |
| Nasopharyngeal (NP69) | 1/1 |
| Normal tissues | |
| Normal nasopharyngeal tissues | 0/3 |
| Paired surgical-margin tissue of ESCC | 0/35 |
There was a significant correlation between DLEC1 methylation with ESCC tumor size and lymph node metastasis, but not with age, gender, stage, grade, or differentiation in our cohort (Table 2). Further analysis of TCGA datasets showed that esophageal and lung cancer patients with low methylation or high expression of DLEC1 had longer survival (Fig. 2F, G). DLEC1 methylation/expression was also significantly associated with disease progression and age of esophageal and lung cancer patients (Table S1, Table S2).
Relationship of DLEC1 methylation and clinicpathological parameters of ESCC patients in Chinese cohort II
| Clinicopathological features | Number (n=83) | methylated | unmethylated | p-value | |||
|---|---|---|---|---|---|---|---|
| Gender | |||||||
| Male | 65 | 33 (50.8%) | 32 (49.2%) | ||||
| Female | 18 | 7 (38.9%) | 11 (61.1%) | 0.372 | |||
| Age | |||||||
| ≤50 | 6 | 4 (66.7%) | 2 (33.3%) | ||||
| >50<65 | 43 | 20 (46.5%) | 23 (53.5%) | ||||
| ≥65 | 34 | 16 (47.1%) | 18 (52.9%) | 0.642 | |||
| Staging | |||||||
| 1 | 26 | 10 (40.0%) | 16 (60.0%) | ||||
| 2 | 42 | 23 (54.8%) | 19 (45.2%) | ||||
| 3 | 15 | 7 (46.7%) | 8 (53.3%) | 0.422 | |||
| Grade | |||||||
| Ⅰ | 12 | 4 (33.3%) | 8 (66.7%) | ||||
| Ⅱ | 15 | 8 (53.3%) | 7 (46.7%) | 0.707 | |||
| Ⅲ | 43 | 22 (51.2%) | 21 (48.8%) | ||||
| IV | 13 | 6 (46.2%) | 7 (53.8%) | ||||
| Tumor size | |||||||
| <2.0 cm | 4 | 0 | 4 (100%) | ||||
| ≥2.0 cm≤5.0cm | 68 | 32 (47.1%) | 36 (52.9%) | ||||
| >5.0cm | 11 | 8 (72.7%) | 3 (27.3%) | 0.041 | |||
| Lymph node metastasis | |||||||
| Present | 24 | 16 (66.7%) | 8 (33.3%) | ||||
| Absent | 59 | 24 (40.7%) | 35 (59.3%) | 0.032 | |||
| Distant metastasis | |||||||
| Present | 1 | 1 (100%) | 0 | ||||
| Absent | 82 | 39 (47.6%) | 43 (52.4%) | 0.482 | |||
| Differentiation | |||||||
| Poorly differentiated | 6 | 4 (66.7%) | 2 (33.3%) | ||||
| Moderately Differentiated | 54 | 27 (50.0%) | 27 (50.0%) | ||||
| Well differentiated | 23 | 9 (39.1%) | 14 (60.9%) | 0.439 | |||
We also compared the DLEC1 methylation status with other well-known TSGs at the 3p21-22 locus (PLCD1, RASSF1A, ZMYND10) in ESCC cell lines and primary tumors. DLEC1 (23/35, 66%) appears to have the highest rate of promoter methylation in these tumors compared to PLDC1 (14%), RASSF1A (20%) and ZMYND10 (35%) (Table S3). DLEC1 methylation was also detected in 74% (37/50) of NPC tumors but no (0/3) normal nasopharyngeal tissues, as well as in 57% (35/61) of lung carcinomas (Fig. 2D, Table 1). Promoter methylation was further confirmed by BGS, with densely methylated promoter alleles detected in representative tumors but only rare scattered methylated CpG sites detected in normal tissues (Fig. 2D, Fig. S5C). These results indicate the importance of tumor-specific DLEC1 methylation in the pathogenesis of ESCC and other carcinomas.
Alternative splicing of DLEC1 in cell lines and tissues
As alternative splicings of DLEC1 have been reported previously in tumor and normal tissues [12], we also examined the aberrant splicing of DLEC1 in carcinoma and normal cell lines in addition to normal tissues. Amplicons generated by primers (listed in Table S4) on exon 5 and 9 had 2 major bands, one wild-type (WT) and one novel aberrant splicing (T1), in most tumor cell lines and normal tissues (Fig. S7). In splice variant T1 (NCBI accession number: AY789462), exon 8 was spliced out resulting in in-frame deletion with the exception of L479→V421 (ttg→gtg). Amplicons generated by primers on exon 10 and 13 included one WT and 3 spliced forms: DLEC1S1, DLEC1S2 [12] and a novel splicing DLEC1T2 (NCBI accession number: AY789463). For DLEC1T2, exon 11 and frame 1 of exon 13 were spliced out (Fig. S7), producing a protein identical to DLEC1S1 [12]. Amplifying larger fragments using primers on exon 5 and 13 detected another transcript variant DLEC1T3 (NCBI accession number: AY789464), lacking exons 8, 9, 11 and frame 1 of exon 13, with its translation stopped at exon 10 with premature truncation (Fig. S7).
We found that all four DLEC1 splice variants are expressed in examined tissues and cell lines with varied expression levels. The expression levels of these splice variants were also higher in most normal tissues than that observed in tumor cell lines (Fig. S7), indicating that the downregulation of DLEC1 splice variants may also be involved in tumor pathogenesis.
DLEC1 inhibits carcinoma cell proliferation and induces apoptosis
The tumor-specific promoter methylation of DLEC1 indicates its critical role in multiple carcinoma pathogenesis. We thus further evaluated its tumor suppressor functions in ESCC and other carcinomas. As confirmed by Western blot, the ectopic expression level of DLEC1 was similar to its physiological expression level in normal tissues and immortalized esophageal epithelial cells (Fig. 2B). Monolayer colony formation assay showed significant reduction (down to ~10-40%) in colony numbers and sizes in ESCC, lung and NPC carcinoma cells with ectopically expressed DLEC1 (Fig. 3A, B. Fig. S8A), compared to controls. Cell proliferation assay exhibited slower growth rates in multiple carcinoma cells stably-expressing DLEC1 (Fig. 3C). The clonogenicity results indicate that DLEC1 does have strong growth inhibitory activity in ESCC and other carcinoma cells.
DLEC1 inhibits the growth of esophageal and other carcinoma cells. (A) Representative colony formation assay by monolayer culture in DLEC1-expressing ESCC, NPC and lung carcinoma cells. Quantitative analyses of colony numbers are shown as values of mean ± SD. ***p < 0.001. (B) DLEC1 expression was measured by Western blot. (C) Cell proliferation assay comparing the proliferation rates of multiple carcinoma cells stably-expressing DLEC1. At each indicated time point, cell viability was determined and represented as the degree of absorbance at 570 nm using MTT assay. The mean ± SD absorbance (triplicate wells) for each time point is plotted against days after seeding. C1: clone 1, C2: clone 2. (D) Representative cell cycle and flow cytometry data are shown (left panel). Cell apoptosis was examined by flow cytometry analysis with Annexin V-FITC and propidium iodide (PI) doubles staining (right panel). Values are the mean ± SD of three independent experiments. *p < 0.05, **p < 0.05. (E) Upregulation of apoptotic markers (cleaved-PARP and caspase 3) detected by Western blot.
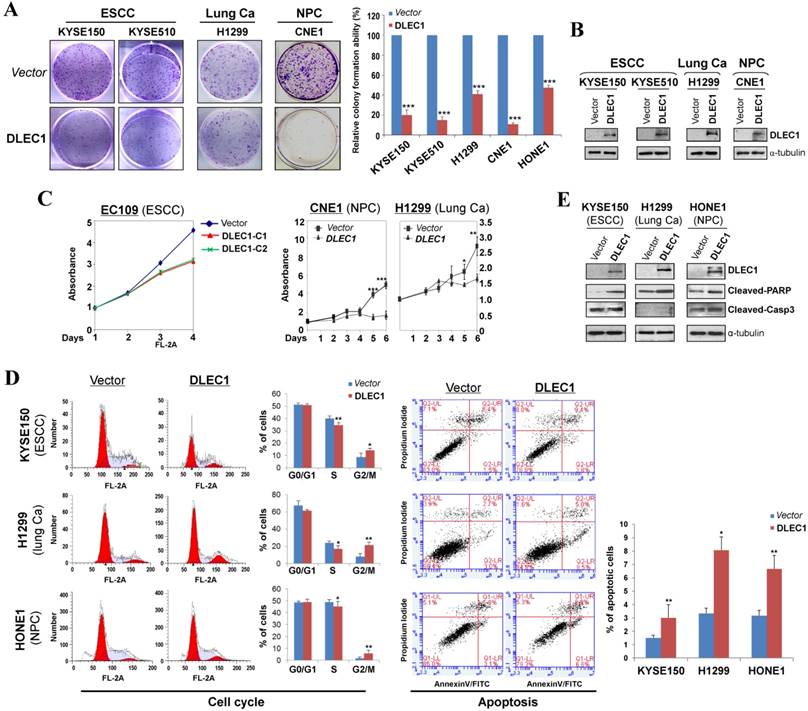
To explore the mechanism of its growth inhibition, we next examined the effects of DLEC1 expression on carcinoma cell apoptosis and cell cycle distribution. Cell cycle analysis by propidium iodide incorporation showed that DLEC1-expressing KYSE150, H1299 and HONE1 cells obviously had increased G2-M phase cells and decreased S phase cells, indicating that DLEC1 expression induces G2-M arrest in multiple carcinoma cells (Fig. 3D). Cell apoptosis assay showed that apoptotic cells significantly increased after being transfected with DLEC1-expression vector (Fig. 3D), as further confirmed by the increase in apoptosis markers (cleaved caspase-3 and PARP) by Western blot (Fig. 3E). Thus, DLEC1 suppresses carcinoma cell growth through inducing cell cycle arrest and apoptosis.
DLEC1 suppresses cell migration/invasion through reversing EMT and cell stemness
We further assessed the effects of DLEC1 on carcinoma cell migration and invasion. Ectopic expression of DLEC1 dramatically suppressed the migration and invasion of ESCC, lung and NPC carcinoma cells in transwell assays (Fig. 4A, B). DLEC1-expressing cells also showed less proficiency in closing artificial wounds than mock cells on a confluent monolayer in scratch wound-healing invasion assays (Fig. S8B). Meanwhile, we observed dramatic morphological changes in DLEC1-expressing carcinoma cells, with similar cobblestone-like appearance as normal epithelial cells (Fig. 4C). Moreover, expression of DLEC1 disassembled the formation of actin stress fibers in carcinoma cells (Fig. 4D).
DLEC1 suppresses cell migration and invasion of esophageal and other carcinoma cells, with transwell (A) migration and (B) invasion assay of DLEC1-expressing tumor cells. Migrated and invaded cells at the lower surface of the transwell filter were stained and counted. **p < 0.001, ***p < 0.0001. Original magnification, ×252. Scale bar 100 μm. (C) Morphology changes of H1299 cells after ectopic DLEC1 expression. Original magnification, ×252. Scale bar 100 μm. (D) Impaired actin stress fiber organization in DLEC1-expressing H1299 cells. (E) Indirect immunofluorescence detecting the expression of E-cadherin and vimentin. Original magnification, ×400. Scale bar 20 μm. (F) Western blot showing the expression of EMT markers (E-cadherin, vimentin) and metastasis markers (MMP7, Twist) in DLEC1- or vector-transfected cells. For the internal controls refer to Figure 3B. (G) Downregulation of representative stem cell markers in DLEC1-expressing carcinoma cells by qPCR. *p < 0.05, **p < 0.01.
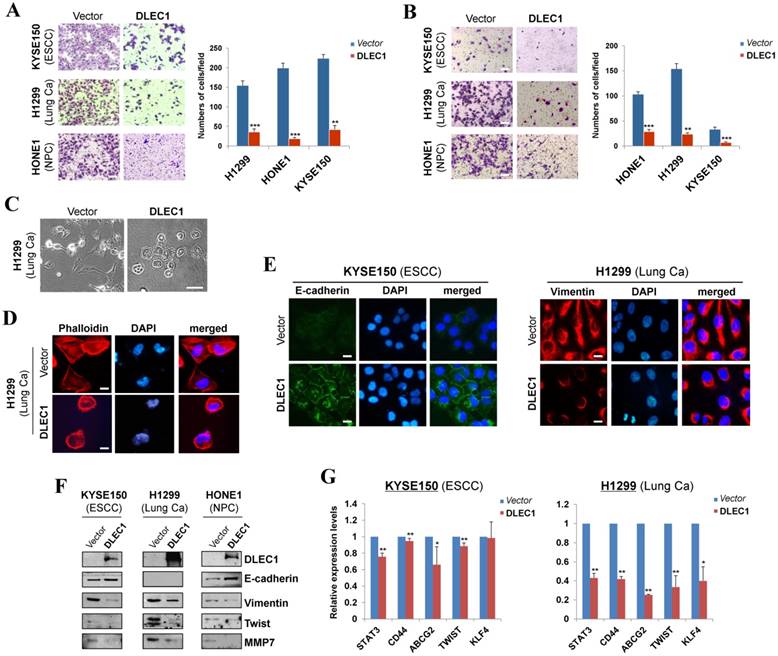
We then investigated whether DLEC1 regulates epithelial mesenchymal transition (EMT) in carcinoma cells. DLEC1-expressing cells adopted an epithelial morphology, concomitant with gain of epithelial marker E-cadherin and loss of mesenchymal marker vimentin (Fig. 4E). Upregulated E-cadherin and downregulated vimentin and metastasis markers (MMP7, Twist) were also confirmed by Western blot (Fig. 4F). As cells generate stem-like properties during EMT, we further examined the regulatory effect of DLEC1 on carcinoma cell stemness. Stem cell markers (STAT3, CD44, ABCG2, TWIST and KLF4) were downregulated in ESCC and lung carcinoma cells after DLEC1 expression, with the effect more potent in lung carcinoma cells (Fig. 4G). These results clearly indicate that DLEC1 possesses anti-metastatic ability through reversing EMT and stemness of carcinoma cells.
DLEC1 represses oncogenic signaling pathways in carcinoma cells
We examined the subcellular localization of DLEC1 in KYSE410 (endogenous) and H1299 (ectopically expressed) cells using the DLEC1 antibody. Immunostaining showed that DLEC1 is mainly located in the cytoplasm of examined cells (Fig. 5A). Its cytoplasmic localization was also clearly demonstrated by confocal microscopy in U-2 OS cells from Human Protein Atlas database, with the same DLEC1 antibody used (Fig. 5A).
DLEC1 as a cytoplasmic protein regulates multiple cell signaling pathways. (A) Subcellular localization of DLEC1 (green) in cell cytoplasm of carcinoma cells. DAPI counterstaining (blue) was used to visualize nuclear DNA. Images of osteosarcoma cell line U-2 OS were retrieved from Human Protein Atlas database. Original magnification, ×400. Scale bar 10 μm. (B) Promoter luciferase activities of NF-κB, AP-1, STATs-bs, TopFlash, SRE and PAI-1 reporters were normalized to the values of Renilla luciferase activity in tumor and immortalized normal cell lines. Results are expressed as fold reduction of activity and shown as means ± SD of three independent experiments performed in triplicate. *p < 0.05, **p < 0.01. (C) DLEC1 inhibited the phosphorylation levels of ERK, AKT and STAT3. Western blot was used to examine protein levels of total ERK, p-ERK (Thr202/Tyr204), total AKT, p-AKT(ser473), total STAT3, p-STAT3 (Tyr705, Ser727), total β-catenin and active β-catenin in DLEC1-expressing multiple carcinoma cells. (D) Results are expressed as ratio between phosphorylated/activated (p-ERK, p-AKT, p-STAT3 (Tyr705), Active-β-catenin) and non-phosphorylated/total (ERK, AKT, STAT3, β-catenin) forms. Three different experiments were performed and data are expressed as mean ± SD. *p < 0.05, **p < 0.01, ***p < 0.001.
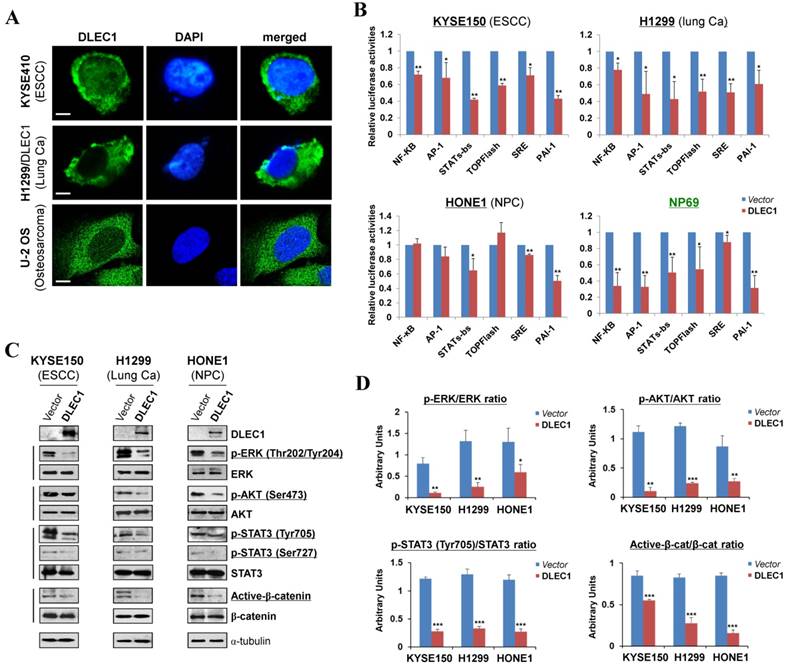
To gain more insight into the mechanisms underlying tumor suppression by DLEC1, luciferase reporter assay was used to examine its effects on oncogenic signaling pathways in carcinoma cells. Results showed that ectopic expression of DLEC1 markedly repressed the reporter activities of NF-κB, AP-1, STATs-bs, TopFlash, SRE and PAI-1 elements-regulated promoters in either carcinoma cells (ESCC, lung, NPC) or immortalized normal epithelial cells (NP69) (Fig. 5B). Western blot confirmed significantly decreased levels of p-ERK (Thr202/Tyr204), p-AKT (Ser473), p-STAT3 (Tyr705 and Ser727) and active-β-catenin in DLEC1-expressing carcinoma cells (Fig. 5C, D). These results indicate that DLEC1 is able to repress multiple oncogenic signaling pathways, including JAK/STAT3, MAPK/ERK, AKT, Wnt/β-catenin and TGF-β signaling during the tumorigenesis of multiple carcinomas.
DLEC1 suppresses STAT3 phosphorylation in multiple carcinoma cells
We further investigated the regulation of STAT3 signaling by DLEC1 in more detail. Carcinoma cells were co-transfected with DLEC1- and STAT3C (a constitutive active form of STAT3)-expression plasmids. Exogenously expressed DLEC1 greatly suppressed the p-STAT3 levels at both Tyr705 and Ser727 sites in STAT3C-transfected carcinoma cells, with no changes in STAT3 total protein levels (Fig. 6A). Marked decrease of p-STAT3 (Tyr705), in a dose-dependent manner, was observed in carcinoma cells transfected with increasing doses of DLEC1-expressing plasmids (Fig. 6B).
DLEC1 inhibits STAT3 signaling activation through suppressing its phosphorylation in tumor cells. Expression levels of p-STAT3 (Tyr705, Tyr727) and STAT3 were assessed by Western blot in cells transfected with (A) both DLEC1 and STAT-3C; and (B) different dose of DLEC1 expression plasmid. (C) Overexpression of DLEC1 decreases IL-6-induced p-STAT3 level. KYSE150 and H1299 cells were treated with or without IL-6 (10 ng/mL) for 30 min. Phosphorylated and total STAT3 levels were examined. (D) Heat-map showing the expression pattern of DLEC1 and IL-6/STAT3 signaling molecules in ESCC and lung carcinoma patients (Oncomine database).
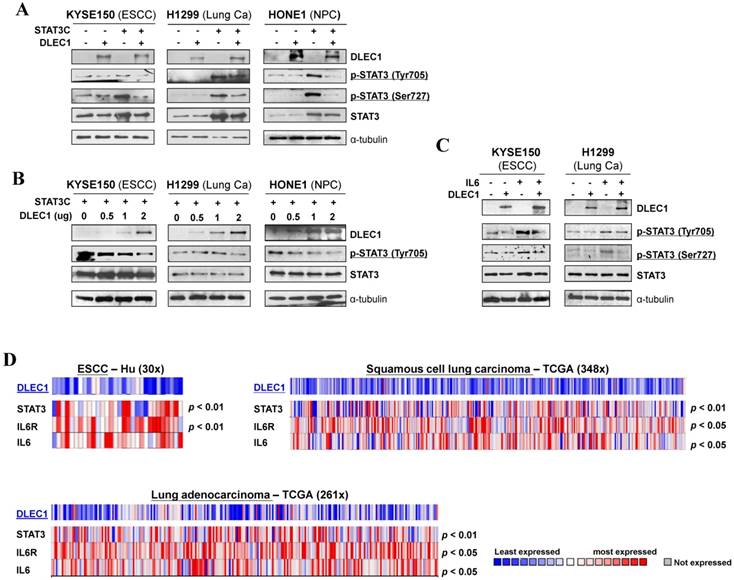
Moreover, DLEC1 was even able to suppress IL-6 treatment-enhanced STAT3 phosphorylation levels in carcinoma cells, without affecting STAT3 total protein level (Fig. 6C). We thus further analyzed online the co-expression of DLEC1 and STAT3 signaling molecules in multiple carcinomas, and found that DLEC1 underexpression is indeed associated with elevated expression of STAT3, IL-6 and IL-6R in ESCC and lung carcinoma patients (p < 0.05, p < 0.01) (Fig. 6D), indicating inhibitory regulation of STAT3 signaling activation by DLEC1. These results suggest that DLEC1 indeed suppresses STAT3 signaling activation through reducing its phosphorylation levels in multiple carcinoma cells.
DLEC1 binds to STAT3, which interferes with its interaction with JAK2
To investigate the mechanism of STAT3 phosphorylation suppression by DLEC1, we analyzed the structure basis for possible interaction between DLEC1 and STAT3. RCSB Protein Data Bank (PDB) was used to search for structures and folds related to DLEC1 and STAT3 (Fig. 7A). As the DLEC1 N-terminal PDB is similar to phosphatase, we thus performed computational docking analysis for DLEC1 and STAT3 via the ZDOCK server [32]. Following docking of these two proteins without residue selection, two highest-scored predicted models of interaction between DLEC1 (PDB id: 2E6J) and STAT3 (PDB id: 1BG1and 4E68) were discovered (Fig. 7B, C), while STAT3 (PDB id: 1BF5) failed to dock with DLEC1 due to its large molecule size. This docking analysis reveals the 3D structural basis for possible interaction between the DLEC1 and STAT3 proteins.
DLEC1 binds to STAT3 and blocks its interaction with JAK2. (A) Predicted models of DLEC1-STAT3 protein docking. 3D structure of DLEC1 and STAT3 PDB are shown. The N-terminal of DLEC1 (residues 108-165) resembles the solution structure of the C-terminal PapD-like domain of human HYDIN protein (protein phosphatase 1) (PDB id: 2E6J), while its C-terminal (residues 806-857) yields 7 matches to respiratory complex I or bovine mitochondrial super-complex. Fourteen structural similarities were observed for STAT3 PDBs, with only three covering the tyrosine residue Y705 (PDB id: 1BG1, 1BF5, 4E68). (B, C) Three dimensional protein models of interaction between DLEC1 and STAT3 proteins. DLEC1 (PDB id: 2E6J) and STAT3 (PDB id: 1BG1, 1BF5 and 4E68) were predicted by ZDOCK server. Grey represents DLEC1 PDB; Color represents STAT3 PDB. (D) Association of endogenous DLEC1 and STAT3 proteins in HEK293T cells. Lysates of HEK293T cells were subjected to IP with DLEC1, STAT3 or JAK2 antibodies. DLEC1 interacts and interferes with STAT3-JAK2 complex. Flag-DLEC1 was transfected in (E-G) multiple carcinoma cells and (H) HEK293T cells for IP with anti-STAT3, anti-Flag or anti-JAK2 antibody. 5% of DLEC1-transfected cell lysis for each IP was used as input.
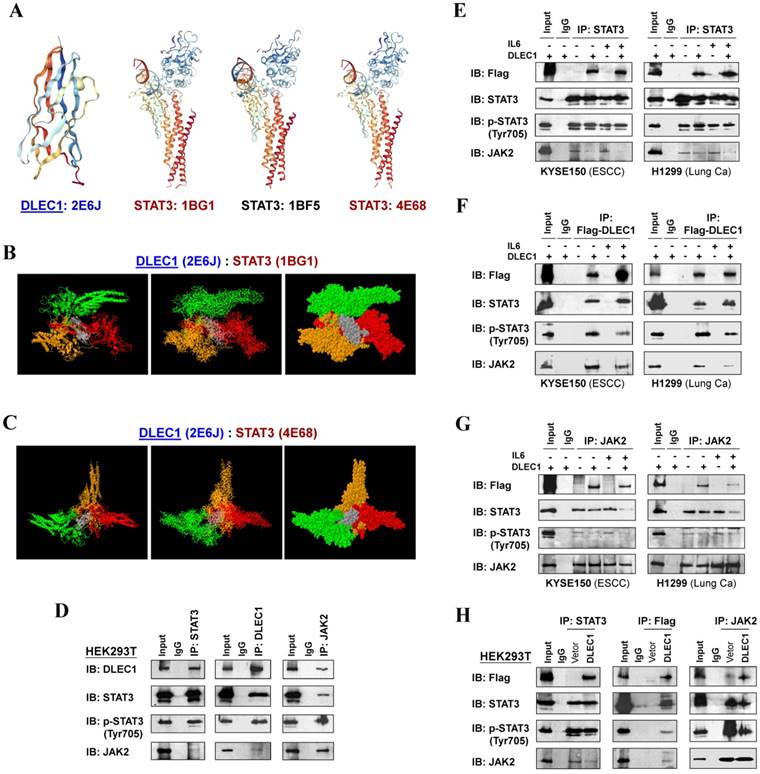
As JAK2 directly phosphorylates STAT3 at Tyr705, we next examined the possible interactions of DLEC1 with STAT3 and JAK2 by reciprocal co-immunoprecipitation (co-IP) experiments with Flag or DLEC1, STAT3 and JAK2 antibodies in carcinoma (KYSE150, H1299) and immortalized cells (HEK293T). Results showed a strong interaction between endogenous DLEC1 and STAT3/p-STAT3 (Tyr705) in HEK293T cells by immunoprecipitation, accompanied by relatively weaker co-precipitation of JAK2. Endogenous JAK2 could also precipitate with both DLEC1 and STAT3/p-STAT3 (Tyr705) (Fig. 7D). Similarly, exogenous DLEC1 could be co-IP with both STAT3/p-STAT3 (Tyr705) and JAK2 (Fig. 7E-H). Moreover, IL-6 stimulation increased the interaction of DLEC1 with STAT3, while decreasing its interaction with JAK2 and p-STAT3 (Tyr705). Thus, DLEC1 inhibited the interaction of STAT3 with JAK2 in an IL-6 dependent manner (Fig. 7E-G). These results suggest that DLEC1 is associated with STAT3 and their binding interferes with JAK2-STAT3 interaction and further STAT3 phosphorylation.
DLEC1 inhibits STAT3 phosphorylation via its YXXQ motif
In agreement with the above computational docking analysis, further protein structure analysis showed that DLEC1 contains three STAT3-specific docking sites - YXXQ motifs (Fig. 8A), indicating that YXXQ motif may mediate the inhibition of STAT3 phosphorylation by DLEC1. DLEC1 was also found to have high homology to multiple chaperone proteins (data not shown). We thus generated a DLEC1-YXXQ mutant (DLEC1-3Y) with mutations of all three YXXQ motifs to investigate the role of these residues in STAT3 phosphorylation. Ectopic expression of the DLEC1-YXXQ mutant DLEC1-3Y led to significant upregulation of p-STAT3 (Tyr705) levels in both KYSE150 and H1299 cells, compared to wild-type controls, with no change observed in total STAT3 protein levels (Fig. 8B), confirming the regulation of STAT3 phosphorylation/signaling by YXXQ motifs of DLEC1.
Roles of the YXXQ motif in DLEC1-mediated inhibition of STAT3 phosphorylation/activation. (A) Localization of the consensus STAT3-binding motifs (YXXQ) in the DLEC1 protein (upper panel). Schematic of the DLEC1-YXXQ mutant was shown (lower panel). (B) DLEC1-YXXQ mutant retained the phosphorylation level of STAT3, which was decreased in DLEC1-expressing cells. KYSE150 and H1299 cells were treated with or without IL-6 (10 ng/mL) for 30 min. Phosphorylated and total STAT3 levels were examined by Western blot. (C-E) The interaction of DLEC1 and its YXXQ mutant with JAK2-STAT3 under IL-6 stimulation by co-IP assay. DLEC1 or DLEC1-YXXQ mutant (DLEC1-3Y) was transfected in HEK293T, KYSE150 and H1299 cells for the IP experiment. 5% of DLEC1-transfected cell lysis for each IP was used as input. (F) A schematic model showing the regulation of oncogenic STAT3 signaling activation by DLEC1. DLEC1 suppresses STAT3 phosphorylation through binding to STAT3 via YXXQ motif and further interring with JAK2-STAT3 interaction.
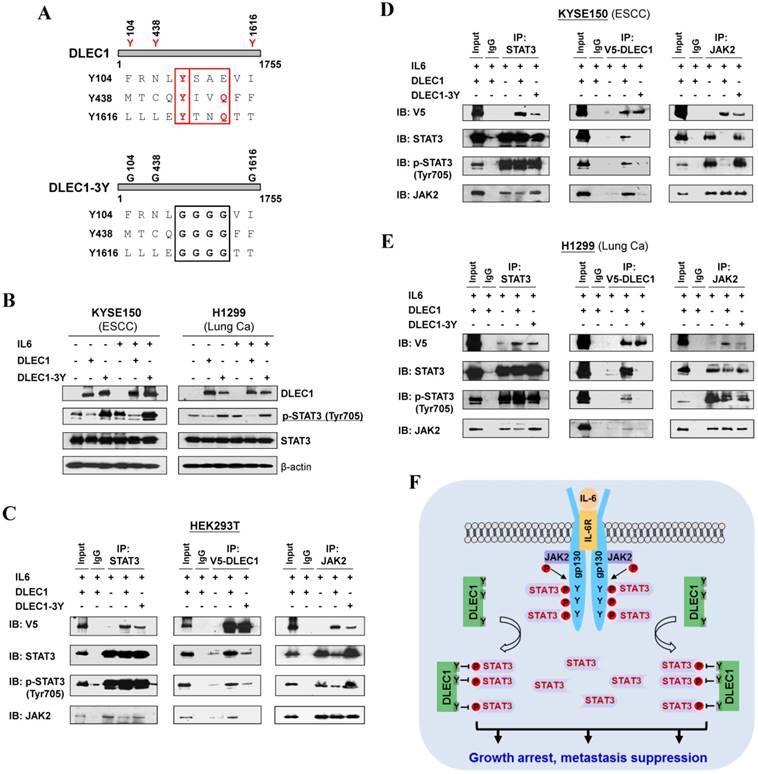
We further examined the effect of YXXQ motifs on DLEC1-STAT3 interaction by co-IP assay. Results showed that the interaction of DLEC1-YXXQ mutant with STAT3/p-STAT3 (Y705) was greatly decreased (Fig. 8C-E), which then enhanced the interaction of STAT3 with JAK2 and led to increased STAT3 phosphorylation. These results suggest that the YXXQ motifs of DLEC1 are critical for STAT3 phosphorylation and signaling activation.
Discussion
This study, for the first time, identified DLEC1 as a methylated 3p22 TSG for esophageal squamous cell carcinoma (ESCC). With its early genetic alterations, the 3p22-21.3 locus is well known for being critical in multiple carcinomas and lymphomas. Several candidate TSGs reside in this locus, including RASSF1A, ZMYND10 [8, 10], FUS1 [33], RBSP3 [34], NPRL2 [35] and PLCD1 [11, 36]. These TSGs were identified through either genetic approaches (LOH, array-CGH, large-scale chromosomal region cloning and gene mapping, genome sequencing), or functional analysis using monochromosome transfer. Nowadays, epigenetic identification of tumor-specific promoter CpG methylation becomes a new efficient way for TSG discovery [22]. Our group has previously identified DLEC1 methylation and silencing in gastric [13], colon [13], hepatocellular [14], renal [37] and prostate [15] cancers, as well as non-Hodgkin and Hodgkin lymphomas [16]. DLEC1 methylation has also been frequently detected in other carcinomas including nasopharyngeal [17], lung [18, 19, 22], breast [20] and ovarian [21].
However, so far there has been no in-depth mechanism study on the molecular basis of its tumor suppression in human cancers yet, although DLEC1 has been shown to possess growth suppressive abilities in multiple carcinoma types (ovarian [21], nasopharyngeal [17], esophageal [12], gastric [13], colon [13], hepatocellular [14] and renal [37]). DLEC1 also inhibits NPC cell tumorigenic potential in vivo [17]. Some preliminary mechanisms on its tumor suppression have been proposed. For example, DLEC1 contains 27 potential casein kinase II (CK2) phosphorylation sites, which deregulates cell proliferation, migration and signaling [13]. A bipartite nuclear localization signal (NLS) spanning aa 245-262 is present in DLEC1, but no transcription factor function has been detected [14]. DLEC1 also induces cell cycle arrest in tumor cells [14]. We previously also showed that in prostate cancer, DLEC1 inhibited NF-κB transcription activity, upregulated p53-binding activity and induced cell apoptosis [15].
Here, our study has comprehensively analyzed the cancer-related signaling possibly regulated by DLEC1. DLEC1 was found to suppress multiple oncogenic signaling pathways, including JAK/STAT3, MAPK/ERK, AKT, Wnt/β-catenin and TGF-β signaling. Constitutive activation of JAK/STAT3 signaling contributes to multiple tumor initiation and progression, which is maintained by a few positive or negative regulators. The YXXQ motif is crucial for STAT3 activation in response to multiple signaling receptors through phosphorylation at its Tyr 705 and Ser727 sites. Studies have shown that chaperone proteins are involved in the regulation of STAT signaling [38, 39]. For example, acylglycerol kinase potentiates JAK2/STAT3 signaling in ESCC [40]; Epstein-Barr virus (EBV)-encoded proteins constitutively activated STAT3 in NPC [41, 42]; and, EGFR mutation mediates STAT3 activation via IL-6 production in lung cancer [43]. However, far fewer negative regulators of STAT3 signaling have been reported in ESCC, NPC and lung cancer so far, unlike other carcinomas. We discovered the structural basis for direct regulation of STAT3 by DLEC1, including three YXXQ motifs, resembling phosphatase and chaperone proteins, suggesting its possible binding to STAT3 and regulation of its dephosphorylation. Our experimental data further demonstrated that DLEC1 negatively regulates STAT3 activation through docking and binding to STAT3 and further inhibiting its phosphorylation (Fig. 8F). Whether the suppression of STAT3 phosphorylation by DLEC1 is due to its phosphorylation inhibition or enhanced de-phosphorylation should be further investigated.
We discovered that promoter CpG methylation of DLEC1 directly mediates its silencing/downregulation in multiple carcinomas, with histone acetylation also playing some role in DLEC1 regulation. Epigenetic silencing has been found to be the predominant cause of DLEC1 inactivation, as only rare mutations of DLEC1 have been detected in multiple carcinoma tissues from TCGA cohorts even with large sample sizes, suggesting a dominant role of epigenetic disruption of DLEC1 in carcinoma pathogenesis. In this study, we also found four alternative splicings of DLEC1; however, further investigations of these variants are needed, including their functional significance, relative proportion to other longer functional transcripts, as well as possible connection between the splicing and CpG methylation of the DLEC1 gene body.
Compared with other known methylated 3p22-21.3 TSGs, DLEC1 has relatively higher methylation frequency in ESCC, further supporting its critical role in ESCC pathogenesis. The previous failure of detecting DLEC1 methylation first in Japanese ESCC tumors may be due to a technical issue [12], or less likely ethnic difference since our ESCC samples are of Chinese origin. As DLEC1 methylation is tumor-specific in ESCC and detectable even in immortalized normal esophageal epithelial cells, it might serve as a non-invasive epigenetic biomarker for the early detection of ESCC. We also found that DLEC1 methylation is correlated with ESCC recurrence and progression, suggesting its potential even as a marker for prognosis prediction in carcinoma patients. In parallel, DLEC1 methylation has been shown to be of good biomarker value in other malignancies, including non-small cell lung [18, 19], gastric [44], hepatocellular [14], renal [37] and oral carcinomas [45], as well as pre-invasive lesions of breast cancer [20]. Moreover, DLEC1 methylation has been detected in plasma samples from lung cancer patients, and sera of Hodgkin lymphoma patients [16].
In summary, our study demonstrates the first evidence of predominant, tumor-specific, DLEC1 methylation in ESCC with its biomarker value. As a critical 3p22 TSG regulated by p53, DLEC1 inhibits the growth and metastasis of multiple carcinoma cells through binding to STAT3 and inhibiting its phosphorylation, and also suppressing other oncogenic signaling pathways. The YXXQ motifs of DLEC1 are crucial for STAT3 phosphorylation. Our identification of DLEC1 as a negative regulator of STAT3 signaling reveals a mechanistic link between 3p22 alteration and oncogenic STAT3 signaling activation in multiple carcinoma pathogeneses.
Materials and Methods
Cell lines, tissue samples and demethylation treatment
A panel of ESCC, NPC and lung carcinoma cell lines was used. Immortalized normal esophageal epithelial (NE1, NE3, Het-1A), normal nasopharynxgeal epithelial (NP69) and HEK293T cell lines were used. Cell lines were maintained in RPMI or DMEM medium (Gibco BRL, Rockville, MD) with 10% fetal bovine serum. Human normal adult tissue RNA samples were obtained commercially (Stratagene, La Jolla, CA, or Millipore Chemicon, Billerica, MA). Primary carcinoma tissues of Chinese ESCC, NPC and lung, some with matched normal samples, have been descried before [46-49]. Cell lines were treated with 5 μM of 5-Aza-2'-deoxycytidine (Aza) (Sigma, St. Louis, MO) for 3 days, or even followed with ~16 h additional TSA (final concentration 10 mM) treatment as described [46, 47].
Establishment of CpG methylomes of cell lines and carcinoma samples
Methylated DNA immunoprecipitation (MeDIP) coupled with promoter microarray hybridization (MeDIP-chip) was performed as previously [50, 51]. Briefly, methylated DNA of ESCC (HKESC1, KYSE410) and NPC cell lines (HK1), as well as immortalized esophageal and nasopharyngeal epithelial cells (NE083, NP69) were immunoprecipited by monoclonal antibody against 5-methylcytidine (33D3, Diagenode, Seraing, Belgium), and then hybridized to NimbleGen™ HG18 Meth (385K CGI plus) promoter arrays (Array Star, Inc., MD). Bioinformatics analysis of methylome data was performed as previously described [50, 51].
Illumina 27K DNA methylation microarray was conducted previously [30]. DLEC1 methylation status was analyzed accordingly.
Bisulfite treatment and promoter methylation analysis
MSP and BGS were conducted according to our previous reports [46, 47]. MSP and BGS primers are listed in Table S4. MSP was conducted for 40 cycles at the annealing temperatures of 60°C for M and 58°C for U. Amplified products from BGS primer set were cloned into pCR4-Topo vector (Invitrogen, Carlsbad, CA), with 6-8 colonies randomly chosen and sequenced.
Construction of DLEC1 expression plasmids and transfection
Four pairs of primers (Table S4) were used to generate 4 DLEC1 fragments based on published DLEC1 sequence (GenBank accession number AB020522). Reverse transcription was carried out using normal testis RNA as template (BD Biosciences, Palo Alto, CA). The 4 product fragments were ligated to generate pcDNA3.1(+)-Flag-DLEC1 and pCMV-Flag-DLEC1-V5 expression plasmids. The mutation for three YXXQ motifs of DLEC1 (DLEC1-3Y, YXXQ-GGGG) was introduced by PCR into pCMV-Flag-DLEC1-V5 vector, with sequence confirmed. STAT3C expression plasmid was a gift from Prof. Honglin Chen (University of Hong Kong) [41]. Cells were transfected with lipofectamine 3000 (Invitrogen, Carlsbad, CA), and the cells were cultured in RPMI 1640 supplemented with 10% FBS and selected in 400 μg/mL of G418 for 20-30 days to establish some stable cell pools, with confirmed DLEC1 expression.
Colony formation and cell proliferation assays
Colony formation assay was conducted as previously described [49]. All experiments were performed in triplicate wells 3 times. To monitor cell proliferation, 1000 cells were plated in a 96-well plate and incubated at 37°C in selective media for 3-(4,5-dimethylthiazolyl-2)-2,5-diphenyltetrazolium bromide (MTT) assay.
Cell cycle and apoptosis analysis
Flow cytometry analysis of cell cycle and apoptosis was described previously [11]. Cells were stained with propidium iodide (PI) and Annexin V-FITC (BD Biosciences, Bedford, MA), and sorted by Accuri C6 (BD Biosciences, Bedford, MA) according to the manufacturer's protocol.
Migration and matrigel invasion assays
Transwell migration and invasion assays were performed as previously described [32, 40]. The numbers of migrated or invaded cells were observed and counted using a light microscope. Five fields were randomly chosen and the numbers of penetrated cells were counted.
Antibodies, proteins, Western blot and immunoprecipitation (IP)
Antibodies used were: cleaved caspase-3 (#9661), cleaved poly (ADP-ribose) polymerase (#9541), AKT-total (#4691), phospho-AKT(Ser473) (#4060), JAK2 (#9945S), phospho-SAPK/JNK (Thr183/Tyr185) (#6251S), STAT3 (#9139S), phospho-STAT3 (Tyr705) (9145S) and phospho-STAT3 (Ser 727), E-cadherin (#4065) (9134) (Cell Signaling, Beverly, MA); Flag M2 (F3165), Vimentin (V6630), DLEC1 (HPA019077) and β-actin (AC-74) (Sigma-Aldrich, St. Louis, MO); anti-mouse Ig G-HRP (P0161), anti-rabbit Ig G-HRP (P0448) (Dako ,Glostrup, Denmark); Twist (sc-15393; Santa Cruz, CA, USA); a-tubulin (Lab Vision Corporation, Fremont, CA); V5-Tag (MCA1360; AbD Serotec, Raleigh, NC).
Human IL-6 (PF01229) (Peprotech, Rocky Hill, NJ) was used. Western blot and IP experiments were performed according to previous protocols [48, 49].
Protein-protein docking analysis
To find possible interaction in 3D structure between DLEC1 and STAT3, RCSB Protein Data Bank online tool (http://www.rcsb.org/pdb/home/home.do) was firstly used to predict 3D structures of DLEC1 and STAT3. Protein-protein docking was conducted using the Z-DOCK server (http://zdock.umassmed.edu/), which provides 5 top models regarding possible interaction between two proteins.
Statistical Analysis
All statistical analyses were conducted with R-3.3.0 (http://www.r-project.org). Statistical significance was defined as p value < 0.05. Basic statistical tests and generation of boxplots and scatterplots were performed by using built-in functions including the base distribution of R. Survival analyses and the generation of related plots were performed by using the survival package v2.41-3 (https://cran.r-project.org/web/packages/survival/index.html). Kaplan-Meier method was used to estimate the overall survival of patients; log-rank test was used to compare survival distributions of groups of patients with different levels of DNA methylation or gene expression.
For expression data, log2 transformed and normalized values were used. For methylation data, the β-value, a measure of DNA methylation level ranging from 0 to 1 for completely unmethylated to completely methylated, was used. The correlation of DNA methylation with gene expression or continuous numerical clinical features was investigated by calculating Spearman's rank correlation coefficients and two-tailed p values using the 'cor.test' function in R. For two groups (mutant or wild-type) of DNA methylation, gene expression or clinical data, Wilcoxon rank sum test was applied to calculate two-tailed p values using the 'wilcox.test' function in R. For data with more than two groups, Kruskal-Wallis rank sum test was applied to calculate the P values using the 'kruskal.test' function in R.
Abbreviations
ESCC: esophageal squamous cell carcinoma; NPC: nasopharyngeal carcinoma; TSG: tumor suppressor gene; SOCS: suppressors of cytokine signaling; PTPs: protein tyrosine phosphatases; aCGH: array comparative genomic hybridization; MeDIP: methylated DNA immunoprecipitation; CGI: CpG island; BGS: bisulfite genomic sequencing; MSP: methylation-specific PCR; Aza: 5-aza-2'-deoxycytidine; TSA: Trichostatin A; EMT: epithelial mesenchymal transition; PDB: protein data bank; co-IP: co-immunoprecipitation; CK2: casein kinase II; NLS: nuclear localization signal; MTT: 3-(4,5-dimethylthiazolyl-2)-2,5-diphenyltetrazolium bromide.
Supplementary Material
Supplementary figures and tables.
Acknowledgements
We thank DSMZ (German Collection of Microorganisms & Cell Cultures) for some KYSE cell lines (Shimada et al., Cancer 69: 277-284 (1992), Prof. George Tsao for some cell lines and samples; Dr. Cordelia Langford (Wellcome Trust Sanger Institute, Cambridge, UK) for aCGH slides, and Dr. TJ Seng (Johns Hopkins Singapore) for valuable help in aCGH analysis. The study was supported by RGC (TBRS #T12-401/13R), China Natural Science Foundation (NSFC #81572327), Johns Hopkins Singapore, and VC special research fund from The Chinese University of Hong Kong.
Author Contributions
QT, LL conceived the study; LL, JX, GQ, JY, ZD, TX acquired and analyzed data; KYW, GS, XFZ, TSM, ATC, FKC and RFA provided materials and reviewed the manuscript; LL, JX, GQ, QT drafted the manuscript; QT, LL finalized the manuscript.
Conflict of Interest
TSKM has received honoraria from Boehringer Ingelheim, BioMarin Pharmaceuticals, AstraZeneca, Roche/Genentech, Pfi zer, Eli Lilly, Merck Serono, Merck Sharp & Dohme, Janssen, Clovis Oncology, GlaxoSmithKline, Novartis, SFJ Pharmaceutical, ACEA Biosciences, Vertex Pharmaceuticals, Bristol-Myers Squibb, AVEO & Biodesix, Prime Oncology, and Amgen; advisory board fees from AstraZeneca, Roche/Genentech, Pfi zer, Eli Lilly, Boehringer Ingelheim, Merck Serono, Merck Sharp & Dohme, Janssen, Clovis Oncology, BioMarin, GlaxoSmithKline, Novartis, SFJ Pharmaceutical, ACEA Biosciences, Vertex Pharmaceuticals, AVEO & Biodesix, and Bristol-Myers Squibb; and is a shareholder in Sanomic.
ATC received honoraria from consulting or Advisory role at Merck, Taiho Pharmaceutical, Roche, Amgen and received research funding from Boehringer Ingelheim, Bristol-Myers Squibb, Eli Lilly, Pfizer.
References
1. Naylor SL, Johnson BE, Minna JD, Sakaguchi AY. Loss of heterozygosity of chromosome 3p markers in small-cell lung cancer. Nature. 1987;329:451-4
2. Kovacs G, Erlandsson R, Boldog F, Ingvarsson S, Muller-Brechlin R, Klein G. et al. Consistent chromosome 3p deletion and loss of heterozygosity in renal cell carcinoma. Proc Natl Acad Sci U S A. 1988;85:1571-5
3. Ogasawara S, Maesawa C, Tamura G, Satodate R. Frequent microsatellite alterations on chromosome 3p in esophageal squamous cell carcinoma. Cancer Res. 1995;55:891-4
4. Sato T, Akiyama F, Sakamoto G, Kasumi F, Nakamura Y. Accumulation of genetic alterations and progression of primary breast cancer. Cancer Res. 1991;51:5794-9
5. Huang DP, Lo KW, Choi PH, Ng AY, Tsao SY, Yiu GK. et al. Loss of heterozygosity on the short arm of chromosome 3 in nasopharyngeal carcinoma. Cancer Genet Cytogenet. 1991;54:91-9
6. Hesson LB, Cooper WN, Latif F. Evaluation of the 3p21.3 tumour-suppressor gene cluster. Oncogene. 2007;26:7283-301
7. Dammann R, Li C, Yoon JH, Chin PL, Bates S, Pfeifer GP. Epigenetic inactivation of a RAS association domain family protein from the lung tumour suppressor locus 3p21.3. Nat Genet. 2000;25:315-9
8. Agathanggelou A, Dallol A, Zochbauer-Muller S, Morrissey C, Honorio S, Hesson L. et al. Epigenetic inactivation of the candidate 3p21.3 suppressor gene BLU in human cancers. Oncogene. 2003;22:1580-8
9. Chow LS, Lo KW, Kwong J, To KF, Tsang KS, Lam CW. et al. RASSF1A is a target tumor suppressor from 3p21.3 in nasopharyngeal carcinoma. Int J Cancer. 2004;109:839-47
10. Qiu GH, Tan LK, Loh KS, Lim CY, Srivastava G, Tsai ST. et al. The candidate tumor suppressor gene BLU, located at the commonly deleted region 3p21.3, is an E2F-regulated, stress-responsive gene and inactivated by both epigenetic and genetic mechanisms in nasopharyngeal carcinoma. Oncogene. 2004;23:4793-806
11. Hu XT, Zhang FB, Fan YC, Shu XS, Wong AH, Zhou W. et al. Phospholipase C delta 1 is a novel 3p22.3 tumor suppressor involved in cytoskeleton organization, with its epigenetic silencing correlated with high-stage gastric cancer. Oncogene. 2009;28:2466-75
12. Daigo Y, Nishiwaki T, Kawasoe T, Tamari M, Tsuchiya E, Nakamura Y. Molecular cloning of a candidate tumor suppressor gene, DLC1, from chromosome 3p21.3. Cancer Res. 1999;59:1966-72
13. Ying J, Poon FF, Yu J, Geng H, Wong AH, Qiu GH. et al. DLEC1 is a functional 3p22.3 tumour suppressor silenced by promoter CpG methylation in colon and gastric cancers. Br J Cancer. 2009;100:663-9
14. Qiu GH, Salto-Tellez M, Ross JA, Yeo W, Cui Y, Wheelhouse N. et al. The tumor suppressor gene DLEC1 is frequently silenced by DNA methylation in hepatocellular carcinoma and induces G1 arrest in cell cycle. J Hepatol. 2008;48:433-41
15. Zhang L, Zhang Q, Li L, Wang Z, Ying J, Fan Y. et al. DLEC1, a 3p tumor suppressor, represses NF-kappaB signaling and is methylated in prostate cancer. J Mol Med (Berl). 2015;93:691-701
16. Wang Z, Li L, Su X, Gao Z, Srivastava G, Murray PG. et al. Epigenetic silencing of the 3p22 tumor suppressor DLEC1 by promoter CpG methylation in non-Hodgkin and Hodgkin lymphomas. J Transl Med. 2012;10:209
17. Kwong J, Chow LS, Wong AY, Hung WK, Chung GT, To KF. et al. Epigenetic inactivation of the deleted in lung and esophageal cancer 1 gene in nasopharyngeal carcinoma. Genes Chromosomes Cancer. 2007;46:171-80
18. Seng TJ, Currey N, Cooper WA, Lee CS, Chan C, Horvath L. et al. DLEC1 and MLH1 promoter methylation are associated with poor prognosis in non-small cell lung carcinoma. Br J Cancer. 2008;99:375-82
19. Sasaki H, Hikosaka Y, Kawano O, Moriyama S, Yano M, Fujii Y. Methylation of the DLEC1 gene correlates with poor prognosis in Japanese lung cancer patients. Oncol Lett. 2010;1:283-7
20. Al Sarakbi W, Reefy S, Jiang WG, Roberts T, Newbold RF, Mokbel K. Evidence of a tumour suppressor function for DLEC1 in human breast cancer. Anticancer Res. 2010;30:1079-82
21. Kwong J, Lee JY, Wong KK, Zhou X, Wong DT, Lo KW. et al. Candidate tumor-suppressor gene DLEC1 is frequently downregulated by promoter hypermethylation and histone hypoacetylation in human epithelial ovarian cancer. Neoplasia. 2006;8:268-78
22. Rauch T, Li H, Wu X, Pfeifer GP. MIRA-assisted microarray analysis, a new technology for the determination of DNA methylation patterns, identifies frequent methylation of homeodomain-containing genes in lung cancer cells. Cancer Res. 2006;66:7939-47
23. Bromberg JF, Wrzeszczynska MH, Devgan G, Zhao Y, Pestell RG, Albanese C. et al. Stat3 as an oncogene. Cell. 1999;98:295-303
24. Yue P, Turkson J. Targeting STAT3 in cancer: how successful are we? Expert Opin Investig Drugs. 2009;18:45-56
25. Ho Y, Tsao SW, Zeng M, Lui VW. STAT3 as a therapeutic target for Epstein-Barr virus (EBV): associated nasopharyngeal carcinoma. Cancer Lett. 2013;330:141-9
26. Timme S, Ihde S, Fichter CD, Waehle V, Bogatyreva L, Atanasov K. et al. STAT3 expression, activity and functional consequences of STAT3 inhibition in esophageal squamous cell carcinomas and Barrett's adenocarcinomas. Oncogene. 2014;33:3256-66
27. Harada D, Takigawa N, Kiura K. The Role of STAT3 in Non-Small Cell Lung Cancer. Cancers (Basel). 2014;6:708-22
28. Yu H, Lee H, Herrmann A, Buettner R, Jove R. Revisiting STAT3 signalling in cancer: new and unexpected biological functions. Nat Rev Cancer. 2014;14:736-46
29. Stahl N, Farruggella TJ, Boulton TG, Zhong Z, Darnell JE Jr, Yancopoulos GD. Choice of STATs and other substrates specified by modular tyrosine-based motifs in cytokine receptors. Science. 1995;267:1349-53
30. Tan Q, Wang G, Huang J, Ding Z, Luo Q, Mok T. et al. Epigenomic analysis of lung adenocarcinoma reveals novel DNA methylation patterns associated with smoking. Onco Targets Ther. 2013;6:1471-9
31. Ying J, Shan L, Li J, Zhong L, Xue L, Zhao H. et al. Genome-wide screening for genetic alterations in esophageal cancer by aCGH identifies 11q13 amplification oncogenes associated with nodal metastasis. PLoS One. 2012;7:e39797
32. Pierce BG, Wiehe K, Hwang H, Kim BH, Vreven T, Weng Z. ZDOCK server: interactive docking prediction of protein-protein complexes and symmetric multimers. Bioinformatics. 2014;30:1771-3
33. Pastuszak-Lewandoska D, Kordiak J, Migdalska-Sek M, Czarnecka KH, Antczak A, Gorski P. et al. Quantitative analysis of mRNA expression levels and DNA methylation profiles of three neighboring genes: FUS1, NPRL2/G21 and RASSF1A in non-small cell lung cancer patients. Respir Res. 2015;16:76
34. Kashuba VI, Li J, Wang F, Senchenko VN, Protopopov A, Malyukova A. et al. RBSP3 (HYA22) is a tumor suppressor gene implicated in major epithelial malignancies. Proc Natl Acad Sci U S A. 2004;101:4906-11
35. Li J, Wang F, Haraldson K, Protopopov A, Duh FM, Geil L. et al. Functional characterization of the candidate tumor suppressor gene NPRL2/G21 located in 3p21.3C. Cancer Res. 2004;64:6438-43
36. Zabarovsky ER, Lerman MI, Minna JD. Tumor suppressor genes on chromosome 3p involved in the pathogenesis of lung and other cancers. Oncogene. 2002;21:6915-35
37. Zhang Q, Ying J, Li J, Fan Y, Poon FF, Ng KM. et al. Aberrant promoter methylation of DLEC1, a critical 3p22 tumor suppressor for renal cell carcinoma, is associated with more advanced tumor stage. J Urol. 2010;184:731-7
38. Bocchini CE, Kasembeli MM, Roh SH, Tweardy DJ. Contribution of chaperones to STAT pathway signaling. JAKSTAT. 2014;3:e970459
39. Sehgal PB. Plasma membrane rafts and chaperones in cytokine/STAT signaling. Acta Biochim Pol. 2003;50:583-94
40. Chen X, Ying Z, Lin X, Lin H, Wu J, Li M. et al. Acylglycerol kinase augments JAK2/STAT3 signaling in esophageal squamous cells. J Clin Invest. 2013;123:2576-89
41. Chen H, Hutt-Fletcher L, Cao L, Hayward SD. A positive autoregulatory loop of LMP1 expression and STAT activation in epithelial cells latently infected with Epstein-Barr virus. J Virol. 2003;77:4139-48
42. Zhang G, Tsang CM, Deng W, Yip YL, Lui VW, Wong SC. et al. Enhanced IL-6/IL-6R signaling promotes growth and malignant properties in EBV-infected premalignant and cancerous nasopharyngeal epithelial cells. PLoS One. 2013;8:e62284
43. Gao SP, Mark KG, Leslie K, Pao W, Motoi N, Gerald WL. et al. Mutations in the EGFR kinase domain mediate STAT3 activation via IL-6 production in human lung adenocarcinomas. J Clin Invest. 2007;117:3846-56
44. Ye X, Feng G, Jiao N, Pu C, Zhao G, Sun G. Methylation of DLEC1 promoter is a predictor for recurrence in Chinese patients with gastric cancer. Dis Markers. 2014;2014:804023
45. Chan WH, Chang KP, Yang SW, Yao TC, Ko TY, Lee YS. et al. Transcriptional repression of DLEC1 associates with the depth of tumor invasion in oral squamous cell carcinoma. Oral Oncol. 2010;46:874-9
46. Jin H, Wang X, Ying J, Wong AH, Cui Y, Srivastava G. et al. Epigenetic silencing of a Ca(2+)-regulated Ras GTPase-activating protein RASAL defines a new mechanism of Ras activation in human cancers. Proc Natl Acad Sci U S A. 2007;104:12353-8
47. Ying J, Li H, Seng TJ, Langford C, Srivastava G, Tsao SW. et al. Functional epigenetics identifies a protocadherin PCDH10 as a candidate tumor suppressor for nasopharyngeal, esophageal and multiple other carcinomas with frequent methylation. Oncogene. 2006;25:1070-80
48. Li L, Tao Q, Jin H, van Hasselt A, Poon FF, Wang X. et al. The tumor suppressor UCHL1 forms a complex with p53/MDM2/ARF to promote p53 signaling and is frequently silenced in nasopharyngeal carcinoma. Clin Cancer Res. 2010;16:2949-58
49. Li L, Ying J, Tong X, Zhong L, Su X, Xiang T. et al. Epigenetic identification of receptor tyrosine kinase-like orphan receptor 2 as a functional tumor suppressor inhibiting beta-catenin and AKT signaling but frequently methylated in common carcinomas. Cell Mol Life Sci. 2014;71:2179-92
50. Li L, Li C, Mao H, Du Z, Chan WY, Murray P. et al. Epigenetic inactivation of the CpG demethylase TET1 as a DNA methylation feedback loop in human cancers. Sci Rep. 2016;6:26591
51. Li L, Zhang Y, Fan Y, Sun K, Su X, Du Z. et al. Characterization of the nasopharyngeal carcinoma methylome identifies aberrant disruption of key signaling pathways and methylated tumor suppressor genes. Epigenomics. 2015;7:155-73
Author contact
![]() Corresponding author: Prof Q Tao, Cancer Center, Department of Clinical Oncology, PWH, The Chinese University of Hong Kong, Shatin, Hong Kong. Tel: (852) 3505-1340; Fax: (852) 2648-8842. E-mail: qtaoedu.hk.
Corresponding author: Prof Q Tao, Cancer Center, Department of Clinical Oncology, PWH, The Chinese University of Hong Kong, Shatin, Hong Kong. Tel: (852) 3505-1340; Fax: (852) 2648-8842. E-mail: qtaoedu.hk.