Impact Factor
 Global reach, higher impact
Theranostics 2017; 7(19):4643-4657. doi:10.7150/thno.20418 This issue Cite
Research Paper
Detection of Treatment Success after Photodynamic Therapy Using Dynamic Contrast-Enhanced Magnetic Resonance Imaging
Tom J. L. Schreurs1, ![]() , Igor Jacobs1,2, Klaas Nicolay1,†, Jeanine J. Prompers1,3, Gustav J. Strijkers4
, Igor Jacobs1,2, Klaas Nicolay1,†, Jeanine J. Prompers1,3, Gustav J. Strijkers4
1. Eindhoven University of Technology, Biomedical Engineering Department, Biomedical NMR, Eindhoven, The Netherlands
2. Philips Research, Oncology Solutions, Eindhoven, The Netherlands
3. University Medical Center Utrecht, Department of Radiology, Utrecht, The Netherlands
4. Academic Medical Center, Biomedical Engineering and Physics, Amsterdam, The Netherlands
†This work was dedicated to Professor Klaas Nicolay, our friend, mentor, and a devoted researcher, who passed away on January 10, 2017. We will remember him for his great contribution to science and education in the field of Biomedical NMR, and his warm and inspiring personality.
Received 2017-4-5; Accepted 2017-8-4; Published 2017-10-17
Abstract

Early evaluation of response to therapy is crucial for selecting the optimal therapeutic follow-up strategy for cancer patients. PDT is a photochemistry-based treatment modality that induces tumor tissue damage by cytotoxic oxygen radicals, generated by a pre-injected photosensitive drug upon light irradiation of tumor tissue. Vascular shutdown is an important mechanism of tumor destruction for most PDT protocols. In this study, we assessed the suitability of Dynamic Contrast-Enhanced Magnetic Resonance Imaging (DCE-MRI) to evaluate treatment efficacy within a day after photodynamic therapy (PDT), using the tumor vascular response as a biomarker for treatment success.
Methods: DCE-MRI at 7 T was used to measure the micro-vascular status of subcutaneous colon carcinoma tumors before, right after, and 24 h after PDT in mice. Maps of the area under the curve (AUC) of the contrast agent concentration were calculated from the DCE-MRI data. Besides, tracer kinetic parameters including Ktrans were calculated using the standard Tofts-Kermode model. Viability of tumor tissue at 24 h after PDT was assessed by histological analysis.
Results: PDT led to drastic decreases in AUC and Ktrans or complete loss of enhancement immediately after treatment, indicating a vascular shutdown in treated tumor regions. Histological analysis demonstrated that the treatment induced extensive necrosis in the tumors. For PDT-treated tumors, the viable tumor fraction showed a strong correlation (ρ ≥ 0.85) with the tumor fraction with Ktrans > 0.05 min-1 right after PDT. The viable tumor fraction also correlated strongly with the enhanced fraction, the average Ktrans, and the fraction with Ktrans > 0.05 min-1 at 24 h after PDT. Images of the viability stained tumor sections were registered to the DCE-MRI data, demonstrating a good spatial agreement between regions with Ktrans > 0.05 min-1 and viable tissue regions. Finally, 3D post-treatment viability detection maps were constructed for the tumors of three mice by applying a threshold (0.05 min-1) to Ktrans at 24 h after PDT. As a proof of principle, these maps were compared to actual tumor progression after one week. Complete tumor response was correctly assessed in one animal, while residual viable tumor tissue was detected in the other two at the locations where residual tumor tissue was observed after one week.
Conclusion: This study demonstrates that DCE-MRI is an effective tool for early evaluation of PDT tumor treatment.
Keywords: Dynamic contrast-enhanced magnetic resonance imaging, treatment response evaluation, mouse tumor model, photodynamic therapy, tumor perfusion
Introduction
Photodynamic therapy (PDT) is gaining interest as a vascular targeted treatment option for cancer, since it enables local ablation of tumor tissue while avoiding damage to surrounding organs. PDT induces tissue necrosis by irradiation of the tumor with single-wavelength light, after prior administration of a photosensitive drug [1,2]. Light excitation of the photosensitizer leads to production of cytotoxic amounts of reactive oxygen species. Tumor tissue destruction results from a combination of direct cellular damage and deprivation of the tumor from oxygen and nutrients due to vascular shutdown [3]. Treatment can be tailored towards induction of vascular damage with a photosensitizer that is confined to the blood and using a short time interval between photosensitizer administration and light treatment [4]. However, vascular damage is a major contributor to the therapeutic effect for most PDT compounds and protocols.
One of the most successful applications of PDT so far has been the treatment of early stage prostate cancer, using the photosensitizer padeliporfin (also known as TOOKAD® Soluble or WST11) [5]. Targeted light irradiation is achieved by insertion of one or multiple optical fibers within hollow plastic needles, which facilitate accurate positioning in the prostate. PDT with padeliporfin was shown to effectively induce tumor tissue ablation while preserving critical organ structures. In a phase III clinical trial, the treatment was found to be a promising alternative to active surveillance of early stage prostate tumors [6]. PDT with padeliporfin has also proven successful in preclinical in vivo studies with application to renal and urethral tumors [7,8]. Furthermore, other photosensitizers were tested for treatment of, amongst others, pancreatic cancer [9] and brain gliomas [10].
From these successful applications, it became evident that there is a need for improved tools for early and accurate assessment of treatment outcome. For example, in the clinical trial with padeliporfin, only 49% of men had a negative biopsy and 28% had disease progression at 24 months post PDT, i.e., increased tumor size or Gleason score, or consistently high prostate specific antigen levels [6,11]. In general, many types of cancer treatment exhibit variable response, which can be partly attributed to the heterogeneous nature of tumor tissue [12,13]. In the case of PDT, lack of response can be further due to inadequate delivery of one or more of the key elements of PDT, i.e., photosensitizer, light, and oxygen, to all parts of the tumor [14,15]. Regardless of the cause of treatment failure, there is a clear necessity for early and more detailed assessment methods to evaluate treatment outcome. Currently, treatment outcome is often evaluated only on the long-term, based on global metrics such as tumor volume [16]. However, knowledge of the exact location of residual tumor tissue early after treatment would assist in decision-making on follow-up treatment and improve general prognosis.
Dynamic Contrast-Enhanced Magnetic Resonance Imaging (DCE-MRI) could be an effective treatment evaluation method for PDT, since it enables non-invasive and accurate visualization of the micro-vascular status. We have previously found that vascular occlusion is clearly detectable with DCE-MRI as a strong decrease in tumor contrast enhancement within 2 h after PDT [17]. We also found indications that the contrast enhancement is related to tissue viability status at 24 h post treatment. These findings give rise to the hypothesis that DCE-MRI data correlates and matches spatially with tissue viability after PDT. Several reports of the use of contrast-enhanced MRI for PDT evaluation exist [18,19], but to our knowledge, the spatial correspondence between (D)CE-MRI data and tumor treatment response has not been rigorously assessed.
In this study, we therefore investigated whether DCE-MRI at 7 T in combination with tracer kinetic analysis can be used to predict tumor tissue status after PDT and to detect heterogeneities in tumor viability. The study was performed using the CT26.WT colon carcinoma model, since this tumor is characterized by little spontaneous necrosis and it is well-perfused [17], enabling selective detection of tissue necrosis and treatment-induced vascular effects. DCE-MRI-based parameters acquired right after and at 24 h after PDT were spatially compared to viability stained histological sections of the entire tumor, excised 24 h after PDT. Finally, 3D post-treatment viability detection maps were constructed from the DCE-MRI data at 24 h post treatment, and compared to the (residual) tumor status after 1 week in a separate group of 3 animals. While this study was performed from the perspective of PDT, the presented evaluation tools may be equally useful for other types of vascular therapy.
Materials & methods
Mouse tumor model
Animal studies were approved by the committee of Animal Research of Maastricht University, Maastricht, The Netherlands (protocol: 2014-011). Murine CT26.WT colon carcinoma cells (CRL-2638, American Type Culture Collection, Manassas, VA, USA) were cultured at 37 °C and 5% CO2 in RPMI-1640 medium (Invitrogen, Breda, The Netherlands), supplemented with 10% fetal bovine serum (Greiner Bio-One, Alphen a/d Rijn, The Netherlands) and 50 U/ml penicillin/streptomycin (Lonza Bioscience, Basel, Switzerland). Early passages (9-13) of the original batch were used for inoculation. Ten to twelve week-old BALB/c mice (Charles River, Maastricht, The Netherlands) were inoculated with 106 cells subcutaneously in the right hind limb. Approximately 4 days after inoculation, tumors became palpable.
During photosensitizer injection, PDT, and MR imaging, mice were anesthetized using isoflurane (3.5% for induction, 1-2% for maintenance) in medical air flowing at 0.4 L/min. Breathing rate was monitored with a pressure balloon. During PDT and MRI, body temperature was monitored using a rectal probe, and kept at 36-37 °C using a warm water circuit.
Study design
After tumor inoculation, tumor volume was measured with a caliper every 2 or 3 days. All animals (n = 21) underwent MRI exams on three consecutive days, when one of the tumor diameters reached 10 mm, approximately 10 days after inoculation. For treated animals (n = 16), PDT was performed outside the MRI scanner on the second experiment day. Of these animals, n = 8 received complete tumor treatment and n = 5 intentionally received partial tumor treatment, to ensure variation in treatment outcome. The average tumor volume was 228 ± 174 mm3 (mean ± SD) at the day of treatment. After PDT, the animals were immediately prepared for MRI. Due to the time needed for animal positioning and preparatory scans, DCE-MRI was effectively performed at 110 min after PDT, henceforth referred to as “right after PDT”. The experiment on the third day was planned such that the DCE-MRI scan was acquired at 24 h after PDT. Immediately afterwards, the mice were sacrificed by cervical dislocation. Control animals (n = 5) underwent the same protocol, but received no photosensitizer and no light treatment. Additionally, n = 3 fully treated animals also went through the same procedure, except that they were sacrificed 1 week after PDT, during which monitoring of tumor size was continued.
PDT treatment
The photosensitizer (Bremachlorin, Rada-Pharma International B.V, The Netherlands) was administered via the tail vein at a dose of 20 mg/kg body weight 6 h before light treatment. Bremachlorin is a mixture of chlorins (mainly chlorin e6) in 0.35% (w/v) aqueous solution. The tumor-bearing hind limb was shaved. To protect the surrounding tissue from exposure to light, a black paper mask was positioned around the tumor. For partially treated tumors, about two thirds of the tumor was additionally covered with paper. The tumor was irradiated percutaneously with a collimated light beam, aimed perpendicularly onto the skin. The 655 nm light was produced by a fiber-connected laser diode (WSLB-650-002-H, Wave-Spectrum, Beijing, China), and guided through a pair of lenses to form a beam with a diameter adjustable to the size of the tumor. The total beam output power was calibrated prior to treatment with an optical power meter, and was adjusted to produce an irradiance of 200 mW/cm2. Light exposure was applied for 10 min, resulting in a total fluence of 120 J/cm2. Before PDT, as well as every 12 h during the first 2 days after PDT mice received preventive analgesia (s.c. injection of 0.05 mg/kg buprenorphine).
MRI experiments
All scans were performed with a 7 T MR scanner (BioSpec 70/30 USR, Bruker), using a 72 mm diameter quadrature birdcage coil for RF signal transmission and reception. The same scan protocol was applied on all three experiment days. The tumor-bearing hind limb was gently fixed in a stretched position and immersed in degassed ultrasound gel, as a susceptibility matching medium to reduce magnetic field inhomogeneities. A multi-slice spin echo T2-weighted anatomical reference scan was first acquired, with enough slices to cover the complete tumor. The following scan parameters were used: repetition time (TR) = 1000 ms, echo time (TE) = 30 ms, matrix = 128x128, field of view (FOV) = 40x40 mm2, slice thickness = 1.0 mm, slice gap = 0.1 mm. T1 mapping was performed using a 3D FLASH scan with variable flip angles (FA) [20]. Scan parameters were: TR = 20 ms, TE = 3.2 ms, FA = 2°, 3°, 5°, 7°, 10°, 13°, and 20°, number of averages (NA) = 2, matrix = 128x128x39, FOV = 40x40x22 mm3. The same sequence was used to perform the DCE-MRI scan, but with shorter TR and TE and fixed flip angle. Sequence parameters were as follows: TR = 3 ms, TE = 1 ms, FA = 7°, NA = 1, acquisition matrix = 128x69x17 (zero-filled to 128x128x39), FOV = 40x40x22 mm3. The influx and washout of the contrast agent in the tissue were dynamically recorded with a temporal resolution of 3.52 s, by repeating this sequence for 15 min. 2 min after the start of the scan, a 100 μL bolus of 0.3 mmol Gd/kg body weight Dotarem (Guerbet, Villepinte, France) followed by a saline flush was injected into the tail vein in 5 s using a syringe pump (Fusion 100, Chemyx Inc., Stafford, TX, USA). The T1-map and DCE-MRI methods used in this study are sensitive to deviations in RF transmit amplitude B1. Therefore, a correction map was acquired to enable reconstruction of the local effective flip angle from the nominal flip angle, using the signal null approach [21]. A 3D FLASH scan was recorded at 3 large flip angles (FA = 145°, 180°, 215°), with TR = 300 ms, TE = 3.2 ms, matrix = 128x128x39, and FOV = 40x40x22 mm3.
Histological analysis
5 min before animals were sacrificed, a dose of 32 mg/kg bodyweight Hoechst 33342 (B2261, Sigma Aldrich, St. Louis, MO) was injected via the tail vein as a perfusion marker. Immediately after the animal was sacrificed, the skin of the tumor-bearing hind limb was removed and the tissue was dried with paper. Colored tissue marker dye (MD100-1KT, Sigma Aldrich) was used to draw proximodistal reference lines to enable reconstruction of the tumor orientation upon tumor sectioning. The tumor was then excised and snap-frozen in cold isopentane slush, and subsequently stored at -80 °C. Later, tumors were cut into 8 μm sections using a cryotome (Shandon cryotome, Thermo Fischer Scientific, Waltham, MA, USA). Based on the tissue marker reference lines, transverse sections were cut at every 1.1 mm depth, resulting in a set of sections with approximately similar geometry as the MRI slices. Four adjacent sections were cut at each depth, to allow different types of staining. Hematoxylin and Eosin (H&E) and CD31 endothelial cell immunofluorescence stainings were performed on selected sections, while nicotinamide adenine dinucleotide (NADH) diaphorase viability staining was performed at all depths of all tumors. Both brightfield and fluorescence microscopy images were acquired at 20x magnification with a digital slide scanner (Pannoramic Midi, 3DHistech, Budapest, Hungary).
Tissue viability was detected by staining for the enzyme nicotinamide adenine dinucleotide (NADH) diaphorase, which is closely tied to the cellular maintenance of the vital component NADH. In the presence of NADH, this enzyme catalyzes the reduction of colorless tetrazolium salts to a water-insoluble blue dye called formazan [22]. Staining solution was prepared by adding 0.714 mg/mL β-NAD reduced disodium salt hydrate (N8129, Sigma-Aldrich, St. Louis, USA) and 0.286 mg nitro blue tetrazolium (N5514, Sigma-Aldrich, St. Louis, USA) to Gomori-Tris-HCl buffer (pH 7.4). After thawing and air-drying for 30 min, slides were placed in staining solution for 1 h at 37 °C, and consequently washed and mounted.
Detection of blood vessels was performed using immunofluorescent labeling of CD31, a surface protein expressed by endothelial cells [23]. After fixation in ice cold acetone, sections were briefly air-dried, followed by incubation in blocking buffer (Superblock, Thermo Fischer Scientific, Waltham, MA, USA) for 1 h at room temperature, biotin-conjugated rat anti-mouse CD31 (102503, BioLegend, San Diego, CA, USA, dilution 1:250) overnight at 4 °C, and DyLight 649-conjugated streptavidin (405224, BioLegend, dilution 1:100) for 1 h at 20 °C. Sections were rinsed with PBS containing 0.3% Tween-20 after each incubation step, and antibodies and streptavidin were diluted in blocking buffer.
Image processing
Image analysis was performed in Matlab 2016a. Tumors were manually segmented, based on the T2-weighted anatomical reference images, in which tumor tissue was hyperintense compared to surrounding tissues.
A flip angle correction factor ζ was calculated in each voxel by fitting the signal intensities S as a function of the nominal flip angle FAn to the function S = |a * FAn + b|. For the T1 map and the DCE scan, the correction factor ζ = -(a/b) * 180° was used to deduce the actual flip angle FAa from the nominal flip angle FAn as follows: FAa = ζ * FAn. T1 maps were obtained by fitting the signal intensity S corresponding to the different flip angles FA to the signal equation for spoiled gradient echo sequences: S ~ sin(FA) * (1 - exp(-TR/T1)) / (1 - cos(FA) exp(-TR/T1)).
From the dynamic signal intensity S(t) of the DCE-MRI scan and the pre-contrast longitudinal relaxation rate R1,pre = 1/T1,pre, the dynamic relaxation rate R1(t) = 1/T1(t) as a function of time was first calculated. Using the ratio S(t)/Spre and the above-mentioned spoiled gradient echo sequence signal equation, R1(t) was solved. The Dotarem concentration C(t) was then derived by applying the spin-lattice relaxivity (r1 = 3.53 mM-1 s-1) at 7 T [24], using R1(t) = R1,pre(t) + r1 * C(t).
The area under the curve (AUC) of the Dotarem concentration C(t) from the time of injection until 13 min after injection (the end of the DCE-MRI scan) was used as a simple measure for contrast agent uptake. Besides, voxels were classified as “enhanced” when the median of C(t) after contrast injection was at least twice as large as the standard deviation of C(t) before injection. The enhanced tumor fraction was calculated by dividing the number of enhanced voxels by the total number of tumor voxels. Tracer kinetic parameter modeling using the standard Tofts-Kermode model [25] was applied to extract the transfer constant Ktrans and the volume fraction ve of the extracellular extravascular space (EES). The transfer constant Ktrans (min-1) describes the volume rate of exchange of the contrast agent between the blood plasma and the EES. The arterial input function (AIF) was defined as a biexponential function with amplitudes A1 = 5.36 mM and A2 = 1.27 mM, and time constants τ1 = 5.36 s and τ2 = 915 s. A1 was estimated from the injected dose divided by the average blood volume for BALB/C mice [26], corrected for a hematocrit level of 0.563 (value provided by animal supplier), whereas time constant τ1 was taken from literature [27]. A2 and τ2 were based on previous blood sampling experiments [28]. Tumor averages for Ktrans were based on all tumor pixels, including non-enhanced ones, for which the tracer kinetic modeling resulted in Ktrans ≈ 0. For robust calculation of the tumor averages of ve, only those pixels were included for which all of the following criteria were met: 1) pixels were enhanced; 2) C(t) reached a maximum before the end of the acquisition, followed by a washout phase; 3) the fit of the Tofts-Kermode model to the concentration curve had an R2 > 0.80; 4) tracer kinetic analysis resulted in a physically realistic ve value, i.e. 0 ≤ ve ≤ 1.
Tumor registration
An initial registration of histology and MRI slice stacks of the tumors was obtained using the assumption that the histological sections were cut in the same planes as the MRI slices. First, the in-plane orientation of all histological sections of each tumor was manually matched with respect to each other, using the colored dye fiducial lines. The global orientation of all histological sections was then matched with that of the MRI tumor slices. Second, if the number of histological sections differed from the number of MRI slices, the tumor slice stacks were mutually shifted to obtain the best overall visual correspondence between all pairs of histological and MRI slices, in terms of shape and area. Unpaired slices at the top and bottom of the slice stack were omitted. Finally, in-plane translation was performed for each individual histological tumor slice, to find the largest overlap with the MRI tumor masks. During the registration process, the operator used only binary tumor masks, and was therefore unaware of the spatial distribution of tissue viability or DCE-MRI parameters within the tumor. Two tumors were excluded from the analysis because most of their sections contained large cracks or folds.
After registration, a 2x2x2 spatial grid was defined, dividing the tumor in 3 directions: proximal-distal, left-right, and superficial-deep. The in-plane orientation of the grid was manually selected, based on the T2-weighted anatomical reference images. Within the image plane, the center of the grid was placed at the center of mass of the MRI-based tumor masks, averaged over all tumor slices. In the slice direction, the center was placed at the median.
Statistical analysis
Statistical analyses were performed in SPSS software (version 22). Unless otherwise mentioned, values are reported as “average ± standard deviation”. One-way or mixed-design ANOVAs with Bonferroni post-hoc tests were used to test for differences between control and treated animal groups, after validation of the homogeneity of variances (using Levene's test) and the sphericity assumption (using Mauchly's test). Throughout the article, p values of less than 0.05 are considered statistically significant and are indicated by a single asterisk (*), while double asterisks (**) indicate p < 0.005.
Results
DCE-MRI
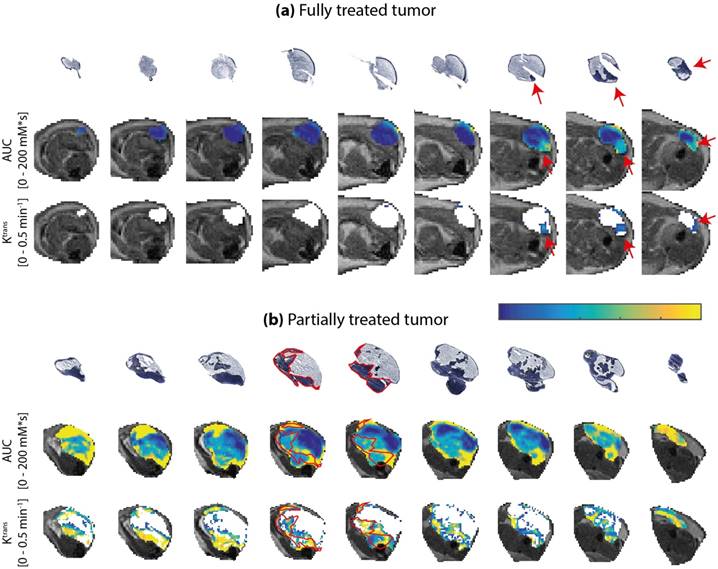
Figure 1 shows examples of DCE-MRI images and derived parameter maps of treated and partially treated tumors before, directly after, and at 24 h after PDT. The PDT treatment drastically affected the contrast agent uptake (Figure 1; T1-weighted post-contrast image and AUC) and kinetics (Figure 1; Ktrans and ve) in the tumor. Untreated tumors (not shown in Figure 1) were largely enhanced. Signal enhancement patterns in untreated control animals changed little over the course of 3 days. Conversely, an immediate dramatic decrease in enhancement was measured in fully treated tumors after PDT. Moreover, at 24 h fully treated tumors showed little or no contrast uptake. A smaller but still considerable loss in contrast uptake was also measured for the partially treated tumors. After 24 h, most of these tumors had non-enhancing regions besides distinct regions with strong contrast agent uptake.
Representative examples of DCE-MRI-derived quantitative parameter maps of a fully and a partially treated tumor, at all three time points. For each time point, a T2-weighted anatomical reference image, a T1-weighted DCE-MRI frame at 1 min after contrast injection, an AUC map, a Ktrans map, and a ve map are shown for a central axial tumor slice. The ve maps are only color-coded in pixels that were enhanced and satisfied the quality criteria for the tracer kinetic model fit. The tumor is outlined by a red contour. The color bar applies to all quantitative maps and represents the range of values for each parameter displayed in the text labels on the left.
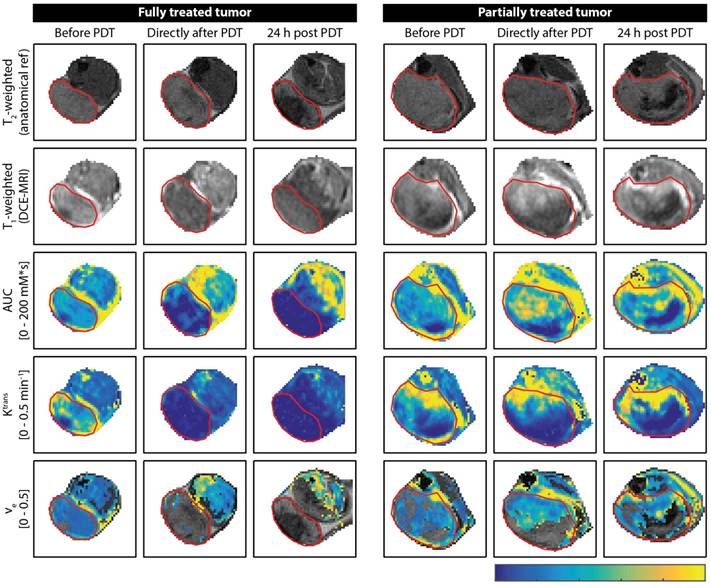
Both the fully treated and partially treated tumor in Figure 1 showed non-zero values for Ktrans in almost the whole tumor before PDT. Ktrans displayed considerable variance throughout the tumor, with larger values mostly near the tumor boundaries. In accordance with the lack of contrast agent uptake in the fully treated tumor after PDT, Ktrans was negligible in almost the whole tumor ROI. Even in the slightly enhanced tumor regions observed right after PDT, Ktrans approximated zero. Ktrans was also very low in the surrounding muscle tissue at 24 h after PDT. In the partially treated tumor, more than half of the tumor displayed non-zero Ktrans values right after and at 24 h after PDT. Within this region of the tumor, the Ktrans profile did not show clear differences with respect to baseline. The analysis of ve was confined to the tumor pixels with contrast enhancement. In pixels with low quality tracer kinetic modeling fit (R2 < 0.80) and pixels that did not contain a contrast washout phase, ve was also not calculated. In the fully treated tumor shown in Figure 1, these exclusions resulted in a negligible number of remaining pixels for which ve could be quantified. On average, ve was determined in 24.2 ± 9.0% and 6.0 ± 4.6% of the total volumes of fully treated tumors, directly after PDT and 24 h after PDT, respectively. For partially treated tumors, ve could be calculated in on average 45.9 ± 8.7% and 44.4 ± 9.9% of the pixels, directly and 24 h after PDT, respectively. After PDT, these pixels showed similar ve values as before treatment.
Figure 1a-c shows tumor averages of the DCE-MRI parameters. A mixed ANOVA with Bonferroni post-hoc tests revealed a significant interaction effect (p = 7.5*10-8) of time and treatment on the enhanced tumor fraction (Figure 2a). In untreated controls, the enhanced fraction remained unaltered over the course of 3 measurement days, while for partially treated tumors it decreased significantly at 24 h after PDT compared to baseline (p = 0.028). For the fully treated tumors, a significant decrease was already observed right after PDT (p = 2.0*10-6), which was even more pronounced at 24 h post PDT (p = 4.7*10-9). Moreover, significant differences were found right after PDT for fully treated versus untreated tumors (p = 8.6*10-4), and at 24 h after PDT for both fully and partially treated tumors versus controls (p = 4.9*10-7 and p = 0.022). Finally, the enhanced fraction of fully treated tumors was significantly smaller than that of partially treated ones at 24 h after PDT (p = 7.2*10-5).
Average tumor values of (a-c) DCE-MRI-derived parameters and (d) histology-derived viable fractions for the untreated, fully treated, and partially treated group. The legend next to (b) applies to all subfigures. Error bars represent one standard deviation. Asterisks within or above bars indicate statistically significant differences with respect to baseline values within a treatment group, based on a mixed ANOVA with Bonferroni post-hoc tests (* p < 0.05, ** p < 0.005). Similarly, lines with asterisks above the bar pairs indicate differences between treatment groups at the corresponding time point.
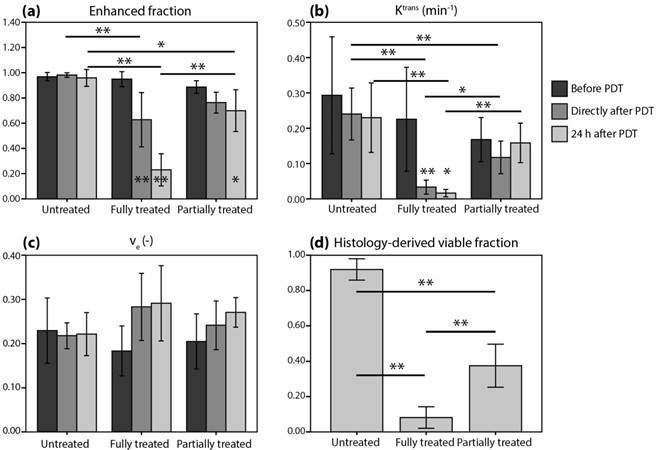
For the average tumor Ktrans (Figure 2b), a significant effect of treatment was found (p = 2.9*10-4). For fully treated tumors, Ktrans right after PDT was significantly lower compared to baseline (p = 0.0030), but also compared to untreated tumors (p = 7*10-6) or partially treated tumors (p = 0.019) at the same time point. Besides, partially treated tumors had lower Ktrans than untreated tumors right after PDT (p = 0.0032). At 24 h after PDT, Ktrans of fully treated tumors was lower compared to baseline (p = 0.014), and also compared to partially treated and untreated tumors (p = 1.0*10-4 and p = 0.0041). No effect of treatment or time on ve was found (Figure 2c).
Tumor appearance after PDT and histology
PDT led to a visually observable tumor response in all treated mice within less than a day. Untreated tumors were pink or red, and only a few tumors displayed small parts with spontaneous necrosis. PDT-treated tumors initially became purple as a result of hemorrhage and sometimes black due to necrosis. Treatment-induced edema led to swelling of the hind limb. In the T2-weighted MR images of most treated tumors we observed edema between the tumor and the skin.
A histological NADH-diaphorase activity staining was used to identify tumor tissue viability (Figure 3). A positive dark blue staining indicates intact activity of the vital NADH-diaphorase enzyme, which is associated with tissue viability. As expected, most untreated tumors were almost completely positively stained, indicating that they were largely viable. In contrast, few positively stained regions were found in the fully treated tumors. In tumors that were intentionally partially treated a sharp demarcation was observed between the viable untreated region and the nonviable treated portion of the tumor (Figure 3, upper right). Using the colored fiducial lines on the tumor surface, the angle of incidence of the light beam could be estimated. Viable parts were mostly found in the deeper regions of the tumors, and in the non-irradiated region. Interestingly, in many of the treated tumors, a thin (100-200 μm) rim of viable tissue was observed at the tumor edges.
Examples of histologically stained tumor sections. The upper row shows NADH-diaphorase stained tumor sections of an untreated tumor, a fully treated tumor, and a partially treated tumor. Treated tumors were excised at 24 h after PDT. The approximate angle of light incidence during PDT is indicated by the arrows. For the partially treated tumor, the black cross roughly indicates the part of the light beam that was blocked by black paper covering the skin. The middle row shows magnifications of H&E, NADH-diaphorase, and CD31 stained sections of an untreated tumor. The fluorescence signal of the CD31 detection is shown in red, while the Hoechst 33342 dye injected 5 min before animal sacrifice is shown in blue. The bottom row shows the same types of images for a treated tumor.
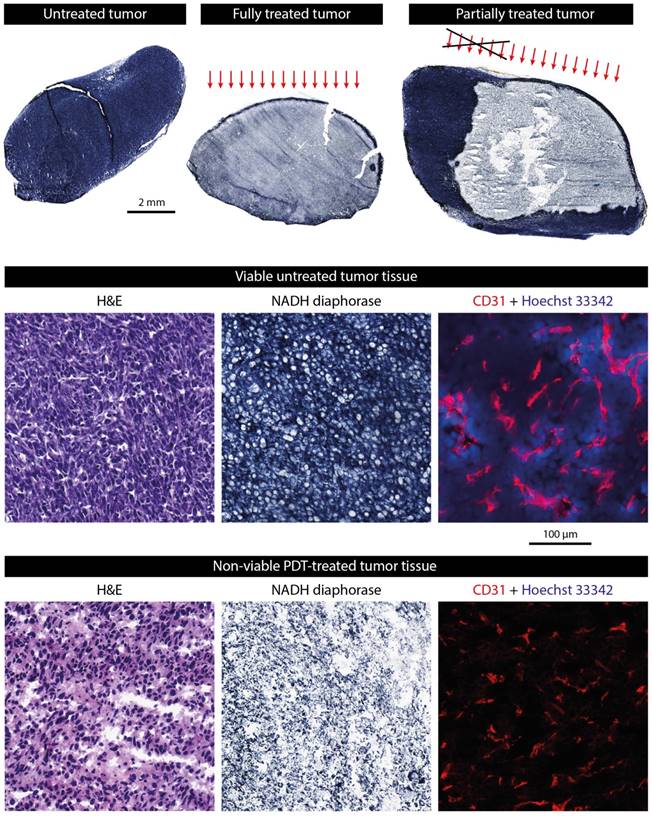
In a selection of tumors, the NADH-diaphorase staining was compared to H&E staining in adjacent sections to validate and confirm that the NAHD-diaphorase positive regions corresponded to viable tissue, while negative regions were necrotic. The middle and bottom row of Figure 3 show both NADH-diaphorase and H&E images of matching regions of adjacent tumor sections, for an untreated tumor with positive NADH-diaphorase staining, and a treated tumor with negative staining. Overall, the H&E stainings confirmed the findings from the NADH-diaphorase stainings. NADH-diaphorase positive regions were associated with intact cells with high cellular density and structural integrity. NADH-diaphorase negative tissue was characterized on H&E by disrupted cells, eosinophilic cytoplasm, and fragmented and hyperchromatic nuclei.
The occluding effect of PDT on the blood vessels was demonstrated using CD31 immunohistochemical staining of endothelial cells, detected by fluorescence microscopy in a small set of treated and untreated sections (Figure 3; middle and bottom row, right frame). In untreated tumor tissue, a large number of small blood vessels were observed, of which some clearly had an open lumen. Treated tissue showed a similarly high vascular density, but the fluorescence signal was a bit weaker and vessels were pinched together. Besides, most of the untreated tissue sections showed extravasated Hoechst 33342 dye, which was injected 5 min before the animals were sacrificed, indicating a functional blood supply. In contrast, no Hoechst 33342 was detected in the treated tumor tissue at all.
The histology-derived viable fraction, as well as the enhanced fraction, Ktrans, and ve for the 3 time points, are summarized in Figure 2d. For the viable tumor fractions, the group averages reflect the specific observations from Figure 3: control tumors were almost completely viable, fully treated tumors were almost completely non-viable, and 37.5% of partially treated tumors was viable. Viable fractions of both fully and partially treated tumors were significantly different from untreated controls (p = 4*10-11 and p = 8*10-8, respectively; one-way ANOVA with Bonferroni post-hoc) and from each other (p = 4*10-5).
Correlation between DCE-MRI and histology-based viable tumor fractions
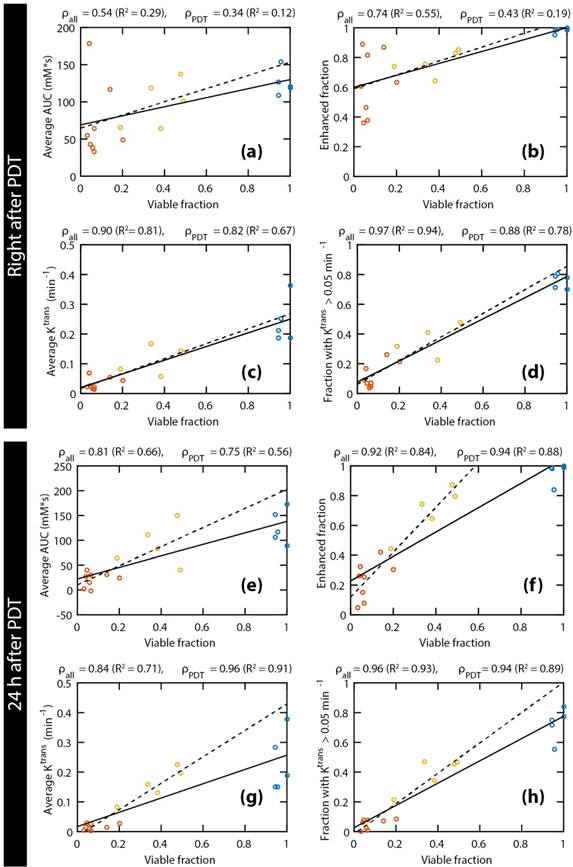
Figure 4 shows correlations between the histology-derived viable tumor fractions at 24 h after PDT and several parameters derived from the DCE-MRI measurements directly after (Figure 4a-d) and at 24 h after (Figure 4e-h) PDT. Linear regressions were performed for each parameter, either for all animals (solid lines) or only considering PDT treated ones (dashed lines). The Pearson correlation coefficients of all correlations were statistically significant, except for the average AUC and the enhanced fraction right after PDT, when control animals were not included. When considering only the PDT-treated tumors, very strong correlations (ρ ≥ 0.85) were observed for the fraction with Ktrans > 0.05 min-1 right after PDT, as well as for the enhanced fraction, the average Ktrans, and the fraction with Ktrans > 0.05 min-1 at 24 h after PDT. For all parameters and at both time points, the slope of the line resulting from the linear regression was higher when only the treated animals were included, although the correlation was often weaker due to the smaller range in viable fractions. Correlations for ve were weak and not statistically significant. Different thresholds for Ktrans were heuristically tested, resulting in the strongest correlations for a threshold value of 0.05 min-1.
Scatter plots of the histology-derived viable tumor fractions versus 4 DCE-MRI parameters: average AUC (a & e), enhanced tumor fraction (b & f), average Ktrans (c & g), and tumor fraction with a Ktrans value larger than 0.05 min-1 (d & h). The DCE-MRI parameters obtained right after PDT (a-d) and 24 h after PDT (e-h) were both compared to the viable fractions determined at 24 h after PDT. Red, yellow, and blue points represent fully treated tumors, partially treated tumors, and controls, respectively. For each comparison, two linear regressions were calculated, either based on all tumors (solid lines), or on treated tumors only (dashed lines). Moreover, the Pearson's correlation coefficients are displayed for all tumors (ρall) and for the treated tumors only (ρPDT), together with the coefficient of determination (R2) of the corresponding regression lines.
Spatial comparison between DCE-MRI and tissue viability
Next, quantitative parameter maps of those parameters with the largest correlation coefficients in Figure 4 were spatially compared to histological sections. Due to their strong correlation with the viable tumor fractions, these parameters were considered the most promising predictors for tissue viability. Figure 5 shows the NADH-diaphorase stained sections with the matching AUC and Ktrans maps at 24 h after PDT of a fully and partially treated tumor. For the fully treated tumor, as seen before, there was little or no DCE-MRI contrast enhancement in most of the tumor sections except, in this specific case, for 3 slices in the proximal part of the tumor (Figure 5a). The corresponding NADH-diaphorase stainings of the tumor indeed revealed residual viable tissue in these same slices. The partially treated tumor in Figure 5b contained more viable regions, and showed much more enhancement and larger Ktrans values. Most viable tissue parts visually corresponded to regions having a non-zero AUC, but some non-viable regions also showed considerable enhancement. The Ktrans maps, on the other hand, showed visual spatial similarity with the viability stained sections.
NADH-diaphorase stained tumor sections, and AUC and Ktrans maps of an entire tumor of (a) a fully treated animal and (b) a partially treated animal. Both histological sections and AUC map slices are ordered from distal to proximal, and rotated in the same orientation. The AUC and Ktrans maps are only displayed within the tumor, as an overlay over the T2-weighted images. For Ktrans maps, the pixels without enhancement or low data quality are displayed in white. The color bar applies to both AUC and Ktrans maps, for the value range displayed left to the maps. For the fully treated tumor, red arrows indicate viable tumor tissue and tissue with non-zero AUC and Ktrans at the same location. For the partially treated tumor, red contours were drawn around the viable regions in 2 central slices. The contours were overlaid on the AUC and Ktrans maps to emphasize the spatial correspondence. A similar correspondence can be observed in the other slices.
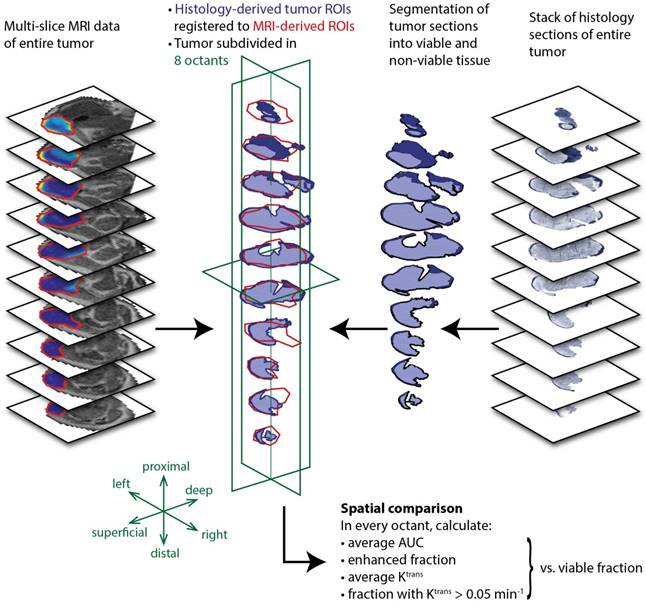
To further quantify the spatial correspondence between DCE-MRI parameters and tissue viability status, a simple spatial registration of the histology slides to the MR slice stack was applied. After registration, the average fraction of MR tumor mask pixels that did not overlap with the histology tumor masks was 26.8 ± 8.2%, while the non-overlapping pixel fraction of the histology masks was 14.0 ± 8.0% (mean ± standard deviation for all treated animals). Next, a coarse spatial subdivision of the tumors into 2x2x2 octants was made, and pixel fractions and averages of DCE-MRI parameters were calculated within each octant. The data processing workflow described above is visualized in Figure 6.
Data processing workflow for spatial comparison of DCE-MRI data and histology-derived viability data. For both datasets, a stack of sections or slices covering the entire tumor was available. The histology sections were segmented into viable (dark blue) and non-viable (light blue) tumor tissue by drawing manual ROIs. A 2D rigid transformation was then applied to each section, to register with the MRI-based tumor ROIs. Next, the registered tumor data was divided into 8 octants, defined by the 3 green planes through the tumor center. Within each octant, the DCE-MRI data were averaged and compared to the histology-derived fraction of the corresponding octant.
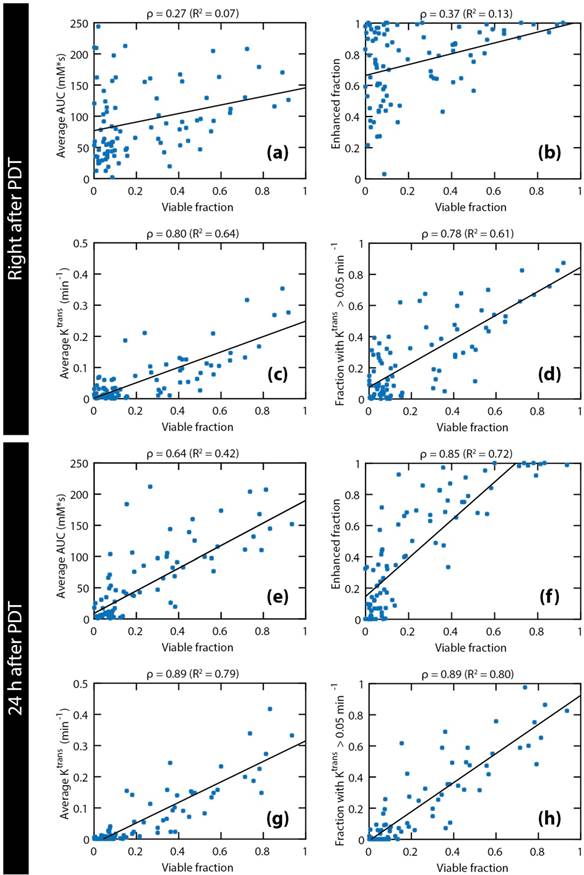
The pooled data of all octants of all treated mice are shown in Figure 7. The examined parameters are the same as in Figure 4. Statistically significant correlations were found for all parameters. Both right after PDT and 24 h after PDT, strong correlations were observed for the average Ktrans and the fraction with Ktrans > 0.05 min-1. Comparison of the average Ktrans and the fraction with Ktrans > 0.05 min-1 at 24 h after PDT with the viable fraction in each octant resulted in the highest correlation coefficient (ρ = 0.89). Besides, a very strong correlation was seen for the enhanced fraction at 24 h after PDT (ρ = 0.85).
Comparison of four DCE-derived parameters to viable fractions in spatial tumor subsections. The following DCE-MRI parameters measured right after and 24 h after PDT are plotted against the viable fraction at 24 h: average AUC (a & e), enhanced tumor fraction (b & f), average Ktrans (c & g), and tumor fraction with a Ktrans value larger than 0.05 min-1 (d & h). Each data point represents the average parameter value or the volume fraction within each tumor octant. Pooled data of all octants of all treated tumors are shown. Linear regression lines are also shown. The Pearson correlation coefficients and the R2 of the regression lines are displayed above each plot.
Post-treatment tumor viability detection maps
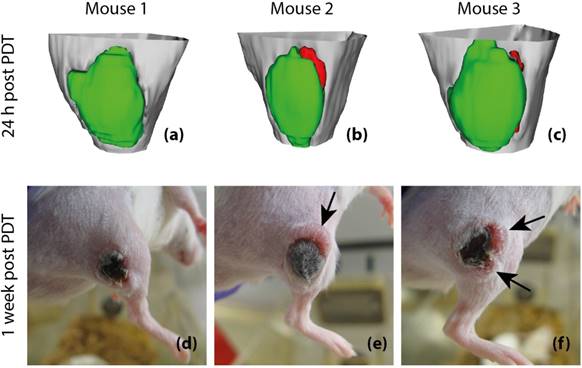
Finally, to assess whether tumor Ktrans has predictive value for post-treatment viability and recurrence, 3D tumor viability detection maps were constructed based on Ktrans measurements obtained at 24 h after PDT, and compared to actual development of tumor status at one week after PDT in 3 animals (Figure 8). The detection maps were calculated by applying a threshold of 0.05 min-1 to Ktrans, and rendered in 3D for the entire tumor. Tumor regions with sub-threshold Ktrans were colored green, while regions with Ktrans > 0.05 min-1 were colored red, indicating that they were suspected to be viable. For the first mouse (Figure 8a & d), no tumor recurrence was observed, which was consistent with the fact that Ktrans values were below the threshold in the whole tumor. In the prediction maps of the other two animals, one or two regions were classified as viable. Indeed, recurring tumor growth was observed at 1 week after PDT at the locations where residual viable tissue was detected.
Post-treatment viability detection maps calculated by applying a threshold of 0.05 min-1 to Ktrans at 24 h after PDT (a-c) and tumor photographs obtained at 1 week after PDT (d-f). The 3D visualized detection maps show the upper part of the hind limb in light gray, with the tumor in green and red. Red volumes indicate suspected viable tissue, while green volumes represent successfully treated tissue. The black arrows indicate the positions of tumor recurrence. Apart from these recurrences, the tumors consisted of dry necrotic tissue.
Discussion
The feasibility of detecting residual viable tissue after PDT using DCE-MRI was studied in a mouse tumor model. The use of DCE-MRI was motivated by the fact that PDT induces vascular shutdown, which can be visualized and quantified by this imaging modality. We therefore hypothesized that it should be possible to non-invasively assess treatment efficacy, detect remaining viable tumor, and even predict tumor recurrence with DCE-MRI. A strong spatial similarity was found between viability stained histological sections versus maps of AUC and Ktrans, reflecting the degrees of contrast agent uptake and blood perfusion, respectively. The spatial similarity was established by visual comparison of histological and DCE-MRI-derived parameter maps, and further quantified by comparing both forms of data in a spatially resolved grid, after registration. Moreover, good correlations were found between the viable tumor fraction versus the average AUC and Ktrans, and versus the tumor fractions with contrast enhancement
or Ktrans above a selected threshold value. AUC and Ktrans values right after and 24 h after PDT indicated the presence of viable tumor regions with (partially) functional blood supply, while non-viable tissue was mostly non-perfused.
Our primary finding is that maps of Ktrans at 24 h after PDT can be used to detect the presence of non-successfully treated tumor tissue. Three-dimensional detection maps of areas with remaining viable tissue were constructed for 3 treated mice, based on a threshold of 0.05 min-1 on Ktrans. In these 3 mice, detection of residual viable tumor tissue at 24 h after PDT correctly predicted the presence and the location of tumor recurrence observed visually after 1 week. These findings suggest that DCE-MRI has excellent potential to predict tumor recurrence and treatment response following therapy, although further prospective evaluation in a larger group of animals is required. Ultimately, it could serve in a personalized treatment setting to decide if patients should receive further treatment.
Although (D)CE-MRI has been used before to assess PDT outcome, this is to the best of our knowledge the first study in which a rigorous comparison between contrast enhancement and vascular parameters versus histological tissue status is performed, with a specific focus on the spatial correspondence. Beyond PDT, vascular-targeted therapies in general form an important class among cancer treatments [29], and ablation therapies such as thermal or cryo-ablation lead to strongly impaired tumor perfusion as well. For these non-PDT therapies, the use of DCE-MRI is more established [28,30], and the PDT field could benefit from these disciplines.
Zilberstein et al. have previously used DCE-MRI for the assessment of tumor response to PDT [19]. Besides a complete loss of contrast enhancement after 24 h similar to our findings, they measured an initial increase in vascular permeability at 1 h after treatment, which was not observed in this study. Huang et al. [31] showed that CE-MRI at 2 and 7 days gave superior delineation of the necrotic zone in PDT-treated canine prostates, compared to T2-weighted or diffusion weighted imaging. However, the predictive value with respect to treatment outcome was not assessed. Others have characterized the response of pancreatic and prostate tumors to PDT on CE-MRI, but also without specific attention to the correlation with tumor recurrence or long-term treatment results [31-33].
An interesting approach that deserves further investigation is the work of Gross et al. [34], who measured changes in the endogenous Blood Oxygenation Level Dependent contrast of tumors during PDT. They attributed these changes to photochemical oxygen consumption, together with hemodynamic effects resulting from vascular occlusion. This technique could be employed for interactive guidance during PDT. Mallidi et al. have performed a study [35] using an alternative pre-clinical imaging technique, viz. photoacoustic imaging, to predict treatment outcome and tumor recurrence after PDT. They used the blood oxygen saturation (StO2) as a prediction biomarker, which is lowered after PDT-induced vascular occlusion. The prediction maps showed excellent correlation with actual treatment outcome after approximately 3 weeks. A drawback of photoacoustic imaging is that it is not easily translated to a clinical setting. Besides, although the prediction maps were presented as 3D data, they were constructed from the average StO2 value in every B-scan and should therefore rather be considered 1D.
To provide a quantitative assessment of the spatial correspondence between the DCE-MRI parameter maps and histological viability stained sections, a simple registration approach was devised to transform the complete tumor slice stacks of histological viability images into the same coordinate system as the multi-slice MR data. Although the registration included some manual steps, a good overlap and shape similarity of the registered tumor contours was obtained, despite slight mismatches in tumor orientation and position of the MR slices versus cryosections, potential deformations due to differences in hind limb position during the MR scan, and artifacts due to freezing and sectioning. The tumors were subsequently subdivided in 8 octants, corresponding to different anatomically meaningful locations. Although this resulted in a rather coarse spatial resolution, a finer resolution was not appropriate, given the complexity of registration. We believe that this yielded accurate and valuable information about spatial correspondence, alongside the qualitative visual comparison of multi-slice histological and MR data.
Average tumor Ktrans or the fraction with Ktrans > 0.05 min‑1 correlated better to the tumor viable fraction than the average AUC or enhanced fraction. The reason is likely that positive AUC values are not necessarily indicative of intact micro-vascular perfusion. Considerably large regions with positive AUC were observed where the influx rate of contrast agent was so slow that enhancement was more likely due to diffusion rather than perfusion. This also explains why the enhanced fraction overestimated the viable fraction. On the other hand, a non-zero Ktrans indicates a functional blood supply and therefore almost certainly implies viable tissue that was not successfully treated. It should be noted however, that regions without functional perfusion (Ktrans = 0) in the vicinity of regions with perfusion (non-zero Ktrans) may still have access to sufficient oxygen through diffusion. Therefore, such non-perfused tissues can be viable, but would remain undetected using Ktrans.
In most treated tumors, a rim of viable tumor cells of 100-200 μm width just below the skin was observed in NADH-diaphorase stained sections, even though the rest of the tumor was largely non-viable. Interestingly, no blood vessels were detected in these borders by immunofluorescent staining of CD31 cells, while the treated parts were largely vascularized (data not shown). Control tumors also showed absence of CD31 staining in the peripheral borders. It is conceivable that these zones were viable because the photosensitizer was not able to penetrate into these tissues due to the absence of blood vessels. However, they apparently receive enough oxygen to survive, diffusing in from adjacent tissue. This reveals a potential pitfall of our treatment evaluation method, which lacked the resolution to in vivo detect this small rim of viable tissue. It also highlights the general limitation of vascular-targeted PDT that it only works for well-perfused tumors.
While this study focused on the classification of successfully versus non-successfully treated tumor tissue, micro-vascular effects of PDT were also observed in adjacent muscle tissue. In some animals, substantial parts of muscle were non-perfused after treatment, which could indicate overtreatment or a lack of tumor specificity. Future work should be aimed at verifying if irreversible damage occurred in the adjacent muscle tissue using histological analysis, and the correlation with reductions in muscle perfusion should be investigated. The DCE-MRI methods in this study might be useful to detect collateral damage to muscle tissue, which could be helpful to optimize PDT protocols to minimize these side effects.
The MRI protocol for treatment evaluation presented in this study can be transferred to a clinical MRI scanner rather straightforwardly. It could be applied to assure effective outcome and to provide a basis for well-directed and timely follow-up treatment if necessary. Alternatively, it may be used in a clinical research setting, where predicted treatment outcome could serve as an endpoint in trial studies. Finally, preclinical PDT research could greatly benefit from this quantitative and early evaluation technique, for example to study the efficacy of new photosensitizers or different treatment protocols, or to provide new insights in the mechanisms behind PDT.
Conclusion
The relation between tumor tissue viability after PDT and DCE-MRI parameters (AUC, Ktrans, and ve) acquired within a day after treatment was extensively investigated. PDT induces vascular occlusion, which is manifested in DCE-MRI as a drastic decrease in contrast agent uptake and a loss of perfusion (Ktrans = 0). Results demonstrated that histologically determined tissue viability response and tumor recurrence could be inferred from the changes in contrast enhancement and perfusion parameter maps. Specifically, tumor regions with Ktrans > 0.05 min-1 at 24 h after PDT showed a strong spatial correspondence with residual viable tissue. This study forms an important step towards personalized monitoring of PDT outcome, but may also be useful in PDT-related preclinical research.
Abbreviations
AIF: arterial input function; AUC: area under the curve; DCE-MRI: dynamic contrast-enhanced MRI; EES: extracellular extravascular space; FA: flip angle; FOV: field of view; H&E: hematoxylin and eosin; MRI: magnetic resonance imaging; NA: number of averages; NADH: nicotinamide adenine dinucleotide; PDT: photodynamic therapy; TE: echo time; TR: repetition time.
Competing Interests
The authors have declared that no competing interest exists.
References
1. Agostinis P, Berg K, Cengel KA, Foster TH, Girotti AW, Gollnick SO. et al. Photodynamic Therapy of Cancer: An Update. CA Cancer J Clin. 2011;61:250-81
2. Dougherty TJ, Grindey GB, Riel R, Weishaupt KR, Boyle DG. Photoradiation therapy II - Cure of animal tumors with hematoporphyrin and light. J Natl Cancer Insitute. 1975;55(1):115-21
3. Fingar VH. Vascular effects of photodynamic therapy. J Clin Laser Med Surg. 1996Oct;14(5):323-328
4. Trachtenberg J, Weersink RA, Davidson SRH, Haider MA, Bogaards A, Gertner MR. et al. Vascular-targeted photodynamic therapy (padoporfin, WST09) for recurrent prostate cancer after failure of external beam radiotherapy: A study of escalating light doses. BJU Int. 2008;102(5):556-62
5. Azzouzi A-R, Barret E, Moore CM, Villers A, Allen C, Scherz A. et al. TOOKAD ® Soluble vascular-targeted photodynamic (VTP) therapy: determination of optimal treatment conditions and assessment of effects in patients with localised prostate cancer. BJU Int. 2013;112(6):766-74
6. Azzouzi A-R, Vincendeau S, Barret E, Cicco A, Kleinclauss F, van der Poel HG. et al. Padeliporfin vascular-targeted photodynamic therapy versus active surveillance in men with low-risk prostate cancer (CLIN1001 PCM301): an open-label, phase 3, randomised controlled trial. Lancet Oncol. 2016;2045(16):1-11
7. Kimm SY, Tarin T V, Monette S, Srimathveeravalli G, Gerber D, Durack JC. et al. Nonthermal Ablation by Using Intravascular Oxygen Radical Generation with WST11: Dynamic Tissue Effects and Implications for Focal Therapy. Radiology. 2016;281(1):141571
8. Murray KS, Winter AG, Corradi RB, LaRosa S, Jebiwott S, Somma A. et al. Treatment Effects of WST11 Vascular Targeted Photodynamic Therapy for Urothelial Cell Carcinoma in Swine. J Urol. 2016;196(1):236-43
9. Huggett MT, Jermyn M, Gillams A, Illing R, Mosse S, Novelli M. et al. Phase I/II study of verteporfin photodynamic therapy in locally advanced pancreatic cancer. Br J Cancer. 2014;110(7):1698-704
10. Bechet D, Mordon SR, Guillemin F, Barberi-Heyob MA. Photodynamic therapy of malignant brain tumours: A complementary approach to conventional therapies. Cancer Treat Rev. 2014;40(2):229-41
11. Freedland SJ. Low-risk prostate cancer: to treat or not to treat. Lancet Oncol. 2017;18(2):156-157
12. Marusyk A, Almendro V, Polyak K. Intra-tumour heterogeneity: a looking glass for cancer? Nat Rev Cancer. 2012;12(5):323-34
13. Heppner GH, Miller BE. Therapeutic implications of tumor heterogeneity. Semin Oncol. 1989;16:91-105
14. Pogue BW, Chen B, Zhou X, Hoopes PJ. Analysis of sampling volume and tissue heterogeneity on the in vivo detection of fluorescence. J Biomed Opt. 2009;10(4):41206
15. Chen Q, Huang Z, Chen H, Shapiro H, Beckers J, Hetzel FW. Improvement of tumor response by manipulation of tumor oxygenation during photodynamic therapy. Photochem Photobiol. 2002;76(2):197-203
16. Eisenhauer EA, Therasse P, Bogaerts J, Schwartz LH, Sargent D, Ford R. et al. New response evaluation criteria in solid tumours : Revised RECIST guideline ( version 1. 1 ). Eur J Cancer. Elsevier Ltd. 2008;45(2):228-47
17. Schreurs TJL, Hectors SJ, Jacobs I, Grüll H, Nicolay K, Strijkers GJ. Quantitative Multi-Parametric Magnetic Resonance Imaging of Tumor Response to Photodynamic Therapy. PLoS One. 2016;11(11):e0165759
18. Barrett T, Davidson SRH, Wilson BC, Weersink RA, Trachtenberg J, Haider MA. Dynamic contrast enhanced MRI as a predictor of vascular-targeted photodynamic focal ablation therapy outcome in prostate cancer post-failed external beam radiation therapy. J Can Urol Assoc. 2014;8:E708-14
19. Zilberstein J, Schreiber S, Bloemers MC, Bendel P, Neeman M, Schechtman E. et al. Antivascular treatment of solid melanoma tumors with bacteriochlorophyll-serine-based photodynamic therapy. Photochem Photobiol. 2001;73(3):257-66
20. Deoni SCL, Rutt BK, Peters TM. Rapid combined T1 and T2 mapping using gradient recalled acquisition in the steady state. Magn Reson Med. 2003;49(3):515-26
21. Dowell NG, Tofts PS. Fast, accurate, and precise mapping of the RF field in vivo using the 180 degrees signal null. Magn Reson Med. 2007;58(3):622-30
22. Anderson JK, Baker M, Jaffers O, Pearle MS, Lindberg GL, Cadeddu JA. Time course of nicotinamide adenine dinucleotide diaphorase staining after renal radiofrequency ablation influences viability assessment. J Endourol. 2007;21(2):223-7
23. Sun X, Li XF, Russell J, Xing L, Urano M, Li GC. et al. Changes in tumor hypoxia induced by mild temperature hyperthermia as assessed by dual-tracer immunohistochemistry. Radiother Oncol. 2008;88(2):269-76
24. Elst L Vander, Raynaud J-S, Vives V, Santus R, Louin G, Robert P. et al. Comparative Relaxivities and Efficacies of Gadolinium-based Commercial Contrast Agents. Proc Intl Soc Mag Reson Med. 2013 p 746
25. Tofts PS, Kermode AG. Measurement of the blood-brain barrier permeability and leakage space using dynamic MR imaging. Magn Reson Med. 1991;17(2):357-67
26. Vácha J. Blood volume in inbred strain BALB/c, CBA/J and C57BL/10 mice determined by means of 59Fe-labelled red cells and 59Fe bound to transferrin. Physiol Bohemoslov. 1975;24(5):413-9
27. Fruytier AC, Magat J, Jordan B, Cron G, Colliez F, Gallez B. Dynamic contrast-enhanced MRI in mice at high field: Estimation of the arterial input function can be achieved by phase imaging. Magn Reson Med. 2014;72(2):602
28. Jacobs I, Hectors SJCG, Schabel MC, Grüll H, Strijkers GJ, Nicolay K. Cluster analysis of DCE-MRI data identifies regional tracer-kinetic changes after tumor treatment with high intensity focused ultrasound. NMR Biomed. 2015;28:1443-54
29. Ellis LM, Hicklin DJ. VEGF-targeted therapy: mechanisms of anti-tumour activity. Nat Rev Cancer. 2008;8(8):579-91
30. Leslie TA, Kennedy JE, Illing RO, Haar GR Ter, Wu F, Phillips RR. et al. High-intensity focused ultrasound ablation of liver tumours: Can radiological assessment predict the histological response? Br J Radiol. 2008;81(967):564-71
31. Huang Z, Haider M a, Kraft S, Chen Q, Blanc D, Wilson BC. et al. Magnetic resonance imaging correlated with the histopathological effect of Pd-bacteriopheophorbide (Tookad) photodynamic therapy on the normal canine prostate gland. Lasers Surg Med. 2006;38(7):672-81
32. Kulik M, Nedelcu C, Martin F, Lebdai S, Rousselet MC, Azzouzi AR. et al. Post-treatment MRI aspects of photodynamic therapy for prostate cancer. Insights Imaging. 2014;5(6):697-713
33. Samkoe KS, Chen A, Rizvi I, O'Hara J a, Hoopes PJ, Hasan T. et al. Magnetic resonance image-guided photodynamic therapy of xenograft pancreas tumors with verteporfin. Kessel DH, editor. 2009;7164:71640D-71640D -9
34. Gross S, Gilead A, Scherz A, Neeman M, Salomon Y. Monitoring photodynamic therapy of solid tumors online by BOLD-contrast MRI. Nat Med. 2003;9(10):1327-31
35. Mallidi S, Watanabe K, Timerman D, Schoenfeld D, Hasan T. Prediction of Tumor Recurrence and Therapy Monitoring Using Ultrasound-Guided Photoacoustic Imaging. Theranostics. 2015;5(3):289-301
Author contact
![]() Corresponding author: t.j.l.schreursnl
Corresponding author: t.j.l.schreursnl