Impact Factor
- Issue 14; 2026
- Issue 13; 2026
- Issue 12; 2026
- Issue 11; 2026
- Issue 10; 2026
- Volume 16; 2026
- Advance Articles
- Past Issues
- Cover Images
- Cover Suggestion
- Index & Coverage
- Special Issues
Introduction
Materials and Methods
Results
Discussion
Conclusion
Abbreviations
Supplementary Material
Acknowledgements
References
International Journal of Biological Sciences
International Journal of Medical Sciences
 Global reach, higher impact

Theranostics 2017; 7(18):4470-4479. doi:10.7150/thno.20616 This issue Cite
Research Paper
Characterization of Cardiac Dynamics in an Acute Myocardial Infarction Model by Four-Dimensional Optoacoustic and Magnetic Resonance Imaging
Hsiao-Chun Amy Lin1, 2, Xosé Luís Déan-Ben1, Ivana Ivankovic1, 2, Melanie A. Kimm3, Katja Kosanke3, Helena Haas3, Reinhard Meier3, Fabian Lohöfer3, Moritz Wildgruber2, 3, 4 *, Daniel Razansky1, 2* ![]()
1. Institute for Biological and Medical Imaging (IBMI), Helmholtz Center Munich, Neuherberg, Germany;
2. Faculty of Medicine, Technical University of Munich, Germany;
3. Department of Diagnostic and Interventional Radiology, Technical University of Munich, Germany;
4. Translational Research Imaging Center, Department of Clinical Radiology, Universitätsklinikum Münster, Germany.
* Equal contribution
Received 2017-4-17; Accepted 2017-6-15; Published 2017-10-7
Abstract

Extraction of murine cardiac functional parameters on a beat-by-beat basis is limited with the existing imaging modalities due to insufficient three-dimensional temporal resolution. Faster volumetric imaging methods enabling in vivo characterization of functional parameters are poised to advance cardiovascular research and provide a better understanding of the mechanisms underlying cardiac diseases. We present a new approach based on analyzing contrast-enhanced optoacoustic (OA) images acquired at high volumetric frame rate without using cardiac gating or other approaches for motion correction. We apply an acute murine myocardial infarction model optimized for acquisition of artifact-free optoacoustic imaging data to study cardiovascular hemodynamics. Infarcted hearts (n = 21) could be clearly differentiated from healthy controls (n = 9) based on a significantly higher pulmonary transit time (PTT) (2.25 [2.00-2.41] s versus 1.34 [1.25-1.67] s, p = 0.0235), while no statistically significant difference was observed in the heart rate (318 [252-361] bpm versus 264 [252-320] bpm, p = 0.3129). Nevertheless, nonlinear heartbeat dynamics was stronger in the healthy hearts, as evidenced by the third harmonic component in the heartbeat spectra. MRI data acquired from the same mice further revealed that the PTT increases with the size of infarction and similarly increases with reduced ejection fraction. Moreover, an inverse relationship between infarct PTT and time post-surgery was found, which suggests the occurrence of cardiac healing. In combination with the proven ability of optoacoustics to track targeted probes within the injured myocardium, our method can depict cardiac anatomy, function, and molecular signatures, with both high spatial and temporal resolution. Volumetric four-dimensional optoacoustic characterization of cardiac dynamics with supreme temporal resolution can capture cardiovascular dynamics on a beat-by-beat basis in mouse models of myocardial ischemia.
Keywords: acute myocardial infarction, real-time cardiac imaging, photoacoustics, heart rate, optoacoustic imaging, pulmonary transit time.
Introduction
Coronary heart diseases remain a leading cause of death worldwide [1, 2], accentuating the demand for new methods for the prevention and treatment of these conditions. Animal models represent a fundamental tool for the understanding of pathophysiological mechanisms underlying ischemic injury and reperfusion as well as for the development and optimization of new therapeutic approaches [3]. Technical and economic constrains promote the wide use of small mammals, particularly mice, to mimic disease conditions, and the availability of genetically manipulated mice strains further contributes to the importance of murine animal models for cardiovascular research [4, 5, 6].
Imaging technologies are a fundamental tool for in vivo biological studies of mouse models [7, 8]. Cardiovascular Magnetic Resonance Imaging (MRI) is frequently used to study cardiovascular dynamics due to its excellent spatial resolution and high-contrast anatomical visualization capacity, which enables the characterization of organ-level functional parameters such as cardiac volumes or ejection fraction [9, 10]. However, the temporal resolution of MRI is limited, and together with its susceptibility to motion artifacts requires the use of gating approaches for cardiac imaging. Although ECG-free acquisition methods are being developed, a beat-by-beat characterization of the heart remains difficult with this imaging technology, particularly in mice (400-600 beats per minute). Pulse-echo and Doppler ultrasound (US) can render real-time images of the heart [11]. Yet, pulse-echo US images are formed by sequential acquisition of a large number of A-lines, thus prone to artefacts related to rapid cardiac motion and intraobserver variability. Recently, 3D US image acquisition was significantly accelerated by the introduction of methods relying on coherent compounding of backscattered echoes resulting from successive tilted plane or diverging waves emissions [12]. However, high-frame-rate 3D US imaging of the beating murine heart has not yet been demonstrated. Confocal fluorescence microscopy and other optical imaging modalities have also been used to image living heart tissue and detect targeted molecules with high resolution and sensitivity [13-15]. Optical methods are nevertheless strongly susceptible to photon scattering. Thereby, the penetration depth is extremely limited when imaging whole organs, and often requires the heart to be imaged ex vivo or extracted in a Langendorff set-up [16].
Recently, we have demonstrated the unique capability of optoacoustic (OA) tomography for real-time imaging [17, 18] with sufficiently high spatial-temporal resolution to resolve the fast beating mouse heart in 3D. Vital cardiac anatomy was resolved, and functional cardiac parameters could be quantified in healthy mice [19]. Of particular importance is the feasibility to measure the pulmonary transit time (PTT), i.e., the time required for blood to travel through the pulmonary circulation from the right to the left ventricles, by imaging the cardiac perfusion of a contrast agent at a very high frame rate in three dimensions. With progressive impairment of heart function following myocardial infarction the pulmonary transit time is expected to increase. Herein, we build upon the previously demonstrated technical capacity in order to explore cardiac function in a myocardial infarction model to study hemodynamic parameters in cardiovascular disease. A dedicated volumetric OA imaging system is introduced for high performance cardiac OA imaging in mice. We further established a suitable mouse model of myocardial infarction compatible with OA tomography. In this framework, we explore the use of the OA tomography system for real-time visualization, processing of functional cardiac parameters, comparison between infarct and healthy mice and cross-validation of the results with MRI.
Materials and Methods
The acute murine myocardial infarction model
Procedures involving animals and their care were conducted in conformity with institutional guidelines and with approval from the Government of Upper Bavaria (Protocol Number 55.2-1-54-2532-85-13) and conformed to Position of the American Heart Association on Research Animal Use. To this end, strongly absorbing black hair and sutures in standard infarct models have generated strong image artifacts hampering OA cardiac imaging of those models. Herein, albino mice on a 'black six' background were used while surgical glue was further employed to close the wound instead of high absorbing sutures. Albino C57BL/6J mice aged 12-16 weeks were used for the acute infarct model. Hair was removed around the entire chest prior to the infarct surgery, for which the mice were intubated and mechanically ventilated. The rib cage was exposed between ribs 4 and 5, and a permanent ligation placed around the left descending coronary artery using 8.0 sutures. The rib cage was bound with three stiches and the skin was finally closed with clear glue. OA imaging was performed on day 3 (n = 3), day 10 (n = 10), and day 21 (n = 8) after the permanent coronary artery ligation. Note that longitudinal OA studies of the same infarcted mice were not permitted under our animal protocol, thus time-lapse data were acquired from different subjects. Healthy mice were also imaged (n = 9) to serve as control. Before in vivo experiments, hair of the mice was removed again using depilatory cream. The mice were anesthetized for the imaging session using a ~2% isoflurane-medical air mixture (~0.8 l/min gas flow). For high-frame-rate in vivo monitoring of cardiac dynamics with enhanced contrast and characterization of the PTT, 100 nmol indocyanine green (ICG, Profiplus Bvba, Kortessem, Belgium) diluted in 50 μL of saline was injected intravenously. Throughout the experiments, the animal physiology was continuously monitored using a rectal thermometer and a feedback-controlled heating pad (PhysioSuite, Kent Scientific, Torrington, Connecticut) to ensure the well-being of the animal.
OA imaging set-up
A dedicated real-time volumetric OA tomography system was designed, specifically tailored for high performance 4D cardiac imaging in mice. The imaging system consists of a spherical matrix array detection probe, custom-made by Imasonic Sas (Voray, France), having 512 individual piezoelectric elements. Each element has a diameter of 2.5mm and approximately 100% bandwidth (at -6dB) around a central frequency of 5 MHz, resulting in nearly isotropic volumetric resolution of 150µm. The spherical aperture of the array has a radius of 40 mm and covers a solid angle of 140º around the imaged area. As compared with previous OA tomography implementations [17-19], the new design provides broad angular coverage and large number of detection elements, hence allowing for reduction of limited-view image artifacts and providing greater sensitivity and imaging depth. During an in vivo OA imaging experiment, the spherical array was oriented up-wards, as illustrated in Supplementary Figure S1. Hot clear agar in liquid form (1.3% by weight) was allowed to cool to ~40ºC before being poured onto the curved active surface of the probe array to fill the spherical cavity. To avoid formation of air bubbles in the set agar, the liquid agar solution was carefully stirred and subsequently placed in a sonic bath. After solidification, the imaged mouse was placed in a prone position onto the agar gel acting as an acoustic coupling medium between the transducer elements and the imaged sample. Ultrasound gel was further used between the agar surface and the mouse to guarantee good acoustic coupling.
The illumination source is a fast tuning pulsed laser based on an optical parametric oscillator (OPO), delivering <10 ns pulses with approximately 20 mJ energy per pulse (Innolas Laser GmbH, Krailling, Germany). The wavelength of the laser can be tuned between 700 - 900 nm on a per pulse basis and its maximal pulse repetition rate is 100 Hz. The laser output is guided through the center of the spherical ultrasound probe by a custom made fiber bundle (Ceram Optec GmbH, Bonn, Germany). With the numerical aperture (NA) of 0.22, the bundle delivered approximately Gaussian beams with a full-width half-maximum (FWHM) of 12 mm onto the tissue surface, located approximately 35 mm from its distal end. The peak light fluence at the tissue surface was measured to be 3.3 mJ/cm2 at 800nm. For each laser pulse, the generated OA signals detected by all the array elements were simultaneously sampled with a custom-made data acquisition system (DAQ) consisting of 512 parallel analog-to-digital converters (Falkenstein Mikrosysteme GmbH, Taufkirchen, Germany). The data acquisition process was controlled by custom-made computer software (Matlab, Massachusetts, USA).
Optoacoustic image reconstruction and real-time preview
Mouse positioning in the experimental setup was facilitated by on-the-fly visualization (pre-view) of the three-dimensional OA images, which ensured an optimal view of the heart. The real-time visual feedback was enabled by an accelerated 3D reconstruction algorithm based on graphics processing units [20]. For each ICG injection experiment, 3D OA data from the entire heart area were recorded at an excitation wavelength of 800 nm at a volumetric frame rate of 50Hz for a total duration of 40s. For the image reconstruction, the measured electrical impulse response of the detection transducer elements was first deconvolved from the acquired temporal signals [21]. The signals were then band-pass filtered with a second-order Butterworth filter with cut-off frequencies at 0.1 and 7 MHz. A three-dimensional volume of 12✕12✕12 mm3 was eventually reconstructed for each time instance containing 120✕120✕120 voxels. To preserve the effective 3D temporal resolution at 20 ms (50 volumes per second), no signal averaging was performed during the data acquisition and reconstruction.
Magnetic Resonance Imaging
For validation of the OA imaging results, all animals were imaged in a horizontal bore 7T small animal Magnetic Resonance Imaging (MRI) scanner (Discovery MR901, GE Healthcare, Chalfont St. Giles, United Kingdom) either on the same day or the day before OA imaging. The scanner is equipped with a 300 mTm-1 standard high-field gradient system and a 72 mm inner diameter 1H/13C quadrature birdcage resonator (Rapid Biomedical, Rimpar, Germany). The latter was only used for transmission while signals were received by a 2-channel surface coil placed around the heart. Image acquisition was performed under free-breathing conditions and with prospective ECG triggering using a small animal monitoring and gating system (Rapid Biomedical, Rimpar, Germany). Electrodes for gating of the ECG signal were placed at the front paws. During imaging the animal core temperature was maintained at 38°C using an MR-compatible air-heating system. After acquisition of standard scout scans, 2-chamber, 4-chamber and short-axis CINE-views were obtained. Those were subsequently used for planning the slice orientations for LGE imaging. Gd-DTPA injected at a dose of 0.2 mmol kg-1 body weight via the tail vein. After selecting the proper imaging planes for LGE assessment, a segmented inversion-recovery fast gradient echo sequence was performed using the following parameters: FOV 30 x 30 mm, matrix 192 x 192 (in-plane resolution 156 µm), slice thickness 1 mm, TR/TE 7.6 ms/3.1 ms, flip angle 60°, 4 lines/RR interval, 2 scans, and 8 short-axis slices. Delay after inversion was set to 350 ms. Cardiac gating was set to give an effective TR of 1 s from one inversion to the next. Analysis of heart function parameters and infarct size Osirix plugins were used (Version 4.1.1.), as described before [22].
Heart rate analysis
Fast Fourier transforms (FFT) were performed on the temporal traces of the OA reconstructions on a voxel-by-voxel basis. The frequency spectra of all voxels were summed, and the peak frequency of this sum spectrum is determined to be the heartrate, as this parameter is assumed to be the dominant contributor to signal oscillations.
Extraction of the pulmonary transit time from the volumetric OA image sequences
The extraction of the pulmonary transit time was performed in the image domain. For a robust estimation of the maxima in the temporal perfusion profiles, a moving average over 100 consecutive frames was applied to smooth the signals on a per voxel basis. Furthermore, the signal time-to-peak was calculated over regions-of-interest (ROI) containing >1000 adjacent voxels to cancel out any random spatial fluctuations. This required accurate segmentation of the cardiac chambers and removal of other unrelated features such as blood vessels and scar artifacts.
Instead of manual segmentation, we developed an automated framework based on frequency analysis of the temporal perfusion profiles in each reconstructed voxel and extraction of the heart beat rate. This enabled distinguishing the cardiac muscle from nearby tissue without necessitating any manual input for ROI selection. First, FFT was performed for each individual voxel to extract its frequency spectrum. Next, the ratio between the main heartbeat harmonic over the spectral mean was taken for each voxel, resulting in a complete frequency fraction map. The higher values correspond to a strong presence of the heart beat rate, and thus a high likelihood of the voxel representing cardiac tissue. A binary segmentation mask was then obtained by heuristically selecting a suitable threshold such that an optimal trade-off is achieved between including voxels belonging to the heart while rejecting noisy voxels.
The time-to-peak of every individual voxel was found by identifying the peaks in the temporal profiles, which were smoothened by a moving average applied over 100 consecutive frames. After the segmentation and identification of the ROIs representing the left and right ventricles, a reliable estimation of the pulmonary transit time was then made by finding the difference between the averaged time-to-peak values in the two ventricles.
Statistical analysis
The statistical analysis was performed on measurements taken from 21 infarcted and 9 healthy mice. Specifically, boxplots of the PTT values as well as of the amplitudes of the first, second and third harmonic components of the heart beat for infarcted and healthy mice were displayed and the corresponding values of median and interquartile ranges were calculated. Comparisons of parameters between infarct and healthy models were performed using the one-sample t-test, assuming normal distribution. The result of the t-test rejects the null hypothesis at the 5% significance level, i.e., the differences between the calculated parameters for infarcted and non-infarcted mice were considered statistically significant for p<0.05. One-way analysis of variance was used to compare the 3, 10, and 21 day PTT results. Correlation analyses were done using Spearman correlation coefficient. All calculations were done using Matlab (version R2013a, Mathworks Inc., Natick, MA, USA).
Results
Temporal analysis of ICG injection and pulmonary transit time measurements
Figure 1a-c shows temporal snapshots of the cardiac flow dynamics, displayed as maximum intensity projections (MIPs) of the reconstructed three-dimensional OA images. Fig. 1a shows an example of a sequence of 3 images acquired from a healthy mouse, whereas the data shown in both Fig. 1b and 1c were recorded from infarcted mice. tο represents the baseline OA image at 800 nm right before the ICG agent enters the heart. As ICG is injected, a strong increase in OA signal is observed. t1 corresponds to the instant for which the ICG bolus enters into the right ventricle (RV), and at a later time point, t2, the contrast agent arrives into the left ventricle (LV). A video showing the complete ICG perfusion dynamics can be found as Supplementary Movie 1.
Optoacoustic imaging of indocyanine green (ICG) injection events in healthy and infarcted mice using single wavelength illumination at 800 nm. (a-c) Temporal optoacoustic snapshots (presented as maximum intensity projections, MIP) at selected instances acquired from (a) healthy mouse, (b) infarcted mouse, and (c) infarcted mouse with severe tissue scarring. The baseline image is shown at tο. The ICG bolus can be observed entering into the right ventricle (RV) at t1, and into the left ventricle (LV) at a later time point, t2. Other anatomical features labeled here include the right and left atria (RA and LA respectively), and the right and left internal thoracic arteries (RITA and LITA). (d-f) The RV and LV temporal signal profiles of (a-c) respectively, where the corresponding tο , t1, and t2 time points are indicated. The raw data (blue traces) are smoothed using a running average method (red traces) to allow for a robust estimation of the maxima, indicating the peak absorbance of ICG at t1 for RV, and t2 for LV. The difference in these time-to-peaks, Δt, was assumed to be the pulmonary transit time (PTT).
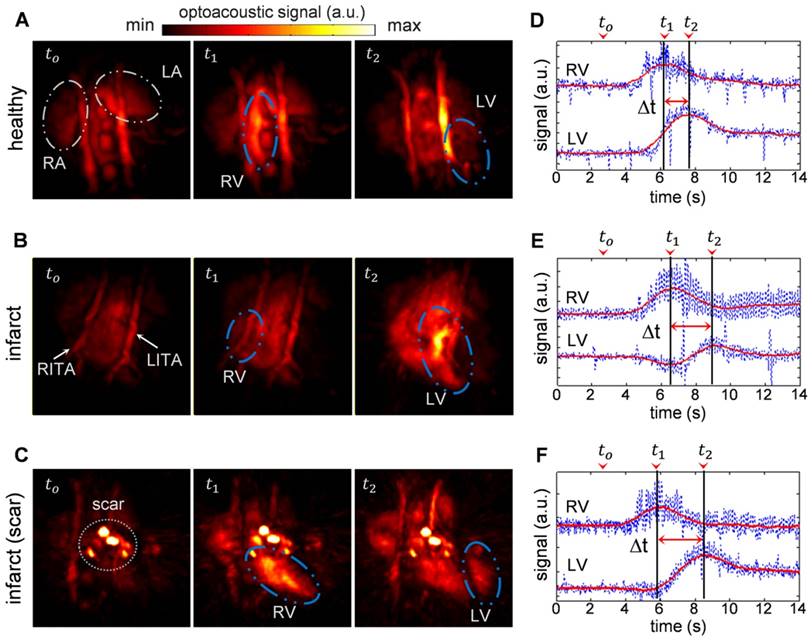
The high image resolution (~150 μm) enables clear identification of anatomical features in the infarcted heart shown in Fig. 1b, as labeled in the image. Specifically, the left and right internal thoracic arteries (LITA and RITA) can be clearly seen on top of the heart. In contrast, one imaging session (Fig. 1c) has rendered prominent artifacts observable throughout the time-series images (circled). This was most likely caused by tissue scarring resulting from the infarction surgery. However, the scarring artifacts did not affect the analysis for pulmonary transit time as the pronounced rise in optical absorbance in the right and left ventricles at the t1 and t2 instants were readily detectable without the need for additional data processing.
Figure 1d-f displays the temporal profiles of the right and left ventricles for the experiments shown in a-c respectively, where the tο , t1, and t2 time points are labeled. The temporal profiles of the reconstructed voxels, plotted in blue, consist of high frequency oscillations due to heart beat, while protruding spikes are attributed to breathing occurring at ~2 s intervals. Yet, the pulmonary transit time can readily be measured from the profiles after temporal averaging, as described in the methods section.
Statistical analyses of the results obtained from 21 infarcted and 9 healthy mice are summarized in Fig. 2. For details of the analytical method, please refer to the methods section. Overall, the pulmonary transit times of infarcted hearts (2.25 [2.00-2.41] s) were significantly higher (p = 0.0235) than that of healthy mice (1.34 [1.25-1.67] s), demonstrated in Fig. 2a. Moreover, a correlation was found between PTT of infarcted mice and time lapsed from the occlusion surgery. As shown in Fig. 2b, the highest PTT values were measured 3 days after permanent occlusion (2.79 [2.69-2.87] s), significantly dropping to 2.35 [2.07-2.40] s after 10 days, and to 2.05 [1.90-2.18] s at day 21 (p < 0.0001). The results show a 50-100% increase in the pulmonary transit time for mice with compromised heart function.
Statistical analysis of pulmonary transit time extracted from the time-resolved volumetric optoacoustic data. (a) PTT of infarcted hearts (2.25 [2.00-2.41] s) were significantly higher than that of healthy mice (1.34 [1.25-1.67] s, p = 0.0235). (b) PTT at different time points after infarction surgery: 3 days (2.79 [2.69-2.87] s), 10 days (2.35 [2.07-2.40] s), and 21 days (2.05 [1.90-2.18] s), (p < 0.0001).
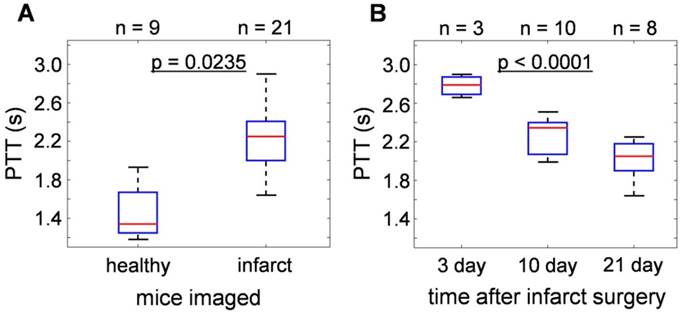
The normalized PTT by individual heartrates are shown in Supplementary Figure S2. It was found that it typically took around 7 cardiac cycles to complete the pulmonary cycle in healthy mice, while infarct mice required a much higher number of 12 cardiac cycles. The results exhibit the same trend that can be seen in the unnormalized results from figure 2, including the drop in PTT with respect to the time point after the infarct surgery.
Analysis of the cardiac rate variations
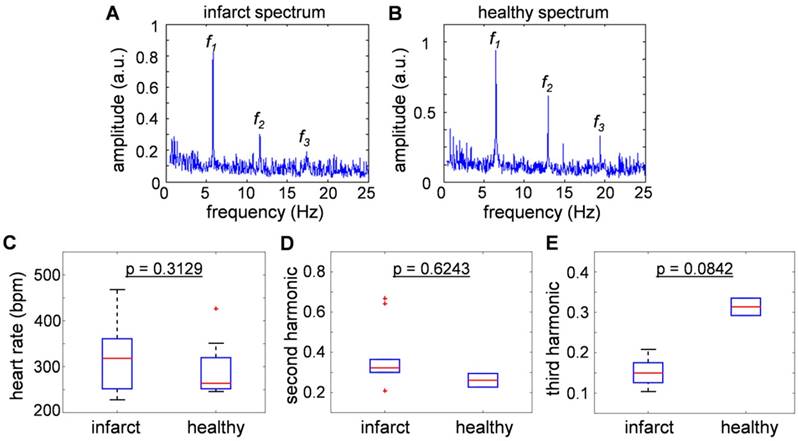
Figure 3a and 3b show typical frequency spectra of the signals recorded from healthy and infarcted mice. The peak components in the power spectra were assumed to be the fundamental heartbeat frequency (f1) and its second (f2) and third (f3) harmonic spectral components. Fig. 3c compares the results from 9 healthy and 21 infarcted animals. No statistically significant differences were observed in the heartbeat rate (318 [252-361] bpm versus 264 [252-320] bpm, p = 0.3129). Fig. 3d and 3e are the second and third harmonics shown as a ratio over the fundamental frequency, thus effectively representing nonlinearity of the heartbeat. The second harmonic component was found to be statistically inconclusive regarding the infarct disease state (p = 0.6243). Interestingly, the third harmonic was found to be distinctively lower in amplitude for the infarcted hearts: 0.15 [0.126-0.175] versus 0.3135 [0.292-0.335], p = 0.0842 in healthy animals. This result is congruent with the findings reported for the power spectra recorded with Electrocardiography (ECG) [23], where the drop of the amplitude was more substantial for higher harmonics. In general, the nonlinearity of the heartbeat could be attributed to the presence of arrhythmia.
Comparisons of heart beat rate between healthy and infarct mice derived from the optoacoustic images. (a-b) The sum frequency spectra for all image voxels of (a) healthy and (b) infarcted mice. The peak component (f1) is assumed to be the heartbeat frequency, while f2 and f3 are the second and third harmonics. (c) Statistical summary of heat beat rate of infarct and healthy mice (318 [252-361] bpm versus 264 [252-320] bpm), where no statistically significant difference was observed between the infarcted versus healthy animals (p = 0.3129). (d) Second and (e) third harmonic components, presented as a ratio over the fundamental frequency. No significant correlation was exhibited in the second harmonic component (p = 0.6243), and the third harmonic was found to be lower in the infarcted versus healthy mice (0.15 [0.126-0.175] versus 0.3135 [0.292-0.335], p = 0.0842).
Magnetic Resonance Imaging
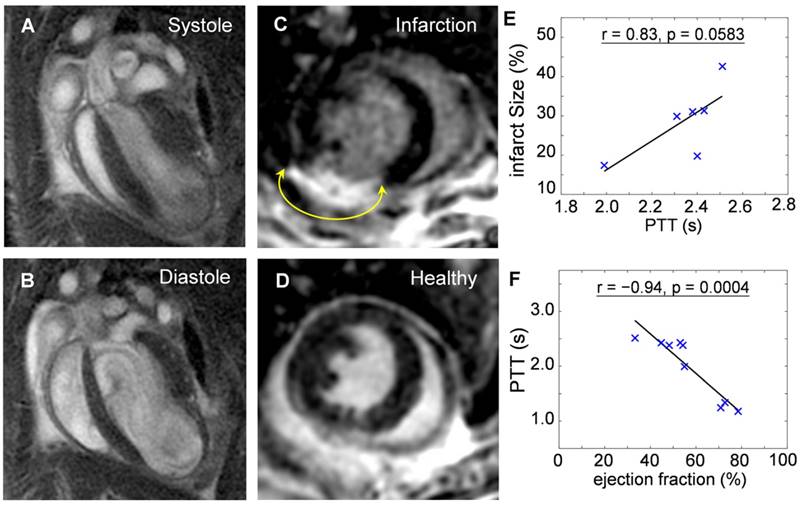
Mice at 10-days post infarction were investigated with MRI for validation of the compromised heart function before undergoing OA imaging. Fig. 4a and 4b show cine sequences of 4-chamber views at the systole (Fig. 4a) and diastole (Fig. 4b) states. Late gadolinium enhancement in short axis views of an infarcted heart (Fig. 4c) compared to a healthy heart (Fig. 4d) was analyzed for determination of the infarct size. Infarct size was 28.6 ± 9.1 % of entire left ventricular myocardium (n = 6). Infarcted area was then correlated to the PPT determined by OA. The positive correlation (r = 0.83, p = 0.0583) shown in Fig. 4e suggests pulmonary transit time increases with infarction severity. Furthermore, ejection fractions (EF) were also analyzed from CINE MRI images for infarcted (n = 6, EF = 48.1 ± 8.2%) and healthy mice (n = 3, EF = 73.9 ± 4.0%). EF was similarly correlated to the PTT measurements by optoacoustics, see Fig. 4f. An inverse relationship (r = -0.94, p = 0.0004) was found between the pulmonary transit time and ejection fraction, validating impaired heart functions and its influence on increased pulmonary transit time.
Validation of the reduced heart function by cardiac magnetic resonance imaging. Cine sequences in a 4-chamber view of an infarcted heart in (a) systole and (b) diastole states. Late gadolinium enhancement in short axis views of an (c) infarct compared to a (d) healthy heart. The areas of myocardial infarctions are marked with yellow arrows. The pulmonary transit time values derived by the optoacoustic method are correlated to: (e) Infarct size, determined as percentage of infarcted myocardium compared to the entire myocardium (r = 0.83, p = 0.0583); (f) Ejection fraction, indicating decrease in heart function with increasing infarction severity (r = -0.94, p = 0.0004).
Discussion
Mouse models of myocardial infarction play an important role in investigations on the disease mechanisms and assessment of therapeutic responses. Hence, new methods enabling high-frame-rate three-dimensional (four-dimensional) visualization to characterize functional parameters of the infarcted heart can significantly advance cardiovascular research. The high temporal resolution of the introduced OA system enables high contrast deep tissue imaging of volumetric contrast agent perfusion, allowing for an accurate quantification of the PTT during initial passage of the concentrated ICG bolus through the heart, before it gets significantly diluted in the bloodstream. The PTT values then serve as an indicator of bi-ventricular dysfunction, and can be further used to estimate the pulmonary vascular resistance [24]. Significant changes in the PTT (50-100%) were observed based on a beat-by-beat analysis of the volumetric OA image sequences. Our method also enabled the real-time analysis of nonlinearities in the heartbeat, providing further indication of arrhythmic conditions and mechanical properties of the heart. Validation with MRI data further indicates that the PTT increases with size of infarction and increases with reduced ejection fraction, as expected. Furthermore, the inverse relationship between the infarct PTT and the post-surgery time (Fig. 2b) suggests that OA is able to track cardiac healing and post-infarct remodeling following myocardial infarction.
Parallel to technical developments, an infarct model suitable for OA imaging was also presented. 'Black six' mice are most commonly used for cardiovascular research with many disease models established [25]. However, the excess of melanin in the skin causes complications when imaged using OA methods. Supplementary Figure S3 compares photographs and OA images of different infarct models before and after arrival of the ICG bolus in the heart. While the albino model (on a 'Black Six' Background) expectedly rendered the best quality images, the regular 'black' model had significantly lower image quality, even as compared with the heavily scarred albino mice. Specifically, superficial pigmentation generated strong signals that partially overshadowed the imaged region of interest in the heart while also affecting the effective light penetration depth. It is worth noting that post-ICG increase in the OA signal levels could be observed in certain areas. This partial cardiac view still yielded a PTT measurement of 2.25 s, which agreed well with the results from albino mice (p < 0.0001). Nevertheless, using albino black six type ensured compatibility with well investigated cardiac biology, whilst enabling artifact-reduced OA imaging. The use of light-colored suture and clear glue for closing of the rib cage and skin was also established to minimize highly absorbing sources. Despite appearance of severe scaring and undesirable image artifacts in some cases (Fig. 1c), the overall data analysis and extraction of physiological parameters were not affected. Therefore, the infarct mouse model described in this work provides robust performance for cardiac OA imaging of cardiovascular disease models.
For the particular biological dynamics presented in this work, an imaging rate of 50 Hz was sufficient for beat-by-beat cardiac analysis for a typical heartrate of 7 Hz (420 bpm), although a frame rate of 100 Hz is achievable with the existing technology at the expense of increased data volumes and processing times. Optoacoustics is further capable of providing additional functional parameters when employing multispectral image acquisition. For instance, the blood oxygen saturation can be characterized from OA images taken at multiple optical wavelengths. Five-dimensional imaging (multispectral real-time three-dimensional) has been previously demonstrated using fast tuning lasers [17], yet motion-artifact-free visualization of fast moving heart at multiple excitation wavelengths would necessitate the use of multiple laser sources and sophisticated synchronization schemes [26].
To this end, various optical imaging approaches have been implemented in cardiovascular research. Intravital fluorescence microscopy enables to track single cells and molecules and investigate their role in cardiovascular disease [27]. Non-invasive whole-body fluorescence imaging has been shown to track biomarker activity, e.g. protease activity in living mice over time [28]. However, optical approaches are either lacking the adequate penetration (microscopy) or spatial and temporal resolution (whole-body fluorescence) for accessing cardiac functional parameters at the whole organ level.
MRI is well established to determine cardiac volume and function parameters, but its molecular contrast is limited as the synthesis of targeted contrast agents is difficult, and gadolinium-based agents are potentially toxic. Additionally, MRI is somehow susceptible to motion artifacts, which usually requires some kind of gating to the heart rate. The gating however can be impaired after myocardial infarction due to occurring arrhythmias, which make image acquisition cumbersome and the resulting data more difficult to compare. While the heart rate in general is not necessarily expected to change after myocardial infarction, occurrences of arrhythmia pose a challenge for MRI imaging due to continuous gating failure. Volumetric OA imaging has been demonstrated in this work to be a robust method for visualization of cardiovascular dynamics, working on a beat-by-beat analysis, which cannot be achieved by the temporal resolution of MRI. The applicability of this approach to detect small changes in cardiovascular hemodynamics e.g. in genetically modified mouse strains remains to be determined.
The results of this study indicate that OA imaging is able to capture cardiac dynamics at superior temporal resolution in 3D. In addition, cardiac imaging capabilities of optoacoustics are not limited to the anatomical and functional visualization of the heart. Novel theranostic approaches may include the targeted delivery of cardiac pharmaceutics labeled with light-absorbing agents [29-30] to the site of myocardial infarction, imaging modulation of the immune response to myocardial injury [31] as well as cell-based therapies. Contrast-enhanced theranostic approaches employing both optoacoustic and ultrasound agents have been recently demonstrated in the fields of stem cell tracking [32] and anti-coagulation therapy monitoring [33]. It has also been recently shown that labeled mesenchymal stem cells injected into the living heart can be resolved via optoacoustic imaging [34]. Tracking those cells in vivo may lead to a better understanding of the contribution of pluripotent cells to myocardial healing and offer a variety of novel theranostic approaches. Thus, high performance in vivo OA monitoring in three and four dimensions is expected to contribute to a better understanding of the therapeutic mechanisms, and, even more importantly, of therapy failure.
Conclusion
Our results indicate that volumetric OA imaging has the potential to outperform the conventional imaging methodologies used in cardiovascular research in terms of temporal resolution in 3D. The technique is affordable and simple to operate, further providing a unique ability for four-dimensional visualization of the beating murine heart. In combination with its proven ability to track targeted molecular probes within the injured myocardium [35], our methodology can depict cardiac anatomy, function and molecular signatures, with both high spatial and temporal resolution. It is thus expected to significantly promote cardiovascular imaging studies and provide new insights into the pathophysiological mechanisms of myocardial ischemia.
Abbreviations
OA: Optoacoustics; MRI: Magnetic Resonance Imaging; US: Ultrasound; ECG: Electrocardiography; ROI: Region of Interest; MIP: Maximum Intensity Projection; PTT: Pulmonary Transit Time; ICG: Indocyanine Green; RA: Right Atrium; LA: Left Atrium; RV: Right Ventricle; LV: Left Ventricle; RITA: Right Internal Thoracic Artery; LITA: Left Internal Thoracic Artery.
Supplementary Material
Supplementary figures.
Supplementary Movie 1.
Acknowledgements
Grant support from the Deutsche Forschungsgemeinschaft (DFG) through TUM International Graduate School of Science and Engineering (IGSSE), project 10.01 4D-MSOT, is acknowledged. The authors also acknowledge grant support from the Deutsche Forschungsgemeinschaft - DFG WI 3686/4-1 (M.W.) and RA1848/5-1 (D.R.) and the European Research Council Consolidator Grant ERC-2015-CoG-682379 (D.R).
Competing Interests
The authors have declared that no competing interest exists.
References
1. Liao R, Podesser BK, Lim CC. The continuing evolution of the Langendorff and ejecting murine heart: new advances in cardiac phenotyping. Am J Physiol Heart Circ Physiol. 2012;303(2):H156-67
2. World Health Organization. WHO Statistical Information System (WHOSIS): download the detailed data files of the WHO Mortality Database.
3. Hasenfuss G. Animal models of human cardiovascular disease, heart failure and hypertrophy. Cardiovasc Res. 1998;39(1):60-76
4. Patten RD, Aronovitz MJ, Deras-Mejia L, Pandian NG, Hanak GG, Smith JJ, Mendelsohn ME, Konstam MA. Ventricular remodeling in a mouse model of myocardial infarction. Am J Physiol Heart Circ Physiol. 1998;274(5):H1812-20
5. Paigen K. A miracle enough: the power of mice. Nat Med. 1995;1(3):215-20
6. Lin MC, Rockman HA, Chien KR. Heart and lung disease in engineered mice. Nat Med. 1995
7. Markl M, Kilner PJ, Ebbers T. Comprehensive 4D velocity mapping of the heart and great vessels by cardiovascular magnetic resonance. J Cardiovasc Magn Reson. 2011;13(1):1
8. Mor-Avi V, Lang RM, Badano LP, Belohlavek M, Cardim NM, Derumeaux G, Galderisi M, Marwick T, Nagueh SF, Sengupta PP, Sicari R. Current and evolving echocardiographic techniques for the quantitative evaluation of cardiac mechanics: ASE/EAE consensus statement on methodology and indications: endorsed by the Japanese Society of Echocardiography. J Am Soc Echocardiogr. 2011;24(3):277-313
9. Franco F, Thomas GD, Giroir B, Bryant D, Bullock MC, Chwialkowski MC, Victor RG, Peshock RM. Magnetic resonance imaging and invasive evaluation of development of heart failure in transgenic mice with myocardial expression of tumor necrosis factor-α. Circulation. 1999;99(3):448-54
10. Peshock RM, Willett DL, Sayad DE, Hundley WG, Chwialkowski MC, Clarke GD, Parkey RW. Quantitative MR imaging of the heart. Magn Reson Imaging Clin N Am. 1996;4(2):287
11. Provost J, Papadacci C, Arango JE, Imbault M, Fink M, Gennisson JL, Tanter M, Pernot M. 3D ultrafast ultrasound imaging in vivo. Phys Med Biol. 2014;59(19):L1
12. Tiran E, Deffieux T, Correia M, Maresca D, Osmanski BF, Sieu LA, Bergel A, Cohen I, Pernot M, Tanter M. Multiplane wave imaging increases signal-to-noise ratio in ultrafast ultrasound imaging. Phys Med Biol. 2015;60(21):8549-66
13. Lee S, Vinegoni C, Feruglio PF, Fexon L, Gorbatov R, Pivoravov M, Sbarbati A, Nahrendorf M, Weissleder R. Real-time in vivo imaging of the beating mouse heart at microscopic resolution. Nat Commun. 2012;3:1054
14. Jung K, Kim P, Leuschner F, Gorbatov R, Kim JK, Ueno T, Nahrendorf M, Yun SH. Endoscopic time-lapse imaging of immune cells in infarcted mouse hearts. Circ Res. 2013;112(6):891-9
15. Lee S, Vinegoni C, Sebas M, Weissleder R. Automated motion artifact removal for intravital microscopy, without a priori information. Sci Rep. 2014:4
16. Liao R, Podesser BK, Lim CC. The continuing evolution of the Langendorff and ejecting murine heart: new advances in cardiac phenotyping. Am J Physiol Heart Circ Physiol. 2012;303(2):H156-67
17. Deán-Ben XL, Razansky D. Adding fifth dimension to optoacoustic imaging: volumetric time-resolved spectrally enriched tomography. Light Sci Appl. 2014;3(1):e137
18. Deán-Ben XL, Razansky D. Portable spherical array probe for volumetric real-time optoacoustic imaging at centimeter-scale depths. Opt Express. 2013;21(23):28062-71
19. Deán-Ben XL, Ford SJ, Razansky D. High-frame rate four dimensional optoacoustic tomography enables visualization of cardiovascular dynamics and mouse heart perfusion. Sci Rep. 2015:5
20. Deán-Ben XL, Ozbek A, Razansky D. Volumetric real-time tracking of peripheral human vasculature with GPU-accelerated three-dimensional optoacoustic tomography. IEEE Trans Med Imaging. 2013;32(11):2050-5
21. Rosenthal A, Ntziachristos V, Razansky D. Optoacoustic methods for frequency calibration of ultrasonic sensors. IEEE Trans Ultrason Ferroelectr Freq Control. 2011;58(2):316-326
22. Wildgruber M, Bielicki I, Aichler M, Kosanke K, Feuchtinger A, Settles M, Onthank DC, Cesati RR, Robinson SP, Huber AM, Rummeny EJ. Assessment of myocardial infarction and postinfarction scar remodeling with an elastin-specific magnetic resonance agent. Circ Cardiovasc Imaging. 2014;7(2):321-9
23. Talwar K. K, Rao, G. S, Nayar, U, & Bhatia, M. L. Clinical significance of high frequency QRS potentials in myocardial infarction: analysis based on power spectrum of lead III. Cardiovasc Res. 1989;23(1):60-3
24. Choi BG, Sanai R, Yang B, Young HA, Mazhari R, Reiner JS, Lewis JF. Estimation of cardiac output and pulmonary vascular resistance by contrast echocardiography transit time measurement: a prospective pilot study. Cardiovascular ultrasound. 2014;12(1):1
25. Doevendans PA, Daemen MJ, de Muinck ED, Smits JF. Cardiovascular phenotyping in mice. J Cardiovasc Ultrasound. 1998;39(1):34-49
26. Deán-Ben XL, Bay E, Razansky D. Functional optoacoustic imaging of moving objects using microsecond-delay acquisition of multispectral three-dimensional tomographic data. Sci Rep. 2014:4
27. Christen T, Nahrendorf M, Wildgruber M, Swirski FK, Aikawa E, Waterman P, Shimizu K, Weissleder R, Libby P. Molecular imaging of innate immune cell function in transplant rejection. Circulation. 2009;119(14):1925-32
28. Spivak MY, Bubnov RV, Yemets IM, Lazarenko LM, Tymoshok NO, Ulberg ZR. Development and testing of gold nanoparticles for drug delivery and treatment of heart failure: a theranostic potential for PPP cardiology. EPMA J. 2013;4(1):1-23
29. Allijn IE, Czarny BM, Wang X, Chong SY, Weiler M, da Silva AE, Metselaar JM, Lam CS, Pastorin G, de Kleijn DP, Storm G. Liposome encapsulated berberine treatment attenuates cardiac dysfunction after myocardial infarction. J Control Release. 2017;247:127-133
30. Beziere N, Lozano N, Nunes A, Salichs J, Queiros D, Kostarelos K, Ntziachristos V. Dynamic imaging of PEGylated indocyanine green (ICG) liposomes within the tumor microenvironment using multi-spectral optoacoustic tomography (MSOT). Biomaterials. 2015;37:415-24
31. Ben-Mordechai T, Palevski D, Glucksam-Galnoy Y, Elron-Gross I, Margalit R, Leor J. Targeting macrophage subsets for infarct repair. J Cardiovasc Pharmacol Ther. 2015;20(1):36-51
32. Chen F, Ma M, Wang J, Wang F, Chern SX, Zhao ER, Jhunjhunwala A, Darmadi S, Chen H, Jokerst JV. Exosome-like silica nanoparticles: a novel ultrasound contrast agent for stem cell imaging. Nanoscale. 2017;9(1):402-11
33. Wang J, Chen F, Arconada-Alvarez SJ, Hartanto J, Yap LP, Park R, Wang F, Vorobyova I, Dagliyan G, Conti PS, Jokerst JV. A Nanoscale Tool for Photoacoustic-based Measurements of Clotting Time and Therapeutic Drug Monitoring of Heparin. Nano Lett. 2016;16(10):6265-71
34. Berninger MT, Mohajerani P, Wildgruber M, Beziere N, Kimm MA, Ma X, Haller B, Fleming MJ, Vogt S, Anton M, Imhoff AB, Ntziachristos V, Meier R, Henning TD. Detection of intramyocardially injected DiR-labeled mesenchymal stem cells by optical and optoacoustic tomography. Photoacoustics. 2017;6:37-47
35. Taruttis A, Wildgruber M, Kosanke K, Beziere N, Licha K, Haag R, Aichler M, Walch A, Rummeny E, Ntziachristos V. Multispectral optoacoustic tomography of myocardial infarction. Photoacoustics. 2013;1(1):3-8
Author contact
![]() Corresponding author: Daniel Razansky, Telephone: +49 89 3187 1587 Fax: +49 89 3187 3017 Email: drde
Corresponding author: Daniel Razansky, Telephone: +49 89 3187 1587 Fax: +49 89 3187 3017 Email: drde