Impact Factor
- Issue 14; 2026
- Issue 13; 2026
- Issue 12; 2026
- Issue 11; 2026
- Issue 10; 2026
- Volume 16; 2026
- Advance Articles
- Past Issues
- Cover Images
- Cover Suggestion
- Index & Coverage
- Special Issues
Introduction
Results
Discussion
Materials and Methods
Abbreviations
Supplementary Material
Acknowledgements
References
International Journal of Biological Sciences
International Journal of Medical Sciences
 Global reach, higher impact

Theranostics 2017; 7(17):4099-4117. doi:10.7150/thno.20730 This issue Cite
Research Paper
Vascularized Tissue-Engineered Model for Studying Drug Resistance in Neuroblastoma
A. Villasante1,2 ![]() , K. Sakaguchi3, J. Kim1, N.K. Cheung4, M. Nakayama2, H. Parsa1, T. Okano2, T. Shimizu2, G. Vunjak-Novakovic1,5
, K. Sakaguchi3, J. Kim1, N.K. Cheung4, M. Nakayama2, H. Parsa1, T. Okano2, T. Shimizu2, G. Vunjak-Novakovic1,5 ![]()
1. Laboratory for Stem Cells and Tissue Engineering, Department of Biomedical Engineering, Columbia University, New York, NY, USA;
2. Institute of Advanced Biomedical Engineering and Science, Tokyo Women's Medical University, TWIns, Tokyo, Japan;
3. Faculty of Science and Engineering, Waseda University, TWIns, Tokyo, Japan;
4. Department of Pediatrics, Memorial Sloan Kettering Cancer Center, New York, NY. USA;
5. Department of Medicine, Columbia University, New York, NY, USA.
Received 2017-4-25; Accepted 2017-8-11; Published 2017-9-21
Abstract

Neuroblastoma is a vascularized pediatric tumor derived from neural crest stem cells that displays vasculogenic mimicry and can express a number of stemness markers, such as SOX2 and NANOG. Tumor relapse is the major cause of succumbing to this disease, and properties attributed to cancer stem-like cells (CSLC), such as drug-resistance and cell plasticity, seem to be the key mechanisms. However, the lack of controllable models that recapitulate the features of human neuroblastoma limits our understanding of the process and impedes the development of new therapies. In response to these limitations, we engineered a perfusable, vascularized in vitro model of three-dimensional human neuroblastoma to study the effects of retinoid therapy on tumor vasculature and drug-resistance.
METHODS: The in vitro model of neuroblastoma was generated using cell-sheet engineering and cultured in a perfusion bioreactor. Firstly, we stacked three cell sheets containing SKNBE(2) neuroblastoma cells and HUVEC. Then, a vascular bed made of fibrin, collagen I and HUVEC cells was placed onto a collagen-gel base with 8 microchannels. After gelling, the stacked cell sheets were placed on the vascular bed and cultured in the perfusion bioreactor (perfusion rate: 0.5 mL/min) for 4 days. Neuroblastoma models were treated with 10μM isotretionin in single daily doses for 5 days.
RESULTS: The bioengineered model recapitulated vasculogenic mimicry (vessel-like structure formation and tumor-derived endothelial cells-TECs), and contained CSLC expressing SOX2 and NANOG. Treatment with Isotretinoin destabilized vascular networks but failed to target vasculogenic mimicry and augmented populations of CSLCs expressing high levels of SOX2. Our results suggest that CSLCs can transdifferentiate into drug resistant CD31+-TECs, and reveal the presence of an intermediate state STEC (stem tumor-derived endothelial cell) expressing both SOX2 and CD31.
CONCLUSION: Our results reveal some roles of SOX2 in drug resistance and tumor relapse, and suggest that SOX2 could be a therapeutic target in neuroblastoma.
Keywords: Neuroblastoma, Bioengineering, perfusion bioreactor, vasculogenic mimicry, SOX2, cell plasticity.
Introduction
Neuroblastoma (NB) is a highly heterogeneous vascularized tumor that originates from undifferentiated neural crest cells. It frequently arises in the adrenal medulla [1] and is the most common extracranial solid tumor diagnosed in the first years of life. 30-50% NB present as high risk, which is associated with MYCN amplification, advanced stages, older ages (>12-18 months) and unfavorable histology [2-4]. For high-risk patients, long-term survival is barely 50% despite surgery and induction chemotherapy consolidated by stem cell transplant and anti-GD2 antibody therapy [2, 3, 5]. Curing high-risk NB is still an unmet need, and there is an urgent need to develop new and more effective treatments.
Isotretinoin (INN) is an analogue of vitamin A, also known as 13-cis-retinoic acid, which has been used for treating minimal residual disease of high-risk neuroblastoma [6]. High doses of INN could induce cell differentiation, cell growth arrest, and inhibition of angiogenesis in vitro (at concentrations of 5-10 μM) [6-9]. However, in more recent analyses, there seems to be no impact on Progression-free survival (PFS) and overall survival (OS) in children with high-risk neuroblastoma [6, 8, 10, 11].
Similar to other undifferentiated tumors such as gliomas, neuroblastoma cells display plasticity within the tumor microenvironment that favors phenotypic changes, adaptive responses and tumor heterogeneity [12, 13]. Plasticity is frequently attributed to a small population of stem-like cells (also known as tumor-initiating cells or cancer stem cells) that retain some properties of stem cells and express stemness-related genes required for self-renewal and proliferation, such as CD133, NOTCH1, NANOG, OCT4 and SOX2 [14-18]. Several lines of evidence suggest that stem-like cell plasticity is the key mechanism of tumor drug resistance and relapse following initial effective therapy of neuroblastoma [12, 13]. However, little is known about the mechanism and the putative selective effect of consolidation therapy on neuroblastoma stem-like cells.
Recent studies implicate the role of angiogenesis in the regulation of neuroblastoma growth. Inhibition of angiogenesis has been postulated as a promising approach in the treatment of neuroblastoma, because of the high degree of vascularity of these tumors [9, 19]. Unfortunately, antiangiogenic drugs (such as vinblastine, topotecan, retinoids and thalidomide) that showed effects in preclinical models of neuroblastoma, did not improve patient survival in clinical trials [2]. This disparity might be due to the actual antiangiogenic strategies designed to target the “classical mechanisms” - sprouting and intussusceptive angiogenesis, that lead to the formation of new blood vessels from the preexisting vessels [19-21]. However, de novo formation of a vascular network has also been described in neuroblastoma. One such mechanism, known as vasculogenesis, involves differentiation of endothelial progenitor cells into endothelial cells [20, 21]. Another de novo mechanism, and probably the most intriguing one, is related to the plasticity of tumor cells, which acquire characteristics normally restricted to endothelial cells and make tube-like structures. This mechanism, known as vasculogenic mimicry, (VM) remains largely unclear [19, 20].
Two different types of vasculogenic mimicry have been reported in various types of tumors, and only one in neuroblastoma: (i) Vessel-like structure formation is a vasculogenic mimicry mechanism characterized by aligned tumor cells that are negative for CD31 and positive for periodic acid-Schiff (PAS) staining. This mechanism has been found in melanoma, glioblastoma and Ewing's sarcoma [19, 22]. (ii) Tumor-derived endothelial vessel formation is the second mechanism of vasculogenic mimicry by which cancer cells transdifferentiate into tumor-derived endothelial cells (TEC) and acquire endothelial properties, such as expression of CD31. In high risk NB positive for MYCN mutation, TECs carry both CD31 endothelial marker and MYCN amplification [23]. This VM mechanism is the only one currently described for neuroblastoma.
We studied the effect of INN on tumor vasculature and stem-like cells, using an engineered vascularized model of neuroblastoma. We previously reported the use of perfusion bioreactors for engineering dense living vascularized tissues by cell sheet technology [24-26]. Based on this technology, we now engineered pre-vascularized triple-layered sheets of neuroblastoma cells cultured over a vascular bed, perfused with culture medium. By 4 days in culture, the vascularized tissue-engineered model of neuroblastoma started to recapitulate the structural heterogeneity and vasculogenic mimicry. Our tumor model exhibited both VM types: vessel-like structures and tumor-derived endothelial cells. We also distinguished cancer stem-like cells expressing NANOG and SOX2. Importantly, NANOG and SOX2 levels were heterogeneous and we clearly distinguished subpopulations of CSLC expressing low and high levels of these stemness proteins.
INN treatment enhanced apoptosis, reduced the number of neuroblastoma cells expressing MYCN only, but failed in targeting tumor-derived endothelial cells (TECs) expressing both MYCN and CD31, weakened CD31+ vessels and diminished the total levels of NANOG in the CSLC population. Intriguingly, we observed that INN triggered a shift from SOX2-low to SOX2-high state and induced enrichment of the subpopulation of CSLCs expressing high levels of SOX2. We found intermediate NB cell type expressing both SOX2 (stemness marker) and CD31 (endothelial marker) at the same time, that we named “STEC” (Stem Tumor-derived Endothelial Cell). Our results suggest that CSLC, STEC and TEC are all chemoresistant. We propose that the tissue-engineered model of neuroblastoma could thus serve as a pre-clinical platform for screening of consolidative therapies. Our results also point at SOX2 as a potential therapeutic target in neuroblastoma, based on its role in developing resistance to isotretinoin treatment.
Results
Engineering of a perfusable vascularized model of neuroblastoma
Our strategy to build a tissue-engineered model of neuroblastoma (TE-NB) involved two steps. Firstly, we generated pre-vascularized cell sheets by co-culturing the NB cell line SK-N-BE(2) (MYCN+ cell line) and human umbilical vein endothelial cells (HUVECs, CD31+ cells) on temperature-responsive poly(N-isopropylacrylamide) (PIPAAm)-grafted culture plates (Figure 1a). We combined our expertise in making tumor cells sheets [27] and pre-vascularized cell-sheets [26] to define the conditions for engineering pre-vascularized sheets of neuroblastoma cells. Macroscopic analysis showed that the cell sheets were composed of cell colonies growing over a thick layer of cells that filled the whole temperature-responsive plate (Figure 1a). By adapting the tumor cell sheet technology we previously developed [27], three pre-vascularized neuroblastoma cell sheets were stacked together, and a layer of fibrin was inserted between each of the two layers by using a gelatin-coated plunger manipulator, as previously reported [25].
Tissue engineered model of neuroblastoma. (a) Generation of pre-vascularized sheets of neuroblastoma cells using temperature-responsive poly(N-isopropylacrylamide)(PIPAAm)-grafted culture plates. Bright field image shows a co-culture of SKNBE(2) and HUVEC cells growing on top of temperature-responsive plates at day 3 (Scale bar: 100 µm). (b) Formation of cell aggregates and cell-aligned structures in neuroblastoma cell sheets at day 3, by Scanning Electron Microscopy (SEM) (Scale bar: 25 µm). (c) Evaluation of cell-sheet pre-vascularization, cellular composition and cell proliferation by AZAN, CD31, NMYC and Ki67 staining of 3-layered SKNBE(2)/HUVEC cell sheets at day 3 (Scale bar: 100 µm). (d) Scheme of assembly of the tissue-engineered model of Neuroblastoma(NB). A pre-vascularized 3-layered NB/HUVEC cell sheet is stacked with fibrin and then, it is placed on top of the vascular bed. The vascular bed is made of fibrin, collagen I and HUVEC cells and generated on top of a collagen-gel base. (e) Culture device. The tissue-engineered tumor model is generated in situ atop a collagen-gel base with 8 microchannels in the culture device. (f) The tissue-engineered tumor model is cultured in the bioreactor culture chamber under perfusion (0.5 mL/min) established by a syringe pump, with monitoring of oxygen and pH in culture medium. (g) Computer simulation of the concentration profiles inside the tumor model, using glucose as a marker molecule. The concentrations levels are color-coded. (i) Cross-section view. (ii) The top surface.
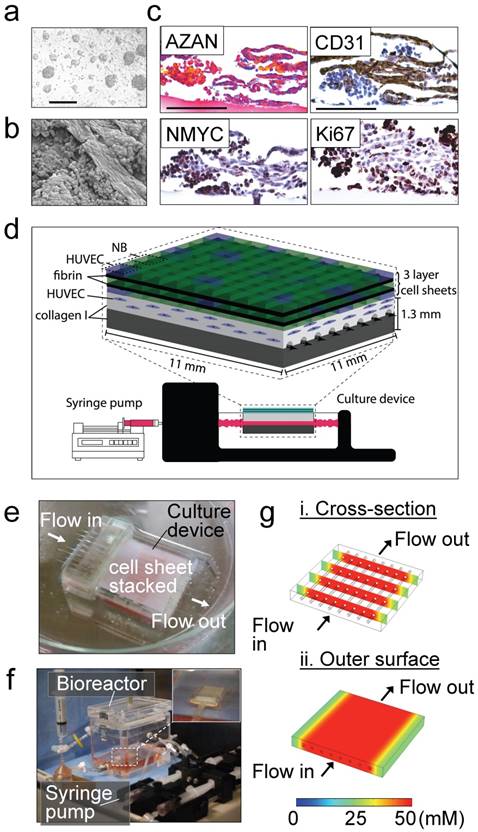
Endothelial cells forming vasculature express collagen [28] and are positive for CD31 that is expressed on all continuous endothelial cells linings in vivo that support cell-cell adhesion in endothelial cells [29]. In order to characterize formation of vessels in the pre-vascularized cell sheets, we performed scanning electron microscopy (SEM) analysis (Figure 1b), AZAN staining of collagen, and CD31 staining of vascular cells (Figure 1c). We observed cell aggregates between aligned cells forming tubular-like structures and aligned cells that stained blue by AZAN and expressed CD31; however, lumen formation was not observed. Cell aggregates expressed MYCN and Ki67, while aligned cellular structures were positive for CD31 and negative for Ki67 (Figure 1c). Interestingly, a small population of aligned cells were also positive for the MYCN amplification (Figure 1c). We did not observe cell death (by EthD-1 staining, Supplementary Figure S1a).
Then, a pre-vascular bed was generated by encapsulating HUVECs in fibrin gel placed over the collagen gel containing 8 microchannels (Figure 1d, e), by following our previously validated protocol for vascularization of engineered heart tissues [24]. A stack of 3 pre-vascularized sheets of neuroblastoma cells was generated, connected to the bioreactor and cultured under perfusion conditions at 0.5 mL/min for 4 days (Figure 1f).
By using computer simulation, we investigated whether the nutrients in culture medium, which is perfused through the microchannels, could be delivered to the cells sheet placed on the collagen-based cell culture device by diffusion. Because lumen networks were not observed in our pre-vascularized cell sheets, we did not include lumen structures in this simulation model. For this simulation, we used COMSOL 4.3b software and modelled glucose transport (initial concentration: 50 mM) as the molecule transported to the cells through the collagen layer (thickness: 500 μm). Because the culture medium is continuously perfused at 0.5 mL/min, we assumed that the glucose is well-mixed in the culture medium and the glucose concentration within the channel and its inner surfaces is 50 mM [30]. Thus, time-dependent molecule transport through the collagen gel can be estimated by:
∂C/∂t = D∇2C
where C is the glucose concentration, t is time, and D is glucose diffusion coefficient in the collagen gel, respectively. Diffusion coefficient D = 10-6 cm2/s was used for glucose molecules in the 0.5% collagen gel [31]. Simulation showed that within ~20 min, glucose molecules can be effectively diffused from the microchannels into the collagen gel as shown in the cross-section view of the cell culture device (Figure 1g-i). In addition, the diffused molecules can be distributed uniformly on the outer surface of the collagen gel above the channels, indicating that the nutrients can be rapidly and efficiently supplied to the cell sheet in this device (Figure 1g-ii) Our experimental results showed that the cell sheets cultured on collagen gel could grow and proliferate evenly on the gel surface, which was consistent with our simulation results indicating efficient supply of nutrients throughout the collagen gel.
Mimicking tumor vasculature under perfusion conditions
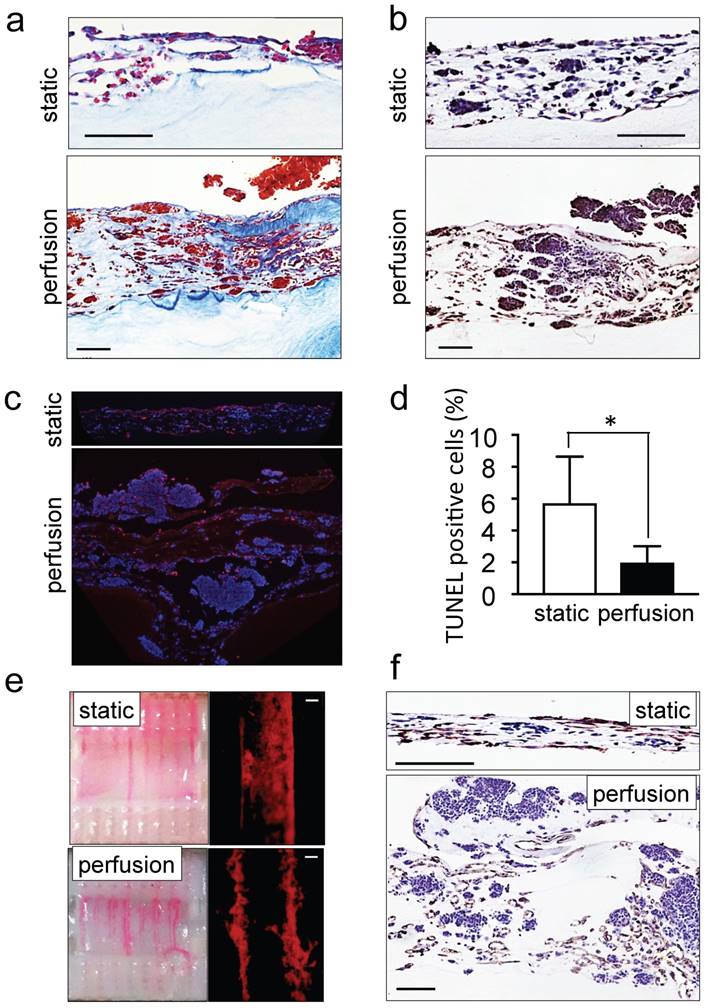
The ability of perfusion bioreactors to improve tissue viability and to control shear stress enhancing endothelial cell differentiation of dense grafts has been extensively reported in the last decade [32-34]. We also recently demonstrated the use of perfusion bioreactors to vascularize tissue-engineered heart patches [24]. However, as a proof of concept and for validating the model, we compared the tumor models cultured under static and perfusion conditions. As expected, tissues perfused for 4 days were thicker, more cellularized (Figure 2a) and more positive for ki67 staining as compared to statically cultured controls (Figure 2b). Tumor aggregates (100-300 μm in diameter) were observed on the top layer of the perfused tumor models (Supplementary Figure S1b). In addition, TUNEL assays demonstrated a marked reduction of the percentage of apoptotic cells in the tumor models cultured with perfusion (Figure 2c, d). Perfusion also enhanced vessel network formation (Figure 2e) and the appearance of CD31-positive lumens (Figure 2f). These observations confirmed the suitability of the perfused tumor model (but not the static model) for further studies of neuroblastoma biology and drug responses.
Recapitulation of neuroblastoma vasculature in a perfusable tumor model. (a) AZAN staining and (b) ki67 staining of the tumor models under static or perfusion conditions, at day 4. Counterstaining with hematoxylin QS (blue) (Scale bar: 100 µm). (c) Fluorescence images showing apoptotic cells by TUNEL assay (red) under indicated conditions; nuclei are stained with Hoechst 33342 (blue). (d) Percentages of apoptotic cells under static and perfusion conditions, determined by the TUNEL assay, and counted using the ImageJ software. Statistical significance was determined by the two-tailed Student's t test. ∗p < 0.05 (perfusion, n=6; static, n=3). (e) Demonstration of the formation of perfusable blood vessels by the presence of FluoSpheres Polystyrene Microspheres (in magenta) suspended in culture medium, in both the static and perfused tumor models, at day 4. Left: macroscopic analysis of the tumor model (top view). Right: microscopic analysis of perfusable channels (~300 µm in diameter) under static conditions and the formation of vessels (~50 µm in diameter) in the microchannels. Representative images are shown (n=3 per condition; scale bar: 100 µm). (f) Immunohistochemical staining for CD31 for the indicated conditions; Counterstaining with hematoxylin QS (blue), (scale bar: 100 µm).
Recapitulating vasculogenic mimicry of neuroblastoma tumors
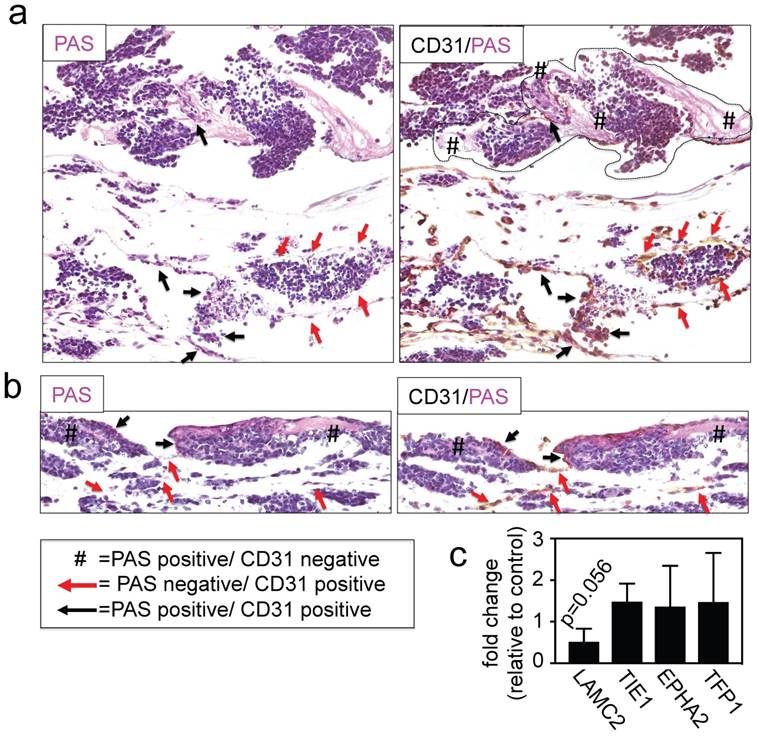
We then asked whether the perfused model of neuroblastoma could mimic vasculogenic mimicry (VM). First, we determined the presence of vessel-like structures. Vessel-like structure formation was initially described in melanoma and was strictly defined by the appearance of cancer cells expressing positive proteins for periodic acid-Schiff (PAS) staining and negative for the endothelial marker CD31[22, 35]. Double staining for CD31 and PAS confirmed the formation of vessel-like structures in the TE-NB. Notably, we also demonstrated for the first time the presence of PAS+/CD31- cells in tumor samples from patients (Figure 3a).
Analyses of vasculogenic mimicry in the perfusable tumor model. (a) Representative images of double-staining for CD31/PAS in samples of neuroblastoma tumors from patients (n=4) and bioengineered model of neuroblastoma (TE-NB) (n=5). (b) Confocal images showing co-expression of MYCN (green) and CD31 (red) in the patients' tumors (n=4) and tumor models (n=5). Nuclei are stained with DAPI (blue).
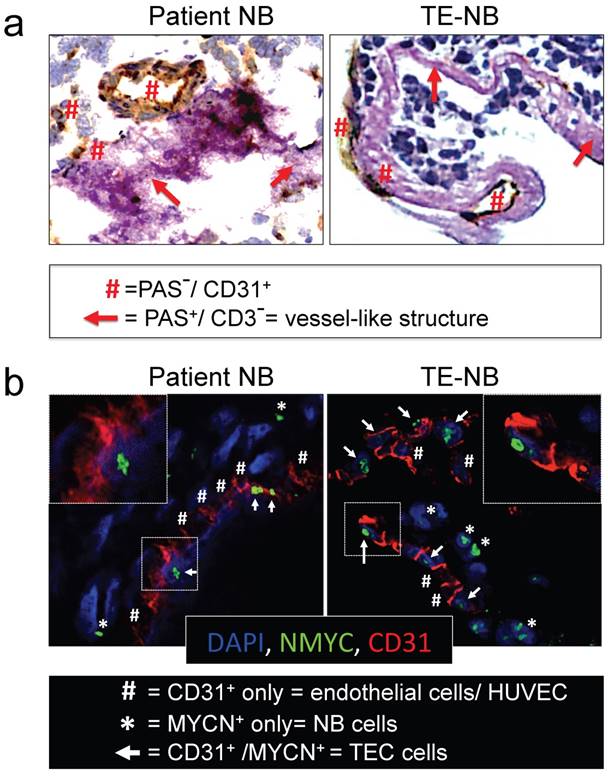
Then, we investigated tumor-derived endothelial vessel formation in TE-NB and in native tumors. MYCN is a NB specific mutation that can be used as an intrinsic and unequivocally NB cell tracker [36], while CD31 can be used as a specific marker for endothelial cells[37].The TE-NB was generated using the SK-N-BE(2) cell line carrying MYCN, and we also selected native tumor samples carrying the MYCN mutation. Staining for MYCN+/CD31+ was used for detecting tumor-derived endothelial cells (TECs) [23], that were observed in both groups (Figure 3b).
In order to further demonstrate that NB cells can transdifferentiate and express endothelial markers, we co-stained TE-NB with MYCN and CD34 (another endothelial marker) (Supplementary Figure S2). We also performed double staining for CD31 and GLI1, a protein expressed by NB cells [38] (Supplementary Figure S3). We observed the cells expressing MYCN+/CD34+ and GLI1+/CD31+. Importantly, aligned HUVEC cells (CD31+ only cells in Figure 3b or CD34+ only cells in Supplementary Figure S2) were detected between TEC cells participating in vascular structures formation. Therefore, vascular vessels can originate from both HUVEC and NB cells transdifferentiated into TECs. Taken together, these results demonstrate that the engineered model of neuroblastoma has the capacity to recapitulate both types of vasculogenic mimicry. In addition, we describe for the first time the presence of vessel-like structures in native NB tumors.
Isotretinoin treatment targets neuroblastoma cells and destabilizes vascular networks
INN is capable of blocking cell proliferation, inducing cell differentiation in monolayer cell cultures and reducing tumor vasculature in vivo [9]. The TE-NB models treated with 10 μM of INN (daily, for 5 days) were thinner and less cellular than untreated controls, with a significant increase in the number of apoptotic cells (Figure 4a, b). Then, we analyzed the MYCN+ compartment and found a decrease in mRNA levels of NB specific markers MYCN (Figure 4c) and GLI1 (Supplementary Figure S3) after INN treatment. We also determined that INN eliminated ~20% of the total NB population compared to the control (Figure 4d and Supplementary Figure S4).
Effect of isotretinoin (INN) on apoptosis and cell proliferation in the tumor model. (a) Fluorescence images showing apoptotic cells by TUNEL assay (red) in untreated controls and treated tumor models (TE-NB) after 5 days; nuclei are stained with Hoechst 33342 (blue). (b) Percentage of apoptotic cells under indicated conditions (ctrl=control; INN=isotretinoin), by TUNEL assay and counted using the ImageJ software. Statistical significance was determined by the two-tailed Student's t test. (untreated controls, n=3; drug treated samples, n=3). (c) mRNA levels measured by qRT-PCR of MYCN from TE-NB samples treated with INN. mRNA levels were normalized to those observed in untreated samples (n=3 per group). (d) Quantification of the effect of INN on the numbers of neuroblastoma MYCN+ only cells. Double-staining for CD31+/MYCN+ and immunofluorescence was performed as in Figure 3b. Total number of cells and NB cells expressing only MYCN were counted in 4-8 different fields per sample with the total of >1000 cells/sample that were counted for each condition. Data are shown as average ± SD (n=3). (e) Macroscopic analysis of the effects of isotretinoin on tumor vasculature using FluoSpheres Polystyrene Microspheres (in magenta) (untreated control, n=3; drug treatment, n=3), at day 5. (f) Representative images of CD31 staining of tumor models with and without drug treatment, at day 5. Counterstaining with hematoxylin QS (blue) (Scale bar: 100 µm). (g) Protein levels of CD31 in untreated control tumors and drug treated tumors by Western blot analysis. (h) Quantification of the effect of INN on HUVEC (CD31+ only cells) number. Staining and counting of CD31+ cells were performed as in d, and the percentage of cells expressing CD31+ only is shown. (i) Heatmaps of CD31 expression levels (CD31MAPs) in controls and INN treated samples. CD31MAPs were generated by applying ImageJ's Thermal LUT to stacked confocal immunofluorescence images stained for CD31. (j) Fluorescence intensity of CD31 quantified from CD31MAPs by ImageJ in the indicated groups. Total number of cells and NB cells expressing only MYCN+ were counted in 4-8 different fields per sample, with the total >1000 cells/sample counted for each condition. Data are shown as Average ± SD (n=3).
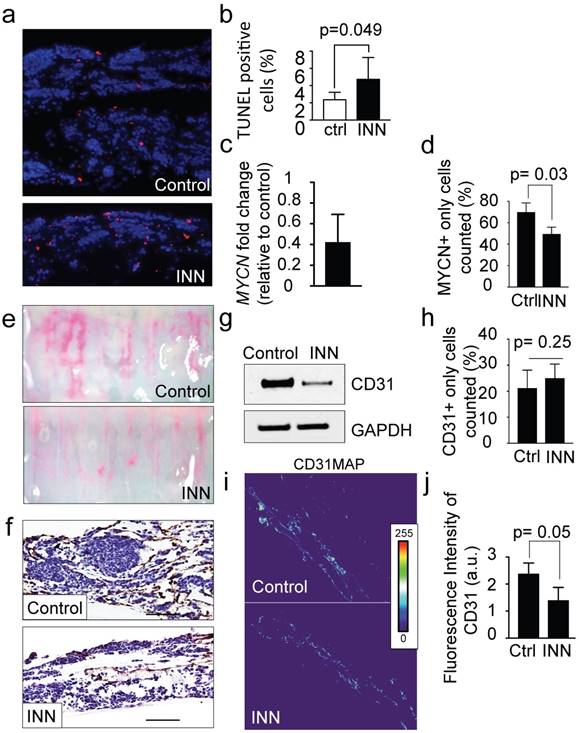
Then, we assessed the antiangiogenic effect of isotretinoin on the vascular network generated within the tumor model. Macroscopic analyses by using FluoSpheres (Figure 4e) and by staining vasculature with the CD31 marker (Figure 4f) revealed that INN treatment weakened and disassembled the vascular networks. In addition, we observed lower total CD31 levels after treatment by western blot (Figure 4g). This phenomenon may be due to a decrease in CD31+ cell number or alternatively a general reduction in CD31 protein expression.
To address both possibilities, we quantified the numbers of HUVECs (expressing only the CD31 marker- before and after INN treatment and did not observe significant changes between the groups (Figure 4h). Then, we generated heat maps of CD31 fluorescence intensity confirming that CD31 levels were reduced after drug treatment (Figure 4i and 4j).
Together, we confirmed that INN treatment does not affect cell proliferation and death of HUVEC cells, but reduces total CD31 expression and NB cell population. Because CD31 plays an important role in cell-cell adhesion by homotypic interactions [37], the decrease of total CD31 levels without altering HUVEC cell number could explain the observed effect of INN on disassembling vascular networks.
Isotretinoin treatment fails to target vasculogenic mimicry
We then asked whether TEC and/or vessel-like structure forming cells are resistant to INN and the possible effects of INN on these cell populations.
First, we focused on the CD31+ compartment to specifically evaluate HUVEC and TEC population distributions before and after drug treatment. To this end, we performed CD31+/NMYC+ double staining (Figure 5a) and quantified CD31+ only cells (HUVEC) and CD31+/MYCN+ cells (TEC) (Figure 5b). Interestingly, the CD31+ compartment was formed from ~70% HUVECs and ~30% TECs in the control samples; after the INN treatment, we observed an enrichment in TECs (~46%) in this compartment (Figure 5b). Because we found that the number of HUVECs does not change between control and treated samples, TEC enrichment may be due to either an increase in NB cells transdifferentiation or an increase in TEC proliferation.
Effect of isotretinoin (INN) on tumor-derived endothelial cells. (a) Immunofluorescence images of tissue-engineered tumor models untreated or treated with isotretinoin for 5 days. Representative images of tumor-derived endothelial cells (TECs) double-stained for MYCN (green) and CD31 (red) (n=3); nuclei are stained with DAPI (blue). (b) Analysis of the CD31+ compartment in the TE-NB model before after the treatment. CD31+/MYCN+ staining was performed as in (a) for controls and INN treated samples. Total number of CD31+ cells was counted in 4-8 different fields per sample, with >1000 cells/sample counted for each condition. The percentages of HUVEC cells (CD31+) and TECs (CD31+/MYCN+) are shown. Data are shown as Average ± SD (n=3). (c) Analysis of the MYCN+ compartment in the TE-NB model before and after the treatment. These studies were performed as in (b), and the percentages of NB cells (MYCN+) and TECs (CD31+/MYCN+) in this compartment are shown. (c) Representative Immunohistochemical stainings for Ki67+ (red arrows indicate positive cells) and (d) immufluorescence images for CD31+ (red) and MYCN+ (green) showing proliferating cells forming vessels before and after INN treatment.
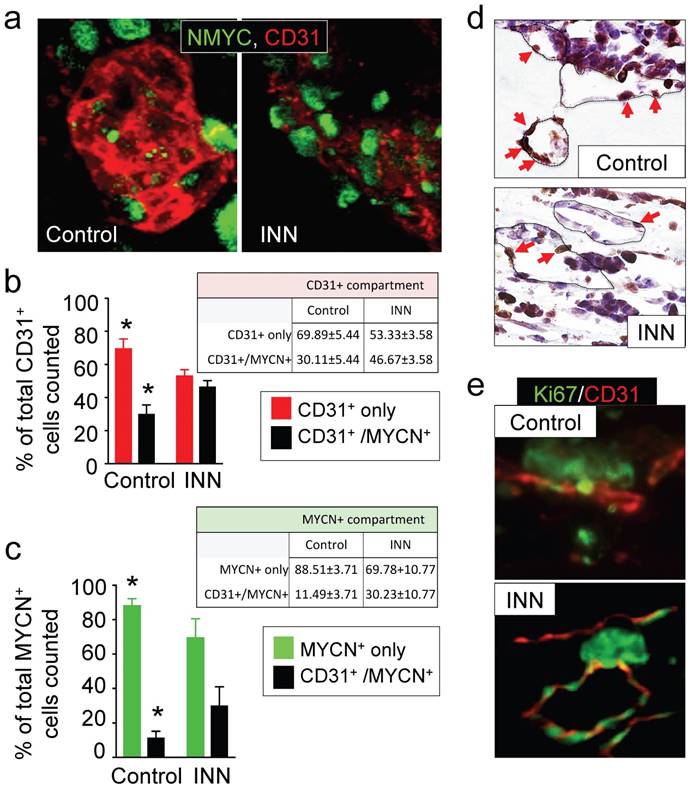
Then, we analyzed cell populations in the MYCN+ compartment, which is comprised by NB cells (MYCN+ only cells) and TECs (CD31+/MYCN+) (Figure 5c). We observed that ~11% of NB cells transdifferentiated into TECs in the control samples. After treatment, we observed enrichment in TECs but a decrease in the percentage of NB cells (MYCN+ only) (Figure 5c). Interestingly, we distinguished that the proliferating cells (ki67+) aligned and formed the lumens of vascular vessels (Figure 5d and 5e). These results suggest that TEC enrichment is due, at least in part, to cell proliferation.
Finally, we investigated the effects of INN on vessel-like structures by double-staining for PAS/CD31 and by measuring the expression levels of adhesion molecules and other well-known markers for this type of VM, such as LAMC2, TIE1, EPHA2 and TFP1 [22, 39]. We detected the presence of PAS+/CD31- cells (Figure 6a and 6b), without changes in levels of expression of VM markers between drug-treated tumor models and untreated controls (Figure 6c), indicating that the vessel-like structures were unaffected by drug treatment.
Effect of isotretinoin (INN) on vessel-like structures. (a) Representative image of a vessel-like structure observed in TE-NB controls and (b) INN treated samples by double staining for CD31/PAS. (c) mRNA levels of vessel-like structure related genes in drug treated tumor models (n=3) compared to untreated control tumor models (n=3), by qRT-PCR. Relative endogenous expression of vessel-like structure related genes was normalized to GAPDH and error bars represent standard deviations of relative expression. Statistical significance was determined by the two- tailed Student's t test and no differences between groups were observed.
Together these data confirm the efficiency of INN in eliminating neuroblastoma cells from the tumor bulk and in destabilizing vascular networks by reducing CD31 levels. Importantly, these findings confirm that TECs are resistant to INN and capable of proliferating, and that INN does not have an effect on vessel-like structures.
SOX2+ cells are INN-resistant; INN treatment augmented the SOX2-high cell subpopulation
We then focused on the possible effects of INN on the population of cancer stem-like cells (CSLC). In particular, we asked if INN could promote stem-like cell drug resistance as previously suggested.
SOX2 and NANOG are master regulators of embryonic stem cell fate and have pivotal roles in the maintenance of the stem-like phenotype in cancer cells. High levels of both genes are associated with drug resistance and relapse for a number of tumors. Different studies have also demonstrated that NANOG levels can fluctuate in both the embryonic and iPS cells. These fluctuations give rise to heterogeneous populations of cells in such a way that low-NANOG state defines a subpopulation prone to differentiate and high-NANOG state correlates with a subpopulation of pluripotent cells with high self-renewal capability [40, 41]. However, NANOG fluctuations in cancer cells and SOX2 fluctuations in embryonic, iPS or cancer cells have not been reported. SOX2 and NANOG emerge as particularly relevant genes in the context of isotretinoin effects on stem-like cells in engineered tumor models.
We firstly confirmed that both genes are expressed in neuroblastoma tumors and found that high levels of SOX2 or NANOG correlated to poor survival of neuroblastoma patients (Supplementary Figure S5). Then, in order to confirmed that the TE-NB displays CSLCs, we double-stained control samples with anti-SOX2 and anti-NANOG (Supplementary Figure S6). As expected, we observed a perfect co-localization of SOX2 and NANOG by immunofluorescence in the control (Supplementary Figure S6). We then asked whether CSLC are also present after INN treatment. To our surprise, we observed high CSLC heterogeneity. We detected CSLC expressing both SOX2 and NANOG proteins, but we also found NANOG+ only cells and SOX2+ only cells (Supplementary Figure S7).
Then, we checked mRNA levels of both genes in the engineered tumor models by qRT-PCR analysis. Unexpectedly, we observed a 2-fold increase of SOX2 mRNA in INN treated samples as compared to controls (Figure 7a), and no differences in transcriptional NANOG levels between the drug-treated and untreated samples (data not shown). We also found an increase in total SOX2 protein levels in treated samples (Figure 7b). Thus, our data suggests that SOX2 positive cells are resistant to the treatment, as described for example in glioblastoma [42].
SOX2 levels and distributions. (a) qRT-PCR indicates 2-fold increase in SOX2 expression in tumor models treated with isotretinoin, as compared to untreated control tumor models. Relative endogenous expression of SOX2 was normalized to GAPDH; error bars represent standard deviation of relative expression. Statistical significance was determined by the two-tailed Student's t test; *p < 0.05. (b) Western blot analysis for SOX2 protein in tumor models in the presence or absence of isotretinoin (10 μM) for 5 days. (c) Analysis of the SOX2+ compartment in the TE-NB model before and after INN treatment. Total number of cells was counted in 4 different fields per sample, with >2000 cells/sample counted for each condition. Data are shown as average ± SD (n=3). (d) Heatmaps of SOX2 expression levels (SOX2MAPs) generated by applying ImageJ's Thermal LUT to stacked confocal immunofluorescence images stained for SOX2. Four categories were established according to SOX2 fluorescence levels, that were colored as indicated and expressed in arbitrary units (a.u). (e) SOX2MAPs quantifications by ImageJ represent the percentage of SOX2 levels for each category (low, L; medium-low, M-L; medium-high, M-L; high, H) in tumor models treated with isotretinoin and untreated controls, after 5 days. Error bars represent standard deviation (n=3 for each group). Statistical significance was determined by the two- tailed Student's t test. (f) Distribution of SOX2+ cells in controls and INN samples across the four SOX2 subpopulations: low, L; medium-low, M-L; medium-high, M-L; high, H. The percentages of L, M-L, M-H and H SOX2 levels in each group relative to the total of SOX2-positive cells are shown. Data are shown as average ± SD (n=3).
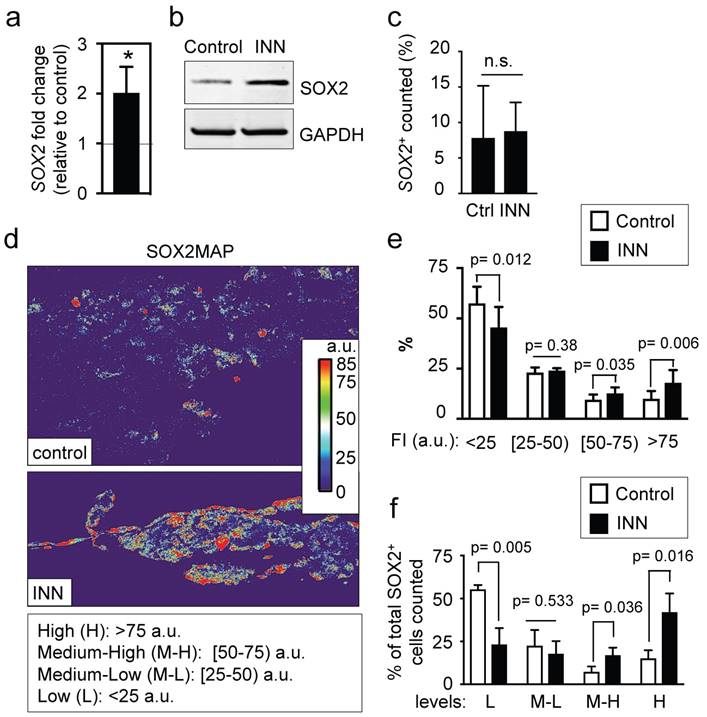
The higher levels of SOX2 in INN samples could be due to four non-exclusive effects: (a) the increase in SOX2 levels could result from lower total numbers of NB cells (enrichment effect); (b) INN could promote proliferation of SOX2+ cells; alternatively NB cancer stem-like cells could express heterogeneous levels of SOX2, as previously observed for NANOG in ES/iPS cells[40, 41], (c) INN could select for SOX2-high cell subpopulations, and/or (d) SOX2-low cells may shift to SOX2-high levels after the treatment.
To test these possible scenarios, we first determined the numbers of SOX2+ cells relative to the total numbers of cells before and after treatment, and did not observe differences between the groups (Figure 7c). This data suggests that the first two hypotheses can be eliminated. To investigate if neuroblastoma contains subpopulations of cells with different levels of SOX2 expression, we generated and analyzed heatmaps for SOX2 protein expression by using immunofluorescence, confocal imaging and Fiji analysis (Figure 7d). The SOX2 map of the control confirmed heterogeneity in SOX2 levels within neuroblastoma cells, with clearly distinguished subpopulations of cells with low and high levels of SOX2 expression. For statistical analysis and data mining, we established four groups based on fluorescence intensity of SOX2 (arbitrary units; a.u.): low (L), medium-low (M-L), medium-high (M-H) and high (H) levels of SOX2, and quantified the distributions between controls and treated samples. Relative to untreated controls, there was a significant reduction in the L group in drug-treated tumor models; the percentage of the M-L group remained constant between control and treated samples, and surprisingly, there were increases in the M-H and H groups after drug treatment (Figure 7e).
Finally, we further investigated whether INN is selecting for SOX2-high cell subpopulations, or if SOX2-low cells are shifting to SOX2-high cells after the treatment. To this end, we determined total number of cells in each group relative to the total of SOX2+ cells counted in both control and INN treated samples (Figure 7f). We found a decrease in the number of SOX2-low cells and an increase in SOX2-high cells. These data reveal that TE-NB displays subpopulations with SOX2+ drug resistance, and suggest that INN induces a shift from SOX2-low to SOX2-high levels.
Now, we investigated if cell subpopulations with high and low NANOG can also be distinguished in neuroblastoma tumors. Thus, we generated and analyzed NANOG maps (Supplementary Figure S8) to confirm the presence of both L and H NANOG subpopulations. Interestingly, the L subpopulation increased while M-L, M-H and H subpopulations decreased after drug treatment. Because transcriptional differences between treated samples and controls were not observed, these observations could suggest that INN may induce a shift from NANOG-high to NANOG-low levels.
We observed that INN induces changes in NANOG and SOX2 protein levels that trigger heterogeneity in the cancer stem like cell niche (Supplementary Figure S6 and Figure S7). Now, we assessed whether SOX2-low cells could be NANOG-high by generating SOX2/ NANOG maps from SOX2/NANOG double stained samples (Supplementary Fig S9). However, we did not find any cell expressing high levels of NANOG and low levels of SOX2 after INN treatment. Instead, we found cells expressing low or null levels of SOX2 and medium-low and low levels of NANOG.
SOX2-high neuroblastoma cells can also express CD31 and form blood vessels
INN treatment resulted in the enrichment of TECs (MYCN/CD31 positive cells) and a cancer stem-like cell/SOX2-high population. We thus asked if these two effects are related and if SOX2-high cells could be involved in the maintenance of tumor endothelial-like vessels. We double-stained INN treated tumor models with SOX2 and CD31 (Supplementary Figure S10a). By confocal microscopy, we detected cells expressing only SOX2 (Supplementary Figure S10a-i), but also cells expressing both markers (Supplementary Figure S10a-ii).
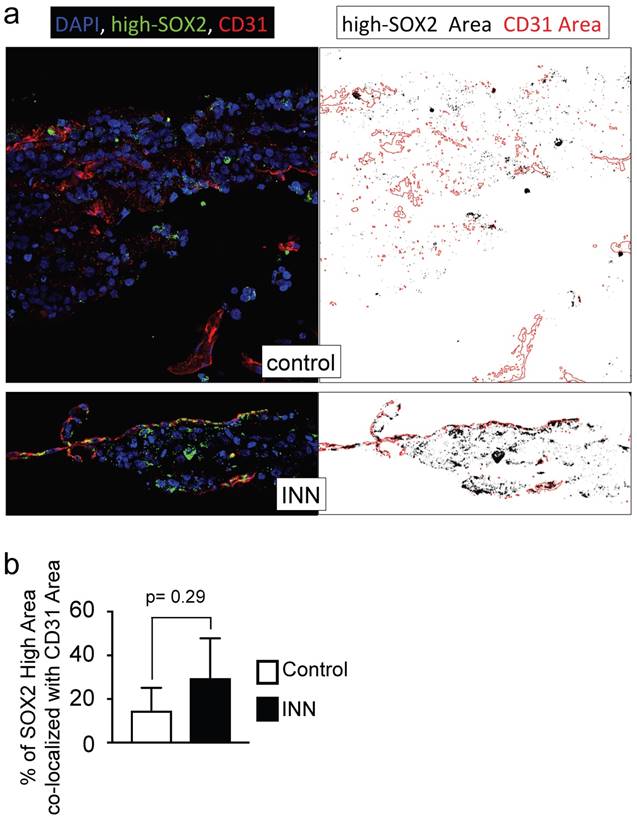
Further studies using three markers (MYCN, SOX2, CD31) confirmed the high heterogeneity of engineered tumors (Supplementary Figure S10b). We identified five different cell types forming a vessel and remaining after drug treatment: HUVEC (positive for CD31; SOX2-, MYCN-), cancer stem-like cell (MYCN+/SOX2+), TEC (MYCN+/CD31+) and cancer stem-like/tumor-derived endothelial cells (STEC; MYCN+/SOX2+/CD31+). The presence of the STEC intermediate state further confirms that TECs can be generated by CSLC transdifferentiation. It also suggests that the TEC enrichment after INN treatment (Figure 5), may be due not only to cell proliferation but also to CSLC transdifferentiation. Studies of the STEC niche by co-localization analysis of SOX2-high/CD31 in drug treated and untreated samples (Figure 8a, b) showed that the extent of co-localization was similar among the groups, suggesting that STECs could be resistant to isotretinoin.
Co-localization of SOX2-high and CD31 expressing cells. (a) Co-localization maps of cells expressing SOX2-high and CD31 generated from stacked confocal immunofluorescence images stained for SOX2/CD31 (left) and analyzed by ImageJ (right: CD31 expression is shown in red; SOX2-high expression is shown in black). (b) Overlay areas of SOX2-black and CD31-red were measured by imageJ and expressed as percentage of co-localization of SOX2-high and CD31 in both groups (isotretinoin treated and untreated controls). Error bars represent standard deviation (n=3). Statistical significance was determined by the two- tailed Student's t test.
Discussion
In the field of cancer biology, the theory of Darwinian selection explains that a small sub-population of drug-resistant cells, with tumor initiating capacities and self-renewal potential, can contribute to tumor relapse in diverse cancer types [43]. Such model provides a rationale for developing differentiation therapies to specifically target those cancer stem-like cells, and the use of retinoic acids (such as INN) for the treatment of neuroblastoma. Although INN has shown effectiveness in vitro, its clinical benefit in patients with neuroblastoma bas been questioned (see Matthay correction or retraction 2014 [10, 11]), and what causes relapse is still poorly understood.
Preclinical neuroblastoma models available at this time lack the ability to emulate native tumors. This is due, at least in part, to the use of cell monolayers and animal models, which are unable to faithfully replicate the complex landscape of human cancer. In general, these traditional experimental models do not have predictive power for translation into clinical applications. We propose the experimental models of human neuroblastoma, established by engineering minimally functional tumor units necessary for emulating the specific properties of human neuroblastoma and analyzing the effects of drugs on tumor vasculature and cancer stem-like cells.
With this novel technology in hand, we were able to recapitulate in vitro the vasculogenic mimicry (vessel-like structure formation and tumor-derived endothelial vessel formation). We also describe, for the first time, the presence of vessel-like structures in surgical specimens of neuroblastoma from patients. When the engineered tumors were treated with INN, we observed a reduction in tumor size and destabilization of CD31+ vascular networks. However the treatment did not target TECs and vessel-like structures. In fact, our data suggest that TEC could even proliferate in the presence of INN (Figure 9a).
NB cell populations and effect of INN on the bioengineered tumors (TE-NB) (a) Effect of INN on both CD31+ and MYC+ compartments and on vasculogenic mimicry in the TE-NB model. INN targets NB cells (MYCN+); TECs (MYCN+/CD31+) are drug-resistant and can proliferate; there was no effect on the number of HUVECs in the vessels. INN can also induce destabilization of CD31+ vessels by downregulation of CD31 without altering vessel-like structures (PAS+/CD31-). (b) Effect of INN on SOX2+ cells. SOX2-high subpopulation enrichment after INN treatment shows the shift from low to high SOX2 levels. (c) Hypothetical mechanism for tumor relapse after chemotherapy based on data obtained from the TE-NB model treated with INN.
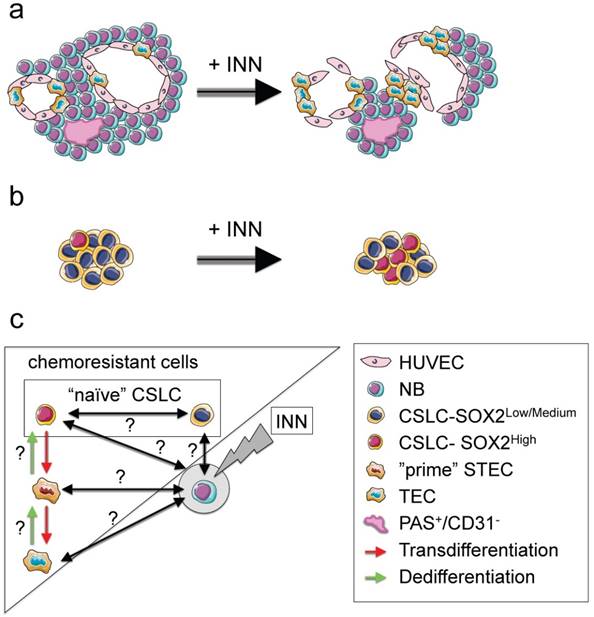
Our model also recapitulates the presence of cancer stem-like cells expressing NANOG and SOX2 that are required for self-renewal, and are thought to be the origin of transdifferentiated cells. We observed that the treatment induced CSLC heterogeneity in terms of SOX2 and NANOG expression. Also, we could clearly distinguish the coexistence of two populations of CSLC cells, with low and high levels of NANOG+/SOX2+. Independently of the expression levels, we demonstrated that SOX2+ and NANOG+ cells are INN resistant. Importantly, INN induced the shift from SOX2-low to SOX2-high state (Figure 9b). We hypothesized that neuroblastoma CSLCs exhibit the fluctuation mechanism described for human pluripotent stem cells (hPSCs) using stemness proteins by which a CSLC could switch between High and Low states in the framework of metastability and interconvertibility between conditions (Figure 9c).
Consistent with the cancer stem-like cell theory, we suggest that SOX2-high cells would be more aggressive than SOX2-low cells. We demonstrated that INN has an effect on reducing the number of NB cells from the tumor bulk. We can now hypothesize that SOX2-low state could be a necessary step before INN-induced apoptosis/NB differentiation (Figure 9c).
Monolayer studies that analyzed the ability of retinoic acid (RA) to arrest cell growth and neuroblastoma differentiation into neural lineage, showed that p27 levels were dependent on the levels of MYCN protein expression and that RA inhibited MYCN [44]. It is also known that SOX2 is downregulated by RA in monolayers of embryonic cells [45], neuroblastoma stem cells [46] and neuroblastoma cell lines [47]; Also, p27 forms a complex to regulate SOX2 at transcriptional level (in cell monolayers and mouse models)[45]. These findings suggest a possible mechanism by which INN and RA would be able to differentiate SOX2-low neuroblastoma cells more easily than SOX2-high cells. However, it seems that downregulation of MYCN by isotretinoin to enhance p27/SOX2 repressive complex formation is not sufficient for targeting SOX2-high cells, and more research is necessary to discern the mechanism. A separate question is if isotretinoin is inducing differentiation into neural lineages or alternatively, transdifferentiation into TECs. Our experimental data support the second option, but further analysis would be necessary to conclusively answer this important question.
In addition, our data confirm that SOX2 positive cells exhibit plasticity and can transdifferentiate into tumor-derived endothelial cells. Importantly, we defined STEC state as an intermediate NB cell type expressing both SOX2 (stemness marker) and CD31 (endothelial marker). Following the comparison with hPSCs biology, we hypothesize that CSLC-SOX2high cells (similar to a “naïve state” in hPSCs [48]) could raise STECs (metastable “prime state” in hPSCs [48]); STEC state in this case would be a critical state between the commitment (TEC generation) and the return to the “naïve state” (Figure 9c).
Important questions are if both (CSLC-SOX2high cells and STEC) states are interconvertible, as observed for hPSCs [48], and if STEC and TEC states are interconvertible. It would be important to investigate whether or not “naïve” CSLCs (SOX2high and SOX2low) “prime” STECs and/or TECs to be able to regenerate the tumor bulk (MYCN only cells) during tumor relapse after chemotherapy (Figure 9c). In that case, we propose these three cell types as therapeutic targets to be explored.
In summary, our study is the first to demonstrate the undesirable effect of INN in neuroblastoma. We show the existence of resistant sub-populations of neuroblastoma cells with different levels of stemness that could be related to the capacity to transdifferentiate into endothelial-like cells. Formation of a new and alternative vascular network, for which there is no effective therapy, could explain in part the lack of clinical benefit observed with INN in the treatment of high-risk neuroblastoma. Tissue-engineered tumor models could thus bridge the gap between current in vitro cultures and animal models towards a better understanding of neuroblastoma tumor biology and development of new therapeutic modalities.
Materials and Methods
Cell culture
Cell expansion
Neuroblastoma cell lines SK-N-BE(2) were purchased from the European Collection of Authenticated Cell Cultures (ECACC; Cat.No. 95011815) and cultured in RPMI-1640 Medium (Sigma, R8758) supplemented with 10% (v/v) FBS and 1% penicillin/streptomycin (RPMI expansion medium). Cells were cultured at 37°C and 5% CO2 in a humidified incubator. Human Umbilical Vein Endothelial Cells (HUVEC) were purchased from Lonza and cultured according to the manufacturer's specifications. HUVEC cells were cultured in HUVEC expansion medium EBM-2 Basal Medium (Lonza CC-3156) supplemented with EGM-2 BulletKit (Lonza CC-3156 & CC-4176) at 37°C in a humidified incubator at 5% CO2.
Cell-sheet fabrication and stacking
0.25x10⁶ SKNBE(2) and 0.25x10⁶ HUVEC cells were seeded in temperature-responsive 24-well plates (Upcell) and co-cultured for 72 h in cell sheet medium consisting of 50% RPMI expansion medium, and 50% HUVEC expansion medium supplemented with 20% FBS. SKNBE(2) only cell-sheet as control was not generated because SKNBE(2) cells in absence of HUVEC do not form cell sheets. Three cell sheets were stacked by using the stamping method and a gelatin-coated, plunger manipulator as we previously reported [49]. Fibrin has a well-known role as biologic tissue adhesive and in improving vascularization [50]. A novel protocol for cell-sheet stacking was developed; fibrin glue was prepared with 50 mg/mL of fibrinogen in PBS (Sigma) and 100 U/mL of thrombin in PBS (Sigma) and it was inserted between cell sheets.
Tissue engineered model of neuroblastoma
A collagen-gel base with 8 microchannels was prepared as previously reported in Sakaguchi et al. 2013 [24] as support for the vascular bed. The overall dimension of the collagen-gel base was 1.3 mm x 11 mm x 11 mm, and the diameter of the microchannels was 300 μm. The distance between the microchannel inner surface and the outer top surface of the gel was 500 μm. A vascular bed made of fibrin, collagen I and HUVEC cells was placed on the collagen-gel base containing the 8 microchannels. Briefly, 5x10⁶ HUVEC cells were embedded in a mix of neutralized collagen I solution (KOKEN, Tokyo, Japan; IAC-05) and fibrin made of fibrinogen 12.5 mg/mL (Sigma), Thrombin 2.5 U/mL (Sigma) and aprotinin 7500 KIU/mL (Wako Chemical, cat. no. 010-11834). The vascular bed was incubated for 30 min at 37°C. After gelling, the steel wires were extracted from the mold, as previously explained [24], yielding 300 µm diameter channels in the collagen-gel base/vascular bed support as shown in Figure 1 and described in detail in Sakaguchi et.al (2013) [24], Three SKNBE(2)/HUVEC cell sheets were stacked using fibrin. Then, the triple layered cell-sheet (~100 μm) was placed on the vascular bed and cultured in the perfusion bioreactor as previously described [24] and using 50% RPMI expansion medium and 50% HUVEC expansion medium at 37°C, 5% CO2, pH 7.4 for 4 days. The perfusion rate of the culture medium was 0.5 mL/min. To confirm formation of blood vessels, FluoSpheres Polystyrene Microspheres (1.0 µm in diameter; ThermoFisher Scientific, F13082) were suspended in PBS (concentration 1x10⁶ particles/mL).
Isotretinoin (INN) treatment: neuroblastoma models were treated with 10 μM of INN that was applied as a single daily dose for 5 days. Drug concentrations of 5-10 μM correspond to the pharmacological dosages used in clinical trials of neuroblastoma patients [6, 7, 9], and are known to be effective against neuroblastoma cell growth and angiogenesis in vitro[8, 9,].
Tumor samples from patients
Fully de-identified MYCN-positive neuroblastoma tumors were obtained from the Columbia University Tissue Bank, under a protocol approved by the Institutional Review Board. Frozen tissue samples from four different patients were cut into sets of contiguous sections for immunofluorescence and immunohistochemistry analyses and PAS staining.
Computer simulation of molecular diffusion
For the computer simulation of molecular diffusion from the perfusion microchannels to the cell sheet placed on the cell culture device, the commercial finite element software COMSOL Multiphysics 4.3b software was employed. Glucose (concentration: 50 mM), which is the one of the most important factors for cell survival, was simulated as a model molecule that diffuses through the 0.5 wt% collagen gel. Based on the glucose diffusion coefficients reported in the literature, which were experimentally obtained, 10-6 cm2/s was used as the glucose diffusivity within 0.5 wt% collagen gel for this simulation [31]. In this model, constant concentration boundary condition was applied to the inner surfaces of the microchannels because the well-mixed culture medium is continuously perfused through the channels at a flow rate of 0.5 mL/min. Since this simulation study was intended to investigate the nutrient transport within the cell culture device, we only modeled the glucose diffusion through the collagen gel without including the cell sheet placed on the device. Accordingly, no flux boundary condition was used at the outer surfaces of the collagen-gel chip, while glucose metabolization would need to be taken into account if the cell sheet was included in the simulation. With these assumptions, the time-dependent diffusion equation ∂C/∂t = D∇2C was solved in COMSOL, where C is the glucose concentration, t is time, and D is the glucose diffusion coefficient in the collagen gel, respectively. Once the numerical calculation was completed, multiple cross-section surfaces were created across the collagen gel to inspect the distribution of glucose molecules in the device.
Histology and immunohistochemistry (IHC)
Tissue-engineered neuroblastoma tumors were fixed in 4% PFA for 48 h and were manually dehydrated (30 min washes of 70% and absolute ethanol), automatically dehydrated and pre-embedded in paraffin using a tissue processor (Tissue-TEK VIP processor, Sakura). 1 h washes of absolute ethanol (7 washes) and xylene (3 washes) and 1 h cycles of paraffin (4 cycles) were applied. Then tissues were embedded in paraffin and serial sections (10 μm thick) were prepared for histology, immunohistochemistry and immunofluorescence. Hematoxylin and eosin (H/E) and Azan stained sections were prepared and examined under an optical microscope.
Immunohistochemistry
Sections were deparaffinized and gradually hydrated in xylene and graded ethanol/distilled water solutions before performing antigen retrieval in 1X target retrieval solution (Dako, S1699) in a pressure chamber (SP1 Program, 125°C, 20 s; Pascal S2800, Dako). Samples were cooled to room temperature, treated with peroxidase-blocking solution (Dako, #S2023) for 1 h in a humid chamber and washed 3 times (5 min each) with PBST. Then, samples were blocked for 1 h in 5% normal horse serum (Vectastain Elite ABC HRP Kit R.T.U.; Vector laboratories, PK-7200) and incubated with specific primary antibodies for MYCN (dilution 1:100; Abcam, ab198912), CD31 (dilution 1:50, Abcam, ab28364), Ki67 (dilution 1:100, Abcam, ab15580), overnight at 4°C. After washing with PBST (5 min, 3 times), samples were incubated with secondary antibodies (Vectastain Elite ABC HRP Kit R.T.U.; Vector laboratories, PK-7200), following manufacturer instructions, and developed using Impact DAB (Vector Laboratories, SK4105). Negative controls were prepared by omitting the primary antibody step.
Frozen sections of Neuroblastoma tumors were fixed in pre-cooled acetone (-20°C) for 10 min, washed with PBS, treated immediately with peroxidase-blocking solution and incubated with primary and secondary antibodies as explained above.
PAS staining
Neuroblastoma tumor sections and deparaffinized and hydrated engineered tumor sections were incubated in 0.5% Periodic acid solution (Wako #164-19705) for 5 min, rinsed in distilled water and incubated in Schiff's reagent (Wako #193-08445) for 15 min. The samples were then washed with lukewarm tap water, counterstained with hematoxylin, and slide-mounted. For double CD31/PAS staining, the CD31 staining was done before the PAS staining.
Immunofluorescence (IF)
Antigen retrieval treated sections of TE-neuroblastoma constructs and native neuroblastoma fixed sections were blocked for 1 h in 5% normal horse serum and incubated with primary antibodies for MYCN (MYCN-rabbit: dilution 1:100; Abcam, ab198912), CD31 (CD31-mouse dilution 1:50, DAKO, #M0823), CD34 (CD34-mouse dilution 1:50, DAKO, #M7165), GLI1 (GLI1-rabbit dilution 1:50, Cell Signaling, #2553), NANOG (NANOG-rabbit: 1:200, Cell Signaling, #D73G4) and SOX2 (SOX2-rabbit: 1:200, Cell Signaling, #D6D9; SOX2-goat: 1:100, Novus Biologicals, AF2018) diluted in antibody diluent (Dako, S3022) in a humid chamber overnight at 4°C. A day later, the sections were washed (3 times, 5 min each) with PBST and incubated with the appropriate secondary antibodies (ThermoFisher; Goat anti-rabbit-Alexa Fluor 488 # A-11008; Goat anti-mouse-Alexa Fluor 568 #A-11004; Goat anti-mouse-Alexa Fluor 647 #A-21235, Donkey anti-Goat- Alexa Fluor 594 # A-11058) diluted 1:500 in antibody diluent at room temperature, in a humid dark chamber for 1 h. Secondary antibodies made in mouse and rabbit were co-incubated at the same time. In the case of three-color staining (SOX2-goat, MYCN-rabbit and CD31-mouse), sections were first incubated with donkey anti-goat- Alexa Fluor 594 and after washes were co-incubated with goat anti-rabbit-Alexa Fluor 488 and goat anti-mouse-Alexa Fluor 647. Samples were slide-mounted in ProLong Gold Antifade with DAPI (ThermoFisher # P36931) and imaged by confocal microscopy (40x oil immersion objective) using the same settings for comparison and posterior analysis (Olympus FV1200, software FV10-ASW at TWIns; Nikon Ti Eclipse inverted microscope and NIS-Elements Software at Columbia University).
Co-localization analyses
Analyses of confocal images were performed using a 40x objective and ImageJ software (n=3-4 per experimental group, n=3-9 images per sample). Using ImageJ software, 8-bit color images (CD31: red channel; MYCN or SOX2: green channel) were automatically thresholded. For analysis of high SOX2 levels, the threshold was adjusted between 75-85. Then, an overlay image containing only co-localized areas was generated using the ROI Manager option “AND”. The total area of MYCN or SOX2 and the overlay areas (MYCN-CD31 or SOX2-CD31) were automatically measure using ImageJ software, as well. Co-localized areas were plotted as percentage of MYCN (or SOX2) areas that co-localized with the CD31 areas. NANOG and SOX2 fluorescence intensity maps (NANOG map and SOX2 map):
Confocal Images (n=3-4 per experimental group and 3-9 images per sample) were analyzed using ImageJ software. ImageJ Thermal LUT was applied to 16-bit images to create heatmaps that were quantitatively analyzed using the histogram generation option of ImageJ. Four categories (corresponding to cell subpopulations) were established according to NANOG or SOX2 fluorescence levels (low; medium-low; medium high; high) in arbitrary units and plotted for each experimental group as the percentage of each subpopulation relative to the total population.
TUNEL Assay
Apoptotic cells were detected by an in situ cell death detection kit, with nuclei stained with Hoechst 33342 (Click-iT TUNEL Alexa Fluor 594 Imaging Assay, ThermoFisher) according to the manufacturer's instructions. The number of apoptotic cells in each group was calculated as the percentage of TUNEL positive cells in total cell population, per image (n=3-4; 500-2,000 cells per image). The number of TUNEL positive (apoptotic) cells was counted using the ImageJ software plugin “TUNEL Cell Counter” (http://imagej.net/RETINA_Analysis_Toolkit). Total cell population per image was obtained using the ITCN (“Image-based Tool for Counting Nuclei”) plugin for ImageJ (https://imagej.nih.gov/ij/plugins/itcn.html).
Scanning electron microscope (SEM)
SEM samples were prepared by fixing in 4% paraformaldehyde solution for 1 h. After rinsing twice with PBS, samples were subsequently dehydrated in increasingly concentrated aqueous solutions of ethanol (70%, 85%, 95%, 100%) for 5 min each, and finally hexamethyldisilazane (HMDS) for 15 min. After air-drying overnight in a chemical hood, the samples were sputter-coated with gold and palladium and imaged using SEM KEYENCE VE-9800).
Western blots
Tissues were homogenized in T-PER Tissue Protein Extraction Reagent (Thermo Fisher #78510) containing protease and phosphatase inhibitors (Thermo Fisher #78441). After centrifugation at 12,000 g for 15 min, 10 μg of protein (for CD31 analysis) or 30 μg of protein (for SOX2 and NANOG analysis) were loaded on 4-12% gradient Bis-Tris Bolt Plus gel (Thermo Fisher) and transferred to a nitrocellulose membrane (Nitrocellulose Regular Stacks; Novex #IB23001) using an iBlot 2 Gel Transfer Device. Membranes were blocked for 1 h at room temperature in 5% nonfat dry milk in PBS. Then, they were incubated with antibodies against CD31 (1:250; Abcam, ab28364), SOX2 (1:500; Cell Signaling, D6D9) and NANOG (1:500; Cell Signaling, D73G4) diluted in 1X PBS, 0.1% Tween-20 with 5% BSA at 4°C overnight and GAPDH (1:5000; Invitrogen 437000) at room temperature for 1 h. For detection, membranes were incubated with a secondary antibody anti-rabbit or anti-mouse conjugated with Alexa Fluor 680 dye (1:5000; ThermoFisher Scientific) at room temperature for 1 h and imaged on Licor Odyssey scanner.
Quantitative real-time PCR (qRT-PCR)
Total RNA was obtained using Trizol (Life Technologies) following the manufacturer's instructions. RNA preparations (2 μg) were treated with “Ready-to-go you-prime first-strand beads” (GE Healthcare) to generate cDNA. qRT-PCR was carried out using DNA Master SYBR Green I mix (Applied Biosystems). mRNA expression levels were quantified applying the ΔCt method, ΔCt = (Ct of gene of interest - Ct of GAPDH). qRT-PCR primer sequences were obtained from the PrimerBank data base (http://pga.mgh.harvard.edu/primerbank/) (See Table 1):
PrimerBank ID of qRT-PCR primers used in this study
| Gene Description | PrimerBank ID |
|---|---|
| MYCN | 62750358c1 |
| Homo sapiens GLI family zinc finger 1 (GLI1) | 263190679b1 |
| Homo sapiens Nanog homeobox (NANOG) | 153945815c1 |
| Homo sapiens SRY (sex determining region Y)-box 2 (SOX2) | 325651854c1 |
| Homo sapiens tyrosine kinase with immunoglobulin-like and EGF-like domains 1 (TIE1) | 358356427c1 |
| Homo sapiens EPH receptor A2 (EPHA2) | 296010835c1 |
| Homo sapiens tissue factor pathway inhibitor (lipoprotein-associated coagulation inhibitor) (TFPI) | 98991770c1 |
| Homo sapiens laminin, gamma 2 (LAMC2) | 157419139c1 |
Kaplan-Meier Survival Curves
Kaplan Meier analyses by gene expression in Neuroblastoma tumors were performed using the R2 Genomics Analysis and Visualization Platform (http://r2.amc.nl.) and the following dataset: Tumor Neuroblastoma public - Versteeg - 88 - MAS5.0 - u133p2. Chiptype: u133p2. Source: GEO ID: GSE16476. Pubmed link: 22367537. R2 internal identifier: ps_avgpres_nbadam88_u133p2
We selected the KaplanScan function for a single gene (NANOG or SOX2) to sort a cohort of 88 samples in 2 groups based on low or high gene expression. Then, we selected the recurrence or progression subset to analyze the overall survival probability of 35 patients. We chose the Scan cutoff_modus that yields a cutoff where the difference in survival is most significant.
Abbreviations
CSLC: cancer stem-like cells; TEC: tumor-derived endothelial cell; STEC: stem tumor-derived endothelial cell; NB: neuroblastoma; INN: isotretinoin; VM: vasculogenic mimicry; PAS: periodic acid-Schiff; TE-NB: tissue-engineered model of neuroblastoma; RA: retinoic acid; hPSC: human pluripotent stem cell.
Supplementary Material
Supplementary figures S1-S10.
Acknowledgements
The authors gratefully acknowledge the support of this work by the JSPS Postdoctoral Fellowship for Overseas Researchers (AV), JSPS Kakenhi (grant 25282145 to MN) and the National Institutes of Health (grants EB002520 and EB17103 to GVN). We thank Vanessa Blanca for her suggestions and expertise with histological techniques, Dr. Jun Akimoto and Dr. Hironobu Takahashi for their valuable inputs to cell-sheet preparation and cell-sheet stacking, Dr. Zhong Lan Tang for assistance with SEM, Tissue-Bank Facility at Columbia University for providing Neuroblastoma tumors and Specialized Microscopy Shared Resource of the Herbert Irving Comprehensive Cancer Center at Columbia University (supported by NIH grant #P30 CA013696) for assistance in collecting confocal images.
Author contributions
AV conceived the project, performed the experiments, analyzed and interpreted the results, and wrote the manuscript. KS designed and fabricated the bioreactor, set up culture conditions for making the human vascular bed and improved the stacking method using fibrin. JK developed and analyzed computer simulations. NKC, MN, HP and TO reviewed the manuscript. TS and GVN supervised the study, contributed to data analysis, and edited the manuscript.
Competing Interests
TO is a founder and a member of the board of CellSeed Inc., which has licenses for certain cell sheet-related technologies and patents from Tokyo Women's Medical University. TS is a member of the scientific advisory board of CellSeed Inc. TO and TS are stakeholders in CellSeed Inc. Tokyo Women's Medical University receives research funds from CellSeed Inc.
References
1. Cheung NK, Dyer MA. Neuroblastoma: developmental biology, cancer genomics and immunotherapy. Nat Rev Cancer. 2013;13:397-411
2. Modak S, Cheung NK. Neuroblastoma: Therapeutic strategies for a clinical enigma. Cancer Treat Rev. 2010;36:307-17
3. Murphy JM, Lim II, Farber BA, Heaton TE, Basu EM, Roberts SS. et al. Salvage rates after progression of high-risk neuroblastoma with a soft tissue mass. J Pediatr Surg. 2016;51:285-8
4. Cohn SL, Pearson AD, London WB, Monclair T, Ambros PF, Brodeur GM. et al. The International Neuroblastoma Risk Group (INRG) classification system: an INRG Task Force report. J Clin Oncol. 2009;27:289-97
5. Kushner BH, Ostrovnaya I, Cheung IY, Kuk D, Modak S, Kramer K. et al. Lack of survival advantage with autologous stem-cell transplantation in high-risk neuroblastoma consolidated by anti-GD2 immunotherapy and isotretinoin. Oncotarget. 2016;7:4155-66
6. Masetti R, Biagi C, Zama D, Vendemini F, Martoni A, Morello W. et al. Retinoids in pediatric onco-hematology: the model of acute promyelocytic leukemia and neuroblastoma. Adv Ther. 2012;29:747-62
7. Veal GJ, Errington J, Rowbotham SE, Illingworth NA, Malik G, Cole M. et al. Adaptive dosing approaches to the individualization of 13-cis-retinoic acid (isotretinoin) treatment for children with high-risk neuroblastoma. Clin Cancer Res. 2013;19:469-79
8. Sonawane P, Cho HE, Tagde A, Verlekar D, Yu AL, Reynolds CP. et al. Metabolic characteristics of 13-cis-retinoic acid (isotretinoin) and anti-tumour activity of the 13-cis-retinoic acid metabolite 4-oxo-13-cis-retinoic acid in neuroblastoma. Br J Pharmacol. 2014;171:5330-44
9. Ribatti D, Ponzoni M. Antiangiogenic strategies in neuroblastoma. Cancer Treat Rev. 2005;31:27-34
10. Matthay KK, Reynolds CP, Seeger RC, Shimada H, Adkins ES, Haas-Kogan D. et al. Long-term results for children with high-risk neuroblastoma treated on a randomized trial of myeloablative therapy followed by 13-cis-retinoic acid: a children's oncology group study. J Clin Oncol. 2009;27:1007-13
11. Matthay KK, Maris JM, Schleiermacher G, Nakagawara A, Mackall CL, Diller L. et al. Neuroblastoma. Nat Rev Dis Primers. 2016;2:16078
12. Meacham CE, Morrison SJ. Tumour heterogeneity and cancer cell plasticity. Nature. 2013;501:328-37
13. Chakrabarti L, Abou-Antoun T, Vukmanovic S, Sandler AD. Reversible adaptive plasticity: a mechanism for neuroblastoma cell heterogeneity and chemo-resistance. Front Oncol. 2012;2:82
14. Kamijo T. Role of stemness-related molecules in neuroblastoma. Pediatr Res. 2012;71:511-5
15. Ross RA, Walton JD, Han D, Guo HF, Cheung NK. A distinct gene expression signature characterizes human neuroblastoma cancer stem cells. Stem Cell Res. 2015;15:419-26
16. Pandian V, Ramraj S, Khan FH, Azim T, Aravindan N. Metastatic neuroblastoma cancer stem cells exhibit flexible plasticity and adaptive stemness signaling. Stem Cell Res Ther. 2015;6:2
17. Kaneko Y, Suenaga Y, Islam SM, Matsumoto D, Nakamura Y, Ohira M. et al. Functional interplay between MYCN, NCYM, and OCT4 promotes aggressiveness of human neuroblastomas. Cancer Sci. 2015;106:840-7
18. Gomez-Mateo Mdel C, Piqueras M, Pahlman S, Noguera R, Navarro S. Prognostic value of SOX2 expression in neuroblastoma. Genes Chromosomes Cancer. 2011;50:374-7
19. Pinto MP, Sotomayor P, Carrasco-Avino G, Corvalan AH, Owen GI. Escaping Antiangiogenic Therapy: Strategies Employed by Cancer Cells. Int J Mol Sci. 2016:17
20. Rössler J. Progressive Neuroblastoma: Innovation and Novel Therapeutic Strategies. Pediatr Adolesc Med. Basel, Karger. 2015;20:89-106
21. Krishna Priya S, Nagare RP, Sneha VS, Sidhanth C, Bindhya S, Manasa P. et al. Tumour angiogenesis-Origin of blood vessels. Int J Cancer. 2016;139:729-35
22. Qiao L, Liang N, Zhang J, Xie J, Liu F, Xu D. et al. Advanced research on vasculogenic mimicry in cancer. J Cell Mol Med. 2015;19:315-26
23. Pezzolo A, Parodi F, Corrias MV, Cinti R, Gambini C, Pistoia V. Tumor origin of endothelial cells in human neuroblastoma. J Clin Oncol. 2007;25:376-83
24. Sakaguchi K, Shimizu T, Horaguchi S, Sekine H, Yamato M, Umezu M. et al. In vitro engineering of vascularized tissue surrogates. Sci Rep. 2013;3:1316
25. Haraguchi Y, Shimizu T, Sasagawa T, Sekine H, Sakaguchi K, Kikuchi T. et al. Fabrication of functional three-dimensional tissues by stacking cell sheets in vitro. Nat Protoc. 2012;7:850-8
26. Asakawa N, Shimizu T, Tsuda Y, Sekiya S, Sasagawa T, Yamato M. et al. Pre-vascularization of in vitro three-dimensional tissues created by cell sheet engineering. Biomaterials. 2010;31:3903-9
27. Akimoto J, Takagi S, Nakayama M, Arauchi A, Yamato M, Okano T. Transplantation of cancerous cell sheets effectively generates tumour-bearing model mice. J Tissue Eng Regen Med. 2016;10:E510-E7
28. Howard BV, Macarak EJ, Gunson D, Kefalides NA. Characterization of the collagen synthesized by endothelial cells in culture. Proc Natl Acad Sci U S A. 1976;73:2361-4
29. Albelda SM, Muller WA, Buck CA, Newman PJ. Molecular and cellular properties of PECAM-1 (endoCAM/CD31): a novel vascular cell-cell adhesion molecule. J Cell Biol. 1991;114:1059-68
30. Lansing CE. Diffusion: mass transfer in fluid systems. Cambridge university press. 2009
31. Ramanujan S, Pluen A, McKee TD, Brown EB, Boucher Y, Jain RK. Diffusion and convection in collagen gels: implications for transport in the tumor interstitium. Biophys J. 2002;83:1650-60
32. Couet F, Mantovani D. Perspectives on the advanced control of bioreactors for functional vascular tissue engineering in vitro. Expert Rev Med Devices. 2012;9:233-9
33. Conway DE, Breckenridge MT, Hinde E, Gratton E, Chen CS, Schwartz MA. Fluid shear stress on endothelial cells modulates mechanical tension across VE-cadherin and PECAM-1. Curr Biol. 2013;23:1024-30
34. Lovett M, Lee K, Edwards A, Kaplan DL. Vascularization strategies for tissue engineering. Tissue Eng Part B Rev. 2009;15:353-70
35. Paulis YW, Soetekouw PM, Verheul HM, Tjan-Heijnen VC, Griffioen AW. Signalling pathways in vasculogenic mimicry. Biochim Biophys Acta. 2010;1806:18-28
36. Combaret V, Audoynaud C, Iacono I, Favrot MC, Schell M, Bergeron C. et al. Circulating MYCN DNA as a tumor-specific marker in neuroblastoma patients. Cancer Res. 2002;62:3646-8
37. Fawcett J, Buckley C, Holness CL, Bird IN, Spragg JH, Saunders J. et al. Mapping the homotypic binding sites in CD31 and the role of CD31 adhesion in the formation of interendothelial cell contacts. J Cell Biol. 1995;128:1229-41
38. Oue T, Yoneda A, Uehara S, Yamanaka H, Fukuzawa M. Increased expression of the hedgehog signaling pathway in pediatric solid malignancies. J Pediatr Surg. 2010;45:387-92
39. Delgado-Bellido D, Serrano-Saenz S, Fernandez-Cortes M, Oliver FJ. Vasculogenic mimicry signaling revisited: focus on non-vascular VE-cadherin. Mol Cancer. 2017;16:65
40. Kalmar T, Lim C, Hayward P, Munoz-Descalzo S, Nichols J, Garcia-Ojalvo J. et al. Regulated fluctuations in nanog expression mediate cell fate decisions in embryonic stem cells. PLoS Biol. 2009;7:e1000149
41. Villasante A, Piazzolla D, Li H, Gomez-Lopez G, Djabali M, Serrano M. Epigenetic regulation of Nanog expression by Ezh2 in pluripotent stem cells. Cell Cycle. 2011;10:1488-98
42. Garros-Regulez L, Garcia I, Carrasco-Garcia E, Lantero A, Aldaz P, Moreno-Cugnon L. et al. Targeting SOX2 as a Therapeutic Strategy in Glioblastoma. Front Oncol. 2016;6:222
43. Pisco AO, Huang S. Non-genetic cancer cell plasticity and therapy-induced stemness in tumour relapse: 'What does not kill me strengthens me'. Br J Cancer. 2015;112:1725-32
44. Nakamura M, Matsuo T, Stauffer J, Neckers L, Thiele CJ. Retinoic acid decreases targeting of p27 for degradation via an N-myc-dependent decrease in p27 phosphorylation and an N-myc-independent decrease in Skp2. Cell Death Differ. 2003;10:230-9
45. Li H, Collado M, Villasante A, Matheu A, Lynch CJ, Canamero M. et al. p27(Kip1) directly represses Sox2 during embryonic stem cell differentiation. Cell Stem Cell. 2012;11:845-52
46. Hammerle B, Yanez Y, Palanca S, Canete A, Burks DJ, Castel V. et al. Targeting neuroblastoma stem cells with retinoic acid and proteasome inhibitor. PLoS One. 2013;8:e76761
47. Das S, Bryan K, Buckley PG, Piskareva O, Bray IM, Foley N. et al. Modulation of neuroblastoma disease pathogenesis by an extensive network of epigenetically regulated microRNAs. Oncogene. 2013;32:2927-36
48. Smith A. Formative pluripotency: the executive phase in a developmental continuum. Development. 2017;144:365-73
49. Haraguchi Y, Shimizu T, Sasagawa T, Sekine H, Sakaguchi K, Kikuchi T. et al. Fabrication of functional three-dimensional tissues by stacking cell sheets in vitro. Nat Protoc. 2012;7:850-8
50. Ceccarelli J, Putnam AJ. Sculpting the blank slate: how fibrin's support of vascularization can inspire biomaterial design. Acta Biomater. 2014;10:1515-23
Author contact
![]() Corresponding author: Aranzazu Villasante, Associate Research Scientist, Columbia University, 622 west 168th Street, VC12-234. New York, NY. 10032. USA tel: 1-212-305-5755, fax: 1-212-305-4692 av2499edu Gordana Vunjak-Novakovic, Mikati Foundation Professor of Biomedical Engineering, Professor of Medical Sciences, Columbia University, 622 west 168th Street, VC12-234. New York, NY. 10032. USA tel: 1-212-305-2304, fax: 1-212-305-4692 gv2131edu
Corresponding author: Aranzazu Villasante, Associate Research Scientist, Columbia University, 622 west 168th Street, VC12-234. New York, NY. 10032. USA tel: 1-212-305-5755, fax: 1-212-305-4692 av2499edu Gordana Vunjak-Novakovic, Mikati Foundation Professor of Biomedical Engineering, Professor of Medical Sciences, Columbia University, 622 west 168th Street, VC12-234. New York, NY. 10032. USA tel: 1-212-305-2304, fax: 1-212-305-4692 gv2131edu