Impact Factor
- Issue 13; 2026
- Issue 12; 2026
- Issue 11; 2026
- Issue 10; 2026
- Issue 9; 2026
- Volume 16; 2026
- Advance Articles
- Past Issues
- Cover Images
- Cover Suggestion
- Index & Coverage
- Special Issues
Introduction
Materials and Methods
Results
Discussion
Conclusion
Supplementary Material
Abbreviations
Acknowledgements
References
International Journal of Biological Sciences
International Journal of Medical Sciences
 Global reach, higher impact

Theranostics 2017; 7(16):4057-4070. doi:10.7150/thno.20151 This issue Cite
Research Paper
Multiplexed Nucleic Acid Programmable Protein Arrays
Xiaobo Yu1* ![]() , Lusheng Song2*, Brianne Petritis2, Xiaofang Bian 2, Haoyu Wang2, Jennifer Viloria2, Jin Park2, Hoang Bui2, Han Li2, Jie Wang2, Lei Liu1, Liuhui Yang1, Hu Duan1, David N. McMurray3, Jacqueline M. Achkar4, Mitch Magee2, Ji Qiu2, Joshua LaBaer2
, Lusheng Song2*, Brianne Petritis2, Xiaofang Bian 2, Haoyu Wang2, Jennifer Viloria2, Jin Park2, Hoang Bui2, Han Li2, Jie Wang2, Lei Liu1, Liuhui Yang1, Hu Duan1, David N. McMurray3, Jacqueline M. Achkar4, Mitch Magee2, Ji Qiu2, Joshua LaBaer2 ![]()
1. State Key Laboratory of Proteomics, Beijing Proteome Research Center, National Center for Protein Sciences (PHOENIX Center, Beijing), Beijing Institute of Radiation Medicine, Beijing, 102206, China;
2. The Virginia G. Piper Center for Personalized Diagnostics, Biodesign Institute, Arizona State University, Tempe, AZ 85287, USA;
3. Department of Microbial Pathogenesis and Immunology, College of Medicine, Texas A&M Health Science Center, College Station, TX 77843, USA;
4. Department of Medicine, Albert Einstein College of Medicine, NY 10461, USA; Department of Microbiology and Immunology, Albert Einstein College of Medicine, Bronx, NY 10461, USA.
* These authors contributed equally to this work.
Received 2017-3-19; Accepted 2017-8-3; Published 2017-9-20
Abstract

Rationale: Cell-free protein microarrays display naturally-folded proteins based on just-in-time in situ synthesis, and have made important contributions to basic and translational research. However, the risk of spot-to-spot cross-talk from protein diffusion during expression has limited the feature density of these arrays.
Methods: In this work, we developed the Multiplexed Nucleic Acid Programmable Protein Array (M-NAPPA), which significantly increases the number of displayed proteins by multiplexing as many as five different gene plasmids within a printed spot.
Results: Even when proteins of different sizes were displayed within the same feature, they were readily detected using protein-specific antibodies. Protein-protein interactions and serological antibody assays using human viral proteome microarrays demonstrated that comparable hits were detected by M-NAPPA and non-multiplexed NAPPA arrays. An ultra-high density proteome microarray displaying > 16k proteins on a single microscope slide was produced by combining M-NAPPA with a photolithography-based silicon nano-well platform. Finally, four new tuberculosis-related antigens in guinea pigs vaccinated with Bacillus Calmette-Guerin (BCG) were identified with M-NAPPA and validated with ELISA.
Conclusion: All data demonstrate that multiplexing features on a protein microarray offer a cost-effective fabrication approach and have the potential to facilitate high throughput translational research.
Keywords: Cell-free protein microarray, Proteomics, Protein-protein interaction, Antibody, Biomarker.
Introduction
Protein microarrays display individual proteins at high density on a chemically-modified slide that can be tested simultaneously with high sensitivity, high specificity, and low reagent consumption. They have been widely applied in basic and translational research, such as protein interaction studies, immune profiling, vaccine development, biomarker discovery and clinical diagnostics, etc. [1-12]. For example, Zhang et al. used a human protein microarray to better understand how arsenic, which is used in chemotherapy, disrupts cancer signaling pathways and, further, to identify potential targets of novel therapeutic treatments. Of the 16,368 proteins that were screened, 360 arsenic binding proteins were identified, which may be novel targets for cancer treatment [7]. Anderson et al. used protein microarrays to discover a 28-autoantibody biomarker signature of early stage breast cancer with a sensitivity and specificity of 80.8% and 61.6%, respectively [13]. By combining those autoantibodies with several protein biomarkers, Provista Diagnostics developed the first protein-based blood test for early breast cancer detection called Videssa® Breast [14]. Ayoglu et al. screened sera from multiple sclerosis (MS) patients using protein microarrays containing 11,520 purified protein fragments and then validated those results using bead-based arrays [15]. The arrays indicated that Anoctamin 2 autoantibodies and the MS-associated HLA complex DRB1*15 allele were strongly associated. Additional experiments showed that Anoctamin 2 aggregates near and inside lesions within human MS brain tissue [15].
Protein microarrays can be classified into two different types, purified or cell-free, based on whether the proteins are produced in vivo or in vitro, respectively [16]. Purifying proteins is labor-intensive, requires method optimization and multiple manipulations, exhibits highly variable yields of different proteins, and may not result in naturally-folded or functional mammalian products due to expression in non-mammalian systems (e.g., E. coli, yeast). Cell-free protein microarrays overcome these challenges by depositing RNA or DNA on the slide surface and rapidly expressing them just before an experiment (~2 h) through the use of various cell-free expression systems (e.g., lysate from wheat germ, insect cells, rabbit reticulocyte and human cells). Compared to purified protein microarrays, cell-free protein microarrays are more likely to produce naturally-folded mammalian proteins due to the decreased sample manipulation and use of enhanced cell extracts with native chaperone proteins. Moreover, the use of nucleic acids vastly simplifies the production of custom arrays since any protein can be produced as long as the gene-of-interest is synthesized; for example, arrays can be produced that represent a specific proteome or signaling pathway [17-20].
A primary disadvantage of planar-based cell-free protein microarrays is the diffusion of mRNA or expressed proteins during in vitro transcription and translation (IVTT), which can then be captured by neighboring features (i.e., cross-talk). Thus, the closer the features are to each other, the higher the cross-talk [21-24]. Planar-based cell-free protein microarrays include the protein in situ array (PISA) [22], DNA array to protein array (DAPA) [25], nucleic acid programmable protein array (NAPPA)[18, 26-28], and in situ puromycin-capture array [29]. DAPA, NAPPA and puromycin-capture arrays employ a probe (e.g., Ni-NTA or anti-tag antibody) on a microarray surface that captures the expressed recombinant proteins in situ during IVTT.
Of the cell-free approaches, NAPPA has achieved the highest densities with ~ 2,300 plasmids per slide where the distance between neighboring spots is 625 µm) and the cross-talk is less than 2%. However, cross-talk is increased when the feature spacing is reduced to 375 µm [21]. With ~ 2,300 plasmids per slide, five NAPPA slides are needed to screen a proteome-scale array with over 10,000 genes [18, 30]. Therefore, an increase in spot density would reduce the amount of labor, time, reagents, and cost needed for large-scale proteome analyses like target discovery and validation experiments.
To address this issue, Angenendt et al. printed cDNA and expressed the proteins in nanowells using piezoelectric dispensers [31]. Takulapalli et al. demonstrated the fabrication of high-density cell-free protein arrays by combining photolithographically-etched silicon nanowells (n=8,000/slide), NAPPA, and a piezo-inkjet printer [21].
Here we utilized a different strategy to produce high density arrays that does not require any specialized equipment or substrates. We developed the Multiplexed Nucleic Acid Programmable Protein Array (M-NAPPA) method by combining as many as five different DNA plasmids within one spot, which increases the number of displayed proteins per microarray by five-fold.
We first demonstrate that multiplexed proteins are displayed on M-NAPPA using protein-specific antibodies. Second, we compare the ability of M-NAPPA with non-multiplexed NAPPA to detect different protein-protein interactions and the serological antibody reactivity against 646 viral proteins. Next, we show the feasibility of M-NAPPA in performing high throughput screening for immune-dominant tuberculosis (TB) antigens through the use of an ultra-high density M-NAPPA TB proteome array containing four subarrays with 4,045 TB open reading frames (ORFs) on one slide. Using M-NAPPA TB protein microarrays, four new immune-dominant antigens in the sera of BCG-vaccinated guinea pigs were identified, which were then validated using ELISA. Finally, we propose a high throughput target discovery and verification pipeline based on the M-NAPPA approach.
Materials and Methods
Sera samples
All sera samples were collected with written informed consent with the approval of Institutional Review Boards (IRB) at University of Florida (Gainsville, FL), Arizona State University (Tempe, AZ) and Albert Einstein College of Medicine (Bronx, NY). Detailed sample information was provided in our previous work [17, 20]. The sera from guinea pig TB models vaccinated with BCG were kindly provided by Dr. David N. McMurray from Texas A&M College of Medicine [32]. All experiments using clinical sera samples were executed according to the Declaration of Helsinki.
Generation of mathematical model
A mathematical model was built based on a two-step analysis process. The first round of screening would use multiplexed plasmids with the primary objective of identifying potential protein “hits.” The second round would be non-multiplexed, in which each multiplexed “hit” from the first round would be printed separately, with the primary goals of validating and identifying specific individual hits.
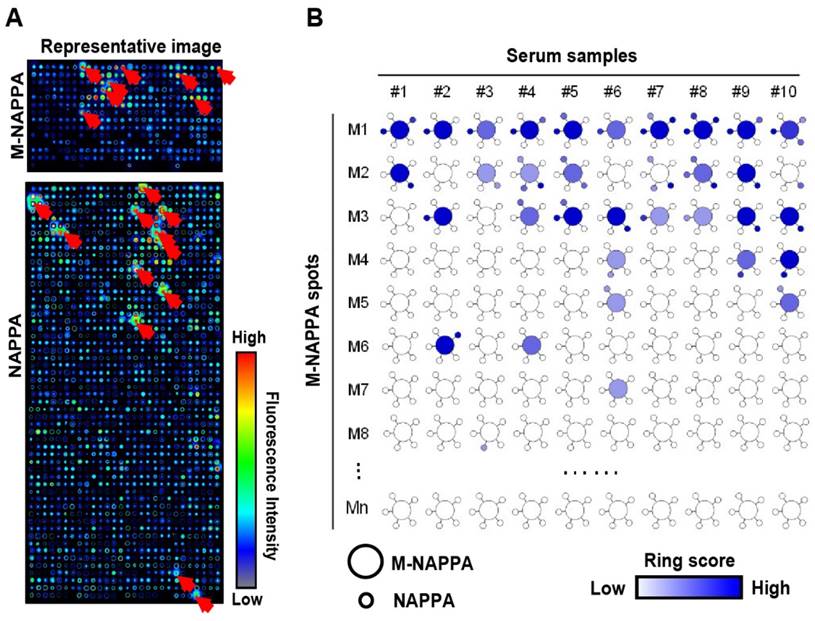
The total number of printed spots (N) needed for the combined two-round screening of 10k proteins was determined by the number of plasmids printed per spot and the anticipated hit rates (i.e., percentage of displayed proteins that will be identified as significant in the study). The probability p of an individual protein being a true hit can be estimated from previous studies of a similar nature (e.g., antibody biomarkers). The following equation assumes that p follows a Bernoulli distribution and that its corresponding plasmid is randomly multiplexed where the number of different plasmids per spot is k:
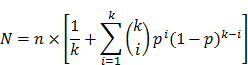
The number of spots needed in the first round is  , The probability that a multiplexed spot would be a hit (i.e., containing at least one immune-dominant antigen) is
  . The number of spots needed in the second round is
 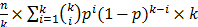 . The optimal level of multiplexing of k different plasmids per spot results in the smallest N.
M-NAPPA preparation
All human and viral ORF plasmids were obtained from DNASU (https://dnasu.org/), and transferred into a T7-based mammalian expression vector, pANT7-cGST, as previously described [18, 30, 33]. Purified DNA plasmids were prepared by our automated DNA factory robot as previously described [18, 30, 33], and were normalized to 1,200 ng/μL, such that multiplexed plasmids contributed equally to the final concentration. In other words, a plasmid in a five-multiplexed spot would represent 240 ng/μL. Five (5) different plasmids containing a different gene-of-interest were mixed with a master printing mixture containing BSA (Sigma), BS3 cross-linker (Thermo Fisher Scientific, IL) and polyclonal α-GST antibody (Thermo Fisher Scientific, IL)[26], and subsequently incubated at 4 oC for 2 h. M-NAPPA and NAPPA were printed by the NAPPA Protein Array Core (http://nappaproteinarray.org/) according to published protocols [18, 30, 33]. The quality of printed plasmid DNA on M-NAPPA and NAPPA was determined using PicoGreen DNA staining [26].
Detection of protein expression on M-NAPPA
Each M-NAPPA microarray was blocked with Superblock solution (Pierce, Rockford, IL) for 1 h at 23 °C, briefly washed with water, centrifuged at 1000 rpm for 3 min to dry, and covered with a hybridization chamber (Grace BioLabs, OR). The array was then incubated with 160 μL of human in vitro transcription & translation (IVTT) solution containing human HeLa cell lysate, accessory proteins, reaction mixture, and nuclease-free water (Thermo Fisher Scientific, IL) for 1.5 h at 30 °C and 0.5 h at 15 °C to express the GST-tagged proteins-of-interest. The GST-tagged proteins were displayed on the slide surface via the polyclonal α-GST antibody that was included in the printing mixture. Then, the resulting protein microarray was incubated with 5% (w/v) milk in 1xPBS with 0.2% (v/v) Tween-20 (PBST) for 1 h at 23 °C, followed by three brief washes with PBST. The protein specific antibodies were diluted with 5% milk-PBST at 1:50 or 1:100, respectively, and incubated with the protein microarray for 16 h at 4 °C followed by a 1 h incubation at 23 °C with an Alexa Fluor 555 labeled secondary antibody (Jackson ImmunoResearch Laboratories, PA). After washing three times with PBST, the M-NAPPA slides were briefly rinsed with water and dried by centrifugation (2,000 rpm, 2 min). The arrays were scanned by a Tecan scanner (Männedorf, Switzerland).
Detection of protein-protein interactions on M-NAPPA
After proteins were expressed on M-NAPPA, the resulting protein arrays were blocked with blocking buffer (1×PBS, 1%Tween 20 and 1% BSA, pH 7.4) for 1 h at 4 oC. In parallel, the query proteins (e.g., Rb1, Jun, Fos, LidA) fused to a HaloTag were produced by incubating 90 ng of DNA in 180 μL human cell-free expression system (Thermo Fisher Scientific, IL) for 2 h at 30 oC. To screen protein-protein interactions, the protein array was incubated with unpurified Rb1-Halo protein in human HeLa lysate for 16 h at 4 oC, and then washed with cold washing buffer (PBS, 5 mM MgCl2, 0.5% Tween20, 1% BSA and 0.5% DTT, pH 7.4 at 4 oC) three times to remove unbound molecules. The arrays were consecutively incubated with a chicken anti-Halo tag antibody (GeneTel, WI) and Alexa Fluor 555 goat anti-chicken secondary antibody (Jackson ImmunoResearch Laboratories, PA) for 2 h at 4 oC. Arrays were washed and dried with brief centrifugation at 1,000 rpm for 1 min, and scanned as described above. The protein binding signal was quantified using Array-Pro Analyzer (Media Cybernetics) software as previously reported [20, 33].
Data visualization
For a given experiment, a tab-separated file with the interaction information was generated and loaded into the Cytoscape software [34] with an attribute file that contained signal intensities of features on M-NAPPA and NAPPA. In Figures 4 and 5, proteins within a multiplexed M-NAPPA feature and its five corresponding non-multiplexed proteins on NAPPA were displayed as connecting large and small nodes, respectively, with color gradients depicting signal intensities.
Detection of protein-protein interactions on M-NAPPA. (A) Representative images of Rb1-HaloTag binding to its known protein targets on M-NAPPA and NAPPA, which were detected using a chicken anti-HaloTag antibody and Alexa555 goat anti-chicken antibody. Rb1's protein partners are indicated with a red arrow. False-colored images across a rainbow scale corresponds to the relative level of Rb1 binding signal, where low and high Rb1 binding levels are represented by blue and red, respectively; (B) Multiplexed features on M-NAPPA (large circle) and the deconvoluted features on NAPPA (smaller connecting circles) that bound to Rb1-HaloTag. The blue scale bar corresponds to the relative level of Rb1 binding signal within the spot while the white-to-red color scale corresponds to the level of Rb1 binding signal to diffused target protein outside of the spot (i.e., “ring”).
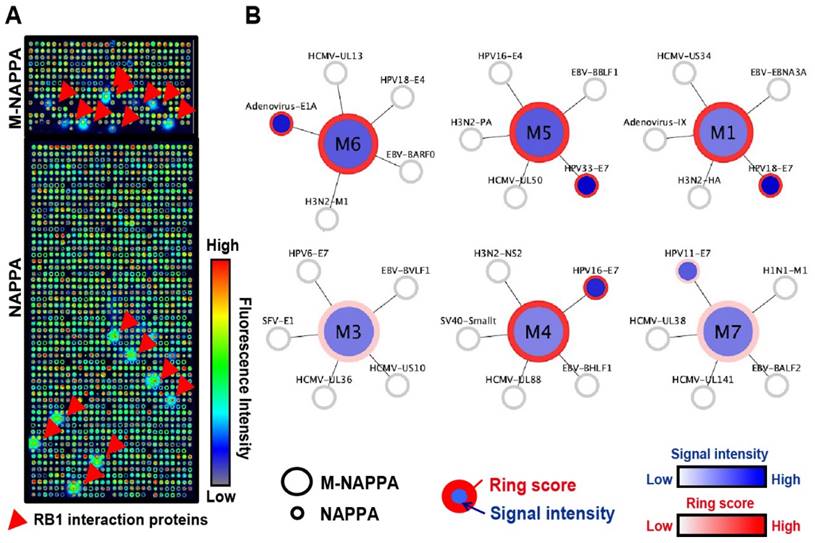
Detection of serological antibodies on viral M-NAPPA arrays. (A) Representative images of viral antibody detection on M-NAPPA and NAPPA; (B) Comparison of anti-viral antibodies binding to their displayed protein antigens on M-NAPPA (large circle of five multiplexed genes) and NAPPA (small circle of deconvoluted genes). The blue scale bar corresponds to the relative level of antibody binding signal.
Detection of serological antibodies on M-NAPPA
After proteins were expressed on M-NAPPA, the arrays were blocked with 5% milk-PBST for 1 h and then incubated with sera at 1:300 dilution in 5% milk-PBST for 16 h at 4 °C. After washing three times with PBST, the resulting arrays were incubated with Alex Fluor 555 labeled anti-human IgG antibody (Jackson ImmunoResearch Laboratories, PA) 1 h at 23 °C. The slides were washed with PBST, briefly rinsed with water, and dried by centrifugation (2,000 rpm, 2 min). The fluorescent scanning was performed using a Tecan scanner (Männedorf, Switzerland). The antibody binding event was quantified by fluorescence signal intensity using Array-Pro Analyzer (Media Cybernetics) software as previously reported [20, 33].
Results
Conception of M-NAPPA
Protein microarrays have been used in functional protein and antibody biomarker studies to screen for target(s)-of-interest, which are generally rare in the tested protein population (Figure 1B). For example, the median hit rates (± standard deviation, SD) of studies employing protein microarrays in the past five years for screening protein function and autoantibody biomarkers (Table S1) were 0.49% ± 1.23% and 1.02% ± 4.46%, respectively (Figure 1B). Since false positives are not uncommon during initial screens, all initial candidates require an independent verification step performed using different samples [5, 7, 8, 19, 35-37]. Considering that a two-step approach for target discovery and verification often uses hundreds to thousands of samples, the cost of such studies using full-scale arrays can be inhibitory.
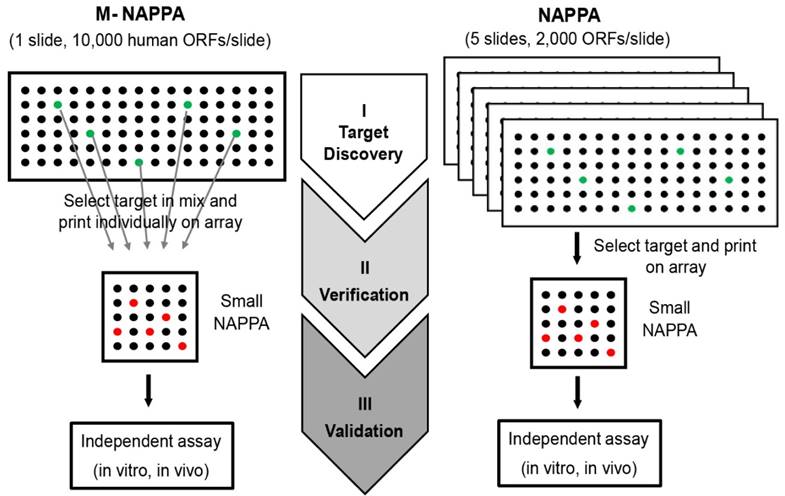
Multiplexed proteins per feature is made possible by low hit rates in HT screening studies. (A) Schematic illustration of unbiased target discovery using M-NAPPA protein microarrays where each spot contains five gene plasmids encoding for different proteins. The hits identified from high-density M-NAPPA protein microarrays could be deconvoluted by non-multiplexed NAPPA arrays. (B) Percentage of hits identified in high throughput protein function and autoantibody biomarker studies in 37 publications within the last five years. (C) Plot of the total number of features needed to evaluate hits in a primary screen followed by verification study at different multiplicities and hit rates. The red arrow points to the optimal number of genes printed within each spot for 10k proteins with an estimated hit rate of 5%.
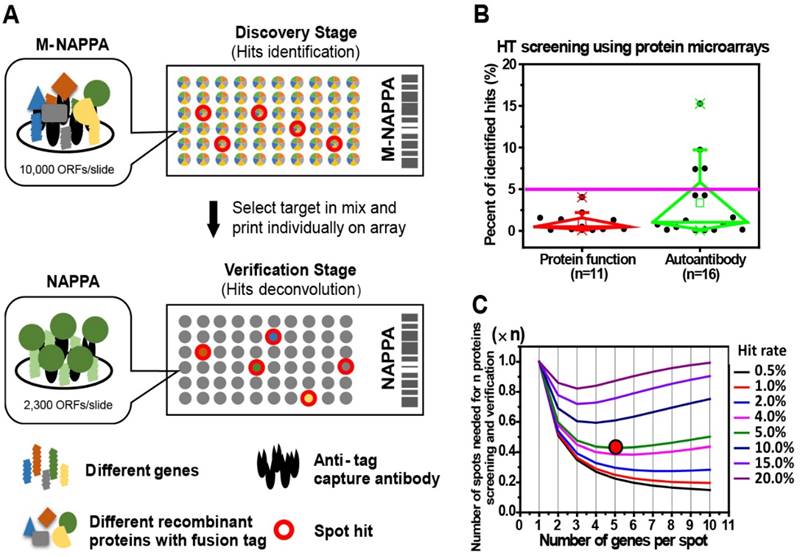
To decrease the cost of high throughput screening experiments, we hypothesized that the plasmid cDNA encoding for different proteins could be multiplexed (by combining M different plasmids) within each feature to create a high-density array, M-NAPPA (Figure 1A). This multiplexed array could be implemented during the initial functional screen, testing entire proteomes (P proteins) using only a fraction of the features (P/M). Multiplexed hits identified during the screening step could then be de-convoluted in the subsequent verification step using the standard, non-multiplexed NAPPA array where each feature displays only one protein (i.e., M=1). The objectives of the second step would be to identify which proteins were responsible for the positive multiplexed signal and to verify whether the hits were real. This approach exploits the high flexibility of cell-free microarrays, in which arrays can be customized by simply re-arraying individual plasmids encoding for the multiplexed features-of-interest.
The schematic illustration of how M-NAPPA arrays are processed is shown in Figure 1A. Using a standard pin-based arrayer, each spot on M-NAPPA contains plasmids encoding for different proteins-of-interest with the same fusion tag. The genes are then transcribed and translated into recombinant proteins in two hours using a cell-free expression system, and captured to the slide surface in situ via a fusion tag antibody.
The optimal number of proteins to multiplex depends upon several factors, including hit frequency, cost, array space, and number of proteins. As the frequency of hits in the screen increases, more proteins will need to be tested as individual features during the verification step. Taken to the extreme, if one protein per multiplexed feature were a hit (hit rate = 1/M), all multiplexed features would require deconvolution, making the multiplexing approach impractical. However, such a high hit rate is not reflected by data collected by numerous studies; for example, the hit rate was < 5% in most of our previous NAPPA-based screening studies with 10k human genes (Figure 1B). We generated a mathematical model (Materials and Methods) to find the optimal M that would take into consideration array space and the cost of screening and verifying hits using our 10k protein human collection at different hit rates. In Figure 1C, the x-axis represents the number of genes per spot (M) while the y-axis represents the number of spots or proteins that are needed for the two-step screening process. Notably, when the hit rate is < 5% for 10k proteins, a relatively small number of spots would be needed for the entire study (screening + verification) with 5 proteins multiplexed per feature in the initial screen, thus representing a good compromise between the number of initial features screened and the subsequent number of features that would be needed for deconvolution and verification.
Comparison of protein display by NAPPA and M-NAPPA
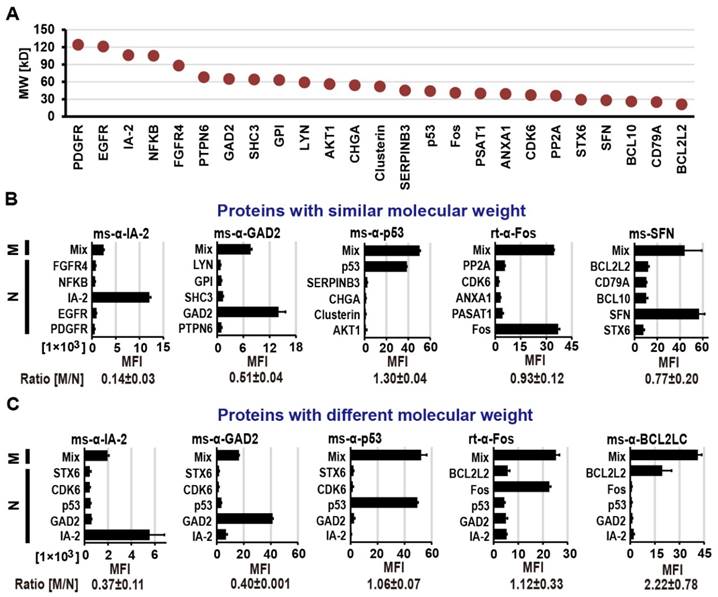
To assess the difference in transcriptional/translational efficiency as well as display competition between large and small proteins within one feature, we multiplexed proteins of varying molecular weights (MW; 20 - 124 kDa) covering 80% of the size range in our human protein collection (Figure S2) on M-NAPPA. As indicated in Figure 1, we prepared NAPPA and M-NAPPA slides in parallel where NAPPA had only one plasmid per spot and M-NAPPA multiplexed five plasmids per spot. After IVTT, the protein arrays were probed with eight antibodies that bound targets ranging in size from 20 to 106 kDa (Methods and Figure S1). These antibodies were specific to IA-2 (106 kDa), GAD2 (65 kDa), Clusterin (52 kDa), p53 (44 kDa), Fos (40 kDa), PP2A (36 kDa), SFN (28 kDa) and BCL2L2 (20 kDa).
We compared the protein display between the two array types using groups of five proteins with either similar (Figure 2A and Figure 2B) or varied molecular weights (Figure 2A and Figure 2C), and then calculated the signal ratio of M-NAPPA to NAPPA. In both cases, all of the antibodies readily detected their corresponding antigens. For the spots with similarly-sized proteins (36 kDa to 85 kDa), the signal ratio of M-NAPPA to NAPPA was 0.78±0.44. For the spots containing five proteins covering a wide range of molecular weight, from 29 kDa to 106 kDa (Figure 2C), the binding signal ratio of M-NAPPA to NAPPA was 1.03±0.75 (Figure S3). Thus, multiplexing proteins of similar size did not confer any advantage over random multiplexing.
Protein display on M-NAPPA arrays. (A) Distribution of molecular weights for the proteins used in protein display examination. Five proteins with either (B) similar molecular weights (36 kDa to 85 kDa) or (C) a wider range of molecular weights (29 kDa to 106 kDa) were displayed as mixed (M) or as individual (N) proteins. Protein levels were assessed by probing the array with antibodies that target each protein (e.g., IA2, GAD2, p53, Fos, SFN, and BCL2L2). The fluorescence signal intensity (MFI) for each protein was compared between the M and N groups by calculating the M/N ratio. Abbreviations ms and rt are for mouse and rabbit, respectively.
To further demonstrate that there were no biases in the expression of different proteins produced from mixed plasmids, five-plasmid mixtures containing various combinations of seven different genes (Abl1, IA-2, GAD2, Jun, RhoU, BCL2L2 and MT3033) were co-expressed in IVTT solution and analyzed via western blot. Despite a wide range of protein sizes, all proteins were expressed at similar amounts in their relevant combinations (Figure S4).
These data indicate that, although each plasmid in M-NAPPA is present at one-fifth the amount present in standard NAPPA, there was no significant difference of protein display levels between the arrays (p-value = 0.36, paired sample t-test). In addition, background signals that resulted from non-specific antibody binding were comparable between the platforms, demonstrating that multiplexing does not result in an accumulation of background signal that could contribute to the identification of false positives (Figure S5). Therefore, we randomly mixed different gene plasmids in the following M-NAPPA studies.
To demonstrate that the signal intensity for M-NAPPA was reproducible, we also tested the spot-to-spot, zone-to-zone and slide-to-slide variations by printing 80 gene plasmids on different locations across the M-NAPPA and NAPPA slides. Protein display was then examined with anti-GST antibody staining (Materials and Methods). The coefficient of variations (CVs) for spot-to-spot, zone-to-zone and slide-to-slide were 3.64±3.27%, 7.57±3.41% and 7.27±4.00% for M-NAPPA, respectively, and 7.63±10.58%, 12.13±7.56%% and 13.25±9.42%% for NAPPA, respectively (Table S4).
Performing functional assays using M-NAPPA arrays
Fabrication of viral M-NAPPA protein microarrays
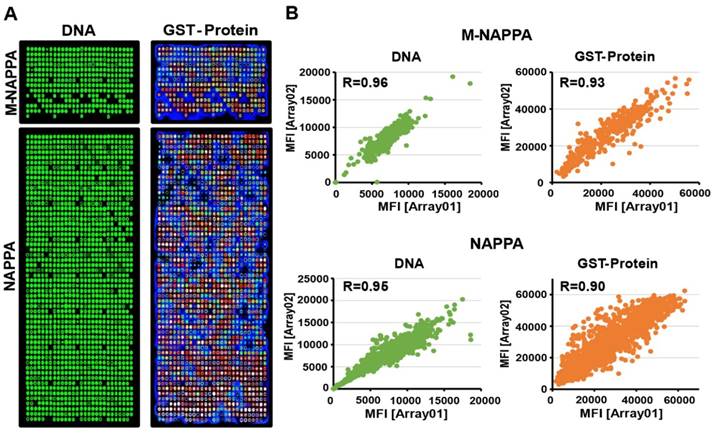
We purified 646 viral ORF plasmids from ~23 viruses, normalized their concentrations to 1,200 ng/µL, and printed viral NAPPA and M-NAPPA arrays in duplicate [20]. Analyses of the deposited DNA and displayed protein levels indicate that most viral DNA plasmids were successfully printed, expressed, and captured onto the microarrays in a reproducible manner (Figure 3A). For example, plasmid DNA deposition across technical replicates of NAPPA and M-NAPPA had correlations (R) of 0.95 and 0.96, respectively. The protein display correlation (R) across technical replicates of NAPPA and M-NAPPA were 0.90 and 0.93, respectively (Figure 3B, Figure S6). “Non-spots” containing printing buffer alone without plasmid DNA was used as a negative control. 94% and 93% of the spots on NAPPA and M-NAPPA viral arrays, respectively, produced signal that was at least two SDs above the average signal intensity of these “non-spots” (Figure S7). Together with Figure 2, the results indicate that the majority of viral proteins can be displayed on M-NAPPA arrays.
Fabrication of viral M-NAPPA microarrays. (A) Representative images of printed plasmid DNA (via Picogreen) and displayed protein (via anti-GST antibody to the fusion tag) on M-NAPPA and NAPPA; (B) Technical reproducibility of DNA deposition and protein display for M-NAPPA and NAPPA arrays.
In addition, we compared the S/B (signal to background) ratios between direct fluorescence and tyramide signal amplification (TSA) using a fluorophore-linked or HRP-conjugated anti-p53 antibody, respectively. Using the signal from “non-spots” as background, we found that the S/B ratio of fluorescence detection using an antibody with a directly-conjugated fluorophore, the Dylight649 rabbit anti-mouse IgG, was higher (S/B ratio = 431±38) than the TSA method with the HRP-labeled goat anti-mouse IgG (S/B ratio = 323±18). Thus, directly-conjugated fluorescent secondary antibodies were used for the following assays (Figure S8).
Performing protein-protein interaction assays using M-NAPPA
To determine whether NAPPA and M-NAPPA detect similar protein-protein interactions, both arrays were programmed to display proteins that are known to interact with the tumor suppressor protein Rb1. The arrays were then probed with a Rb1 query protein fused to HaloTag, and interactions were detected using an anti-HaloTag antibody. The Rb1-HaloTag query protein bound to several targets (red arrow) on NAPPA and M-NAPPA arrays; the query also bound to diffused targets outside of each spot, which appear as a “ring” around each feature (Figure 4A). In Figure 4B, we used a flower pattern diagram to depict the multiplexed proteins on M-NAPPA (large central circle) and the deconvoluted individual proteins on NAPPA (five small connecting circles) (Materials and Methods). The blue gradient within the spot indicates target binding to the Rb1 query protein, whereas reactivity to the “ring” [20, 33] is indicated by a red circle around the spot. Using custom defined criteria, where the target-to-“non-spot” signal ratio is ≥ 2 and the ring score is ≥ 3, we found that 5 and 6 hits were identified on NAPPA and M-NAPPA, respectively, out of the 30 possible candidate target proteins (Table S2, Table S3). Five of the 6 hits on M-NAPPA were E1A, HPV11-E7, HPV16-E7, HPV18-E7 and HPV33-E7, which agrees with previous studies [38-40]. The sixth hit on M-NAPPA was not detected with NAPPA, thus suggesting that the hit may be a false positive.
To further examine the utility of M-NAPPA to test protein-protein interactions, additional interactions were analyzed with 35 displayed proteins on NAPPA and M-NAPPA using HaloTagged-Jun, -Fos, and -LidA queries. Jun, Fos and LidA bound to their expected interaction partners (i.e., Fos, Jun and three Rab family proteins, respectively) on both M-NAPPA and NAPPA arrays (Figure S9). Regarding the protein interactions that were identified, the spot-to-spot and zone-to-to zone CVs were 5.65±2.69% and 5.75±3.86% for NAPPA, respectively, and 2.55±2.56% and 3.11±3.46% for M-NAPPA, respectively (Table S5).
These results indicate that M-NAPPA can be used for preliminary high throughput (HT) screening of novel protein-protein interactions. The screen can then be followed by a verification step using deconvoluted spots via NAPPA to identify the specific proteins that are involved.
Identification of serological antibodies using M-NAPPA
To test whether M-NAPPA can be used to detect proteomic serological response, we screened ten serum samples from patients with type 1 diabetes that had been previously characterized using NAPPA arrays [20]. A dozen hits were observed with M-NAPPA and NAPPA (Figure 5). Forty-nine of the 53 antigens (92.5%) identified by NAPPA were also detected by M-NAPPA. Four antigens, however, were detected with only one platform (i.e., two with NAPPA, two with M-NAPPA). These uncommon discrepancies may be due to variations in surface chemistry, plasmid concentration, printing or array processing.
High throughput identification of immune-dominant antigens using M-NAPPA tuberculosis proteome microarrays
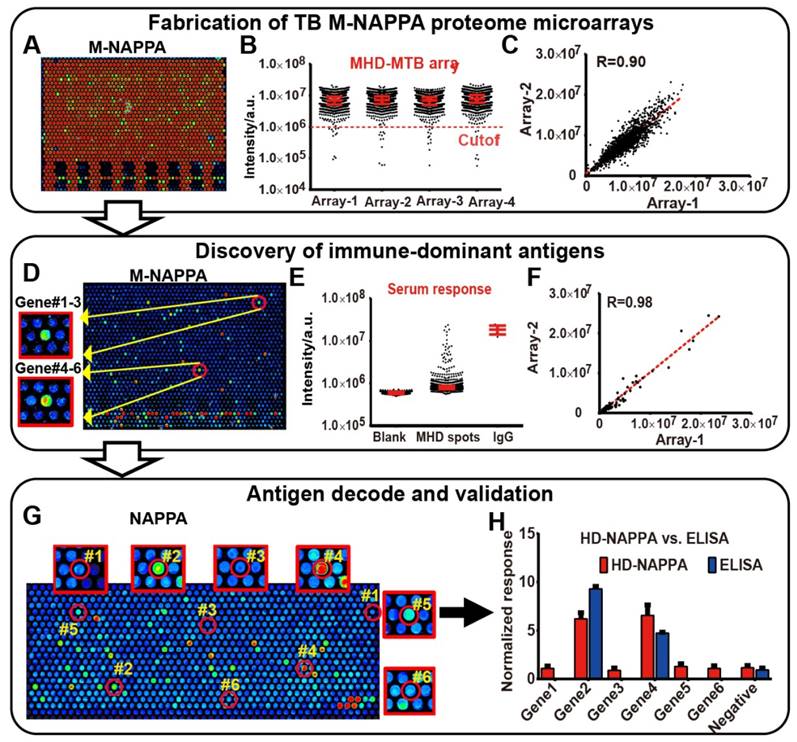
Since the multiplex concept to increase feature density was successful in detecting protein-protein interactions and serological antibody responses on planar microarrays, we wanted to determine whether M-NAPPA could also be applied to a nano-well microarray platform. We previously increased feature number by printing plasmids into photolithography-etched silicon nano-wells to create a high-density NAPPA (HD-NAPPA) platform [41]. HD-NAPPA can have as many as 10k features per slide, and has successfully detected antiviral antibodies in autoimmune diseases with 761 different proteins displayed on the array in quadruplicate. These tiny wells hold only 1200 pL and use only 0.12 ng of plasmid DNA. We applied the multiplex concept to HD-NAPPA using a mixture of plasmids encoding for IA-2, GAD2 and p53 proteins. We then detected their expression and display using specific antibodies; all of these proteins were readily detectable when printed as a three-plexed mixture (Figure S10). We then multiplexed 4,045 tuberculosis (TB) ORFs [32] onto HD-NAPPA microarrays as four separate subarrays using three gene plasmids per well (M=3), resulting in an M-HD-NAPPA microarray displaying > 16k proteins on a single slide. This lower multiplicity was based on the mathematical model (Figure 1C) that took into account that the high number of conserved proteins in endemic, non-pathogenic mycobacterial species results in a higher hit rate (~10% [37]).
Over 95% of the spots generated a signal that was at least 10 SDs above the background, which indicates that the vast majority of proteins were well-expressed and displayed (Figure 6A), with a correlation of R = 0.90 across technical replicates (Figure 6A-C). Antibody reactivity from TB patient sera was observed with M-HD-NAPPA (Figure 6D). The technical reproducibility of these immune-dominant antigens across different M-NAPPA arrays using the same sera was very high, with a correlation of R = 0.98 (Figure 6D-F). All immune-dominant antigens identified with M-HD-NAPPA screening were then deconvoluted in the verification step using single protein NAPPA (Figure 6G) and validated with RAPID-ELISA as previously described [19] (Figure 6H).
M-NAPPA TB proteome microarray fabrication, protein display, and role in detecting immune-dominant antigens. (A) Representative image of protein display on M-NAPPA TB proteome microarrays; (B) Distribution of protein display across four M-NAPPA TB proteome microarrays using an antibody specific to the capturing fusion tag; (C) Correlation of protein display across different TB proteome microarrays; (D) Representative image of serological antibody detection on an M-NAPPA TB proteome microarray; (E) Distribution of serum antibody binding signals on a M-NAPPA TB proteome microarray; (F) Correlation of serological antibody detection using M-NAPPA TB proteome microarrays; (G) Deconvoluted and verification of TB antibody candidates from M-NAPPA using NAPPA protein microarrays; (H) Validation of a reactive serological antibody on M-NAPPA and NAPPA using ELISA. (A, D, G) False-colored images across a rainbow scale where low and high binding are represented by blue and red, respectively.
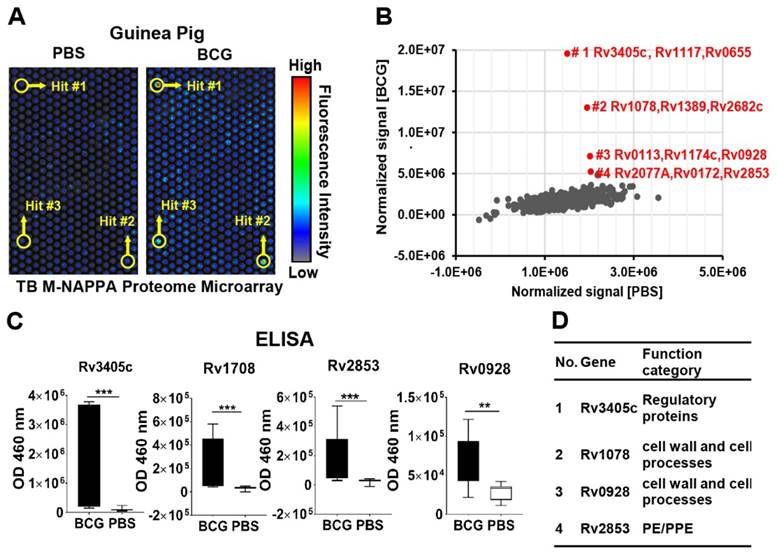
We screened the sera from guinea pigs immunized with Bacillus Calmette-Guerin (BCG), a TB vaccine, using M-HD-NAPPA TB proteome microarrays. The aim of this experiment was to identify potential protective antibodies induced with BCG. The representative fluorescence images are shown in Figure 7A. Compared to the control mock sera pool using PBS buffer (n=5), four features on M-NAPPA arrays showed increased signals with the BCG samples (n=4) (Figure 7B). To deconvolute and validate those targets, we repeated the serological assay for those candidate proteins, along with two non-responsive control proteins (Rv2077A and Rv2682c), using RAPID-ELISA and the individual sera from the guinea pigs. The antibody levels of four antigens (Rv3405c, Rv1078, Rv2853 and Rv0928) in BCG-vaccinated guinea pigs were significantly higher than that of the PBS control with a p-value <0.01 (Figure 7C, Figure S11). According to the Tuberculist database (http://tuberculist.epfl.ch/), these proteins are involved in regulation, cell wall and cell processes, and are considered to be in the proline-glutamic acid / proline-protein-glutamic acid (PE/PPE) protein families (Figure 7D).
Serological antibody response induced by the BCG vaccine in guinea pigs. (A) Discovery of antibody hits using M-NAPPA TB proteome microarrays using the sera pool from guinea pigs immunized with the BCG vaccine (n=4) or PBS (negative control, n=5); (B) The four top hits with increased antibody signal in guinea pigs vaccinated with BCG; (C) Deconvolution and verification of antigens using RAPID-ELISA and individual guinea pig sera. The p-value was calculated using an un-paired Man Whitney t-test. * p-value ≤0.01, ** p-value ≤0.001, *** p-value ≤0.001; (D) Annotation of identified TB antigens associated with the BCG vaccine.
A primary advantage of cell-free protein microarrays is that the arrays have a long shelf life. We compared the protein expression of M-NAPPA TB arrays immediately after printing and then again after 6 months of storage at room temperature in a nitrogen atmosphere. A GST-tagged protein, detected with an anti-GST antibody, was considered to be displayed if it had a signal that was two SDs above the signal of the “non-spots.” Over 99% of the proteins were displayed on new M-NAPPA arrays; this number, as well as the anti-GST signal intensity, did not change even after 6 months of storage (Figure S12).
Discussion
NAPPA has been widely applied in protein-protein interactions, post-translational modifications (PTMs), antibody epitope mapping and discovery of (auto) antibody biomarkers for a variety of human diseases, including markers that are currently being used in the clinic for the detection of breast cancer [13, 14, 18, 20, 32, 36, 42-44]. Due to mRNA and protein diffusion during IVTT, the number of features per planar microscope slide has been limited to ~2,300 to minimize cross-talk to neighboring spots. The feature density limit has thus required that multiple slides be used to study large proteomes.
Here, we developed a new strategy, M-NAPPA, that significantly increases the number proteins that can be tested per slide multiple-fold. By combining five different plasmids within one feature, >10k proteins can be printed on one microscope slide for HT, low cost analyses when compared to studies using one-plasmid-per-feature arrays. The multiplexed hits that are identified with M-NAPPA can then be deconvoluted during the subsequent verification step (Figure 8).
M-NAPPA can be used for target discovery in HT screening. The identified hits on M-NAPPA can be verified by a small array containing those deconvoluted candidates, and further validated using an independent in vivo or in vitro assay.
First, we constructed a mathematical model to determine the optimal level of multiplexing, which considers the number of proteins, cost, array size, and hit rate to predict the number of arrays that would be needed for a two-step screening and verification study. A survey of HT unbiased target screening studies that used protein microarrays, both in the literature and our own results using NAPPA, revealed that hits are rare (typically <5%) (Figure 1B). For 10k proteins and a hit rate of 5%, the mathematical model indicated that multiplexing 5 proteins per spot (Figure 1C) would provide a good balance of maximizing the number of features, minimizing the number of arrays, and yielding the minimum overall workload when compared to using non-multiplexed arrays for both the screening and verification steps.
Second, we demonstrated that there was nothing inherent to printing plasmids as a five-plasmid mixture that prevented their expressed proteins from routine detection regardless of protein size. However, display levels of large proteins (≥ 65 kD) were decreased by 60±0.1% for GAD2 and 63±11% for IA-2 (Figure 2C). This may be because the plasmids were mixed equally together based on their masses, a requirement imposed by the printing chemistry; this would result in a lower molarity of large plasmids (i.e., large proteins) relative to small plasmids in the printing mixture. Another possible reason is that larger proteins are produced more slowly than smaller proteins due to their longer mRNA sequences.
Third, we showed that M-NAPPA can be used in protein-protein interaction and serological screening studies. The results from M-NAPPA agreed strongly with those observed with non-multiplexed NAPPA (Figure 3-5, Table S2 and S3, Figure S9). These data indicate that M-NAPPA presents a labor- and cost-effective strategy to initially screen for hits.
Fourth, we further increased the feature density by applying this method to our previously-published nano-well platform [21]. With M-HD-NAPPA, the entire TB proteome containing 4,045 genes was successfully printed on a nano-well array in quadruplicate [20] (Figure 6). This generates the highest density nano-well protein microarray to date and increases the previously demonstrated content by more than five-fold [20]. Our data indicate that the multiplexing strategy has great potential value for use with different microarray platforms (Figure 6 and Figure 7) [45].
Finally, we evaluated the reproducibility of M-NAPPA arrays for protein array preparation and protein-protein interactions. We found M-NAPPA can be reproducibly fabricated with spot-to-spot, zone-to-zone and slide-to-slide CVs that are similar to those obtained with NAPPA (Table S4). The spot-to-spot and zone-to-to zone CVs for protein-protein interactions were also similar between the two array platforms (Table S5). While the correlations within and between different M-NAPPA slides were good (i.e., R = 0.93 for both) (Figure 3 and Figure S6), with some size adaptation, the reproducibility could eventually be further improved with the use of automation equipment like the HS 4800 Pro Hybridization Station (Tecan Trading AG; Männedorf, Switzerland).
In some ways, M-NAPPA resembles “natural protein” microarrays that print unpurified or partially fractionated proteins from lysates of human cells, tissues or body fluids, but in a much more controlled manner. Each feature of a natural protein microarray typically represents a mixture of unknown proteins. Thus, responsive hits on natural protein arrays require a challenging and time-consuming process to determine the identity of the protein responsible for the response. This may require further purification, identification by mass spectrometry and additional response testing of recombinant proteins [46, 47]. In the case of M-NAPPA, the identities of the proteins in each mix are known in advance and the plasmids encoding for each protein are available for secondary testing.
M-NAPPA would be useful in unbiased HT screening studies, such as protein-protein interactions, protein-DNA interactions, discovery of drug binding target as well as (auto)antibody biomarkers for a variety of human diseases. However, it should be noted that there are situations in which using a non-multiplexed array format would be more appropriate. For example, NAPPA should be used when investigating protein functions or when the number of proteins to be screened is low. Additional attributes of M-NAPPA should be considered as well. Large, multiplexed proteins (≥ 65 kDa) on M-NAPPA are displayed at a lower level (37 - 40%) than their non-multiplexed counterparts (Figure 2C). This issue could be resolved by increasing plasmid DNA concentration before printing or reducing multiplicity per spot. Alternatively, since large proteins represent a small fraction of the proteome, a hybrid array containing multiplexed spots with plasmids encoding for proteins with low to moderate MWs and non-multiplexed spots for large proteins (≥ 65 kDa) could be employed. In addition, PTMs that occur during cell-free protein expression may affect the protein display or activity on M-NAPPA arrays [42]. We have observed that the human expression system contains the ability to phosphorylate some proteins (data not shown); other types of PTMs (e.g., glycosylation, acetylation) by the expression system are not well known or reported. In our studies, PTMs did not appear to affect protein expression, protein-protein interactions, or the identification of serological antigens on M-NAPPA when compared to NAPPA (Figure 2, Figures 4-7 and Figure S7).
Conclusion
We developed a method that multiplexes five different proteins within the same feature, called M-NAPPA, which significantly increases array density while decreasing experimental time and cost. Although we used this approach with NAPPA and HD-NAPPA, the same concept could be applied toward other microarray technologies or platforms. Our results show that M-NAPPA identified hits in protein interaction and serum screening studies, thus highlighting its potential to be employed in high throughput proteomics studies.
Supplementary Material
Supplementary Table S1-S5 and Supplementary Figures S1-S12.
Abbreviations
BCG: Bacillus Calmette-Guerin, CVs: coefficients of variation, DAPA: DNA array to protein array, HD: High-density, HT: High throughput, IRB: Institutional Review Boards, IVTT: in vitro transcription and translation, M-NAPPA: Multiplexed Nucleic Acid Programmable Protein Array, ORFs: Open reading frames, PBST: 1xPBS with 0.2% (v/v) Tween-20, PISA: protein in situ array, PTMs: Post-translational modifications, R: Correlation, S/B: Signal/background, TB: Tuberculosis, TSA: Tyramide signal amplification.
Acknowledgements
We thank for Dr. Mark Atkinson (University of Florida) for providing sera samples. This work was supported by the National Natural Science Foundation of China (81673040), National International Cooperation Grant (2014DFB30010), the State Key Laboratory of Proteomics (SKLP-O201504 and SKLP-K201505), Beijing Municipal Human Resources and Social Security Bureau (Grant for Overseas Scholars) and Guangdong Science and Technology Department (2016A020215004) to X.Y., Early Detection Research Network (5U01CA117374) to J.L and National Institute of Allergy and Infectious Diseases (NIAID) (RO1AI096213) to DMM, JMA and JL.
Competing Interests
The authors have declared that no competing interest exists.
References
1. Phizicky E, Bastiaens PI, Zhu H, Snyder M, Fields S. Protein analysis on a proteomic scale. Nature. 2003;422:208-15
2. Templin MF, Stoll D, Schrenk M, Traub PC, Vohringer CF, Joos TO. Protein microarray technology. Drug Discov Today. 2002;7:815-22
3. Zhu H, Hu S, Jona G, Zhu X, Kreiswirth N, Willey BM. et al. Severe acute respiratory syndrome diagnostics using a coronavirus protein microarray. Proc Natl Acad Sci U S A. 2006;103:4011-6
4. Felgner PL, Kayala MA, Vigil A, Burk C, Nakajima-Sasaki R, Pablo J. et al. A Burkholderia pseudomallei protein microarray reveals serodiagnostic and cross-reactive antigens. Proc Natl Acad Sci U S A. 2009;106:13499-504
5. Lin YY, Lu JY, Zhang J, Walter W, Dang W, Wan J. et al. Protein acetylation microarray reveals that NuA4 controls key metabolic target regulating gluconeogenesis. Cell. 2009;136:1073-84
6. Yu X, Schneiderhan-Marra N, Joos TO. Protein microarrays for personalized medicine. Clin Chem. 2010;56:376-87
7. Zhang HN, Yang L, Ling JY, Czajkowsky DM, Wang JF, Zhang XW. et al. Systematic identification of arsenic-binding proteins reveals that hexokinase-2 is inhibited by arsenic. Proc Natl Acad Sci U S A. 2015;112:15084-9
8. Yang L, Wang J, Li J, Zhang H, Guo S, Yan M. et al. Identification of serum biomarkers for gastric cancer diagnosis using a human proteome microarray. Mol Cell Proteomics. 2015;15:614-23
9. Wang D, Yang L, Zhang P, LaBaer J, Hermjakob H, Li D. et al. AAgAtlas 1.0: a human autoantigen database. Nucleic Acids Res. 2016 doi: 10.1093/nar/gkw946
10. Yu X, Petritis B, LaBaer J. Advancing translational research with next-generation protein microarrays. Proteomics. 2016;16:1238-50
11. Diez P, Gonzalez-Gonzalez M, Lourido L, Degano RM, Ibarrola N, Casado-Vela J. et al. NAPPA as a Real New Method for Protein Microarray Generation. Microarrays. 2015;4:214-27
12. Lee JR, Magee DM, Gaster RS, LaBaer J, Wang SX. Emerging protein array technologies for proteomics. Expert Rev Proteomics. 2013;10:65-75
13. Anderson KS, Sibani S, Wallstrom G, Qiu J, Mendoza EA, Raphael J. et al. Protein microarray signature of autoantibody biomarkers for the early detection of breast cancer. J Proteome Res. 2011;10:85-96
14. Henderson MC, Hollingsworth AB, Gordon K, Silver M, Mulpuri R, Letsios E. et al. Integration of Serum Protein Biomarker and Tumor Associated Autoantibody Expression Data Increases the Ability of a Blood-Based Proteomic Assay to Identify Breast Cancer. PLoS One. 2016;11:e0157692
15. Ayoglu B, Mitsios N, Kockum I, Khademi M, Zandian A, Sjoberg R. et al. Anoctamin 2 identified as an autoimmune target in multiple sclerosis. Proc Natl Acad Sci U S A. 2016;113:2188-93
16. Yu X, Petritis B, LaBaer J. Advancing translational research with next generation protein microarrays. Proteomics. 2016;16:1238-50
17. Song L, Wallstrom G, Yu X, Hopper M, Van Duine J, Steel J. et al. Identification of antibody targets for tuberculosis serology using high-density nucleic acid programmable protein arrays. Mol Cell Proteomics. 2017
18. Yu X, LaBaer J. High-throughput identification of proteins with AMPylation using self-assembled human protein (NAPPA) microarrays. Nat Protoc. 2015;10:756-67
19. Wang J, Figueroa JD, Wallstrom G, Barker K, Park JG, Demirkan G. et al. Plasma Autoantibodies Associated with Basal-like Breast Cancers. Cancer Epidemiol Biomarkers Prev. 2015;24:1332-40
20. Bian X, Wallstrom G, Davis A, Wang J, Park J, Throop A. et al. Immunoproteomic Profiling of Anti-Viral Antibodies in New-Onset Type 1 Diabetes Using Protein Arrays. Diabetes. 2015
21. Takulapalli BR, Qiu J, Magee DM, Kahn P, Brunner A, Barker K. et al. High density diffusion-free nanowell arrays. J Proteome Res. 2012;11:4382-91
22. He M, Taussig MJ. Single step generation of protein arrays from DNA by cell-free expression and in situ immobilisation (PISA method). Nucleic Acids Res. 2001;29:E73-3
23. Schmidt R, Cook EA, Kastelic D, Taussig MJ, Stoevesandt O. Optimised 'on demand' protein arraying from DNA by cell free expression with the 'DNA to Protein Array' (DAPA) technology. J Proteomics. 2013;88:141-8
24. Stoevesandt O, Vetter M, Kastelic D, Palmer EA, He M, Taussig MJ. Cell free expression put on the spot: advances in repeatable protein arraying from DNA (DAPA). N Biotechnol. 2011;28:282-90
25. He M, Stoevesandt O, Palmer EA, Khan F, Ericsson O, Taussig MJ. Printing protein arrays from DNA arrays. Nat Methods. 2008;5:175-7
26. Ramachandran N, Raphael JV, Hainsworth E, Demirkan G, Fuentes MG, Rolfs A. et al. Next-generation high-density self-assembling functional protein arrays. Nat Methods. 2008;5:535-8
27. Ramachandran N, Hainsworth E, Bhullar B, Eisenstein S, Rosen B, Lau AY. et al. Self-assembling protein microarrays. Science. 2004;305:86-90
28. Yazaki J, Galli M, Kim AY, Nito K, Aleman F, Chang KN. et al. Mapping transcription factor interactome networks using HaloTag protein arrays. Proc Natl Acad Sci U S A. 2016;113:E4238-47
29. Tao SC, Zhu H. Protein chip fabrication by capture of nascent polypeptides. Nat Biotechnol. 2006;24:1253-4
30. Yu X, Woolery AR, Luong P, Hao YH, Grammel M, Westcott N. et al. Copper-catalyzed azide-alkyne cycloaddition (click chemistry)-based detection of global pathogen-host AMPylation on self-assembled human protein microarrays. Mol Cell Proteomics. 2014;13:3164-76
31. Angenendt P, Nyarsik L, Szaflarski W, Glokler J, Nierhaus KH, Lehrach H. et al. Cell-free protein expression and functional assay in nanowell chip format. Anal Chem. 2004;76:1844-9
32. Prados-Rosales R, Carreno LJ, Batista-Gonzalez A, Baena A, Venkataswamy MM, Xu J. et al. Mycobacterial membrane vesicles administered systemically in mice induce a protective immune response to surface compartments of Mycobacterium tuberculosis. mBio. 2014;5:e01921-14
33. Yu X, Decker KB, Barker K, Neunuebel MR, Saul J, Graves M. et al. Host-pathogen interaction profiling using self-assembling human protein arrays. J Proteome Res. 2015;14:1920-36
34. Shannon P, Markiel A, Ozier O, Baliga NS, Wang JT, Ramage D. et al. Cytoscape: a software environment for integrated models of biomolecular interaction networks. Genome Res. 2003;13:2498-504
35. Yazaki J, Galli M, Kim AY, Nito K, Aleman F, Chang KN. et al. Mapping transcription factor interactome networks using HaloTag protein arrays. Proc Natl Acad Sci U S A. 2016
36. Anderson KS, Cramer DW, Sibani S, Wallstrom G, Wong J, Park J. et al. Autoantibody signature for the serologic detection of ovarian cancer. J Proteome Res. 2015;14:578-86
37. Kunnath-Velayudhan S, Salamon H, Wang HY, Davidow AL, Molina DM, Huynh VT. et al. Dynamic antibody responses to the Mycobacterium tuberculosis proteome. Proc Natl Acad Sci U S A. 2010;107:14703-8
38. White EA, Sowa ME, Tan MJ, Jeudy S, Hayes SD, Santha S. et al. Systematic identification of interactions between host cell proteins and E7 oncoproteins from diverse human papillomaviruses. Proc Natl Acad Sci U S A. 2012;109:E260-7
39. Ciccolini F, Di Pasquale G, Carlotti F, Crawford L, Tommasino M. Functional studies of E7 proteins from different HPV types. Oncogene. 1994;9:2633-8
40. Chellappan S, Kraus VB, Kroger B, Munger K, Howley PM, Phelps WC. et al. Adenovirus E1A, simian virus 40 tumor antigen, and human papillomavirus E7 protein share the capacity to disrupt the interaction between transcription factor E2F and the retinoblastoma gene product. Proc Natl Acad Sci U S A. 1992;89:4549-53
41. Bian X, Wiktor P, Kahn P, Brunner A, Khela A, Karthikeyan K. et al. Antiviral antibody profiling by high-density protein arrays. Proteomics. 2015;15:2136-45
42. Karthikeyan K, Barker K, Tang Y, Kahn P, Wiktor P, Brunner A. et al. A contra capture protein array platform for studying post-translationally modified auto-antigenomes. Mol Cell Proteomics. 2016;15:2324-37
43. Yu X, Bian X, Throop A, Song L, Moral LD, Park J. et al. Exploration of panviral proteome: high-throughput cloning and functional implications in virus-host interactions. Theranostics. 2014;4:808-22
44. Miersch S, Bian X, Wallstrom G, Sibani S, Logvinenko T, Wasserfall CH. et al. Serological autoantibody profiling of type 1 diabetes by protein arrays. J Proteomics. 2013
45. Deng J, Bi L, Zhou L, Guo SJ, Fleming J, Jiang HW. et al. Mycobacterium tuberculosis proteome microarray for global studies of protein function and immunogenicity. Cell Rep. 2014;9:2317-29
46. Patwa TH, Li C, Poisson LM, Kim HY, Pal M, Ghosh D. et al. The identification of phosphoglycerate kinase-1 and histone H4 autoantibodies in pancreatic cancer patient serum using a natural protein microarray. Electrophoresis. 2009;30:2215-26
47. Qiu J, Madoz-Gurpide J, Misek DE, Kuick R, Brenner DE, Michailidis G. et al. Development of natural protein microarrays for diagnosing cancer based on an antibody response to tumor antigens. J Proteome Res. 2004;3:261-7
Author contact
![]() Corresponding author: X.Y. (yuxiaoboncpsb.org) and J.L. (Joshua.Labaeredu)
Corresponding author: X.Y. (yuxiaoboncpsb.org) and J.L. (Joshua.Labaeredu)